Abstract
Compression combustion engines are a source of air pollutants such as HC and Co, but are still widely used throughout the world. The use of renewable fuels such as ethanol, which is a low-carbon fuel, can reduce the emission of these harmful gases from the engine. A fundamental analysis is proposed in this research to experimentally examine the emission characteristics of diesel–ethanol fuel blends. Furthermore, a multi-objective genetic algorithm (e-MOGA) was developed based on the experimental data obtained to fine the most effective or Pareto set of engine emission and performance optimization solutions. So, the optimization problem had two inputs and seven objectives. For this purpose, input variables for the search space were S (rpm) varied in the range of (1600–2000) and E (%) varied in the range of (0–12). These design variables were chosen to be varied in a prespecified range with a lower and upper band as same as experimental conditions. A diesel engine using (DE2, DE4, DE6, DE8, DE10, and DE12) diesel–ethanol fuel blends, at the various speed of 1600 to 2000 rpm, was utilized for the experiment. The findings showed that the use of diesel–ethanol fuel blends decreased the concentration of CO and HC emissions by 3.2–30.6% and 7.01–16.25%, respectively, due to the high oxygen content of ethanol. As opposed to CO and HC emissions, the NOx concentration showed an increase of 7.5–19.6%. This increase was attributed to the high combustion quality in the combustion chamber, which resulted in a higher combustion chamber temperature. The optimization results confirmed that the shape of the Pareto front obtained from multi-objective ϵ-Pareto optimization could be convex, concave, or a combination of both. A new parameter was introduced as emission index or EI for selection of the best solution among the Pareto set of solutions. This parameter had a minimum value of 4.61. The variables levels for this optimum solution were as follows: engine speed = 1977 rpm, ethanol blend ratio = 10%, CO = 0.27%, CO2 = 6.81%, HC = 3 ppm, NOx = 1573 ppm, SFC = 239 g/kW·h, P = 56 kW, and T = 269.9 N·m. The EI index had a maximum value of 8.26. Conclusively, we can say that the optimization algorithm was successful in minimizing emission index for all ethanol blend ratios, especially at higher engine speeds.
1. Introduction
The growing world population and fossil fuel consumption result in a steep rise in energy demand. When population grows and living conditions rise, there is increasing fear that there will be energy shortages to power the vehicles [1]. Due to environmental considerations and the increase of petrol prices, many investigators are now trying to discover renewable sources that could replace fossil fuels [2]. The use of renewable fuels such as ethanol, which is a low-carbon fuel, can reduce CO2 as well as greenhouse gas emissions from the engine [3]. Due to the fact that alcoholic fuels contain oxygen and can be produced sustainably, they can be considered as an alternative fuel to biofuels even in compression combustion engines [4].
The prominent drivability and economic efficiency make diesel engines extensively employed in many applications such as automobile propulsion source, engineering machinery for technical purposes, and ship power requirement. It has been a major objective in the development of diesel engines to reduce emissions. Alternative energies are sustainable, safer and more efficient than traditional fuels [5]. Biofuels seem to be a great replacement for fossil fuels, which are always accompanied by environmental, economic, and stability issues. Here, biofuel is referred to as any liquid fuel produced from plant materials and utilized as a replacement for petroleum. Biofuels such as ethanol–diesel, are considered to be optimum alternative fuels for SI and CI engines because these fuels are renewable [6].
Since the late 1970s, the use of ethanol as a fuel has increased. This was first used as an alternative for fuel due to oil shortages [7].
The current method of massive production of fuel ethanol in which the sugar and starch grains are used as the main raw material is not favorable because they are considered as the main food resources. Biomasses like agricultural residues (rice, corn, wheat straw), woody biomass, industrial (waste from potato factories), and municipal solid waste algae are potential bioethanol production resources worldwide [8].
Many studies in the 1980s revealed that ethanol–diesel blends are suitable for the current diesel engine. The high cost of ethanol development suggested that it is only usable when there is a shortage of fuel [7].
Some reasons for increased production and use of ethanol include:
- Ethanol decreases the country reliance on imported oil, decreasing the trade deficit and ensuring a stable supply of fuel in the event that international supplies are cut.
- Farmers are seeing increased demand for grain that is helping to support prices.
- The reduction emissions of carbon monoxide cause to improve the quality of environment.
- Car owners benefit from improved gasoline octane, which eliminates “knock” or “pinging” engines.
Ethanol-mixed fuels also remove moisture and clean up the fuel system. The aim of employing ethanol as a part of gasoline blending is to reduce imports of fossil fuels by 10–15%. Another advantage of the employment of ethanol is the improvement of the domestic agricultural market [9].
Wu et al. (2020) [10] studied how the emission and combustion of diesel engines are affected by various variables, such as TFH and ethanol levels in diesel fuel (Tetrahydrofuran–ethanol–diesel blends) and ethanol. They concluded that NOx emissions are increased by using TFH or 30% ethanol, while using 10% ethanol reduces NOx emissions. Using TFH or ethanol raises the emissions of Co and HC substantially.
By using E85 and diesel fuels under different load conditions, Sajovaara and his colleagues [11] studied dual-fuel combustion and stated that an improvement in the E85 ratio caused NOx emissions to decrease.
In Di Blasio et al. (2013) [12], characteristics of a mixture of glycerol-based ethers usable in a compression ignition engine, in terms of efficiency and emissions, were investigated. The test methodology considers the comparison among three fuel blends: (1) a mixture consisting of 90% v/v diesel and 10% v/v of GEM; (2) a blend consisting of 80% v/v diesel and 20% v/v of GEM; and (3) a reference diesel. The results have shown the possibility to burn the diesel/GEM blends without significant impact on combustion characteristics and efficiencies while, due to the oxygen content of the GEM, important benefits are obtained in terms of NOx-PM trade-offs and emission particles at the exhaust.
It can be inferred from previous studies that the performance of the diesel engine and exhaust emissions are affected by ethanol–diesel blends. So, in this research diesel–ethanol fuel blends are considered for evaluation of performance and exhaust emission of a diesel engine.
Reduction in environmental emissions and at the same time maximizing engine output power using alternative fuels have undergone significant improvement over the past decades [13]. In the literature based on improving the efficiency of diesel engines, many attempts can be found [14]. Navid et al. compared multi-objective non-evolutionary and evolutionary genetic algorithm optimization of a DI diesel engine performance [15]. They reported that the non-evolutionary method could reach global optima faster (at run 41) compared to genetic algorithm (at run 84). The combined effect of the fuel injection timing, the percentage of EGR and the fuel injection pressure on the NOx emission of a diesel-fueled stationary diesel engine were examined [16]. In the optimum results obtained by Multi response optimization, a decrease in NOx emissions was seen with a minimum increase in the concentration of smoke. With a 5.5% increase in smoke concentration and a 2.2% decrease in brake fuel conversion performance, this combination decreases NOx by 15% compared to standard operating conditions. Research has been carried out to achieve the optimum biodiesel ratio, which is followed by lower emissions, acceptable fuel efficiency, and a wide operating range of engines.
First of all, the main emissions of the six-cylinder diesel engine—which are carbon monoxide (CO), nitrogen oxides (NOx), and unburned hydrocarbons (HC)—and performance parameters of the specific fuel consumption (SFC), engine brake power (P), and engine torque (T) were tested experimentally in this study. The input or independent variables were engine speed or S (1600, 1700, 1800, 1900, and 2000 rpm) and different levels of ethanol–diesel blend volumetric ratios or E (0%, 2%, 4%, 6%, 8%, 10%, and 12%). Then a proper epsilon Pareto Multi-objective genetic algorithm (e-MOGA) was developed to find a global optimum or the efficient solution or the Pareto solution with the best engine performance and least emissions. So, the optimization problem had two inputs and seven objectives. For this purpose, input variables for the search space were S (rpm) varied in the range of (1600 2000) and E (%) varied in the range of (0 12). These design variables were chosen to be varied in a prespecified range with a lower and upper band as same as experimental conditions. The objective functions were surfaces obtained from fitting three-degree polynomials when output variables were a function of S and E; these output variables were CO (%), CO2 (%), HC (ppm), NOx (ppm), SFC 9 g/kW·h), P (kW), and T (N·m). This study demonstrated the remarkable potential of the Pareto optimization concept for reducing emissions and finding best working conditions for possible applications of blended ethanol–diesel fuel in IC engines as well as its performance analysis.
2. Materials and Methods
2.1. Test Fuels
Ethanol can generally be mixed with diesel without any engine modification needed [9]. The bioethanol used in this work was from molasses of cane with purity 99.6%. The bioethanol was blended with the diesel fuel at blend ratios of 0/100, 2/98, 4/96, 6/94, 8/92, 10/90, and 12/88 by volume respectively, which were named as DE0, DE2, DE4, DE6, DE8, DE10, and DE12.
2.2. The Experimental Study
A PERKINS A63544 diesel engine was utilized in the experiment. It has a volume of 5800 cm3, and consists of six cylinders and a water-cooled system.
The measurement of the emissions of CO, HC, and NOx from the engine was performed employing the exhaust gas analyzer (model is MAHA MGT5, made by German company MAHA). The test set up is schematically shown in Figure 1.
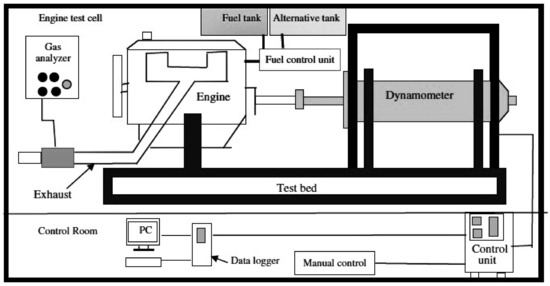
Figure 1.
Experimental test set up.
The fuel system in a PERKINS A63544 diesel engine operates in such a way that first the diesel is taken from the tank by an electric pump and after passing through the filter, it enters the high pressure pump. This pump, which draws its power from the valve shaft, greatly increases the fuel pressure and compresses it into the fuel rail. This rail is common to all cylinders and all injectors branch to this rail. The injectors are mechanical-electromagnetic and operate at the command of the motor control unit. When fuel injection is to be done by rotating the valve stem and reaching the valve stem cam to the injector seat and compressing, this seat is continued by rotating the valve. The fuel enters the injector control valve and provides the best conditions for excellent combustion compared to engine, vehicle, and environmental conditions by precisely adjusting the pressure and injection time at the beginning and end and during injection.
Experiments were performed at steady states for five different speeds (1600, 1700, 1800, 1900, and 2000 rpm). During the test, all the gaseous emissions were monitored and reported constantly. The experiment was divided into two stages: operating the engine with (1) the diesel and (2) the blends. The regulated emission of unburned hydrocarbon (UHC), nitrogen oxide (NOX), and carbon monoxide (CO) as well as carbon dioxide (CO2) concentration in the exhaust gas were investigated and compared using diesel–ethanol fuel blends and diesel fuel.
2.3. Epsilon Pareto Multi-Objective Optimization Using Genetic Algorithm (e-MOGA)
The main objective of the current research is to enhance the performance of the engine (SFC minimization, maximization of P and T) and the reduction of emissions (minimization of CO, CO2, HC, and NOx). A Multi-objective Genetic Algorithm (MOGA) comprising of two inputs and seven objectives was used. For this purpose, input variables for the search space were S (rpm) varied in the range of (1600 2000) and E (%) varied in the range of (0–12). The objective functions were surfaces obtained from fitting three-degree polynomials when output variables were a function of S and E; these output variables were CO (%), CO2 (%), HC (ppm), NOx (ppm), SFC 9 g/kW·h), P (kW), and T (N·m). To achieve the global minimum or the Pareto solution for all objectives, all objective functions would need to be a minimization problem. To do this, the reverse values of P and T (1/P and 1/T) were used, but the results were reported as P and T. The general form of the objective function is presented in Equation (1) shown below:
where is the kth Objective function, in this study they are (CO (θ), CO2 (θ), HC (θ), NOx (θ), SFC (θ), 1/P (θ), 1/T (θ)), and θ is a set of design variables, each varies in a different range prespecified with lower and upper levels. In this research, these variables are θ = {S, E} and their ranges are reported in Table 1. To use MOGA, the objective functions, were determined using the experimental results and a suitable curve fitting approach in MATLAB software (developed by MathWorks, University of New Mexico, Albuquerque, NM, USA). The input variables were engine speed (S) and ethanol blend ratio (E), while the outputs were CO, CO2, HC, NOX, SFC, P, and T. The fit type was set to be polynomial with a degree of three for all models. As a result, seven different surfaces, were obtained to be used in the optimization process. The algorithm parameters are given in Table 1.

Table 1.
e-MOGA parameters and setup values for engine performance optimization.
We used the MOGA algorithm in this research to find the optimal set of objectives of Pareto. This way, we would have a ϵ-MOGA problem that would find the best solution among the obtained set of optimum solutions. In other words, the Pareto solution set does not have a member that dominates other members or solutions in the set. Pareto dominance is defined as: A solution θ1 dominates other solution θ2 or , if and only if for the objective function of Fk(θ):
We denote this solution as the best solution in a multi-objective genetic algorithm [17,18]. Figure 2 shows the MOGA algorithm used in this research and its steps.
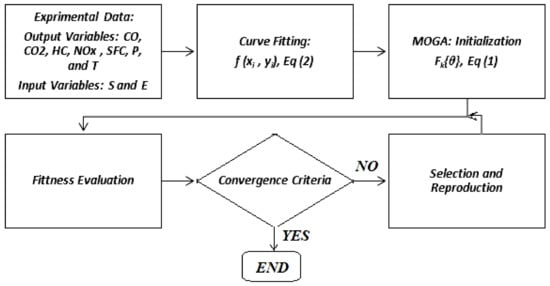
Figure 2.
Flowchart of the optimization process.
3. Results
3.1. Properties of Test Fuels
The fuels used in this study include diesel and ethanol. The major properties of these fuels are shown in Table 2.

Table 2.
Properties of diesel and ethanol.
Some important properties of diesel–ethanol fuel blends were measured. These are summarized in Table 3.

Table 3.
Properties of testing fuel blends.
3.2. Effect of Diesel–Ethanol Fuel Blends on Engine Performance
Figure 3, Figure 4 and Figure 5, respectively, display the engine power, torque, and specific fuel consumption (SFC) test results using diesel–ethanol fuel blends and conventional diesel. Figure 3 shows the average engine power at all speeds.
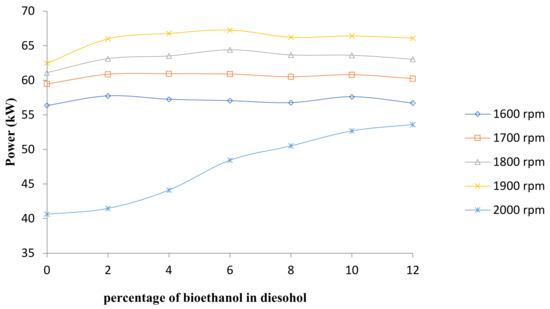
Figure 3.
Comparison of engine power.
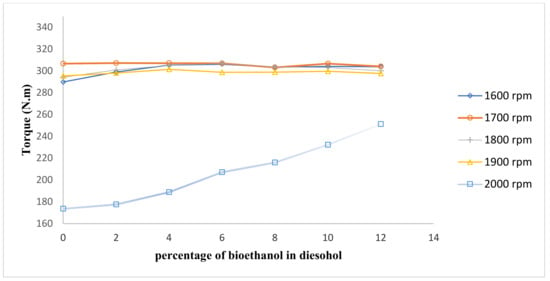
Figure 4.
Comparison of engine torque.
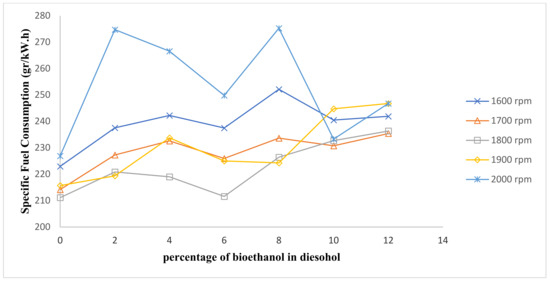
Figure 5.
Comparison of fuel consumption.
The finding showed that the maximum power and torque of diesel–ethanol fuel blends is 67.26 kW at 1900 rpm and 307.17 N·m at 1700 rpm, respectively. The engine torque and power show a slight rise when bioethanol percentage is increased; this is because of good combustion of ethanol due to the high oxygen content, which could improve combustion [19,20,21,22]. The molecular formula of ethanol is C2H5OH, which is an oxygenated hydrocarbon. It indicates that it contains oxygen, which results in improving combustion.
Due to the lower calorific value of bioethanol relative to conventional diesel fuel, the specific fuel consumption increases with an increase of bioethanol in diesel–ethanol fuel blends in comparison with net diesel fuel [23]. More fuel volume reaches the combustion chamber and induces an increased rate of specific fuel consumption when diesel–ethanol fuel blends are used [24].
3.3. Effect of Diesel–Ethanol Fuel Blends on Engine Exhaust Emissions
3.3.1. UHC Emission
The unburned hydrocarbon (UHC) emissions determined for the test engine are shown in Figure 6 for diesel fuel and diesel–ethanol fuel blends at various engine speeds and Figure 7 shows the average changes in UHC concentration at all speeds. Hydrocarbons are molecules in the fuel that remain unchanged as a result of being unburned or incomplete combustion and leaving the exhaust. Hydrocarbons produce near-surface ozone in the presence of sunlight and nitrogen oxides, which are important contributors to the formation of smog. The HC emissions are primarily a result of insufficient temperature that occur near the cylinder wall and availability of oxygen in combustion chamber [25].
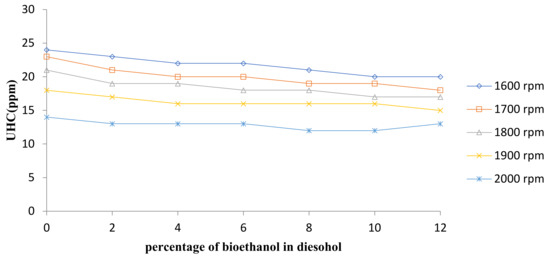
Figure 6.
Comparison of UHC emission.
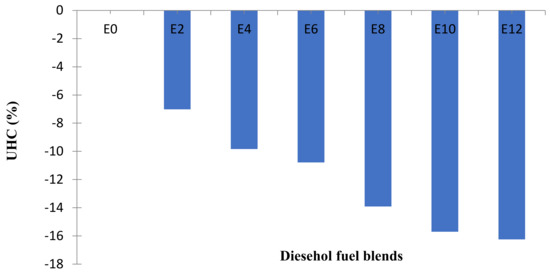
Figure 7.
Average changes of UHC emission at all speeds.
The curves illustrate that with an increase in the percentage of bioethanol in the blends, the HC concentration in the emission tends to reduce. The use of diesel–ethanol fuel blends in diesel engines results in more complete combustion and thereby decreases the concentration of UHC in the gas emission. This is because, in the molecular structure, the bioethanol consists of oxygen and accordingly needs fewer oxygen molecules to complete the combustion. Researchers have also reported some similar trends for diesel–ethanol blends [26,27,28].
3.3.2. NOx Emission
NOX emissions for the present research work are also shown in Figure 8 for diesel fuel and diesel–ethanol fuel blends and Figure 9 shows average changes in NOX concentration at all speeds. The formation of NOx strongly relies on the temperatures of the combustion chamber and the concentration of oxygen.
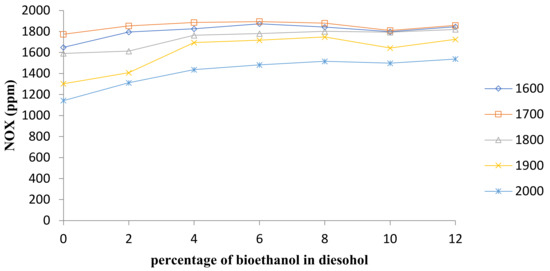
Figure 8.
Comparison of NOx emission.
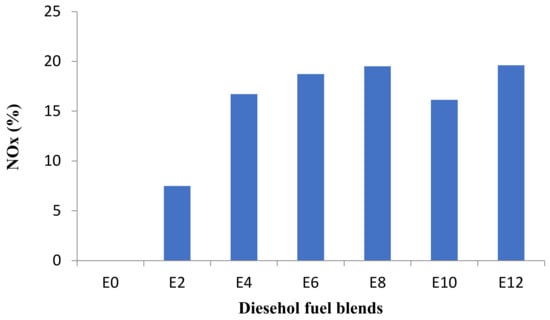
Figure 9.
Average changes of NOx emission at all speeds.
Increasing the percentage of bioethanol in diesel–ethanol fuel blends raises NOX emissions, as seen in Figure 8 and Figure 9. This increase was attributed to the high combustion quality in the combustion chamber, which resulted in a higher combustion chamber temperature [8]. It has also been documented in most previous research sources that NOX emissions increase through the use of ethanol–diesel blends [28,29,30].
3.3.3. CO Emission
The CO emissions for diesel and diesel–ethanol fuel blends are shown in Figure 10 and Figure 11 shows average changes in CO concentration at all speeds. Carbon monoxide is caused by incomplete combustion, and when the oxidation process does not occur completely, the product becomes carbon monoxide instead of carbon dioxide.
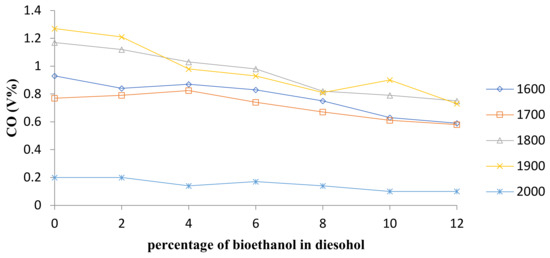
Figure 10.
Comparison of CO emission.
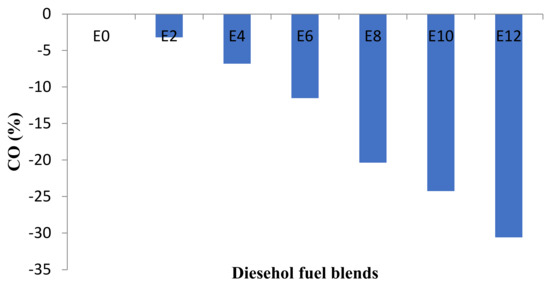
Figure 11.
Average changes of CO emission at all speeds.
The curves trend shows that when the percentage of bioethanol increases, the amount of CO decreases. The reason is because bioethanol contains oxygen in its molecular structure and they, therefore, require fewer oxygen molecules to complete the combustion [21]. Studies have shown that the percentage of CO concentration in the emissions is decreased as the percentage of bioethanol in the blends is increased [24,27,28,31,32,33]. This trend is caused by lower carbon content in bioethanol than in diesel fuel. Furthermore, ethanol–diesel fuel blends would help to increase the oxygen-to-fuel ratio in the fuel-rich region that causes complete combustion and would also reduce CO concentration.
3.3.4. CO2 Emission
Figure 12 shows CO2 emissions for diesel and diesel–ethanol fuel blends and Figure 13 shows average CO2 concentration shifts at all engine speeds.
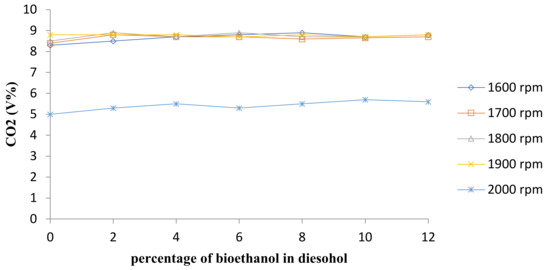
Figure 12.
Comparison of CO2 emission.
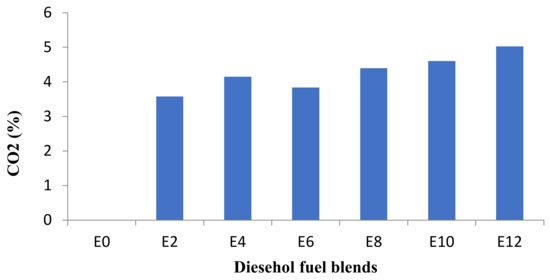
Figure 13.
Average changes of CO2 emission at all speeds.
While Carbon Dioxide (CO2) emission released from combustion engine fuels is not a harmful agent for public health itself, it plays an important role in global climate change. Figure 11 and Figure 12 show that the increase in CO2 concentration is followed by the bioethanol percentage growth. The CO2 emission relies on the relative air–fuel ratio and CO emission concentration [20]. Increasing ethanol percentages causes lean burning, and consequently, the increase in CO2 emission due to the improved combustion [19,20,21,22].
3.4. Results of Optimization Using Epsilon Pareto Multi-Objective Genetic Algorithm (e-MOGA)
To optimize the engine performance, first, a set of objective functions were obtained using a curve fitting toolbox in MATLAB. The fitted polynomial degree was three for all output variables. Input variables are engine speed presented as S or x, and Ethanol blend ratio as E or y. The output variables or objectives were CO, CO2, HC, NOX, SFC, P, and T presented as f (x, y). These functions and their coefficients are presented in Table A1 (Appendix A) and the fitted surface can be seen in Figure 14 and Figure 15. As this table shows, all of the obtained models have an adjusted R-square of more than 0.93, except for the SFC, whose R-square value is 0.724. In multi-objective optimization, these experimental models are used as objective functions.
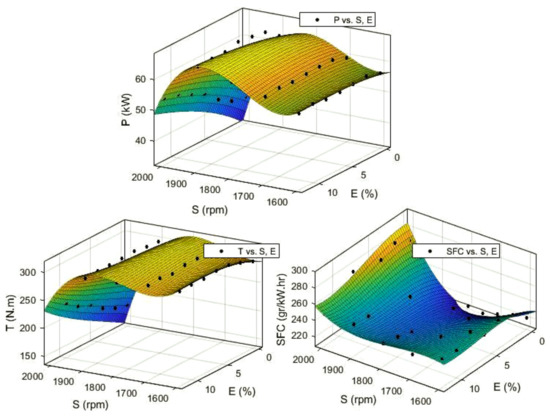
Figure 14.
The objective function obtained from experimental data for engine power (P), Torque (T), and specific fuel consumption (SFC) as a function of engine speed (S) and Ethanol blend ratio (E).
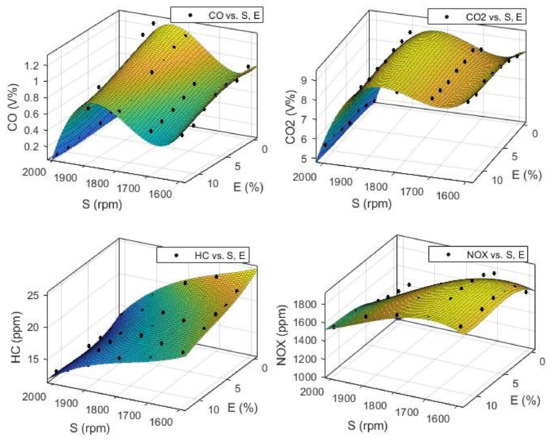
Figure 15.
The objective function obtained from experimental data for engine emissions CO, CO2, HC, and NOx as a function of engine speed (S) and Ethanol blend ratio (E).
As explained in Section 2.3, a multi-objective genetic algorithm was developed in MATLAB software to find an efficient solution or an ϵ-Pareto solution that maximizes the P and T and simultaneously minimizes the CO, CO2, HC, NOX, and SFC. The input variables, their lower and upper bounds, and MOGA setup and specification were given in Table 1. The set of best solutions or efficient solutions and the corresponding Pareto front obtained using curve fitting are presented in Figure 16, Figure 17, Figure 18, Figure 19 and Figure 20; additionally, detailed results are given in Table 4. It illustrates the efficient solution and the Pareto set for the best 40 solutions, but the real Pareto front comprises 200 obtained solutions which represent the imaginary Pareto front in engine performance optimization.
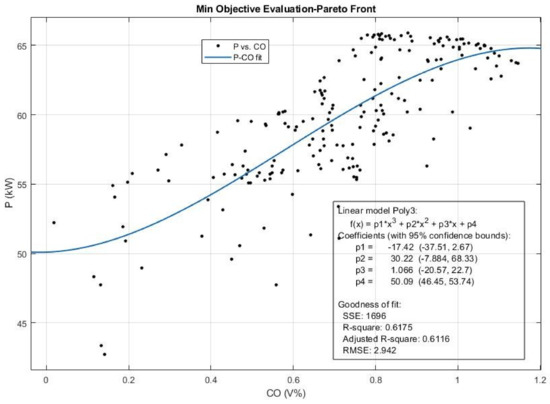
Figure 16.
The Pareto front and the efficient solution set obtained for Power (P) and CO emission from multi-objective Pareto optimization of the engine performance.
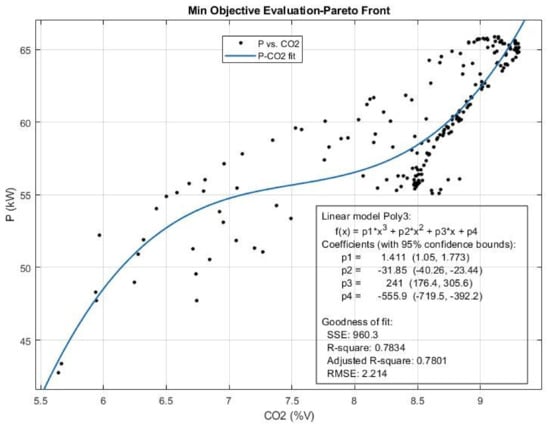
Figure 17.
The Pareto front and the efficient solution set obtained for Power (P) and CO2 emission from multi-objective Pareto optimization of the engine performance.
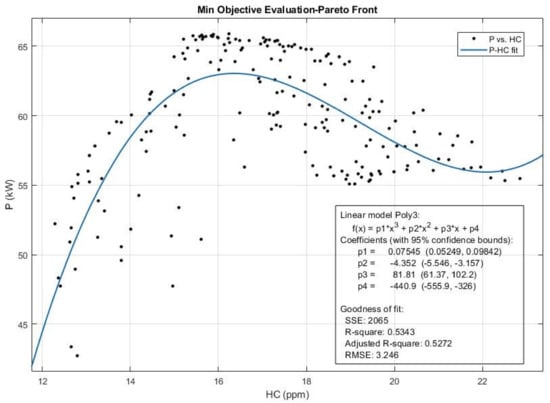
Figure 18.
The Pareto front and the efficient solution set obtained for Power (P) and HC emission from multi-objective Pareto optimization of the engine performance.
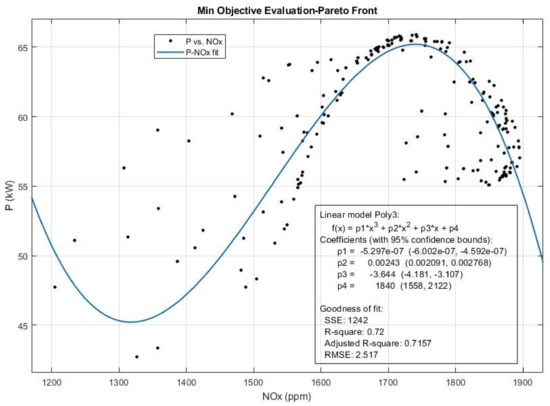
Figure 19.
The Pareto front and the efficient solution set obtained for Power (P) and NOx emission from multi-objective Pareto optimization of the engine performance.
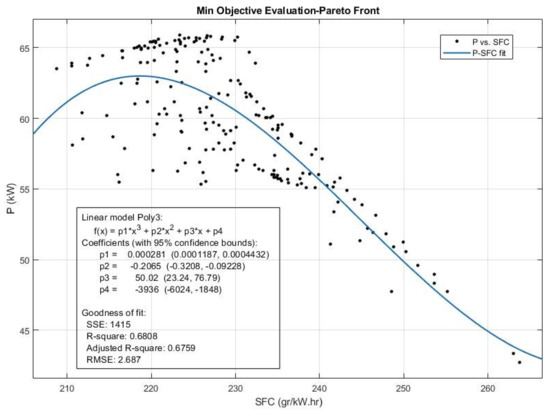
Figure 20.
The Pareto front and the efficient solution set obtained for Power (P) and SFC emission from multi-objective Pareto optimization of the engine performance.

Table 4.
The results of a Pareto multi-objective optimization (MOGA) of the engine performance.
According to Table 4, the best solution or the most efficient solution is the first row, which ranked first in ϵ-MOGA where the S value was 1665.59 rpm and E was 1.07%. The variables levels for this solution were: CO = 0.76%, CO2 = 8.35%, HC = 21.96 ppm, NOx = 1787.17 ppm, SFC = 220.22 g/kW·h, P = 56.30 kW, and T = 310.59 N·m.
All the solutions in Table 4 can be regarded as efficient solutions. However, one could choose among this Pareto set of solutions based on the importance of input variables or their limitations. For example, the efficient solution should be able to reduce the emissions at higher engine speeds (real IC engines applications); on the other hand, for fuel economy and environmental purposes, we could search for solutions with higher ethanol blend ratio and lower emissions. In addition, the efficient solution can be the solution among the Pareto set (Table 4) for which the emissions and fuel consumption are lower and the Power and torque would have their maximum value. It can be seen that we need a tradeoff between these variables.
Figure 16, Figure 17, Figure 18, Figure 19, Figure 20, Figure 21 and Figure 22 show that the shape of the Pareto front obtained from multi-objective ϵ-Pareto optimization of engine performance could be convex, concave, or a combination of both. According to these figures, in this study, because the Pareto front could not be considered as a convex plot for all the desired range, we cannot find an efficient solution for some weight vector of “w” that at the same time satisfies our set of objectives. To overcome this situation and find a way for decision making, we could introduce another parameter to represent the emissions objectives altogether. We name this parameter as emission index (EI) and it would be the sum of values of emissions for each solution minus the minimum value of that emission objective. This way, we would search for a minimum value while it is normalizing for each objective, because the objectives’ units are different. Now, we could search for the solution with minimum EI value, while input variables and other performance objectives would have their importance as before. All the emission objectives are considered to have the same weight, so, the output of this linear scalarization is represented as:
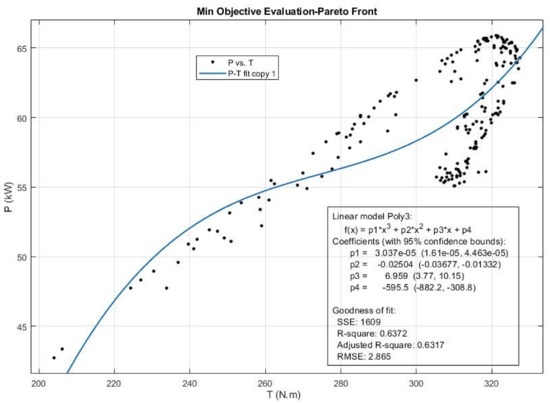
Figure 21.
The Pareto front and the efficient solution set obtained for Power (P) and T emission from multi-objective Pareto optimization of the engine performance.
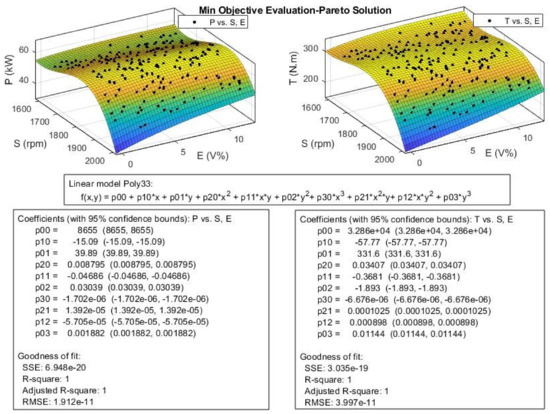
Figure 22.
The efficient or Pareto solution obtained for engine Power (P) and Toque (T) from multi-objective Pareto optimization.
Where m is the number of emission objectives and here m = 4 because we have four objectives of (CO, CO2, HC, NOx); further, n is the number of solutions in the Pareto set and in this study n = 200 and has the Pareto solution. The results of calculated EI are presented in a new column in Table 4. Of course, one can choose different weights to emphasize or prioritize some objectives over others. As Table 4 shows for EI values, this parameter has its minimum in solution with the rank 21, and its value is 4.61. The variables values for this optimum solution were S = 1977.70 rpm, E = 10.03%, CO = 0.27%, CO2 = 6.81%, HC = 3.04 ppm, NOx = 1573.00 ppm, SFC = 239.88 g/kW·h, P = 56.02 kW, T = 269.91 N·m, and EI = 4.61. The EI index has its maximum in solution number 13 with a value of 8.26.
It is obvious in Table 4 that the engine power and torque would have their maximum values (65.50 kW and 318.90 N·m) in solution rank number of 24. For this solution set, the variables values were obtained to be S = 1868.89 rpm, E = 5.88%, CO = 0.96%, CO2 = 9.16%, HC = 16.40 ppm, NOx = 1718.71 ppm, SFC = 223.81 g/kW·h, and EI = 7.61.
The maximum value for optimum ethanol blend ratio was obtained to be E = 11.17%, and it was for a solution with the rank numbers of 20. Other variables in this solution set were S = 1785.93 rpm, CO = 0.68%, CO2 = 9.04%, HC = 16.91 ppm, NOx = 1825.84 ppm, SFC = 230.35 g/kW·h, P = 62.66 kW, T = 318.57 N·m, and EI = 7.67.
The least amount of NOx emission seen in Table 4 is 1357.92 ppm with the solution rank number of 32; the variables in this solution set were S = 1911.32 rpm, E = 0.30%, CO = 1.03%, CO2 = 8.48%, HC = 17.21 ppm, SFC = 223.61 g/kW·h, P = 53.86 kW, T = 253.55 N·m, and EI = 4.77.
Figure 22, Figure 23, Figure 24, Figure 25 and Figure 26 show the surface model obtained from using curve fitting and the Pareto set of solutions in Table 4. In all models, the fitted curve was of type polynomial with the degree of three. The obtained models could be used as a predictor tool to find the optimum set of variables for which a diesel engine with the specific parameters tested in this research would have efficient performance.
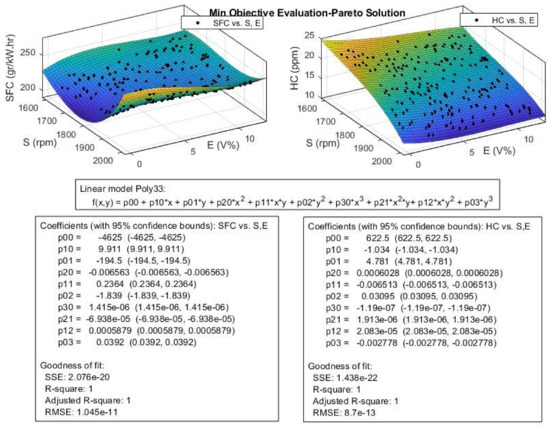
Figure 23.
The efficient or Pareto solution obtained for engine SFC and HC from multi-objective Pareto optimization.
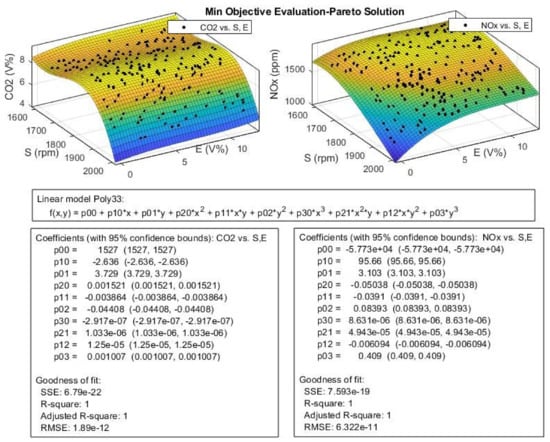
Figure 24.
The efficient or Pareto solution obtained for CO2 and NOx from multi-objective Pareto optimization.
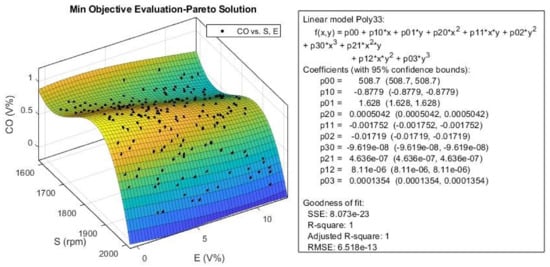
Figure 25.
The efficient or Pareto solution obtained for CO from multi-objective Pareto optimization.
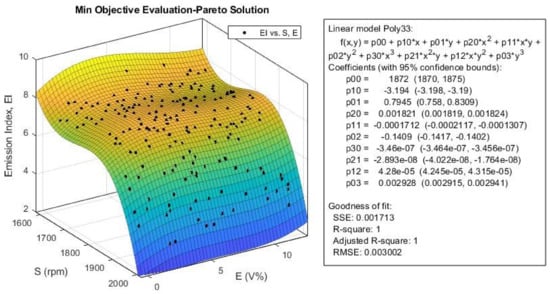
Figure 26.
The emission index obtained (Equation (4)) for multi-objective Pareto optimization of engine optimization.
As Figure 22 shows for P and T, their values increase with engine speed until it reaches maximum around 1800 rpm and then the values decrease rapidly. P and T values increase with ethanol blend ratio, and this effect is more observable at higher engine speeds. In other words, the engine speed is the dominant factor compared to ethanol blend ratio in engine P and T, especially at lower engine speeds.
According to Figure 23, the SFC values decrease with increasing engine speed until it reaches the speed around 1800 rpm, then, the SFC values would increase with increasing engine speed with a steeper slope. This trend is the opposite of the trend for engine P and T in Figure 22. The SFC at lower engine speeds slightly increases with increase in ethanol blend ratio, but at higher engine speeds (near 2000 rpm), this trend becomes the opposite. According to Figure 23, the optimization algorithm successfully reduced the SFC in comparison with the experimental data, especially at higher engine speeds. For the HC emission, we can see that S is the dominant factor, and the HC is linearly decreased with increasing S.
The ethanol blend ratio or E has little effect on the HC at higher engine speeds, but at lower S values, the HC would decrease with the increasing E. In comparison to experimental data, the optimized results in Figure 24 show a great improvement in reduction of HC emission especially in higher engine speed, and the reduction is 30% around 2000 rpm. According to Figure 24, the CO2 values increase with increasing in S until it reaches the speeds around 1800 rpm, then, it would decrease with increasing S with a steeper slope. This trend is like the trend observed for P and T and the opposite of the trend for engine SFC. The ethanol ratio (E) seems to have little effect on the CO2 emission level; the CO2 values show a slight increase in higher E values. The NOx emission was affected with the changes in S and E values and these variations are opposite of one another. The NOx increases with increasing E values, but decreases with increasing S.
According to Figure 25, the CO emission slightly decreases with an increase in E, but it shows a more complex behavior when increasing S. Its value decreases until it reaches the speeds around 1700 rpm, then, it would increase up to speeds around 1850 rpm, and then decreases again with a steeper slope at higher speeds. This trend is almost the same for EI index, as shown in Figure 25. According to this figure, the variation in E has little effect on the EI value. We can conclusively say that the optimization algorithm was successful in minimizing emission index (Equation (5)) for all ethanol blend ratios, especially at higher engine speeds.
4. Conclusions
In this research, the emissions characteristics of the Perkins A63544 diesel engine employing diesel–ethanol fuel blends were studied, and the results were compared to those released by diesel fuel. The following results were obtained:
- (1)
- The application of diesel–ethanol fuel blends reduced UHC emissions by 7.01–16.25%.
- (2)
- Using diesel–ethanol fuel blends reduced CO emissions by 3.2–30.6%.
- (3)
- Diesel–ethanol fuel blends led to an insignificant increase of NOx and CO2 emissions in a range of 7.5–19.6% and 3.5–5%, respectively, at test conditions.
- (4)
- In summary, diesel–ethanol fuel blends can be directly used in a diesel engine with lower UHC and CO emissions.
- (5)
- The results confirmed that the shape of the Pareto front obtained from multi-objective ϵ-Pareto optimization of engine performance could be convex, concave, or a combination of both. A new parameter was introduced as an emission index or EI for the selection of the best solution among the Pareto set of solutions. This parameter had its minimum in solution with the rank 21, and its value is 4.61. The variables values for this optimum solution were S = 1977.70 rpm, E = 10.03%, CO = 0.27%, CO2 = 6.81%, HC = 3.04 ppm, NOx = 1573.00 ppm, SFC = 239.88 g/kW·h, P = 56.02 kW, T = 269.91 N·m, and EI = 4.61. The EI index has its maximum in solution number 13 with a value of 8.26. The variation in E has little effect on the EI value, and we can conclusively say that the optimization algorithm was successful in minimizing emission index (Equation (4)) for all ethanol blend ratios, especially at higher engine speeds.
Author Contributions
Conceptualization, B.S.; methodology, H.H.A.A.; software, G.N.; validation, B.S., H.H.A.A. and G.N.; formal analysis, G.N.; investigation, B.S.; resources, B.S.; data curation, B.S. and H.H.A.A.; writing—original draft preparation, B.S.; writing—review and editing, B.S. and G.N.; visualization, B.S.; supervision, H.H.A.A.; project administration, B.S. and H.H.A.A.; funding acquisition, H.H.A.A. All authors have read and agreed to the published version of the manuscript.
Funding
This research received no external funding.
Institutional Review Board Statement
Not applicable.
Informed Consent Statement
Not applicable.
Data Availability Statement
The data presented in this study are available on request from the corresponding author. Please contact b.shadidi@basu.ac.ir.
Acknowledgments
This research was conducted in collaboration with the Faculty of Agriculture, Bu Ali Sina University.
Conflicts of Interest
The authors declare no conflict of interest.
Appendix A
Input variables are engine speed (x) and ethanol blend ratio (y), and the output model is f (x,y). f(x,y) = p00 + p10*x + p01*y + p20*x^2 + p11*x*y + p02*y^2 + p30*x^3 + p21*x^2*y+ p12*x*y^2 + p03*y^3.

Table A1.
The fitted polynomials and their coefficients.
Table A1.
The fitted polynomials and their coefficients.
| Output Variable (Objective Function) | Coefficients (with 95% Confidence Bounds) | Goodness of Fit |
|---|---|---|
| CO emission, CO | p00 = 508.7 (434.6, 582.8) p10 = −0.8779 (−1.002, −0.754) p01 = 1.628 (0.5552, 2.7) p20 = 0.0005042 (0.0004353, 0.0005732) p11 = −0.001752 (−0.002926, −0.0005787) p02 = −0.01719 (−0.039, 0.004621) p30 = −9.619 × 10⁻⁸ (−1.09 × 10⁻⁷, −8.342 × 10⁻⁸) p21 = 4.636 × 10⁻⁷ (1.399 × 10⁻⁷, 7.874 × 10⁻⁷) p12 = 8.11 × 10⁻⁶ (−2.947 × 10⁻⁶, 1.917 × 10⁻⁵) p03 = 0.0001354 (−0.0003522, 0.000623) | SSE: 0.09685 R-square: 0.9738 Adjusted R-square: 0.9643 RMSE: 0.06224 |
| CO2 emission, CO2 | p00 = 1527 (1262, 1792) p10 = −2.636 (−3.08, −2.192) p01 = 3.729 (−0.1121, 7.57) p20 = 0.001521 (0.001274, 0.001768) p11 = −0.003864 (−0.008067, 0.0003387) p02 = −0.04408 (−0.1222, 0.03402) p30 = −2.917 × 10⁻⁷ (−3.374 × 10⁻⁷, −2.459 × 10⁻⁷) p21 = 1.033 × 10⁻⁶ (−1.262 × 10⁻⁷, 2.192 × 10⁻⁶) p12 = 1.25 × 10⁻⁵ (−2.71 × 10⁻⁵, 5.21 × 10⁻⁵) p03 = 0.001007 (−0.0007392, 0.002753) | SSE: 1.242 R-square: 0.9799 Adjusted R-square: 0.9726 RMSE: 0.2229 |
| Hydrocarbon emission, HC | p00 = 622.5 (175, 1070) p10 = −1.034 (−1.783, −0.2847) p01 = 4.781 (−1.699, 11.26) p20 = 0.0006028 (0.000186, 0.00102) p11 = −0.006513 (−0.0136, 0.0005779) p02 = 0.03095 (−0.1008, 0.1627) p30 = −1.19 × 10⁻⁷ (−1.962 × 10⁻⁷, −4.19 × 10⁻⁸) p21 = 1.913 × 10⁻⁶ (−4.267 × 10⁻⁸, 3.869 × 10⁻⁶) p12 = 2.083 × 10⁻⁵ (−4.597 × 10⁻⁵, 8.764 × 10⁻⁵) p03 = −0.002778 (−0.005724, 0.0001682) | SSE: 3.536 R-square: 0.9907 Adjusted R-square: 0.9874 RMSE: 0.3761 |
| NOx emission, NOx | p00 = −5.773 × 10⁴ (−1.167 × 10⁵, 1247) p10 = 95.66 (−3.035, 194.4) p01 = 3.103 (−850.8, 857) p20 = −0.05038 (−0.1053, 0.004544) p11 = −0.0391 (−0.9735, 0.8953) p02 = 0.08393 (−17.28, 17.45) p30 = 8.631 × 10⁻⁶ (−1.535 × 10⁻⁶, 1.88 × 10⁻⁵) p21 = 4.943 × 10⁻⁵ (−0.0002083, 0.0003072) p12 = −0.006094 (−0.0149, 0.00271) p03 = 0.409 (0.02081, 0.7972) | SSE: 6.14 × 10⁴ R-square: 0.9513 Adjusted R-square: 0.9338 RMSE: 49.56 |
| Specific Fuel Consumption, SFC | p00 = −4625 (−1.505 × 10⁴, 5798) p10 = 9.911 (−7.534, 27.36) p01 = −194.5 (−345.4, −43.54) p20 = −0.006563 (−0.01627, 0.003146) p11 = 0.2364 (0.07129, 0.4016) p02 = −1.839 (−4.908, 1.23) p30 = 1.415 × 10⁻⁶ (−3.815 × 10⁻⁷, 3.212 × 10⁻⁶) p21 = −6.938 × 10⁻⁵ (−0.0001149, −2.382 × 10⁻⁵) p12 = 0.0005879 (−0.0009682, 0.002144) p03 = 0.0392 (−0.02942, 0.1078) | SSE: 1918 R-square: 0.7971 Adjusted R-square: 0.724 RMSE: 8.759 |
| Power, P | p00 = 8655 (6649, 1.066 × 10⁴) p10 = −15.09 (−18.44, −11.73) p01 = 39.89 (10.85, 68.93) p20 = 0.008795 (0.006927, 0.01066) p11 = −0.04686 (−0.07864, −0.01509) p02 = 0.03039 (−0.56, 0.6208) p30 = −1.702 × 10⁻⁶ (−2.048 × 10⁻⁶, −1.357 × 10⁻⁶) p21 = 1.392 × 10⁻⁵ (5.159 × 10⁻⁶, 2.269 × 10⁻⁵) p12 = −5.705 × 10⁻⁵ (−0.0003564, 0.0002423) p03 = 0.001882 (−0.01132, 0.01508) | SSE: 70.99 R-square: 0.9567 Adjusted R-square: 0.9412 RMSE: 1.685 |
| Torque, T | p00 = 3.286 × 10⁴ (2.339 × 10⁴, 4.233 × 10⁴) p10 = −57.77 (−73.62, −41.93) p01 = 331.6 (194.5, 468.7) p20 = 0.03407 (0.02525, 0.04289) p11 = −0.3681 (−0.5181, −0.218) p02 = −1.893 (−4.681, 0.8946) p30 = −6.676 × 10⁻⁶ (−8.308 × 10⁻⁶, −5.044 × 10⁻⁶) p21 = 0.0001025 (6.113 × 10⁻⁵, 0.0001439) p12 = 0.000898 (−0.0005155, 0.002311) p03 = 0.01144 (−0.05089, 0.07377) | SSE: 1583 R-square: 0.9719 Adjusted R-square: 0.9618 RMSE: 7.957 |
References
- Shadidi, B.; Yusaf, T.; Alizadeh, H.H.A.; Ghobadian, B. Experimental investigation of the tractor engine performance using diesohol fuel. Appl. Energy 2014, 114, 874–879. [Google Scholar] [CrossRef]
- Shadidi, B.; Alizadeh, H.H.A.; Ghobadian, B. The effect of the novel hybrid nano-catalyst in diesel-biodiesel fuel blends on the energy balance of a diesel engine. Energy Equip. Syst. 2017, 5, 56–69. [Google Scholar]
- Beatrice, C.; Denbratt, I.; Di Blasio, G.; Di Luca, G.; Ianniello, R.; Saccullo, M. Experimental Assessment on Exploiting Low Carbon Ethanol Fuel in a Light-Duty Dual-Fuel Compression Ignition Engine. Appl. Sci. 2020, 10, 7182. [Google Scholar] [CrossRef]
- Di Blasio, G.; Beatrice, C.; Molina, S. Effect of port injected ethanol on combustion characteristics in a dual-fuel light duty diesel engine. SAE Tech. Pap. 2013, 1692. [Google Scholar] [CrossRef]
- Al-Esawi, N.; Al-Qubeissi, M.; Kolodnytska, R. The impact of biodiesel fuel on ethanol/diesel blends. Energies 2019, 12, 1804. [Google Scholar] [CrossRef]
- Ghobadian, B.; Najafi, G.H.; Rahimi, H.; Yusaf, T.F. Future of renewable energies in Iran. Renew. Sustain. Energy Rev. 2009, 13, 689–695. [Google Scholar] [CrossRef]
- Hansen, A.C.; Zhang, Q.; Lyne, P.W.L. Ethanol-diesel fuel blends-a review. Bioresour. Technol. 2005, 96, 277–285. [Google Scholar] [CrossRef]
- Thangavelu, S.K.; Ahmed, A.S.; Ani, F.N. Review on bioethanol as alternative fuel for spark ignition engines. Renew. Sustain. Energy Rev. 2016, 56, 820–835. [Google Scholar] [CrossRef]
- Kwanchareon, P.; Luengnaruemitchaei, A.; Jai-In, S. Solubility of a diesel-biodiesel-ethanol blend, its fuel properties and its emission characteristics from diesel engine. Fuel 2007, 86, 1053–1061. [Google Scholar] [CrossRef]
- Wu, Y.; Zhang, X.; Zhang, Z.H.; Wang, X.; Geng, Z.H.; Jin, C.; Liu, H.; Yao, M. Effects of diesel-ethanol-THF blend fuel on the performance and exhaust emissions on a heavy-duty diesel engine. Fuel 2020, 148, 1385–1394. [Google Scholar] [CrossRef]
- Sarjowaara, T.; Alantie, J.; Larmi, J. Ethanol dual-fuel combustion concept on heavy duty engine. Energy 2013, 271, 76–85. [Google Scholar] [CrossRef]
- Di Blasio, G.; Bonura, G.; Frusteri, F.; Beatrice, C. Experimental characterization of diesel combustion using Glycerol derived Ethers mixtures. SAE Int. J. Fuels Lubr. 2013, 6, 940–950. [Google Scholar] [CrossRef]
- Rao, K.V.S.; Vinay, S.N.K.; Kuppast, V. A Review on Performance of the IC Engine Using Alternative Fuels. Mater. Today Proc. 2018, 5, 1989–1996. [Google Scholar]
- Sujesh, G.; Ramesh, S. Modeling and control of diesel engines: A systematic review. Alex. Eng. J. 2018, 57, 4033–4048. [Google Scholar]
- Navid, A.; Khalilarya, S.; Taghavifar, H. Comparing multi-objective non-evolutionary NLPQL and evolutionary genetic algorithm optimization of a DI diesel engine: DoE estimation and creating surrogate model. Energy Convers. Manag. 2016, 126, 385–399. [Google Scholar] [CrossRef]
- Saravanan, S.; Nagarajan, G.; Sampath, S. Combined effect of injection timing, EGR and injection pressure in NOx control of a stationary diesel engine fuelled with crude rice bran oil methyl ester. Fuel 2013, 104, 409–416. [Google Scholar] [CrossRef]
- Deb, K.; Mohan, M.; Mishra, S. Evaluating the epsilon-Domination Based Multi-Objective Evolutionary Algorithm for a Quick Computation of Pareto-Optimal Solutions. Evol. Comput. 2005, 13, 501–525. [Google Scholar]
- Laumanns, N.; Laumanns, M.; Kitterer, H. Evolutionary Multi-objective Integer Programming for the Design of Adaptive Cruise Control Systems. In Proceedings of the International Conference on Industrial, Engineering and Other Applications of Applied Intelligent Systems, Carins, QLD, Australia, 17–20 June 2002; pp. 200–210. [Google Scholar]
- Kiani Deh Kiani, M.; Ghobadian, B.; Tavakoli, T.; Nikbakht, A.M.; Najafi, G. Application of artificial neural networks for the prediction of performance and exhaust emissions in SI engine using ethanol- gasoline blends. Energy 2010, 35, 65–69. [Google Scholar] [CrossRef]
- Hsieh, W.D.; Chen, R.H.; Wu, T.L.; Lin, T.H. Engine performance and pollutant emission of an SI engine using ethanol-gasoline blended fuels. Atmos. Environ. 2002, 36, 403–410. [Google Scholar] [CrossRef]
- Yao, Y.C.; Tsai, J.H.; Chiang, H.L. Effects of ethanol-blended gasoline on air pollutant emissions from motorcycle. Sci. Total Environ. 2009, 407, 5257–5262. [Google Scholar] [CrossRef]
- Al-Hasan, M. Effect of ethanol-unleaded gasoline blends on engine performance and exhaust emission. Energy Convers. Manag. 2003, 44, 1547–1561. [Google Scholar] [CrossRef]
- Li, D.; Huang, Z.; Lv, X.; Zhang, W.; Yang, J. Physico-chemical properties of ethanol-diesel blend fuel and its effect on performance and emission of diesel engine. Renew. Energy 2005, 30, 967–976. [Google Scholar] [CrossRef]
- Rahimi, H.; Ghobadian, B.; Yusaf, T.; Najafi, G.H.; Khatamifar, M. Diesterol: An environment-friendly IC engine fuel. Renew. Energy 2009, 34, 335–342. [Google Scholar] [CrossRef]
- Resitoglu, I.A.; Altinisi, K.; Keskin, A. The pollutant emissions of diesel-engine vehicles and exhaust after treatment systems. Clean Technol. Environ. Policy 2015, 17, 15–27. [Google Scholar] [CrossRef]
- Di, Y.; Chenung, C.S.; Huang, Z. Comparison of the effect on biodesel-diesel and ethanol-diesel on the gaseous emission of a direct-injection diesel engine. Atmos Environ. 2009, 43, 2721–2730. [Google Scholar] [CrossRef]
- Aydin, H.; Ilkilic, C. Effect of ethanol blending with biodiesel on engine performance and exhaust emissions in a CI engine. Appl. Therm. Eng. 2010, 30, 1199–1204. [Google Scholar] [CrossRef]
- Sayin, C. Engine performance and exhaust gas emissions of methanol and ethanol-diesel blends. Fuel 2010, 89, 3410–3415. [Google Scholar] [CrossRef]
- Shi, X.; Pang, X.; Mu, Y.; He, H.; Shuai, S.; Wang, J.; Chen, H.; Li, R. Emission reduction potential of using ethanol-biodiesel-diesel fuel blend on a heavy-duty diesel engine. Atmos. Environ. 2006, 40, 2567–2574. [Google Scholar] [CrossRef]
- Park, S.H.; Youn, I.M.; Lee, C.S. Influence of ethanol blends on the combustion performance and exhaust emission characteristics of a four-cylinder diesel engine at various engine loads and injection timing. Fuel 2011, 90, 748–755. [Google Scholar] [CrossRef]
- Rakopoulous, D.C.; Rakopoulous, C.D.; Kakaras, E.G.; Giakoumis, E.G. Effects of ethanol-diesel fuel blends on the performance and exhaust emissions of heavy-duty DI diesel engine. Energy Convers. Manag. 2008, 49, 3155–3162. [Google Scholar] [CrossRef]
- Oscar, J.S.; Carlos, A.C. Reiview: Trnds in biotechnological production of fuel ethanol from different feedstocks. Bioresour. Technol. 2008, 99, 5270–5295. [Google Scholar]
- Huang, J.; Wang, Y.; Li, S.; Roskilly, A.P.; Yu, H.; Li, H. Experimental investigation on the performance and emission of a diesel engine fueled with ethanol-diesel blends. Appl. Therm. Eng. 2009, 29, 2484–2490. [Google Scholar] [CrossRef]
Publisher’s Note: MDPI stays neutral with regard to jurisdictional claims in published maps and institutional affiliations. |
© 2021 by the authors. Licensee MDPI, Basel, Switzerland. This article is an open access article distributed under the terms and conditions of the Creative Commons Attribution (CC BY) license (https://creativecommons.org/licenses/by/4.0/).