Abstract
The urban heat island (UHI) poses a significant threat to urban ecosystems, human health, and urban energy systems. Hence, days with a relatively higher UHI intensity should be selected for UHI observation and analysis. However, there is still a lack in the method and criteria for selecting the typical meteorological days for UHI survey and simulation. In this study, field measurements were conducted based on Local Climate Zone (LCZ) schemes over a one-year period to assess the UHI behavior in Guangzhou, China. The relationship between the diurnal temperature range (DTR) and UHI intensity was evaluated and analyzed quantitatively under different meteorological conditions classified by precipitation. The average daily maximum UHI intensity during precipitation days was approximately 1.8 °C lower than that during non-precipitation days, confirming that precipitation has a negative effect on UHI development. The monthly DTR distribution was similar to the daily distribution, which was higher in autumn and winter, but lower in spring and summer. DTR has a significant linear correlation with the daily , with a Pearson’s correlation coefficient of >0.7 and statistical significance of <0.001. Based on a quantitative evaluation of our results, we determined that 10 °C could be regarded as the appropriate DTR threshold to identify the meteorological conditions conducive to UHI development; the meteorological conditions exhibited a high daily in Guangzhou. This study provides a simple method to select typical meteorological days for UHI measurement and simulation, and a method to early-warning of intense UHI events based on weather forecasts.
1. Introduction
Accompanying global warming and accelerated urbanization, the urban heat island (UHI) effect has become an established urban environment phenomenon. The UHI effect occurs when the temperature in urban areas is significantly higher than in suburban areas. The temperature difference between urban and suburban areas, which occurs due to an energy imbalance [1], is referred to as the UHI intensity (UHII). UHI poses a significant threat to urban ecosystems, human health, and urban energy systems [2,3].
Many factors significantly affect the formation and development of UHIs. Broadly, these factors are classified into two categories based on their influence on the occurrence and development of UHIs [4]. The first category is the characteristics of the city, such as geographical location, topography, morphology, demography [5], land cover and land use [6], built-up intensity, and anthropogenic heat emissions [7]. These factors contribute significantly to the development of UHIs. The second category is meteorological conditions, such as precipitation, humidity and temperature, cloud cover, wind speed and direction, and solar radiation that affect the UHI intensity [8,9,10,11]. The daily maximum UHI intensity can be regarded as a measure of UHI development.
For a specific city, identifying the days with full UHII development over an extended period is required to study the mechanism of UHIs. Many studies have focused on identifying the days when the UHI is fully developed [12,13], e.g., the influence of different meteorological conditions on UHI development and the methods for identifying the meteorological conditions conducive to the UHI development. Extensive research has established the significant effect of precipitation on UHIs; most cities show a negative correlation between these phenomena. Arifwidodo and Tanaka [14] reported that the weakest UHI (2 °C) in Bangkok, Thailand, occurred in August, which was also the month with maximum precipitation. Unal [15] demonstrated that the UHII during the daytime on rainy summer days is 1 °C higher than on dry days, regardless of the precipitation amount in Istanbul, Turkey. The cloud coverage, as well as the evaporation of rainwater, increases before and after rainfall; further, these factors are considered to be the reason for precipitation leading to UHI variations as they remove urban sensible and latent heat [4]. Previous studies have identified strong UHI when meteorological conditions were clear and calm, or during cloudless days with weak winds. However, the quantitative descriptions of these conditions vary according to the study. Both cloud cover and wind speed factors are used to identify clear and calm days, which are considered conducive to UHI development. These factors differ according to the region and must be adjusted accordingly. Oke and Maxwell [16] selected variable thresholds with winds under 1.3 m/s and cloud cover of less than two-tenths as the appropriate meteorological conditions to determine UHI development in Montreal and Vancouver, Canada. Based on a study by Leconte [17] in Nancy, France, high daily prefers meteorological conditions that have less than two-tenths cloud cover and wind speeds less than 9 m/s. Yang [18] suggested wind speeds of less than 2 m/s and under three-tenths cloud cover for the examination of UHIs in Nanjing, China. Yang [18] suggested that the criteria of wind speeds and cloud cover must be re-calibrated because it varies according to the characteristics of the city. Although wind factors are easily measured, cloud cover data are difficult to obtain, implying that this method cannot be applied simply and rapidly.
Oke [19] proposed a new method, i.e., the weather factor, that combines the effects of wind speed and clouds, including the cover and type. In previous studies, these meteorological variables were adopted to identify clear and calm conditions, or cloudless with weak wind conditions for UHI development [20,21]. Despite the efficiency of the proposed method, obtaining cloud data for several regions remains challenging, primarily because cloud data consisting of cover and type used to determine coefficient k are required to calculate weather factors. Yang [18] derived an indicator from the daily diagnostic equation to identify the meteorological conditions conducive to UHI development in Nanjing, China. However, further investigations are required to determine the effectiveness of this proposed indicator. Recently, to overcome this challenge, studies have begun to explore the possibility of using diurnal temperature ranges (DTRs) in suburban or rural areas as an indicator of the meteorological conditions and identify days with high daily because this is related to the difference in cooling rates in urban and suburban areas. DTR is the difference between the highest and the lowest daily temperatures in a suburban area. Holmer [22] stated that DTR states can be adopted for weather classification. A positive correlation between the DTR and daily was found in northwestern Europe by Theeuwes [23]. Yao et al. [24] measured the UHII of different local climate zones (LCZs) in Nanjing, finding that the suburban DTR had a strong positive correlation with . Moreover, they determined that the DTR as an index can be employed to identify days with high daily . Yang [18] investigated the performance of cloud cover and wind speed, DTR, and the weather factor on identifying days with full UHII development. The quantitative relationship between the DTR and were analyzed and established, showing that the correlation coefficient between them is greater than 0.67. They proposed that high was observed when DTR ≥ 10 °C in Nanjing based on their observations. This method can be used effectively to identify the days with full UHI development. The geographical location and climate of other cities are different from those of Nanjing, resulting in significant differences in the DTR; thus, the method requires evaluation in other cities. UHI research has generally focused on the characteristics of DTR in the process of urbanization [25,26,27]. The quantitative analysis of DTR and UHII development has gradually increased [28].
We emphasize that reliable assessments of UHIs depend, to a large degree, on the days selected for observation and analysis. The selection of the sample days with full UHI development is crucial for the field measurement of the UHI. Methods to identify days with full UHI development have been developed; however, the methods for measuring cloud cover and wind speed, weather factor, and the daily diagnostic equation are not straightforward and not easy to use for field measurements due to the several parameters involved and the difficulty in obtaining them. DTR is easy to use because only routine observations are required. The methods to identify days with full UHI development have not been previously studied in Guangzhou, China, which has a typical subtropical climate different from Nanjing. This study aims to establish a method for selecting the typical days with full urban heat island development by investigating the correlation between the DTR and in Guangzhou. Annual hourly observation data were used to quantitatively analyze the relationship between the DTR and under different meteorological conditions classified according to the precipitation. The appropriate threshold for the DTR, as an index, was determined to identify days conducive to the development of UHIs in Guangzhou. The quantitative relationship between the DTR and can help establish a method for selecting days with full UHII development for the measurement and simulation of UHI phenomena. This study and the results are also beneficial for the prediction of intense UHI events.
2. Methods
2.1. Study Area
Guangzhou spans 7434.4 km2 on both sides of the Pearl River from 112°57″ to 114°03″ E and 22°26″ to 23°56″ N in south-central Guangdong. The Pearl River flows through the city. Guangzhou is the capital city of Guangdong Province, and the central city of the Guangdong-Hong Kong-Macao Greater Bay Area and Pan-Pearl River Delta Economic Zone. Figure 1 shows an overview of the study area. Guangzhou is characterized by hot summers and warm winters. The months of June to September are the hottest months of the year, with daily average temperatures ranging from 27.7 to 29.2 °C, daily maximum temperatures ranging from 34.5 to 36 °C, and a daily average relative humidity of approximately 80%. The annual number of rainy days is approximately 152, and the annual precipitation is 1696.5 mm. The UHII is higher in the summer and autumn in Guangzhou. The average UHII is 1.2 °C in the summer and 1.5 °C in the autumn [29]. The built-up area is approximately 1249.11 km2 and is located around the river. As shown in Figure 1, more rural farmland, represented by large yellow areas, is situated adjacent to the estuary. The large green areas in Figure 1 are mainly evergreen trees or shrubs, where the terrain is low elevation mountains. Most buildings in the city are air-conditioned in the summer.
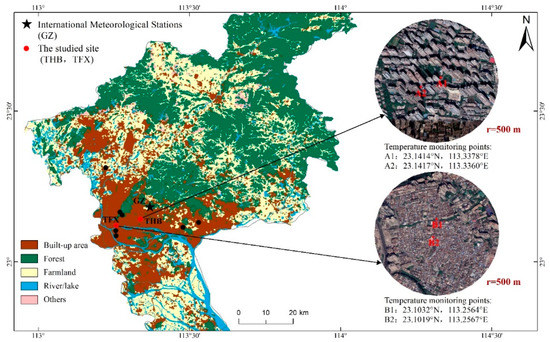
Figure 1.
Study area of Guangzhou, China. Satellite images of the meteorological observation sites (Tian He Bei abbreviated as THB and Tong Fu Xi abbreviated as TFX) and two temperature measuring points at the observation sites; location of the International Meteorological Station.
2.2. Field Measurement
2.2.1. Site for Urban Air Temperature Measurements
The data on hourly air temperature in the suburbs and urban areas are required to explore the relationship between the DTR and UHII. The air temperature was obtained through field measurements in this study. Selecting an appropriate site for urban temperature measurement is highly important; the temperature should reflect the physical structure, surface properties, and thermal climate of the city, as well as a high UHII. LCZ schemes proposed by Stewart and Oke [7] have been widely adopted to globally study UHIs; these schemes aim to provide an objective and standardized classification criterion for UHI studies. The LCZ schemes enhance the description of surface conditions in urban and rural areas, thereby easing the process of site selection. An area spanning hundreds of meters to several kilometers with uniform features in terms of the structure, land cover, material, and human activity can be described as an LCZ [7]. There are 10 LCZ built types and seven LCZ land cover types in this study area. Each LCZ is expected to present a characteristic screen-height (1–2 m above ground) temperature. The site for the urban air temperature field experiments was selected based on the LCZ schemes in Guangzhou.
According to the guidelines for using the LCZ classification system suggested by Oke [7], a LCZ is defined as an area with a minimum radius of 200–500 m, which has uniform features in terms of surface cover, structure, material, and human activity. Additionally, different LCZs with a radius of 500 m were selected to study the thermal behavior of LCZs in Nanjing, China [10]. A total of 10 different LCZs were selected to study the thermal behavior in Guangzhou (represented by the black spot in Figure 1). Based on the relationship between UHII and DTR, two LCZ sites (THB and TFX) with a radius of 500 m were selected for meteorological observations in this study. These two sites were selected because they exhibited a higher UHII in a previous study [30]. Figure 1 shows the location of the sites (represented by red spots). One site (THB) is located in the new town center of the city, characterized by high building density and several types of buildings (office buildings, residential buildings, and hotels). This site is classified as LCZ 2. The other site (TFX), characterized by mid-rise residential buildings, belongs to the LCZ 3 and is located in the old town center of the city. Table 1 lists the detailed site parameters and satellite images. Figure 2 shows the satellite images of the selected LCZs.

Table 1.
Characteristics of the local climate zone (LCZ) sites.
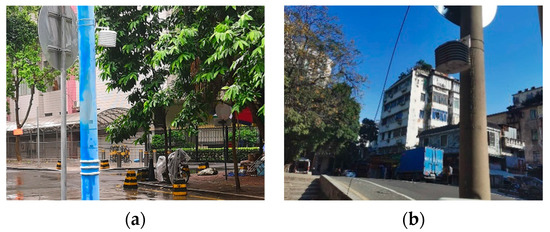
Figure 2.
Temp/RH data logger at the urban sites: (a) THB; (b) TFX.
2.2.2. Experiment Design
The air temperatures measured at the THB and TFX sites were used to represent the urban temperature of Guangzhou. The hourly temperatures of the two sites were derived from the temperature observation experiment of the Guangzhou LCZ, which was conducted in July 2019 and is still ongoing. At each site, two fixed points located in the core area of the site within a radius of 100 m were equipped with temp/RH data loggers (HOBO U23X-001) inside a matching radiation shield to collect the hourly air temperature. Figure 1 shows the locations of the data loggers. The temp/RH data logger used was the HOBO U23X-001, manufactured by Onset (Bourne, MA, USA), with a measuring range of 0 to 50 °C and uncertainty of ±0.2 °C. For instrument safety, the temp/RH data logger was installed on street lampposts or poles at a height of 2.1–2.5 m from the ground. To avoid the influence of any artificial heat sources and ensure adequate ventilation, the point was placed far from vehicles and air conditioners, and at a distance of over 3 m from walls. The loggers were installed in the open area which is taken as the area never covered by tree shadow all day long. Figure 2 shows one data logger installed at THB and TFX. The average value of the temperature readings obtained at the two measuring points was taken as the air temperature value of the site.
2.2.3. Air Temperature in Suburban Area
We obtained the hourly suburban air temperatures in Guangzhou from the National Meteorological Station (NMS) No. 59287. Hourly temperature data from the NMS can be accessed via the China Meteorological Data Service Center (CMDC, http://data.cma.cn). These data were used to classify the meteorological conditions in Guangzhou and calculate the UHII and suburban DTR. The station is a standard meteorological station that sends and receives data internationally. The station, represented by black pentagram in Figure 1, is located on the northeast of the city. These data include meteorological variables, such as solar radiation, air temperature, humidity, wind speed and direction, precipitation, and atmospheric pressure. The minimum and maximum temperature, humidity and wind direction observed in this station appear in daily weather forecast and represent the weather conditions in Guangzhou.
2.3. Calculation of UHII and DTR
2.3.1. UHII
The difference in the hourly air temperature between that measured in urban areas and that observed in suburban areas was defined as the UHII (). The maximum UHII in a day is , which represents the development level of the UHI. To capture the complete diurnal cycle of the climatic processes (nocturnal cooling after daytime warming), a 24 h period from 08:00 a.m. to 07:00 a.m. was defined as a day to calculate the and DTR. The average daily at each site for the study duration was defined as . A day was regarded as a full UHI development day when .
2.3.2. DTR in Suburban Areas
The suburban DTR is considered a measure of the cooling potential at night in suburban areas. This can be quantified according to the maximum hourly temperature minus the hourly minimum temperature in a day (). DTR represents the comprehensive effect of multiple meteorological variables in suburban areas and can be used to estimate the change in the regional thermal environment. During sunny and cloudless conditions, the open space in a suburban area and strong solar radiation result in a relatively high daily maximum temperature. At night, due to the large sky view factor and enhanced long-wave radiative cooling, the daily minimum temperature reaches a relatively low minimum value. The UHII is generally high under such meteorological conditions because the cooling rate in a suburban area is faster than that in an urban area, especially after sunset [1].
2.4. Meteorological Conditions during Experiments
The hourly data for a year from 1 August 2019 to 31 July 2020, at the sites observed by the NMS in the suburban area and those measured by temp/RH data loggers in the urban area were used in this study. Excluding missing data for 26 days, data from a total of 337 days were used in this study. To analyze the influence of different meteorological conditions on the UHI in Guangzhou, the influence of rainfall on the UHI must be examined. Three categories of meteorological conditions were classified by the NMS (59,287) precipitation data. Days with precipitation events recording a minimum daily-accumulated (≥0.1 mm) precipitation were defined as precipitation days (PDs); 114 days were analyzed. Days without rainfall following the PDs were defined as the days following precipitation (FPDs). Our study period included 29 FPDs. Other days without precipitation were defined as non-precipitation days (NPDs); 194 NPDs were analyzed. Table 2 lists the number of PDs, FPDs, and NPDs used for analysis and the monthly meteorological conditions, including air temperature and precipitation from the NMS in the suburban area. The monthly average temperature and precipitation were consistent with the climatic characteristics of Guangzhou, whereby higher temperatures occur in the summer and autumn and precipitation is more likely to occur in the spring and summer. During the study period, the mean temperatures from May to September all exceeded 27.0 °C. The most precipitation occurred in May, and the least in November.
Table 2.
Number days in three meteorological categories and monthly mean air temperature and precipitation from National Meteorological Station (NMS) in Guangzhou.
3. Results
3.1. Characteristics of Daily
Research on the seasonal characteristics of the UHI is necessary to alleviate the UHI effect. Figure 3 depicts the monthly statistics and analysis of the daily for the study duration at the THB and TFX sites. The was 4.19 °C for 337 days at the THB site, as indicated by the red line in Figure 2a. At the THB site, the maximum of the monthly averages of the daily was 6.0 °C in December while the minimum was 2.3 °C in May; the monthly average daily values for September, October, November, and December were significantly higher than the . Furthermore, more than 20 days and over 75% of every month had a daily characteristic of during these months. However, during the hotter months of May, June, July, and August, the monthly average daily values were lower than the , during which no more than 25% of the days exhibited . The characteristics of the daily distribution at the TFX site were consistent with the THB site.
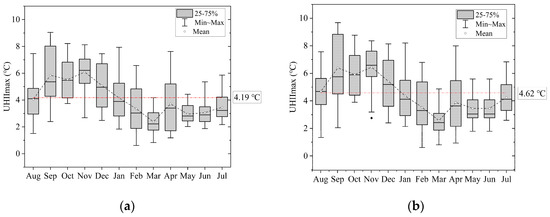
Figure 3.
Box plots for the monthly distribution of daily in Guangzhou: (a) THB; (b) TFX.
The of TFX was 4.62 °C for 337 days; Figure 2b shows the monthly distribution of . At the TFX site, the maximum of the monthly averages of the daily was 6.45 °C in December while the minimum was 2.57 in May. The average daily UHIIs of the two urban areas were lower in the spring and summer than in the autumn and winter. However, due to the small number of research samples and the number of years analyzed, this seasonal UHI characteristic trend in Guangzhou requires further research.
Analyzing the occurrence time frequency of the daily is necessary to reveal the characteristics of the UHI. Figure 4 shows the statistics of the occurrence time of the daily at THB and TFX in a 24-h period. We divided the study period into three categories to interpret the occurrence time frequency results. The maximum frequency of NPDs occurred at 23:00 at TFX and 20:00 at THB. PDs occurred at 23:00 at both TFX and THB. The daily generally occurred from 20:00 to 2:00 during the night for both stations, indicating that the UHI prefers to develop at night and the intensity reaches its maximum at night due to the differences in cooling rates caused by the thermal characteristics between urban and suburban areas [14]. This observation is consistent with the findings of several previous studies [18]. After sunset, the air layer structure is stable, and the cooling rate is faster because of the increased long-wave radiation in the suburban area due to large open spaces. The urban area retains significant heat during the day due to slow heat dissipation, resulting from the geometric shape of the urban block. This results in a high temperature in urban areas and a low temperature in suburban areas, increasing the UHII.
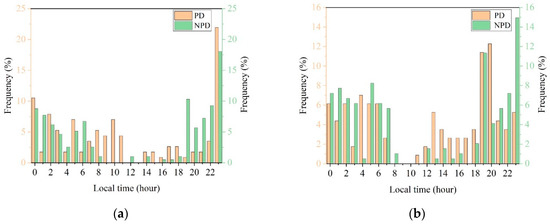
Figure 4.
Frequency of daily observed in a 24-h period for 337 days: (a) THB; (b) TFX.
3.2. Influence of Precipitation on
Guangzhou experiences approximately 114 days of precipitation per year. Therefore, examining the influence of precipitation on the development of the UHI is necessary. Figure 5 depicts the effect of precipitation on the UHII in Guangzhou. At the THB site, the average daily was 3.1 °C during the PDs, which was approximately 1.8 °C lower than the value during the NPDs. At the TFX site, the average daily decreased by 1.8 °C due to precipitation. Both sites recorded an approximately 1.8 °C lower average daily during PDs than during NPDs. This indicates that precipitation has a negative effect on UHI development. For the FPDs, the average daily was higher than that for the PDs; however, a lower average daily than that during NPDs proved that FPDs are not conducive to UHI development.
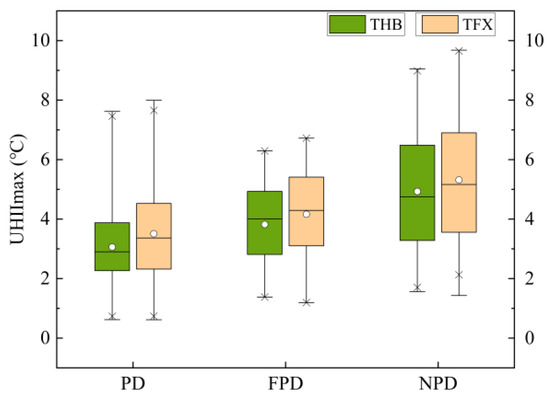
Figure 5.
Box plots of the daily during PDs and NPDs at the study sites.
Figure 6 depicts the monthly precipitation and box plots of the daily for three categories of meteorological conditions classified by precipitation. There is a negative correlation between the daily and precipitation. The monthly average daily was lower during PDs than NPDs, except when more than half of the months were PDs and precipitation was heavy. Precipitation had the least influence on the UHI in the autumn and winter, and a significant impact in the spring and summer. A negative correlation exists between precipitation and daily because precipitation weakens UHI development.
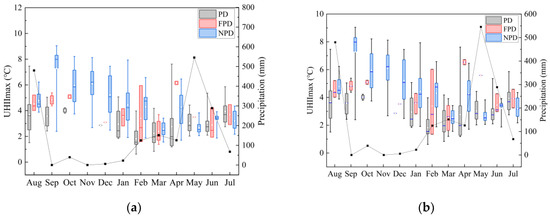
Figure 6.
Box plots of the daily for PDs and NPDs for different months at (a) THB and (b) TFX.
3.3. Relationship between DTR and UHI
To reveal the effect of the DTR on UHI development, the seasonal features and distribution of the DTR should be examined first, especially on the PDs and NPDs. Figure 7a shows the DTR statistics distribution for the 337-day study period. During this time, the minimum recorded DTR value in the suburbs was 1.3 °C, the maximum value was 16.0 °C, and the average value was 8.38 °C. A significant difference existed in the distribution of the monthly average DTR ranges from 5.75 to 11.25 °C. The DTR in autumn and winter was higher than that in the spring and summer, which may be due to increased precipitation during the spring and summer. Figure 7b shows the DTR statistics distribution of the PDs and NPDs. The difference in the monthly average DTR between the PDs and NPDs was significant where the DTR showed a negative correlation with the temperature. NPDs were used to analyze the relationship between the DTR and UHI, owing to the negative effect of precipitation on UHI development.
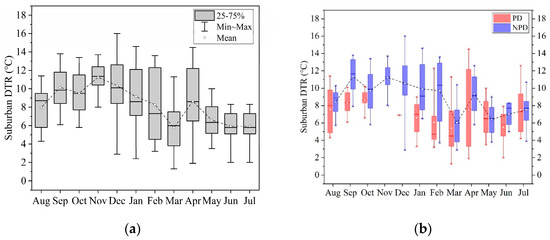
Figure 7.
Box plots by month for DTR: (a) 337 days; (b) PDs and NPDs.
Figure 8 depicts the distribution of the during NPDs and the relation to the DTR at THB and TFX. In the figure, r and P, which represent Pearson’s correlation coefficient and statistical significance, respectively, can be used to measure the intensity of the linear association between the and DTR. The correlation criteria of the absolute value of r were very weak (0.00–0.19), weak (0.20–0.39), moderate (0.40–0.59), strong (0.60–0.79), and very strong (0.80–1.0) [31]. In general, the correlation analysis was considered statistically significant when p < 0.05. The daily was positively correlated with the DTR at both the THB and TFX sites, which is consistent with previous findings [18,23,32]. The absolute value of r represents correlation coefficients that exceeded 0.7 at both sites, indicating strong correlations between the DTR and daily in Guangzhou. Previous study in Nanjing showed that the daily is positively correlated with DTR, where the correlation coefficient is 0.67 and p < 0.005 [31]. The correlation coefficient in Guangzhou is higher than that in Nanjing. Therefore, the DTR can be used as an index to identify days with high daily in Guangzhou.
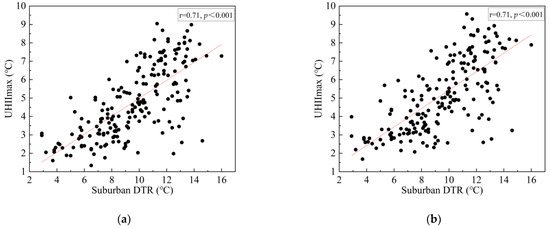
Figure 8.
Daily against DTR: (a) THB; (b) TFX.
3.4. Thresholds for Identifying Days with High Daily
A significant correlation between the DTR and indicates that the DTR can be used to identify days with high daily in Guangzhou. Figure 9 shows the relationship between the DTR and for 194 NPDs. The for 194 NPDs was 4.78 °C and 5.22 °C for the THB and TFX sites, respectively. The same trend can be observed at both sites; the average daily increased, and the number of days with a daily decreased with an increasing DTR. At the THB site, 183 days were selected when the DTR was ≥5 °C, and the average daily was 4.93 °C. Only 48.6% of the days were characterized by . At the TFX site, the average daily was 5.37 °C and 48.6% of the days recorded when the DTR was ≥5 °C. When the DTR increased to 12 °C, only 44 days were recorded. However, the ratios of the number of days with a daily to the number of the days when the DTR was ≥12 °C were 84.1% and 81.8% for the THB and TFX sites, respectively.
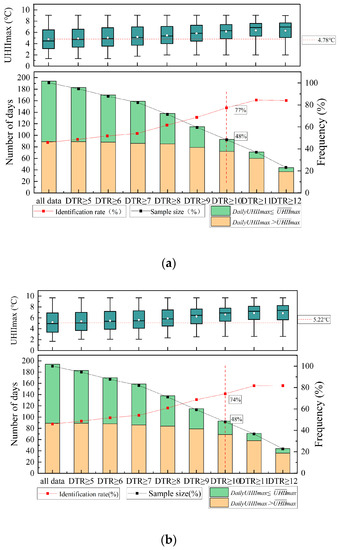
Figure 9.
Selection of appropriate DTR threshold values to identify the days with full UHI development in Guangzhou: (a) THB; (b) TFX. Sample size (%), represented by the black solid line, is defined as the number of days selected by the DTR threshold to the total number of NPDs (194 days in this study). Identification rate (%), represented by the red solid line, is defined as the number of days with a daily (4.78 °C at THB and 5.22 °C at TFX; represented by the red dotted line) to the number of days selected by the DTR threshold.
With the increase in the DTR, fewer sample days were selected, resulting in a decrease in the sample size and an increase in the identification rate. The meteorological conditions conducive to UHI development can be identified by selecting an appropriate DTR to ensure a sufficient sample size and identification rate. In a previous study [18], a sample size higher than 30% and an identification rate of more than 70% were defined as the criteria to determine the DTR threshold value in Nanjing. In this study, when the DTR was 10 °C, the sample size and identification rate at the THB and TFX sites were 48% and 77%, and 33.5% and 74%, respectively. A DTR of 10 °C can, thus, be regarded as the threshold to identify days with high daily because both sites meet the criteria proposed by Yang [18]. Days with DTR ≥10 °C can be considered conducive to UHI development in Guangzhou. However, the regional climate and geographical features of a city influence the DTR in a significant manner. Hence, a more extended period of data should be collected and analyzed to verify UHI development in Guangzhou; further, more cities should be examined to fully evaluate the effectiveness and threshold.
4. Discussion
Meteorological conditions impact the UHI in a significant manner. Therefore, selecting the days with a high daily from different meteorological conditions is crucial to assess and understand the UHI. In this study, the DTR for 337 days was used as an index to select days with a high daily in Guangzhou.
The geography, topography, anthropogenic heat, and regional climate of a city have complex effects on urban and suburban thermal behavior. In addition, the air temperature is also affected by the soil type, vegetation type, and coverage. Previous studies have discussed the various characteristics of the UHI. For example, the largest UHII values were found in summer in Istanbul [15], while a strong UHI was observed in both the summer and winter seasons in northern west Siberian cities [33] and in the winter in Beijing [34]. The monthly distribution of the daily in the two urban areas of Guangzhou was studied for a one-year study duration; the results revealed that the UHII in the autumn and winter is more pronounced than that in the spring and summer, which is consistent with Jiang [35]. The characteristics of the UHI during autumn in Guangzhou may be related to the meteorological conditions. The meteorological conditions are stable, with more sunny days and less cloud cover, which are conducive to UHI development. However, further research with an extended period is required to establish the seasonal characteristics of the UHI in Guangzhou.
Guangzhou experiences heavy precipitation, such that the average daily increased by 1.8 °C during NPDs as compared with PDs at both sites. This indicates that precipitation negatively affects UHI development, which is consistent with the researches in Bangkok [14] and Istanbul [15]. During FPDs, the study sites recorded a lower average daily than that during NPDs, indicating that FPDs are not conducive to UHI development. Future research should focus on the analysis of more data including over a more extended period to verify these results.
For practical applications, this method not only can be used for selecting the typical meteorological days for UHI survey and simulation, but also can be used to forecast an early-warning of intense UHI events based on weather forecasts, which can provide the diurnal maximum and minimum temperature. For the study period, the difference in the monthly average distribution of the suburban DTR was moderate in Guangzhou, ranging from 5.75 to 11.25 °C. The DTR during NPDs was higher than that during PDs and FPDs, which was similar to the daily . In other words, more precipitation days will be eliminated with an increasing DTR. Based on these observations, the relationships between the DTR and daily during NPDs were quantitatively evaluated. Here, 10 °C can be regarded as the appropriate DTR threshold for NPDs to identify typical meteorological days with high daily in Guangzhou.
Figure 10 shows the performance of a DTR threshold of ≥10 °C for identifying days with a high during PDs and FPDs. Here, a stricter for 194 NPDs, 4.78 and 5.22 °C for the THB and TFX sites, respectively, was used to calculate the identification rate during PDs and FPDs. When DTR was ≥10 °C, only 23 days were selected as sample days, yielding an identification rate of 50% and 69% for the THB and TFX sites, respectively. Although the identification rate was less than 70% at THB, only 23 sample days were selected, indicating that most of the PDs and FPDs were excluded. For practical applications, we suggest that a threshold of 10 °C be used directly for all samples to identify days with full UHI development when focusing only on days with high and the precipitation data is difficult to obtain. Otherwise, a higher accuracy will be observed when identifying days with full UHI development using DTR ≥ 10 °C for NPDs in Guangzhou.
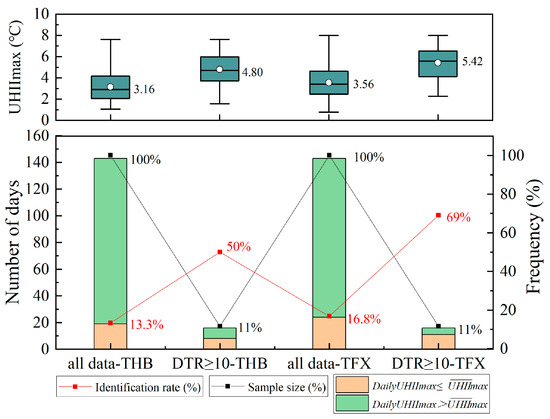
Figure 10.
Performance of the DTR threshold of ≥10 °C for identifying days with a high during PDs and FPDs.
The method by DTR to select the typical days with full UHI Development is very straightforward and easy to use, which only observation or forecasting of screen level temperature are required. However, there are limitations for this method. The observations of this study are limited by the amount of data analyzed. The DTR threshold in Guangzhou used to select the typical days with full UHI Development need to be examined over a more extended period data in future research. It is better to determine an appropriate DTR thresholds by season if a city with clear seasonal variability in the UHI effect. Moreover, the climate and geographical features of a city influence the DTR in a significant manner and the factors lead to UHI development and its intensity are not equal in all regions. Hence, the DTR threshold may not be suitable for other cities, and more cities with different climate conditions and properties are encouraged to examine and evaluate the effectiveness and threshold to adjust the method.
5. Conclusions
Selecting days with a high daily from different meteorological conditions is crucial to assess and understand UHIs. In this study, DTR was applied as an index to identify days with a high daily ; a year of observation data was collected from Guangzhou. The seasonal characteristics of the daily were consistent with the findings of previous studies. Notably, precipitation negatively affects UHI development, resulting in a daily occurring more frequently during NPDs. The correlation between the daily and DTR was significant during NPDs. Further, more days were selected when . A DTR of 10 °C can be used as a threshold to identify the meteorological conditions conducive to UHI development in Guangzhou. It is important to choose the typical days with full UHI Development in UHI research. We anticipate that the findings of this study will be useful for UHI studies, not only in Guangzhou but also in other cities. We suggest a greater focus on evaluations of this method and the DTR threshold in other cities with different climate conditions and properties.
Author Contributions
All three authors significantly contributed to the scientific study and writing. Conceptualization, S.Z.; Methodology, S.Z., Y.C. and G.C.; Supervision, Y.C.; Validation, S.Z.; data curation, N.L. and H.H.; Visualization, N.L. and H.H.; Writing—original draft, G.C. and M.H.; Writing—review & editing, G.C. and M.H. All authors have read and agreed to the published version of the manuscript.
Funding
This research was funded by the National Natural Science Foundation of China (Project No. 51708129, Project No. 51978173, Project No. 52008115) and the State Key Laboratory of Subtropical Building Science, South China University of Technology, China (Project No. 2018B19, Project No. 2021ZB08).
Data Availability Statement
The data presented in this study are available on request from the corresponding author.
Acknowledgments
Helpful comments from Lihua Zhao and Associate Xiaoshan Yang were greatly appreciated.
Conflicts of Interest
The authors declare no conflict of interest. The funders had no role in the design of the study; in the collection, analyses, or interpretation of data; in the writing of the manuscript, or in the decision to publish the results.
References
- Oke, T.R.; Mills, G.; Christen, A.; Voogt, J.A. Urban Climate; Cambridge University Press: London, UK, 2017. [Google Scholar]
- Santamouris, M.; Ding, L.; Fiorito, F.; Oldfield, P.; Osmond, P.; Paolini, R.; Prasad, D.; Synnefa, A.J.S.E. Passive and active cooling for the outdoor built environment—Analysis and assessment of the cooling potential of mitigation technologies using performance data from 220 large scale projects. Sol. Energy 2016, 154, 14–33. [Google Scholar] [CrossRef]
- He, B.; Wang, J.; Liu, H.; Ulpiani, G. Localized synergies between heat waves and urban heat islands: Implications on human thermal comfort and urban heat management. Environ. Res. 2020, 193, 110584. [Google Scholar] [CrossRef]
- Li, L.; Zha, Y.; Wang, R. Relationship of surface urban heat island with air temperature and precipitation in global large cities. Ecol. Indic. 2020, 117, 106683. [Google Scholar] [CrossRef]
- Oke, T.R. City Size and the Urban Heat Island. Atmos. Environ. 1973, 7, 769–779. [Google Scholar] [CrossRef]
- Chen, G.; Zhao, L.; Mochida, A. Urban Heat Island Simulations in Guangzhou, China, Using the Coupled WRF/UCM Model with a Land Use Map Extracted from Remote Sensing Data. Sustainability 2016, 8, 628. [Google Scholar] [CrossRef]
- Stewart, I.D.; Oke, T.R. Local climate zones for urban temperature studies. Bull. Am. Meteorol. Soc. 2012, 93, 1879–1900. [Google Scholar] [CrossRef]
- Zhou, D.C.; Zhao, S.Q.; Liu, S.G.; Zhang, L.X.; Zhu, C. Surface urban heat island in China’s 32 major cities: Spatial patterns and drivers. Remote Sens. Environ. 2014, 152, 51–61. [Google Scholar] [CrossRef]
- Rajagopalan, P.; Lim, K.C.; Jamei, E. Urban heat island and wind flow characteristics of a tropical city. Sol. Energy 2014, 107, 159–170. [Google Scholar] [CrossRef]
- Yang, X.; Yao, L.; Jin, T.; Peng, L.L.H.; Jiang, Z.; Hu, Z.; Ye, Y. Assessing the thermal behavior of different local climate zones in the Nanjing metropolis, China. Build. Environ. 2018, 137, 171–184. [Google Scholar] [CrossRef]
- He, B.; Ding, L.; Prasad, D. Enhancing urban ventilation performance through the development of precinct ventilation zones: A case study based on the Greater Sydney, Australia—ScienceDirect. Sustain. Cities Soc. 2019, 47, 101472. [Google Scholar] [CrossRef]
- He, B. Potentials of meteorological characteristics and synoptic conditions to mitigate urban heat island effects. Urban Clim. 2018, 24, 26–33. [Google Scholar] [CrossRef]
- Stewart, I.D. A systematic review and scientific critique of methodology in modern urban heat island literature. Int. J. Climatol. 2011, 31, 200–217. [Google Scholar] [CrossRef]
- Arifwidodo, S.D.; Tanaka, T. The Characteristics of Urban Heat Island in Bangkok, Thailand. Procedia Soc. Behav. Sci. 2015, 195, 423–428. [Google Scholar] [CrossRef]
- Unal, Y.S.; Sonuc, C.Y.; Incecik, S.; Topcu, H.S.; Diren-Ustun, D.H.; Temizoz, H.P. Investigating urban heat island intensity in Istanbul. Theor. Appl. Climatol. 2020, 139, 175–190. [Google Scholar] [CrossRef]
- Oke, T.R.; Maxwell, G.B. Urban heat island dynamics in Montreal and Vancouver. Atmos. Environ. 1975, 9, 191–200. [Google Scholar] [CrossRef]
- Leconte, F.; Bouyer, J.; Claverie, R.; Petrissans, M. Using Local Climate Zone scheme for UHI assessment: Evaluation of the method using mobile measurements. Build. Environ. Pollut. 2015, 83, 39–49. [Google Scholar] [CrossRef]
- Yang, X.; Chen, Y.; Peng, L.L.H.; Wang, Q. Quantitative methods for identifying meteorological conditions conducive to the development of urban heat islands. Build. Environ. 2020, 178, 106953. [Google Scholar] [CrossRef]
- Oke, T.R. An Algorithmic Scheme to Estimate Hourly Heat Island Magnitude. In Proceedings of the 2nd Urban Environment Symposium, Albuquerque, NM, USA, 2–6 November 1998. [Google Scholar]
- Skarbit, N.; Stewart, I.D.; Unger, J.; Gál, T. Employing an urban meteorological network to monitor air temperature conditions in the ‘local climate zones’ of Szeged, Hungary. Int. J. Climatol. 2017, 37 (Suppl. 1), 582–596. [Google Scholar] [CrossRef]
- Yang, X.S.; Yao, L.Y.; Peng, L.L.H.; Jiang, Z.D.; Jin, T.; Zhao, L.H. Evaluation of a diagnostic equation for the daily maximum urban heat island intensity and its application to building energy simulations. Energy Build. 2019, 193, 160–173. [Google Scholar] [CrossRef]
- Holmer, B.; Thorsson, S.; Lindén, J. Evening evapotranspirative cooling in relation to vegetation and urban geometry in the city of Ouagadougou, Burkina Faso. Int. J. Climatol. 2013, 33, 3089–3105. [Google Scholar] [CrossRef]
- Theeuwes, N.E.; Steeneveld, G.J.; Ronda, R.J.; Holtslag, A.A.M. A diagnostic equation for the daily maximum urban heat island effect for cities in northwestern Europe. Int. J. Climatol. 2017, 37, 443–454. [Google Scholar] [CrossRef]
- Yao, L.; Yang, X.; Zhu, C.; Jin, T.; Peng, L.; Ye, Y. Evaluation of a Diagnostic equation for the daily maximum urban heat island effect. Procedia Eng. 2017, 205, 2863–2870. [Google Scholar] [CrossRef]
- Kan, H.; London, S.J.; Chen, H.; Song, G.; Chen, G.; Jiang, L.; Zhao, N.; Zhang, Y.; Chen, B. Diurnal temperature range and daily mortality in Shanghai, China. Environ. Res. 2007, 103, 424–431. [Google Scholar] [CrossRef]
- Wang, K.; Ye, H.; Chen, F.; Xiong, Y.; Wang, C. Urbanization Effect on the Diurnal Temperature Range: Different Roles under Solar Dimming and Brightening. J. Clim. 2012, 25, 1022–1027. [Google Scholar] [CrossRef]
- Yang, J.; Liu, H.Z.; Ou, C.Q.; Lin, G.Z.; Zhou, Q.; Shen, G.C.; Chen, P.Y.; Guo, Y.J.E.P. Global climate change: Impact of diurnal temperature range on mortality in Guangzhou, China. Environ. Pollut. 2013, 175, 131–136. [Google Scholar] [CrossRef]
- Liu, W.; Yang, P.; You, H.; Zhang, B. Heat island effect and diurnal temperature range in Beijing area. Clim. Environ. Res. 2013, 18, 171–177. [Google Scholar]
- China Meteorological Bureau. China Standard Weather Data for Analyzing Building Thermal Conditions; China Building Industry Publishing House: Beijing, China, 2005; pp. 90–105.
- Shi, Y.; Xiang, Y.; Zhang, Y. Urban Design Factors Influencing Surface Urban Heat Island in the High-Density City of Guangzhou Based on the Local Climate Zone. Sensors 2019, 19, 3459. [Google Scholar] [CrossRef]
- Evans, J.D. Straightforward Statistics for the Behavioral Sciences; Brooks/Cole Publishing Company: Pacific Grove, CA, USA, 1996. [Google Scholar]
- Zhang, X.; Steeneveld, G.J.; Zhou, D.; Duan, C.; Holtslag, A.A.M. A diagnostic equation for the maximum urban heat island effect of a typical Chinese city: A case study for Xi’an. Build. Environ. 2019, 158, 39–50. [Google Scholar] [CrossRef]
- Miles, V.; Esau, I. Seasonal and Spatial Characteristics of Urban Heat Islands (UHIs) in Northern West Siberian Cities. Remote Sens. 2017, 9, 989. [Google Scholar] [CrossRef]
- Liu, W.; Ji, C.; Zhong, J.; Jiang, X.; Zheng, Z. Temporal characteristics of the Beijing urban heat island. Theor. Appl. Climatol. 2007, 87, 213–221. [Google Scholar] [CrossRef]
- Jiang, X.D.; Xia, B.C.; Guo, L.; Nan, L.I. Characteristics of multi-scale temporal-spatial distribution of urban heat island in Guangzhou. Chin. J. Appl. Ecol. 2007, 18, 133–139. [Google Scholar]


Publisher’s Note: MDPI stays neutral with regard to jurisdictional claims in published maps and institutional affiliations. |
© 2020 by the authors. Licensee MDPI, Basel, Switzerland. This article is an open access article distributed under the terms and conditions of the Creative Commons Attribution (CC BY) license (http://creativecommons.org/licenses/by/4.0/).