You are currently viewing a new version of our website. To view the old version click .
Sustainability
  • Article
  • Open Access

11 May 2020

Spatiotemporal Evaluation of Socio-Ecological-Economic System Vulnerability: A County-Level Analysis of Chongqing, China

,
and
1
School of Geography and Tourism, Chongqing Key Laboratory of GIS Application, Chongqing Normal University, Chongqing 401331, China
2
Chongqing Engineering Research Center for Remote Sensing Big Data Application, School of Geographical Sciences, Southwest University, Chongqing 400715, China
3
Research Base of Karst Eco-environments at Nanchuan in Chongqing, Ministry of Education, Chongqing 400715, China
*
Author to whom correspondence should be addressed.
This article belongs to the Special Issue Socio-Ecological Systems Sustainability

Abstract

The research on vulnerability can provide insights into social, economic, and ecological risks. Therefore, the objective of this work was to measure the degree of socio-ecological-economic system (SEES) vulnerability in Chongqing, one of the regions with the high constraint of natural conditions and human activity in the southwest of China. For this, by using three criteria and 40 indices based on the exposure-sensitive-adaptive capacity (ESC) model, an index system was designed. The entropy method was used to determine the weight of the indices. Furthermore, the composite index model and coefficient of variation were applied to evaluate the spatiotemporal characteristics of SEES vulnerability in the study area at the county level. The results showed that the average vulnerability index of SEES from 2005 to 2010 in Chongqing was 0.5735. The development pressure was high, and the ability to resist disturbance from external risks was low. Regional sustainable development was facing challenges. Spatial distribution of SEES vulnerability of Chongqing varied from high (moderately vulnerable or worse) in the western counties to low (mildly vulnerable) in the northeastern and southeastern areas with better ecological bases. The general vulnerability of the ecological and economic subsystems continues to decrease. However, the vulnerability of the social subsystem tended to initially decrease and then increase. Overall, the differences in the pattern of SEES vulnerability of the counties declined. Moreover, economic and social development tended to balance. This study is helpful to understand the overall trend and characteristics of vulnerability change and provides theoretical methods and reference opinions to support regional sustainable development.

1. Introduction

Vulnerability is a performance indicator for measuring risk, and it is one of the core elements of sustainable development [1]. The concept stems from the study of natural hazards in the 1970s [2]. In 1981, Timmerman introduced the concept of vulnerability into the field of geology for the first time in a climate study [3]. With more in-depth research, researchers believe the connotation of vulnerability has expanded from the early concept of endogenous vulnerability based on external risk hazards to a collection of concepts including natural, economic, social, and environmental factors [4,5]. The vulnerability was also defined by IPCC in 1996: the vulnerability refers to the extent to which vulnerable systems are damaged. It depends on their exposure, sensitivity, and adaptive capacity [6]. In recent years, scholars have obtained results on the vulnerability under the influence of specific disturbance factors such as resources related to climate change, droughts, tourism, and earthquakes [7,8,9,10,11]. A series of vulnerability evaluation methods such as the functional model, composite index, and BP (Back-Propagation) neural network methods have been formed [5]. With the development of the economy and society along with the rapid expansion of human activities, problems including the decline of natural resources, the intensification of environmental pollution, and the degradation of ecosystems have become increasingly prominent [12]. Therefore, the study of vulnerability has gradually transformed from exploring the vulnerability in the perspective of a single field such as society, economy, or ecology to assess socio-ecological-economic system (SEES) vulnerability [13]. The exposure sensitivity adaptive capacity (ESC) model takes the human–land coupling system as the object of analysis highlights the internal mechanism analysis of the vulnerability and points out the correlation between the vulnerability of regional society, economy, and ecosystems. At present, the ESC model has been widely recognized by researchers worldwide [14]. The study of the vulnerability of human–land system interactions is needed, focusing on the effects of human activities on vulnerability and paying more attention to comprehensive cross-disciplinary research of human–land and socio-ecological-economic coupling systems [15,16]. The economic, social, and eco-environmental factors have been selected to explore vulnerability issues at the national, regional, and provincial levels based on the resource–environment–society–economy coupling framework and pushed forward the study of vulnerability to a multi-dimensional coupling perspective [17,18,19,20,21,22]. At present, the vulnerability model based on the coupling model has not been formed as a unified theoretical norm in terms of the evaluation method or the evaluation index system. Vulnerability research of a human–land coupling system centered on the SEES is still a research focus in related disciplines [23,24]. Existing research results were reviewed, and most of these studies were based on national and regional macro-scale analysis units to study the vulnerability of coupling systems. Vulnerability research at the county scale remains feeble, as of political-economic unit with local characteristics are providing an effective way to understand the evolutionary trend of regional grassroots sustainable development. Therefore, it is of practical significance to study the vulnerability of society-ecological-economic systems using the county as a research unit [25,26].
As an important strategic fulcrum for the development of the western region of China and an important link between the One Belt One Road and the Yangtze River Economic Belt, Chongqing’s vulnerability issues in the rapid process of urbanization have threatened the regional sustainable development and ecological security. This has occurred because of the special natural environmental conditions and natural resource constraints of the region. The current research on vulnerability in Chongqing is limited to ecological vulnerability assessments of the karst area and of the Three Gorges Reservoir area [27,28]; few studies have analyzed SEES vulnerability based on the human–land coupling system. In the paper, the ESC model was adopted to construct a composite evaluation index system of SEES vulnerability in Chongqing from three aspects: society, ecology, and economy. The entropy method was used to determine index weight. Spatiotemporal characteristics of SEES vulnerability in Chongqing from 2005 to 2015, were studied to reveal the evolutionary mechanism of vulnerability in the study area in a county-level. The goal was to provide theoretical methods and reference opinions for improving the relationship between people and land in the region and to achieve regional sustainable development under the background of urbanization [29,30].

2. Study Area and Data Source

2.1. Study Area

Chongqing (105°11′–110°11′E, 28°10′–32°13′N) (Figure 1) experiences a humid subtropical monsoon climate and is located in the southeastern margin of the Sichuan Basin, in the upper reaches of the Yangtze River and the heartland of the Three Gorges Reservoir area. The dense river network in the region contains abundant biological, mineral, and water resources. The Three Gorges Reservoir area covers as much as 85.6% of the city. Mountains and hills dominate the territory, covering 70% of the area. The region features high mountains and deep valleys with horizontal and vertical gullies. This region experiences relatively frequent clouds and fog with insufficient radiation and light under the dual effects of topography and climate, resulting in frequent meteorological disasters such as droughts, floods, high winds, hail, high temperatures, as well as chilling and fog damage. In summer, geological hazards such as heavy rain cause frequent collapses, landslides, and mudslides. Some remote mountainous areas such as Chengkou county are mostly arable land with slopes exceeding 25°, which increases the hidden danger of soil erosion. In recent years, inappropriate human activities have aggravated environmental problems such as urban heat island effects and smog. Chongqing’s high energy consumption and high-pollution industries account for a large proportion of the pollution. Soil and water pollution caused by the improper use of pesticides and fertilizers in rural areas has further aggravated the environmental damage. The layout of the city itself is controlled by various landscape patterns so that the basic construction of railways, highways as well as urban and rural roads is difficult, and the level of development between regions remains uneven. The acceleration of urbanization has caused an excessive consumption of natural resources and a heavy invasion of the natural ecological space, which has exerted tremendous pressure on the ecosystem.
Figure 1. The study area.

2.2. Data Sources

The original basic data required for this study included both spatial and statistical data. The spatial data included: (1) digital elevation model (DEM) data from the geospatial data cloud platform (http://www.gscloud.cn/); (2) meteorological data from the monitoring data of 34 of China’s national meteorological stations in Chongqing, from which the average temperature and annual average rainfall of the counties from June to September were counted; (3) land use data from land-use coverage maps for the three phases of 2005, 2010, and 2015 collected from the national land department; (4) soil and water conservation data that meet the needs of this research; (5) vegetation coverage data. This last dataset originated from the Moderate Resolution Imaging Spectroradiometer Normalized Difference Vegetation Index (MODIS/NDVI) dataset with a time resolution of 16d and a spatial resolution of 500 m. These data were acquired from https://ladsweb.nascom.nasa.gov/, which was pre-processed with MRT (MODIS Reprojection Tool, MODIS Adaptive Processing System, LP DAAC, Sioux Falls, SD, USA) software. Then, batch projection, inlay, cropping, and resampling were performed under ArcGIS (ESRI, Redlands, CA, USA) to obtain Moderate Resolution Imaging Spectroradiometer Normalized Difference Vegetation Index time-series data for 2005, 2010, and 2015. All spatial data were based on the GIS software platform and statistical data on each county unit. The statistical data were acquired from the Chongqing Statistical Yearbooks for 2006, 2011, and 2016 released by the Chongqing Statistics Information Network and the Chongqing Municipal Water Resources Bulletin issued by Chongqing Water Resources Bureau in 2005, 2010, and 2015. All statistical data were finally connected to the property sheet through the space connection tool in ArcGIS (ESRI, Redlands, CA, USA).

3. Methods

3.1. Establishment of the Indicator System

Based on the vulnerability-related research results, we learned from the relatively mature ESC criteria in the vulnerability assessment (Table 1) and by using the county as an evaluation unit, we selected a total of 40 indicators (Table 2) of resources, environment, economy, and society to construct a framework system. This framework was consistent with the SEES vulnerability of Chongqing. We used the method of level difference standardization to standardize the data and eliminate the influence of dimension size on the results. We then used the entropy method to calculate the index weight value, which makes the result more scientifically sound and reasonable [31].
Table 1. Assessment criteria for vulnerability.
Table 2. Comprehensive evaluation index system of vulnerability.

3.2. Evaluation Model of SEES Vulnerability

3.2.1. Subsystem Vulnerability Index

Based on the previous research, this paper starts from the interaction between the elements that constitute vulnerability and regards the system as an attribute of a mutual coupling response between exposure-sensitivity and capacity. Using the raster calculator function of ArcGIS software, the sum of the product of the normalized value of each index and the corresponding value of the weight was taken as the vulnerability index value of each subsystem; this was calculated as follows:
S n = i = 1 m B i × Z i j
where Sn represents the vulnerability value of each subsystem; Bi is the weight of each indicator; Zij is the normalized value of indicator i in county j; and m is the number of indicators contained in each subsystem.

3.2.2. Composite Vulnerability Index

The composite vulnerability index (CVI) was calculated using Equation (2):
C V I = n = 1 p S n
where Sn is the vulnerability index value of each subsystem; p is the number of subsystems; and CVI is the composite vulnerability index value.

3.3. Vulnerability Classification

To facilitate the evaluation and comparison, the vulnerability values were standardized. Based on the standardized values of vulnerability, with 0.2 as the breakpoint, each subsystem vulnerability and composite vulnerability were all divided into five levels (Table 3).
Table 3. Grading standard of socio-ecological-economic system (SEES) vulnerability in Chongqing.

3.4. Vulnerability Spatial Variability

Coefficient variation was used to analyze the spatial variation of vulnerability in the study area The formulation was as follows:
C v = 1 X ¯ i = 1 n ( X i X ¯ ) 2 n 1 × 100 %
where Cv is the coefficient of variation; X ¯ is the average of the vulnerability index of each county; Xi is the vulnerability index of each county unit i (i = 1, 2, 3...n); and n is the number of counties. The smaller the coefficient of variation, the smaller the difference in vulnerability is within the region.

4. Results

4.1. Ecological System Vulnerability

Northeastern counties of Chongqing such as Chengkou and Wuxi and southeastern counties such as Youyang have well-developed water systems, high levels of vegetation coverage, abundant natural resources, a good ecological background, and relatively small populations (Figure 2). The risks caused by human activities are limited, and the counties have been in slightly and mildly vulnerable states in these three years; the moderately vulnerable areas are mostly distributed in economically developed counties such as the western counties of Chongqing and the nine districts in the core of the city. In recent years, rapid urbanization has led to a sharp increase in population and a sharp decline in resources in Chongqing. In addition to large-scale industrialization, the natural environment has deteriorated dramatically. Some of the western counties of Chongqing, such as Yongchuan, Bishan, and Rongchang, are in extremely vulnerable states in the study period. Western Chongqing has limited water resources; nevertheless, this densely populated area serves as an important agricultural area. Between 2005 and 2010, the high rates and increases in energy consumption and the introduction of enterprises producing large amounts of pollutants in western Chongqing, which has created problems related to water use and pollution as well as increased pressure on resources. Serious environmental damage has led to a moderately to highly vulnerable state in the overall Chongqing western region. After the implementation of a new round of promoting the development in western China, western Chongqing quickly adjusted its industrial structure, rationally developed resources, and paid more attention to protect the environment. The resource and environmental vulnerability have improved by 2015. However, the nine districts in the core of the city, especially Dadukou, have low vegetation coverage, dense populations, and low per capita food production. Meanwhile, these counties have smaller per capita water resources than other counties while the human activities are intense causing a moderately vulnerable state to exist or worse in some areas. From 2005 to 2015, a series of ecological projects have been carried out in the middle and upper reaches of the Yangtze River, such as returning farmland to forests and closing hillsides and afforestation ecological projects. The arable land resources of all counties were effectively protected to alleviate soil erosion. Therefore, the intensity of non-point source agricultural pollution was reduced, and the pollution was controlled. The overall environmental conditions have improved, and resource and environmental vulnerability have tended to decrease.
Figure 2. Ecological system vulnerability grade. (a) 2005; (b) 2010; (c) 2015.

4.2. Social System Vulnerability

Between 2005 and 2015, social vulnerability showed a trend of decreasing first and then increasing (Figure 3). From 2005 to 2010, with the rapid development of the economy and society, the number of employees increased while the number of various types of service facilities, such as roads, railways, and health care facilities increased. The ability of society to cope with risks and hazards increased, while the social vulnerability index fell from 0.6376 to 0.4793 and reached a state of moderate vulnerability. For example, Wanzhou is located in the heartland of the Three Gorges Reservoir area. Here in the central part of Chongqing and the upper reaches of the Yangtze River, it has airports, railways, highways, deep-water port terminals, and customs ports giving it strong road traffic advantages. In addition, the natural population growth rate fell from 5.6% in 2005 to 2.2% in 2010, reducing population pressure; by 2010, the society of Wanzhou was in a state of slight vulnerability. However, as urbanization has accelerated, the southeastern and northeastern areas of Chongqing have been affected by their topography and landforms making urban and rural roads difficult to construct. With high construction costs and excessive delays during construction, inadequate infrastructure planning and construction have resulted. The scale of urbanized land has expanded excessively with a concurrent surge in population growth so that employment pressure has increased. By 2015, the total social vulnerability index had increased to 0.7231 so that the overall situation is highly vulnerable and the level of vulnerability has increased significantly.
Figure 3. Social system vulnerability grade. (a) 2005; (b) 2010; (c) 2015.

4.3. Economic System Vulnerability

The pattern of economic vulnerability for counties in Chongqing has changed significantly, with an overall decreasing trend (Figure 4). In 2005, except for the central area of Chongqing, which was in a state of moderate vulnerability, the economies of counties in southeastern and northeastern Chongqing were extremely vulnerable. As the core city of the Chengdu–Chongqing Economic Zone and the Yangtze River Economic Belt, Chongqing has experienced rapid economic development. By 2010, economic vulnerabilities of western Chongqing and the nine districts in the core of the city have reduced. However, agriculture supports the economy of the southeastern and northeastern regions of Chongqing Province. The secondary and tertiary industries in these regions are developing slowly, so the economic vulnerability has decreased slowly meaning conditions have improved. By 2015, with the implementation of a new round of the western development strategy, the economic structure of the western region has been adjusted; the economic vulnerabilities in the western part and the nine districts in the core area of the Chongqing have a rapid reduction. The development of southeastern and northeastern regions of Chongqing highly relied on their forestry, animal, and plant resources. More attention has been paid to the development of the economy that depends on sound ecological management in these regions. Projects designed to improve forest quality on both sides of the Yangtze River were also implemented carefully. These southeastern and northeastern regions of Chongqing have carefully considered the ecological reality of these counties and developed eco-tourism and a forest-based economy based on the local conditions. For example, Zhong County has developed a citrus industry and Wushan created a Hongye (foliage) Economy (The Hongye economy refers to the tourist attractions of Hongye based on the red leaves of Wuxia in Wushan County.). In addition, the forestry industry chain extended, and the forest product processing and forest food finishing industries have become moderately developed. The proportion of industrial economic production such as forestry output value has increased, which drove economic development. Moreover, the increase in per capita gross domestic product, and the disposable income of urban and rural residents so that the economic vulnerability index of each county has fallen sharply. In the process of an evolving economic structure, the economic vulnerability of each county related to the distance from the city center. Those counties that are closer to the city center have seen a more rapid reduction in economic vulnerability. In addition, the cities with convenient transportation, such as the Wanzhou, rely on the advantages of their good locations, causing their economic vulnerability to decrease faster than other locations.
Figure 4. Economic system vulnerability grade. (a) 2005; (b) 2010; (c) 2015.

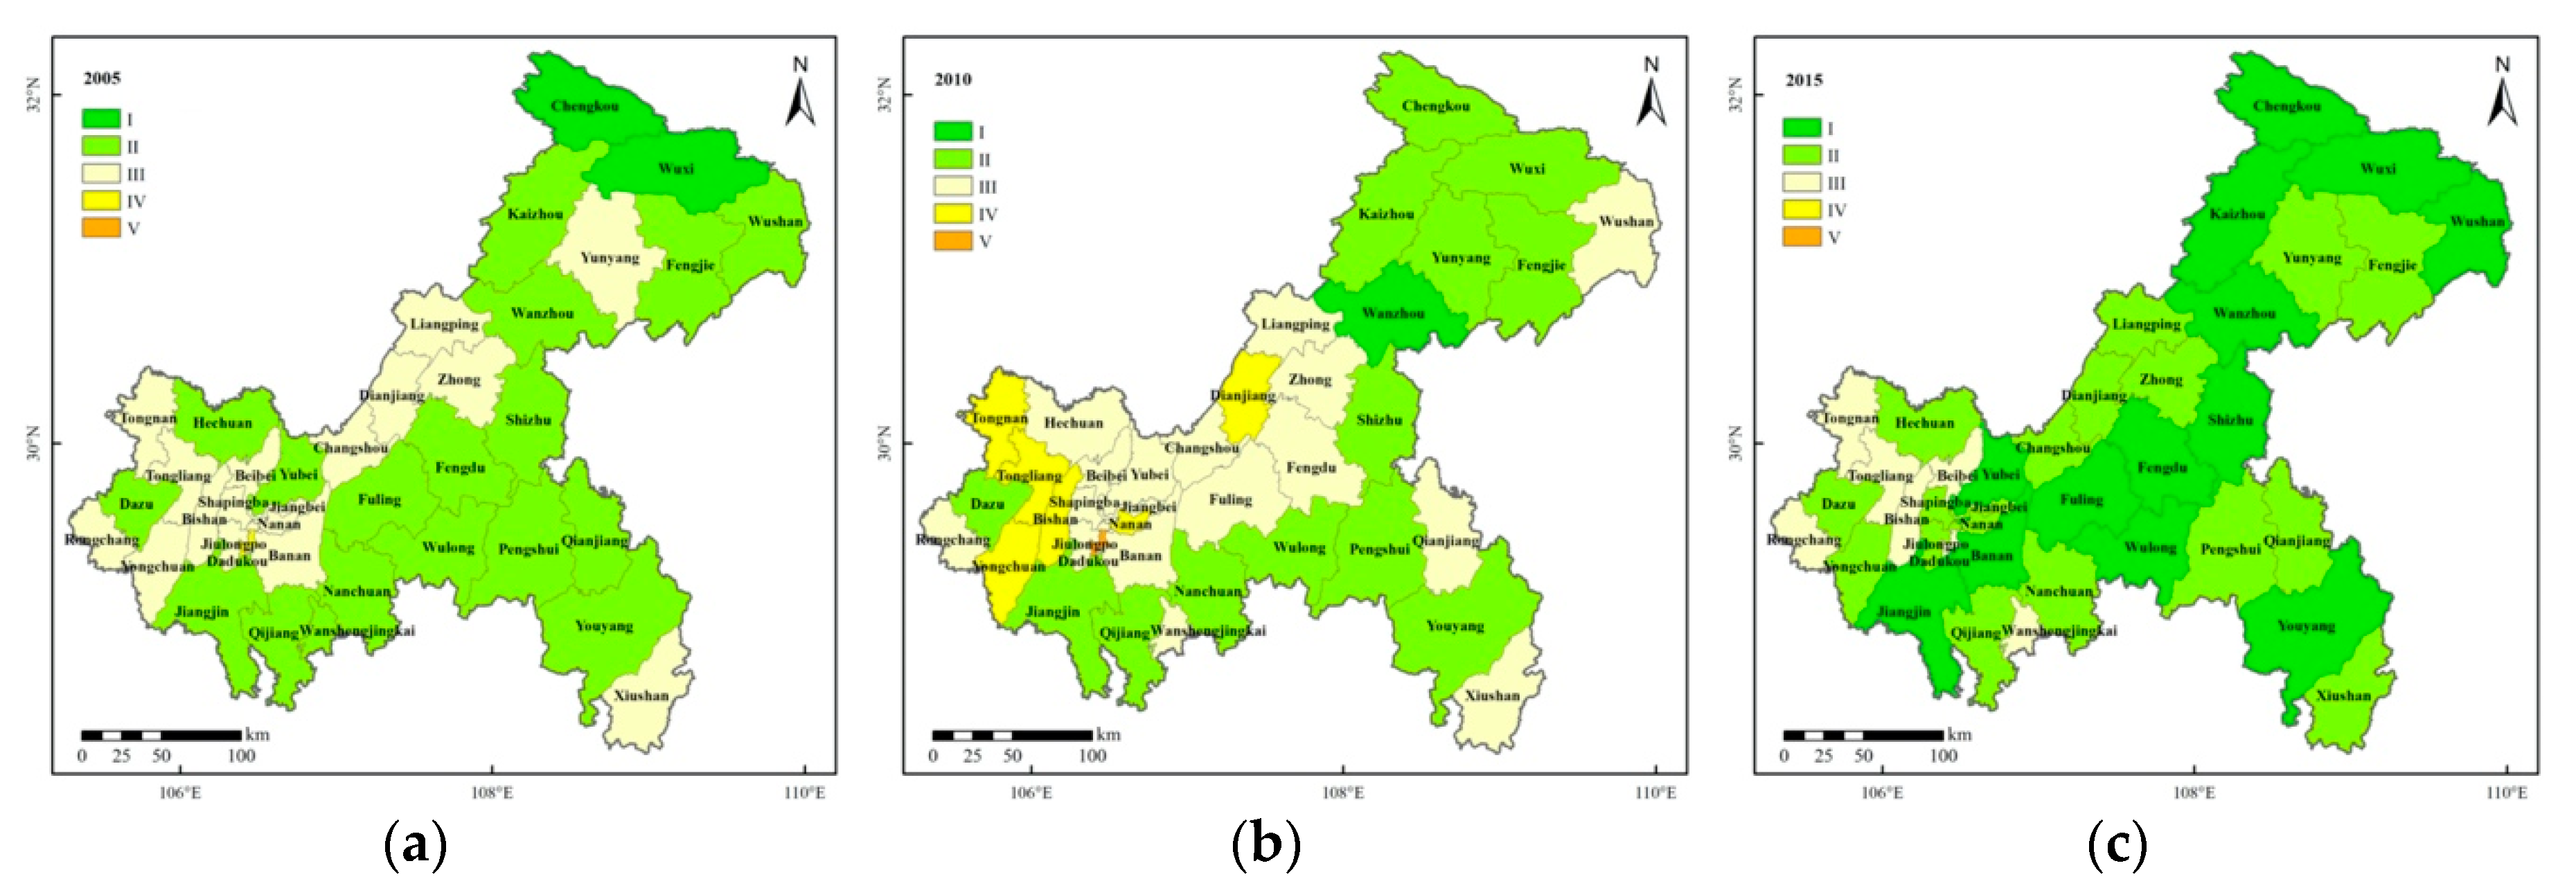
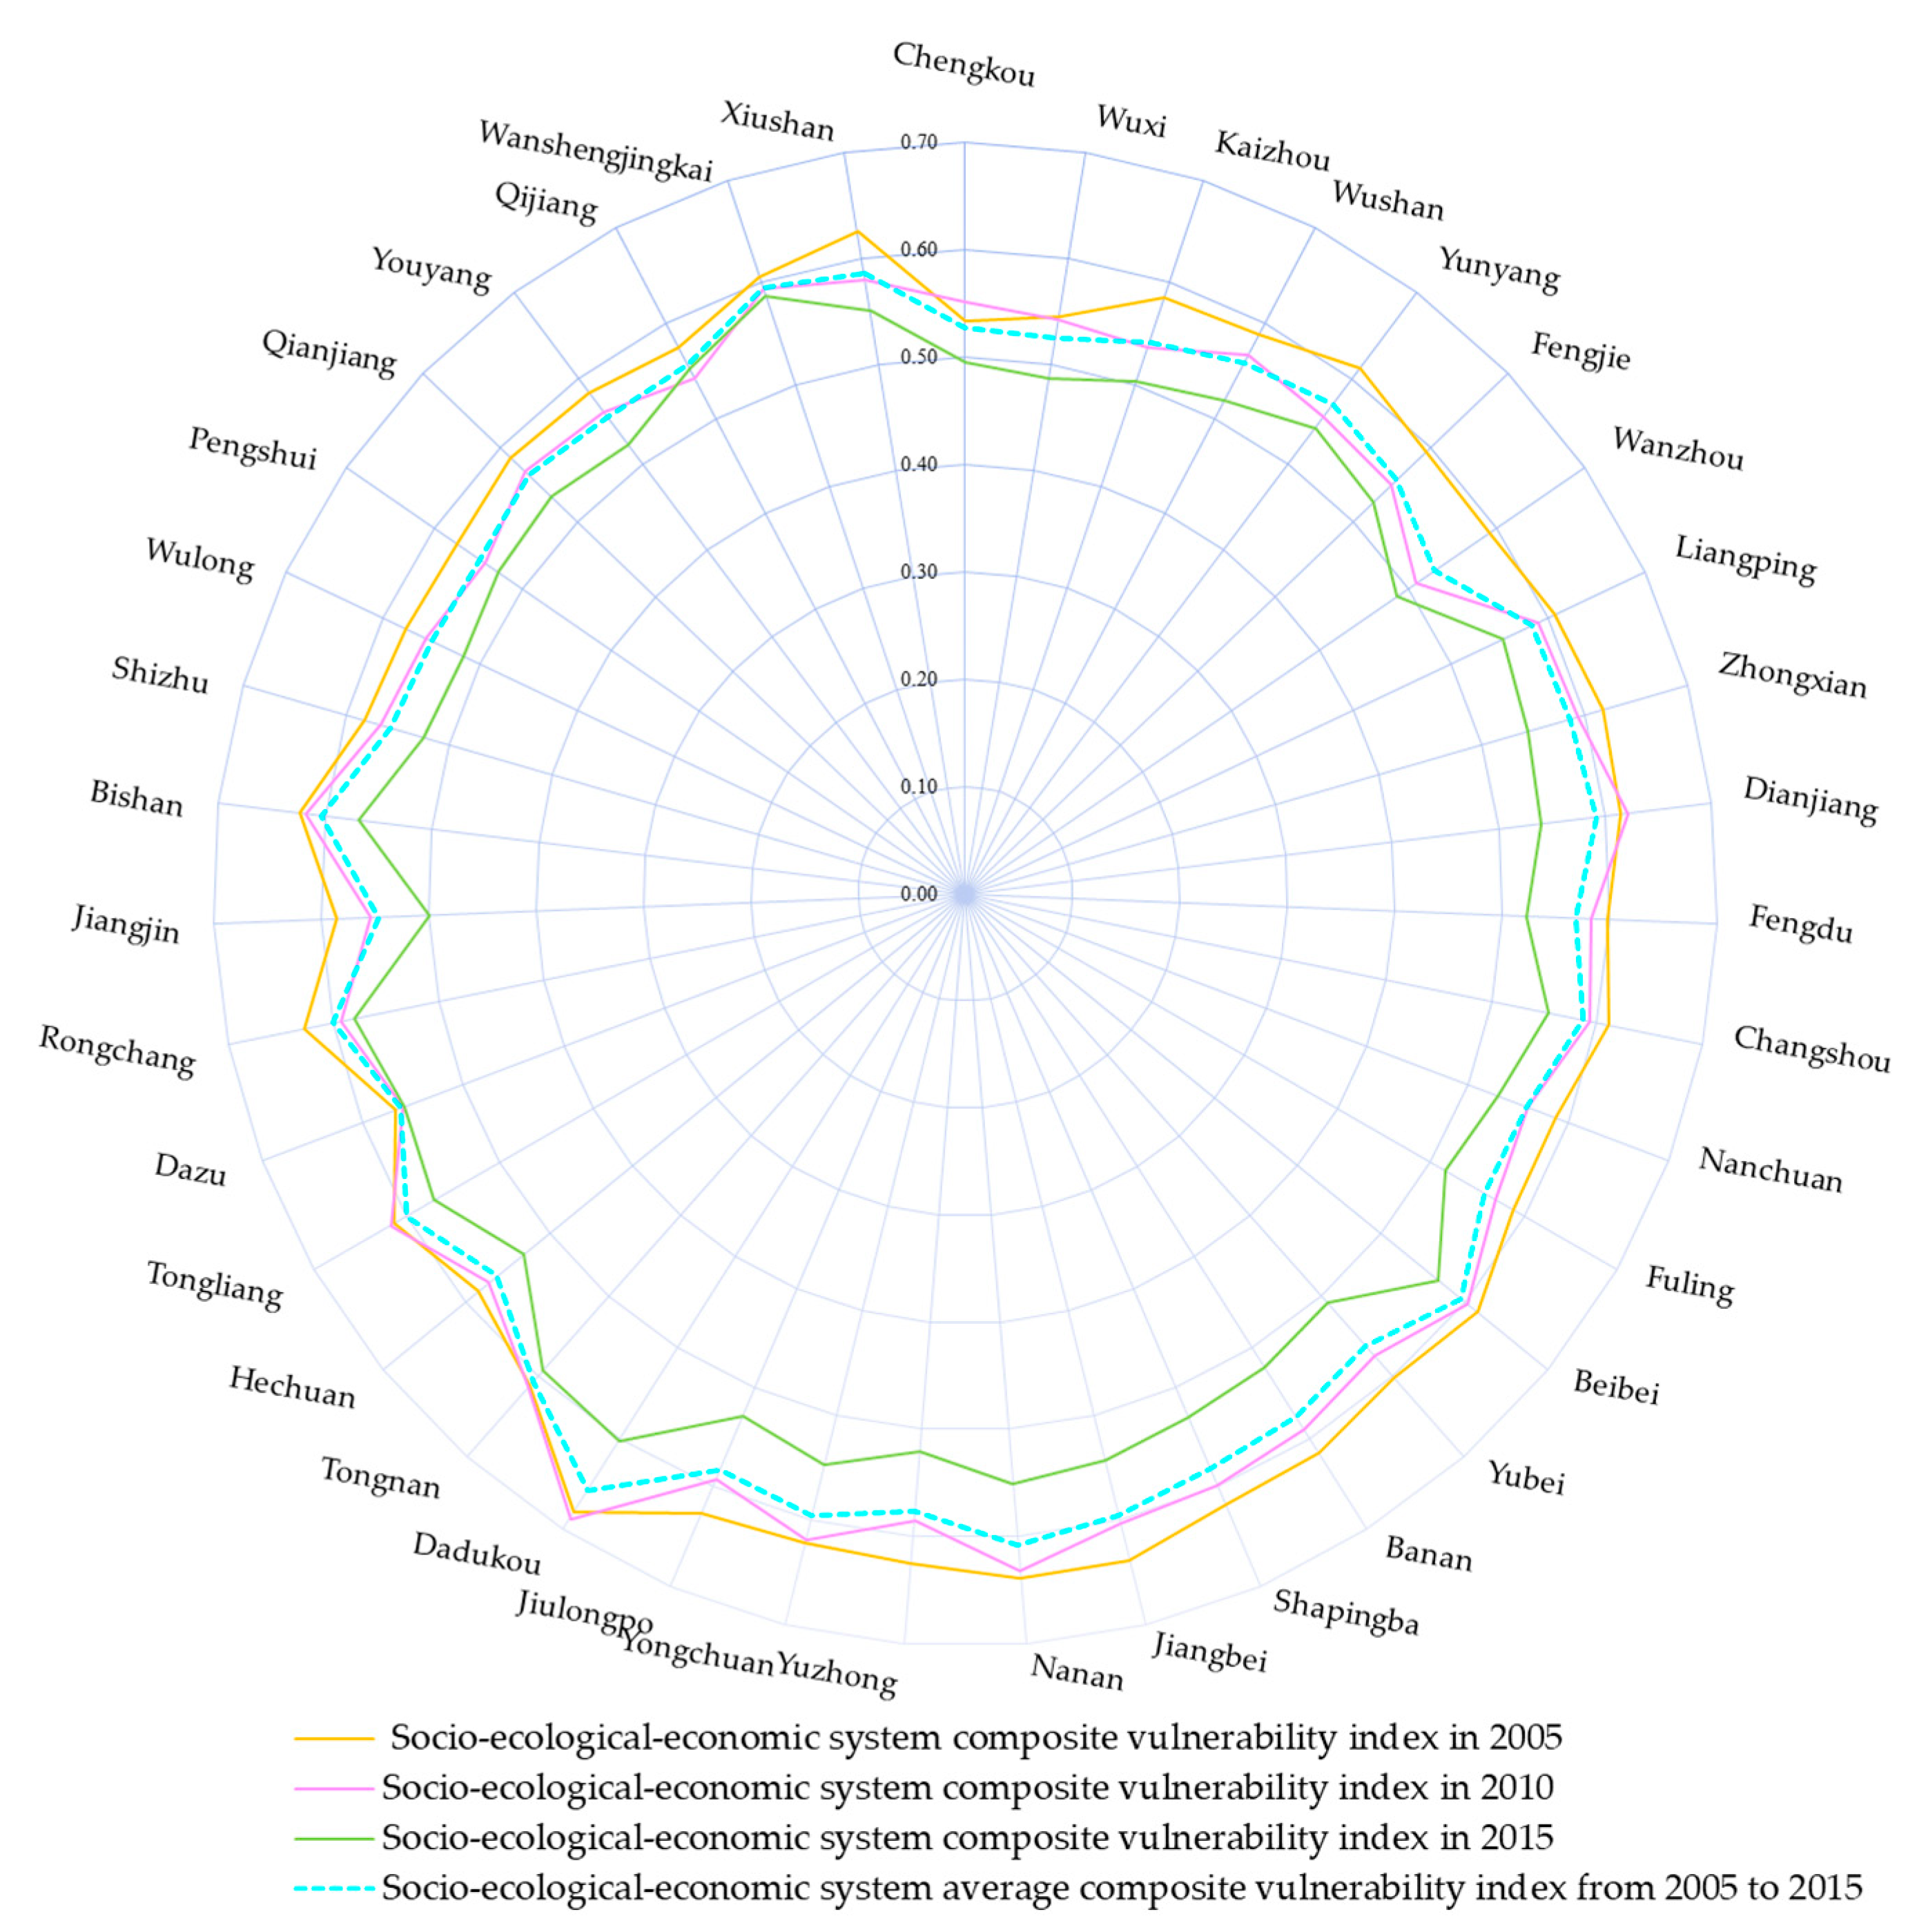
4.4. SEES Composite Vulnerability

SEES vulnerability of Chongqing, in general, has experienced a decreasing trend, which is a positive outcome. According to the calculated SEES vulnerability index, the average three-year vulnerability of counties in Chongqing is 0.5735, which is generally in a moderately vulnerable state. SEES vulnerability degree of various counties in Chongqing has generally decreased from 2005 to 2015 (Figure 5 and Figure 6). Apparent spatial variation in the vulnerability of counties has evolved. In 2005, 17 counties experienced a state of moderate vulnerability; these were mainly concentrated in western Chongqing. Except for the counties of Fengjie, Liangping, Zhong, and Xiushan, the northeastern and southeastern regions of Chongqing were generally in a state of mild vulnerability. Chengkou and Wuxi in northeastern Chongqing have the lowest vulnerability, with Dadukou being the most vulnerable area of the nine districts in the core of the city.
Figure 5. SEES composite vulnerability grade. (a) 2005; (b) 2010; (c) 2015.
Figure 6. SEES composite vulnerability index of each county from 2005 to 2015.
Between 2005 and 2010, with rapid economic development and expansion of urbanization, the urban population surged, while the contradiction between the needs of people and land became more prominent. In a short period, the level of environmental public facilities and services could not be improved rapidly enough to meet the increasing need. In the process of urbanization, natural factors and the effects of inappropriate human behavior have created a series of ecological and environmental problems. These issues have led to the development of the counties of Tongnan, Tongliang, Yongchuan, and Bishan, as well as Dianjiang in western Chongqing, evolving from a moderately vulnerable state in 2005 to a highly vulnerable condition. The vulnerability of Chengkou and Wuxi in northeastern Chongqing increased, and the Dadukou became a highly vulnerable area, which seriously threatens the sustainability of development in the region. Following the views, Chongqing City has paid an increasing level of attention to the protection of the environment while developing the economy and has carried out a large number of ecological restoration projects. By 2015, the vulnerability of Chongqing has substantially reduced, including the 14 counties of the city such as Chengkou and Wuxi counties which are slightly vulnerable areas, while the environmental conditions have improved. Except for seven counties, including Wansheng and Dadukou in western Chongqing, that are still in a state of moderate vulnerability, the other counties of Chongqing are in a state of mild vulnerability, which is very beneficial to the sustainable development of the county. Dadukou is densely populated but has a relatively small amount of resources per capita. Here, SEES vulnerability has always been in a moderately high vulnerable state under the combined influence of multiple factors, which pose challenges to the socioeconomic development of this region.

4.5. Spatial Variability of Vulnerability

Based on SEES vulnerability indices of each county in Chongqing calculated for 2005, 2010, and 2015 along with the vulnerability index of each subsystem, the coefficient of variation was used to measure the spatial variation in vulnerability in each of these three years (Table 4). The results show that under the influence of a significant increase in social and economic vulnerability in 2005–2010, the pattern of the SEES vulnerability of Chongqing has varied more widely in more recent years, and the variation has increased. From 2010 to 2015, with a new round of implementing a western development strategy, the economic, resource, and environmental vulnerabilities have improved, so that the degree of SEES vulnerability in the region has improved overall, and the regional vulnerability has decreased which improves the conditions; nevertheless, the reduction in vulnerability has been relatively small.
Table 4. Coefficient variation of vulnerability in 2005, 2010, and 2015.
Between 2005 and 2010, under the influence of the implementation of a western development strategy in western Chongqing and the nine districts in the core of the city, the economy and society have developed rapidly. Basic facilities such as medical and healthcare institutions have gradually improved. The educational opportunities have improved while the number of students in primary and secondary schools has increased; as well, literacy has also improved. The northeastern and southeastern parts of Chongqing are affected by topography, causing economic and social development to be relatively slow. However, the overall social and economic conditions of the counties have improved, which reduces their vulnerability to adverse conditions and disasters. Nevertheless, the differences in the pattern of economic and social vulnerability of the counties are widening. In the process of economic development, some natural resources and environmental conditions in western Chongqing have been heavily degraded with increased pressure on natural resources, causing the development of a medium-high area of vulnerability, which has narrowed the spatial gap of vulnerability. After 2010, the population of Chongqing increased sharply, and the proportion of the population exposed to sensitivity factors increased, especially for women. Meanwhile, the needed infrastructure such as transportation and medical care facilities has not been developed at a rate to meet the needs of the people, causing the overall social vulnerability of these counties to worsen and narrowing the difference in the pattern of social vulnerability. With the implementation of a new round of the Western Development Strategy, each county has relied more on its natural resource base, rationally used local resources to develop different industries, and paid more attention to environmental protection. Therefore, environmental conditions have improved and the differences in the spatial pattern of economic, resource, and environmental vulnerability have increased.

5. Discussion

A recent trend among vulnerability assessments has been to expand considerations to include social, economic determinants of vulnerability [13]. The social, economic, and ecological systems were synthetically considered as a coupling system. The vulnerabilities of each subsystem and coupling system were all assessed in this paper, which enhances the feasibility of the vulnerability study. The results of this study have generated a useful tool for risk prevention through vulnerability maps. They have been using in Chongqing that actively works on territorial and spatial planning.
The evaluation index system is the key to vulnerability assessment [33,34]. Comprehensively referring to some literature, 40 indices have been selected in this paper, which covers the exposure, sensitivity, and adaptability of ecological, social, and economic systems. The index system ensures the comprehensiveness nature of the indicators as far as possible, and to a certain extent to ensure the scientific nature of the research results.
The vulnerability of Chongqing is mostly discussed by a single perspective, such as landscape patterns, water resources, ecology, economy, urban heat island vulnerability, etc. Therefore, it is difficult to compare the SEES vulnerability in Chongqing to the literature, but the vulnerability of each subsystem can be tested. In the study area, the vulnerability of the ecological subsystem increases first and then decreases, and the vulnerability in the west is higher than that of the east, which is consistent with the research results of Ma et al. [28]. The vulnerability of the social subsystem shows a decreasing first and then that of an increasing trend. The vulnerability of the economic subsystem illustrates a continuously decreasing characteristic and in the space, the vulnerability in the east, the underdeveloped mountainous area, is higher than it in the west. These results are consistent with the research of Zhang et al. [35].
The results of this study showed that a series of ecological projects, such as returning farmland to forest, forest closure, and soil erosion control, were the main reasons for the significant improvement of ecological system vulnerability in the study area [36]. In addition, industrial structure adjustment, people’s awareness of ecological environmental protection has played a positive role in ecosystem improvement. The rapid urbanization process leads to the rapid population aggregation, but the inadequate planning and construction of infrastructure are an important factor affecting the vulnerability of social systems [37]. The rapid development of the regional economy has effectively alleviated the vulnerability of the economic system and made it continuously reduced [10]. At the same time, the distance from the regional center has an important impact on the spatial differentiation of the vulnerability of the economic system. As a coupling system, reducing vulnerability is for regional sustainability. For this, ecological protection is the prerequisite, economic development is the pathway, and social progress is the aim. Because of the high ecological sensitivity in this region, the ecological resource conditions should be determined based on the ecological carrying capacity. More attention should be paid to the development of the economy that depends on sound ecological management, and a harmonious eco-economic system is necessary for these regions. With the development of the economy, the welfare of residents including education, health, and public services will be improved. The eco-environment will also be well protected because of the increment of investment in ecological protection [38]. The goal of sustainability will be achieved in the end.
In this paper, the data of social and economic indices were collected from the Chongqing Statistical Yearbook. All these data are all at the county level. The vulnerability has a certain scale dependence effect [37]. Therefore, they can only depict the overall vulnerability characteristics of the SEES in each county of Chongqing and fail to analyze the heterogeneity of the vulnerability within the county. In the future, the direction of this paper would be extended from county units to grid units, as well as to deeply analyze the spatial differentiation characteristics of the vulnerability of regional man-land coupled systems.

6. Conclusions

Based on the ESC model, an index system with 40 indices has been designed. The composite index model and coefficient of variation were used to evaluate the spatiotemporal characteristics of SEES vulnerability in Chongqing at the county level. The main conclusions are as follows: (1) The average SEES vulnerability index from 2005 to 2015 in Chongqing was 0.5735, which is in a moderately vulnerable state. Pressure from social-ecosystem development in the study area was relatively high and the ability to withstand external risks was low. The sustainable development of this region is facing challenges. (2) The spatial distribution of SEES vulnerability of Chongqing characterized as being high (moderately vulnerable or worse) in the western counties and low (mildly vulnerable) in the northeastern and southeastern areas with better ecological bases. (3) Each subsystem features obvious temporal and spatial variation characteristics. The general vulnerability of ecological and economic subsystems continues to decrease, and the vulnerability of social subsystems tended to initially decrease and then increase. (4) The vulnerability of each subsystem shows obvious regional differentiation patterns. Overall, the differences in the pattern of SEES vulnerability of the counties declined. Economic and social development tended to balance.
This study focused on the issue that the evaluation of social-ecological-economic coupling system vulnerability in the area with the high constraints of natural conditions and human activities at a county level. A scope expansion of the specific vulnerability assessment index system was provided, which might help to improve the theoretical method for the assessment of sustainable development. This study started with the coupling human–land system, concentrating not only on the risk itself but also on the adaptive capacity to address the risk. Its comprehensive assessment system with the three dimensions of “exposure, sensitivity, and adaptive capacity,” of practical significance for eco-environmental protection and socioeconomic development. This study is helpful to understand the overall trend and characteristics of vulnerability change and provides theoretical methods and reference opinions to support regional sustainable development.

Author Contributions

Conceptualization, C.L., Q.H., and Y.L.; methodology, Q.H.; writing—original draft preparation, C.L. and Q.H.; writing—review and editing, Y.L.; funding acquisition, Y.L. All authors have read and agreed to the published version of the manuscript.

Funding

This research was funded by the National Science Foundation of China, grant number 41571419.

Conflicts of Interest

The authors declare no conflict of interest.

References

  1. Adger, W.N. Vulnerability. Glob. Environ. Chang. 2006, 16, 268–281. [Google Scholar] [CrossRef]
  2. Janssen, M.A.; Schoon, M.L.; Ke, W.; Börner, K. Scholarly networks on resilience, vulnerability and adaptation within the human dimensions of global environmental change. Glob. Environ. Chang. 2006, 16, 240–252. [Google Scholar] [CrossRef]
  3. Hasibagen; Li, T.S.; Tong, B.Q. Man-land system vulnerability and development model of ecological regions. Econ. Geogr. 2013, 33, 149–154. [Google Scholar]
  4. Barking, J. Risk and vulnerability indicators at different scales: Applicability, usefulness and policy implications. Environ. Hazards 2007, 7, 20–31. [Google Scholar]
  5. Füssel, H.M.; Klein, R.J. Climate change vulnerability assessments: An evolution of conceptual thinking. Clim. Chang. 2006, 75, 301–329. [Google Scholar] [CrossRef]
  6. IPCC. Climate Change. The IPCC Second Assessment Report; Cambridge University Press: Cambridge, UK, 1996. [Google Scholar]
  7. Connelly, A.; Carter, J.; Handley, J.F.; Hincks, S. Enhancing the Practical Utility of Risk Assessments in Climate Change Adaptation. Sustainability 2018, 10, 1399. [Google Scholar] [CrossRef]
  8. Yang, J.; Guan, Y.Y.; Li, X.M.; Xi, J.C. Urban fringe area ecological vulnerability space-time evolution research: The case of Ganjingzi district, Dalian. Acta Ecol. Sin. 2018, 38, 778–787. [Google Scholar]
  9. Chen, J.; Yang, X.J.; Yin, S.; Wu, K.S.; Deng, M.Q.; Wen, X. The vulnerability evolution and simulation of social-ecological systems in a semi-arid area: A case study of Yulin City, China. J. Geogr. Sci. 2018, 28, 152–174. [Google Scholar] [CrossRef]
  10. Su, F.; Chu, Y.T.; Zhang, P.Y. Analysis of economic vulnerability and obstacle factors of typical tourism cities in China. Econ. Geogr. 2013, 33, 189–194. [Google Scholar]
  11. Zhang, L.L.; Zheng, X.Q.; Zhang, C.X.; Lv, Y.Q. Early-warning of urban vulnerability in Tangshan city based on variable weight model. J. Nat. Resour. 2016, 31, 1858–1870. [Google Scholar]
  12. Zhou, W.Q.; Wang, K.; Yu, W.J.; Li, W.F.; Han, L.J.; Qian, Y.G. Understanding the social and ecological connections between cities and surrounding regions for urban and regional sustainability. Acta Ecol. Sin. 2017, 37, 5238–5245. [Google Scholar]
  13. Jonathan, W.L.; Ashley, S.E. Shifting perspectives in assessing socio-environmental vulnerability. Sustainability 2020, 12, 2625. [Google Scholar]
  14. Li, T.Y. Spatial vulnerability based on the framework of the exposure-sensitivity-adaptive capacity: A case study of Lanzhou. Econ. Geogr. 2017, 37, 86–95. [Google Scholar]
  15. Fang, X.Q.; Yin, P.H. Review on the three key concepts of resilience, vulnerability and adaptation in the research of global environmental change. Prog. Geogr. 2007, 26, 11–22. [Google Scholar]
  16. Li, J.; Zhao, R.F.; Xie, Z.L. The comprehensive assessment of vulnerability in social-ecological system of Gansu province. Econ. Geogr. 2015, 35, 168–175. [Google Scholar]
  17. Frazier, T.G.; Thompson, C.M.; Dezzani, R.J. A framework for the development of the SERV model: A spatially explicit resilience-vulnerability model. Appl. Geogr. 2014, 51, 158–172. [Google Scholar] [CrossRef]
  18. Bhattarai, K.; Conway, D. Urban vulnerabilities in the Kathmandu valley, Nepal: Visualizations of human/hazard interactions. J. Geogr. Inform. Syst. 2010, 2, 63–84. [Google Scholar] [CrossRef]
  19. Fang, C.L.; Wang, Y. A comprehensive assessment of urban vulnerability and its spatial differentiation in China. Acta Geogr. Sin. 2015, 70, 236–247. [Google Scholar] [CrossRef]
  20. Zhao, L.; Wang, W.; Zhang, Y.S. The Spatio-temporal evolution about urban vulnerability on the northeast region since northeast revitalization. Econ. Geogr. 2014, 34, 69–77. [Google Scholar]
  21. Lu, D.M.; Shi, Y.Z.; Li, W.L.; Yang, X.J. Spatiotemporal change of vulnerability in counties of northwest China. Prog. Geogr. 2017, 36, 405–415. [Google Scholar]
  22. Tian, Y.P.; Chang, H. Bibliometric analysis of research progress on ecological vulnerability in China. Acta Geogr. Sin. 2012, 67, 1515–1525. [Google Scholar]
  23. Tian, Y.P.; Xiang, Q.C.; Wang, P. Regional coupled human-natural systems vulnerability and its evaluation indexes. Geogr. Res. 2013, 32, 55–63. [Google Scholar]
  24. Wen, X.L.; Yang, X.L.; Wang, Z.Q. Assessment on the vulnerability of social-ecological systems in a mountainous city depending on multi-targets adaption. Geogr. Res. 2016, 35, 299–312. [Google Scholar]
  25. Wei, X.X.; Zhao, J.; Wei, W.; Jie, B.B. Spatial and temporal changes of ecological vulnerability per county unit in China. Acta Sci. Circumstantiac. 2016, 36, 726–739. [Google Scholar]
  26. Chen, X.H.; Zhou, H.H.; Wang, X. The Vulnerability and coordination of the coupling of environment, economy and society in county: A case of Qiqihar city of Heilongjiang Province. Hum. Geogr. 2018, 33, 94–101. [Google Scholar]
  27. Guan, D.J.; Su, W.C.; Wang, H.J. Eco-environment vulnerability assessment of karst regions in Chongqing. Res. Agric. Mod. 2006, 27, 432–435. [Google Scholar]
  28. Ma, J.; Li, C.X.; Wei, H.; Ma, P.; Yang, Y.J.; Ren, Q.S.; Zhang, W. Dynamic evaluation of ecological vulnerability in the Three Gorges Reservoir region in Chongqing Municipality, China. Acta Ecol. Sin. 2015, 35, 7117–7129. [Google Scholar]
  29. Li, H.L.; Ma, B.B.; Xue, D.Q.; Jiang, J.; Liu, J.H. The spatial differentiation and determinants of urban vulnerability in northwest China under the background of the silk road economic belt. Econ. Geogr. 2018, 38, 66–73. [Google Scholar]
  30. Li, P.X.; Fan, J. Regional ecological vulnerability assessment based on VSD model: A case study of Xijiang river economic belt in Guangxi. J. Nat. Resour. 2014, 29, 779–788. [Google Scholar]
  31. Du, T.; Xie, X.J.; Liang, H.Y.; Huang, A.; Han, Q.F. County economy comprehensive evaluation and spatial analysis in Chongqing city based on entropy weight-TOPSIS and GIS. Econ. Geogr. 2014, 34, 40–47. [Google Scholar]
  32. Li, J.; Liao, H.P.; Cai, J.; Li, T.; Zhang, T. Distribution Characteristic on Terrain Gradient of Land Use Pattern and Change in the Fringe of Mountainous Cities: A Case Study of Banan District in Chongqing. Resour. Environ. Yangtze Basin 2018, 27, 296–305. [Google Scholar]
  33. Rabby, Y.W.; Hossain, M.D.B.; Hasan, M.U.I. Social vulnerability in the coastal region of Bangladesh: An investigation of social vulnerability index and scalar change effects. Int. J. Disaster Risk Reduct. 2019, 41, 101329. [Google Scholar] [CrossRef]
  34. Liu, S.; Ge, J.; Li, W.M.; Bai, M. Historic environmental vulnerability evaluation of traditional villages under geological hazards and influencing factors of adaptive capacity: A district-level analysis of Lishui, China. Sustainability 2020, 12, 2223. [Google Scholar] [CrossRef]
  35. Zhang, Q.J. Vulnerability evaluation of the tourism economic system in western regions. Commer. Res. 2015. [Google Scholar]
  36. Yang, Q.; Liu, Q.; Yin, S.; Zhang, J.; Yang, X.; Gao, Y. Vulnerability and influencing factors of rural transportation environment in Qinling-Daba mountainous areas: A case study of Luonan county in Shaanxi province. Acta Geogr. Sin. 2019, 74, 1236–1251. [Google Scholar]
  37. Xu, Z.; Jing, Y.D.; Bi, R.T.; Gao, Y.; Wang, P. The discovery of spatial association patterns of resource and environment information based on grid data. J. Geog. Geoinf. Sci. 2018, 20, 28–36. [Google Scholar]
  38. Wang, C.; Li, H.Y.; He, Y.Z.; Ma, X.S.; Zhou, M.M. Sustainable development ability and its spatiotemporal differentiations of rural human settlements in Chongqing Municipality from 1997 to 2015. Prog. Geogr. 2019, 38, 556–566. [Google Scholar]

Article Metrics

Citations

Article Access Statistics

Multiple requests from the same IP address are counted as one view.