Article

Analysis of Façade Color and Cost to Improve Visual Integration of Buildings in the Rural Environment

by
María Jesús Montero-Parejo
1,*,
Lorenzo García Moruno
1,
Antonio Manuel Reyes Rodríguez
1,
Julio Hernández Blanco
1 and
Jacinto Garrido Velarde
2
1
Department of Graphical Expression, University of Extremadura, 06006 Badajoz, Spain
2
University Research Institute for Sustainable Territorial Development (INTERRA), University of Extremadura, 06006 Badajoz, Spain
*
Author to whom correspondence should be addressed.
Sustainability 2020, 12(9), 3840; https://doi.org/10.3390/su12093840
Submission received: 17 March 2020 / Revised: 13 April 2020 / Accepted: 6 May 2020 / Published: 8 May 2020
(This article belongs to the Special Issue Sustainable Environmental Reclamation: Landscape Planning and Design)

Abstract

:
In recent decades, rural buildings have proliferated in the rural environment, in many cases clashing with the surroundings. One of the main objectives in rural areas must be to maintain a balance between economic and sustainable development. In the exterior design of buildings, it is necessary to follow technical and scientific criteria that respect the natural environment, and one of the most important parameters in this scenario is façade color. This article analyzes the costs of using different colors on façades and how color variations affect the integration of buildings in the rural landscape. It addresses the context of rural buildings in the Extremadura region of Spain, where large areas of undeveloped land are available to drive economic development. Ten technical projects and photos of buildings were used for the study. A palette of suitable colors developed and proposed in previous studies was used to improve the external finishes of the façades. The variation in cost was calculated between the current designs and improved alternatives simulated using infographs, and a survey was conducted to determine how the rating of the landscape integration changed. The analysis shows that a building façade in a suitable color is always a significantly better rated solution than a finish in white (by 9%–14%). The results obtained are important because they show that a small variation in the cost of a building can significantly increase the rating of its integration and, therefore, give value added to the intervention because it respects the natural environment.

1. Introduction

1.1. Visual Impact of Buildings on the Rural Landscape

In recent decades, rural buildings have proliferated in the rural environment, in many cases clashing with the surroundings [1,2,3,4,5,6,7,8]. Growing environmental awareness has created a need for more studies to analyze how the visual impact of buildings on the landscape can be minimized [9,10,11].
Historically, popular architecture has been characterized by the use of readily available local materials, resulting in constructions that are perfectly compatible with the landscape. Despite the complexity of human intervention, buildings typically form a harmonious landscape [12]. However, agriculture and tourism have undergone considerable transformation in recent times [13]. New construction techniques and materials have led to a proliferation of buildings that often disrupt the harmony of semi-natural rural landscapes [10,14]. Technological developments have brought changes in shape, uses, scale, and materials, increasing not only the functional capabilities of buildings, but also their potential to affect the landscape. Those responsible for new building projects in rural areas should therefore include criteria of integration and functionality in the design [13,15,16,17].
One of the main objectives in rural environments must be to maintain a balance between economic and sustainable development, giving added value to the area [18]. In industrialized countries, developing buildings on rural land typically has significant impacts on the environment. However, in Spain, specifically in the Extremadura region, this balance is broken due to environmental overprotection, on many occasions without technical criteria, which can even slow down the development of new constructions and industries [19]. State regulations typically include either explicit or implicit references to the integration of buildings into their surroundings but are rarely based on any scientific analysis of the capacities or the needs of the landscape [20,21].

1.2. Importance of Color and Façades in Building Design

One of the aspects that ensures buildings are suitably integrated into the landscape is their building design with regard to surface properties or two-dimensional qualities. The traditional approach of visual impact analysis groups these elements into color, texture, and lines of a building [15,22]. Surface properties are the sensory factors that first affect a building’s appearance [23,24]. Some authors have reported that differences between the appearance of a building and its surroundings are almost exclusively a problem of color and texture [1,25,26], while other aspects such as the volume or silhouette of a building are less significant [1,5]. Color has similarly been highlighted as one of the most important elements in rating the visual impact of buildings, because it is the element most frequently mentioned by an average observer with regard to a building that clashes with its surroundings [1]. Other studies have analyzed the aesthetic role of suitable colors in reducing the apparent size of a building [5,27].
The façade is normally a very visible part of a building and occupies a larger area than the roof [28,29]. Façade construction materials are normally chosen solely based on functional and financial criteria, and insulation and mechanical strength are typically more important than elements such as color in the choice of materials [30,31].
García et al. [1] presented a detailed methodology to define the color palette for façades based on the colors of the surrounding terrain without vegetation. This element generates a perceptible link or nexus between the intervention and natural environment [29,32]. Their methodology has been applied as the basis for numerous works, and experience has shown that minimal specific training is required for its use. Its conceptual framework centers on how color, as a visual element, is perceived from a cognitive point of view. This intellectual process is common to the human condition regardless of cultural context, according to the theories of Smardon el al. [33] and the Gestalt laws of psychology [29,34].
In this context, using white on façades has been shown to be a visually acceptable solution over an unsuitable color [1]. Numerous studies have proposed theories on harmonization of colors [35]. All of them include white as a possible component of the different color ranges [36]. White adds contrasts, but as reported in these studies, contrasts are compatible in any range. Furthermore, white is associated with cleanliness and temperature regulation, and is an inexpensive solution. It has also been linked with other color choices that further enhance the integration of a building into the environment [1,5], but the positive effect of white on façades and its cost compared to other colors have not been analyzed independently in a scientific study. Few works in the literature have analyzed the relation between the visual impact of a building and its construction cost [30].

1.3. Public Participation in Visual Impact Analysis

Polling measures observers’ reactions to a series of visual proposals and may be the opinions of experts or surveys of the general public [37,38,39,40,41]. This tool has been widely applied and tested to validate hypotheses for visual impact analysis of buildings in the rural landscape [8,42,43,44,45,46,47,48], and is the method used in this study.

1.4. Objectives of the Study

The overall objective of the study is:
  • To provide planners, architects, and engineers with design criteria based on analysis supported by public surveys, allowing them to choose the most suitable construction elements by cost and landscape integration.
The initial hypothesis and specific objectives of the study are:
  • As the initial hypothesis, taking into account the circumstances described above, it is assumed that a suitable façade color other than white is a more highly rated integrating measure than white [1].
  • Specific objective 1: Using opinion surveys of a series of photos to analyze the rating of the use of white on façades (Corrective Measure A) compared to another color that would further enhance the visual aesthetics of the building (Corrective Measure B).
  • Specific objective 2: To compare the construction cost of the two proposals.
  • Specific objective 3: To associate variations in the construction cost and the rating of the integration in the two proposals.
To address these objectives, a pilot area and initial buildings were chosen, as indicated in the methodology.

2. Materials and Methods

2.1. Methodological Basis for Color Analysis in Building Integration

García et al. [1] devised a methodology to quantify the visual impact of the color of a building with regard to the predominant colors of its surroundings. Through comparative analysis based on photos of the HSB (hue, saturation, and brightness) channels of the colors of buildings and their surroundings, the authors devised a diagram to quantify the visual impact of color (Figure 1). They considered the following relationships (Table 1):
  • Visual continuity (VC): the relationship between two similar or very close values. Buildings copy values from their surroundings and reproduce features of the natural world, giving unity to the scene. Landscapes and buildings have very similar values and the natural aesthetics of the scene remain unchanged, with no diversity and no new contrasts. Visual continuity can be achieved in four ways: copying natural elements (camouflage), imitating traditional buildings (architectural imitation), constructing a natural screen to conceal the project, or building in a secluded location.
  • Diversity: the relationship between two types separated by differences. There is variation and, therefore, diversity, which can enhance the scene. Using the method proposed in this same study, it is possible to identify and differentiate:
    • Diversity without contrasts (DWC): surrounding types are imitated while allowing some flexibility, giving variety to the scene. Diversity without contrasts is achieved by minimizing the difference between the building and its surroundings.
    • Diversity with contrasts: contrast is defined as the relationship between two types separated by an interval that is greater than a specific threshold, beyond which they are perceived as very different. Such contrasts can disrupt the unity of a scene and, therefore, its compatibility, creating incompatible contrasts. Contrast is essential in controlling visual effects and perception and is vital for clarifying content and communication. Contrasts may be:
      • Compatible contrasts (CC): adding suitable variations is one of the most important elements of scenery quality. The landscape increases in value when contrasts are compatible and create unity in the scene.
      • Poorly compatible contrasts (PCC): any criteria proposal must have three characteristics: it must be effective, appropriate, and feasible. This is difficult to achieve when an innovative approach makes a building clash with the natural landscape.
The HSB color values of a plot without plant cover can be used to create diagrams such as the one in Figure 1, to define thresholds of impact comparison. This diagram can then be used to determine the mean HSB values of the main color of a façade relative to the predominant color of the surrounding terrain and identify the type of impact it has [1].
If a color is defined as being within the visual continuity (VC) range, the integration of the building is likely to be rated good or very good [1]. It has been demonstrated that when white is used on a façade, it is very likely that the integration of the building will be rated good, although the level of impact usually varies from diversity without contrasts (DWC) to compatible contrasts (CC) [14].
Following this methodology, paired scenarios of variation in façade color relative to the surroundings were created and perception surveys were used to compare the acceptance of white or a more suitable color and the cost–benefit of the two solutions.

2.2. Cost Study

The cost of each building is evaluated using itemized costs. The items correspond to each construction component required to complete the project. By focusing on items whose effects are seen from outside the building, we obtained the part of the construction price needed to generate the visual impact of the building.
We have termed this part of the structure seen directly by the observer as the “visual envelope” of the building. No visual elements of the surrounding infrastructure were included (e.g., landscaping). Roofs and exterior carpentry were not included but could be analyzed in further studies. Only the visual envelope of the façade is analyzed.
After deciding which items to include in the evaluation of each building, their costs need to be determined. Costs are affected by the price of the façade construction materials, the paint, the proportional use of the machinery needed for correct on-site installation, and labor costs. After determining the quantity and quality of each element, we can obtain the specific cost of each item.
The sum of the corresponding items in the construction price of each building determines the final cost of the envelope of each rural building whose visual impact will be measured. It was therefore essential to have access to the technical documents for every building project chosen.

2.3. Study Area

To meet the objectives of the study, both the buildings and the landscapes chosen were representative of the study area, but in very general terms. This rules out any area that is too small, as well as emblematic landscapes and/or buildings. However, the study area does not need to be too large, provided it meets all the necessary conditions.
The Extremadura region of Spain has different types of rural buildings, similar to those that can be found in any country under a Mediterranean climate. Extremadura has an area of 41,634 km2 and a mean population density of 25 inhabitants/km2. The main economic sector in the region is agriculture, and a large number of buildings of diverse typologies are located on rural land, facilitating its economic exploitation.

2.4. Case Selection

To meet the study objectives, a number of buildings were chosen in the study area. During a field stage, we looked for detached buildings on rural land in Extremadura. Buildings and uses unlikely to include landscape integration in their design criteria were ruled out. Examples of these were petrol stations, buildings with unique architecture, and buildings designed to stand out from their surroundings. These types of constructions are intended to be very visible and therefore integration is not typically included in their design. After this stage, the uses identified as potentially suitable for the study objectives were agriculture, livestock, industrial, residential, and winery, of which industrial was the least prevalent.
For the statistical results to have validity, there had to be sufficient buildings to repeat the same tests on the original images several times (at least three original cases per modification proposal and typology chosen), but not so many that respondents would become tired during the survey [48]. The number of buildings chosen was limited by the possibility of accessing the documentation of the building projects required for the analysis of their cost (Section 2.2), and by visibility for photo capturing.
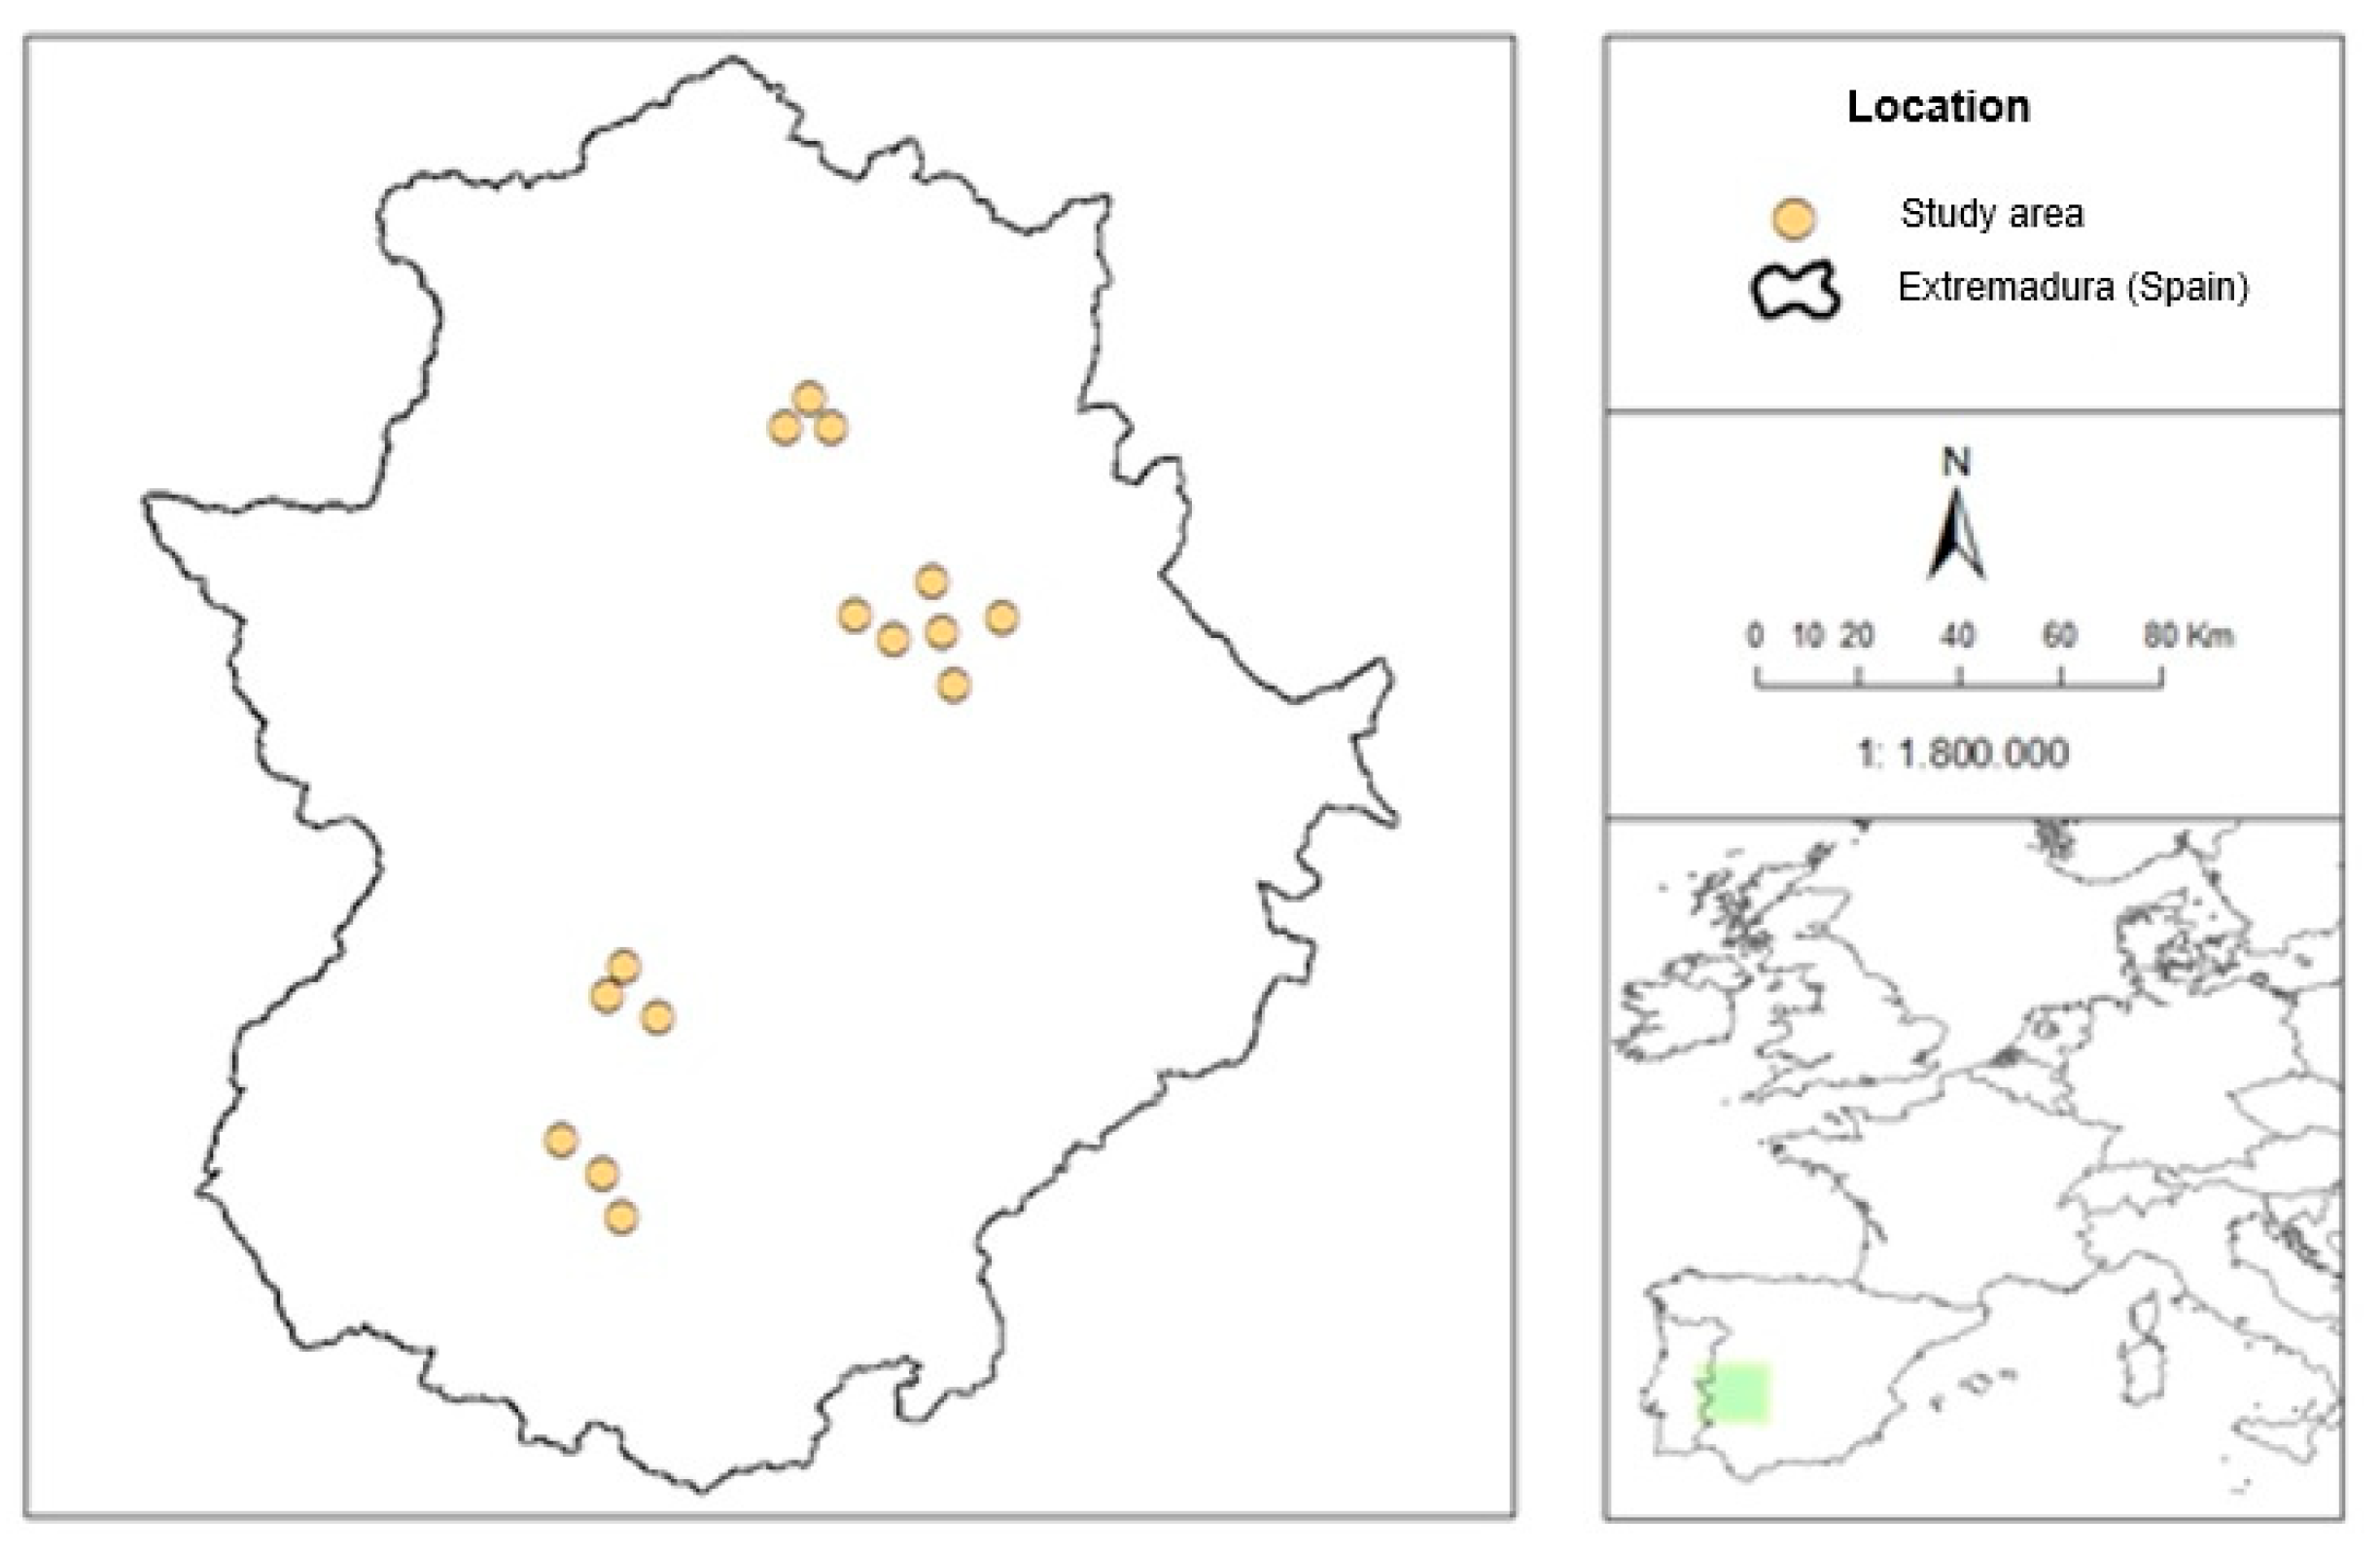
Fifteen buildings were chosen from the predominant typologies (Figure 2).

2.5. Generating Visual Stimuli

For the color analysis and survey, the buildings chosen also had to meet the following requirements:
  • Good visibility and accessibility from roads for photo capturing.
  • Sufficient distance from the observer so that photographs reveal as many details as possible of the building and the surrounding landscape in plain sight. Previous studies recommend that buildings should fill 25% to 30% of the total area of the image and the remaining area should show the natural surroundings [48,49].
Photos should not be captured during adverse weather conditions such as rain, heavy cloud cover, fog, and midday sunlight [50,51].
If these requirements are met, the building and its surroundings can easily be analyzed together in the images created for the survey.
Following these criteria, 10 of the 15 projects were chosen to generate the survey scenarios. The projects were grouped into two blocks by typology, based on the visual similarity of their construction in façade and roof finishing: five cases of residential-winery typology (I) and five of agriculture-livestock typology (II).
Using real scenarios, two corrective measures were chosen based on the objectives of the study: façade proposal A (façade finished in white), and façade proposal B (walls finished in a suitable color). Twenty scenarios were created for the survey: 5 × 2 for typology (I) + 5 × 2 for typology (II) (Table 2 and Table 3). To prepare the scenarios, the methodology for measuring the impact of color developed in Adobe Photoshop© CS by García et al. was used (Section 2.1) [1]. Table 2 and Table 3 include the cost of each façade calculated from the data consulted in each building project, following the methodology described above. The final column provides a percentage comparative analysis of the cost of proposal B relative to proposal A. Following the methodology outlined in Section 2.1, the scenarios modified with a white façade were created so that their threshold of impact was within the CC range, and the scenarios with a suitable color were modified within the VC spectrum.
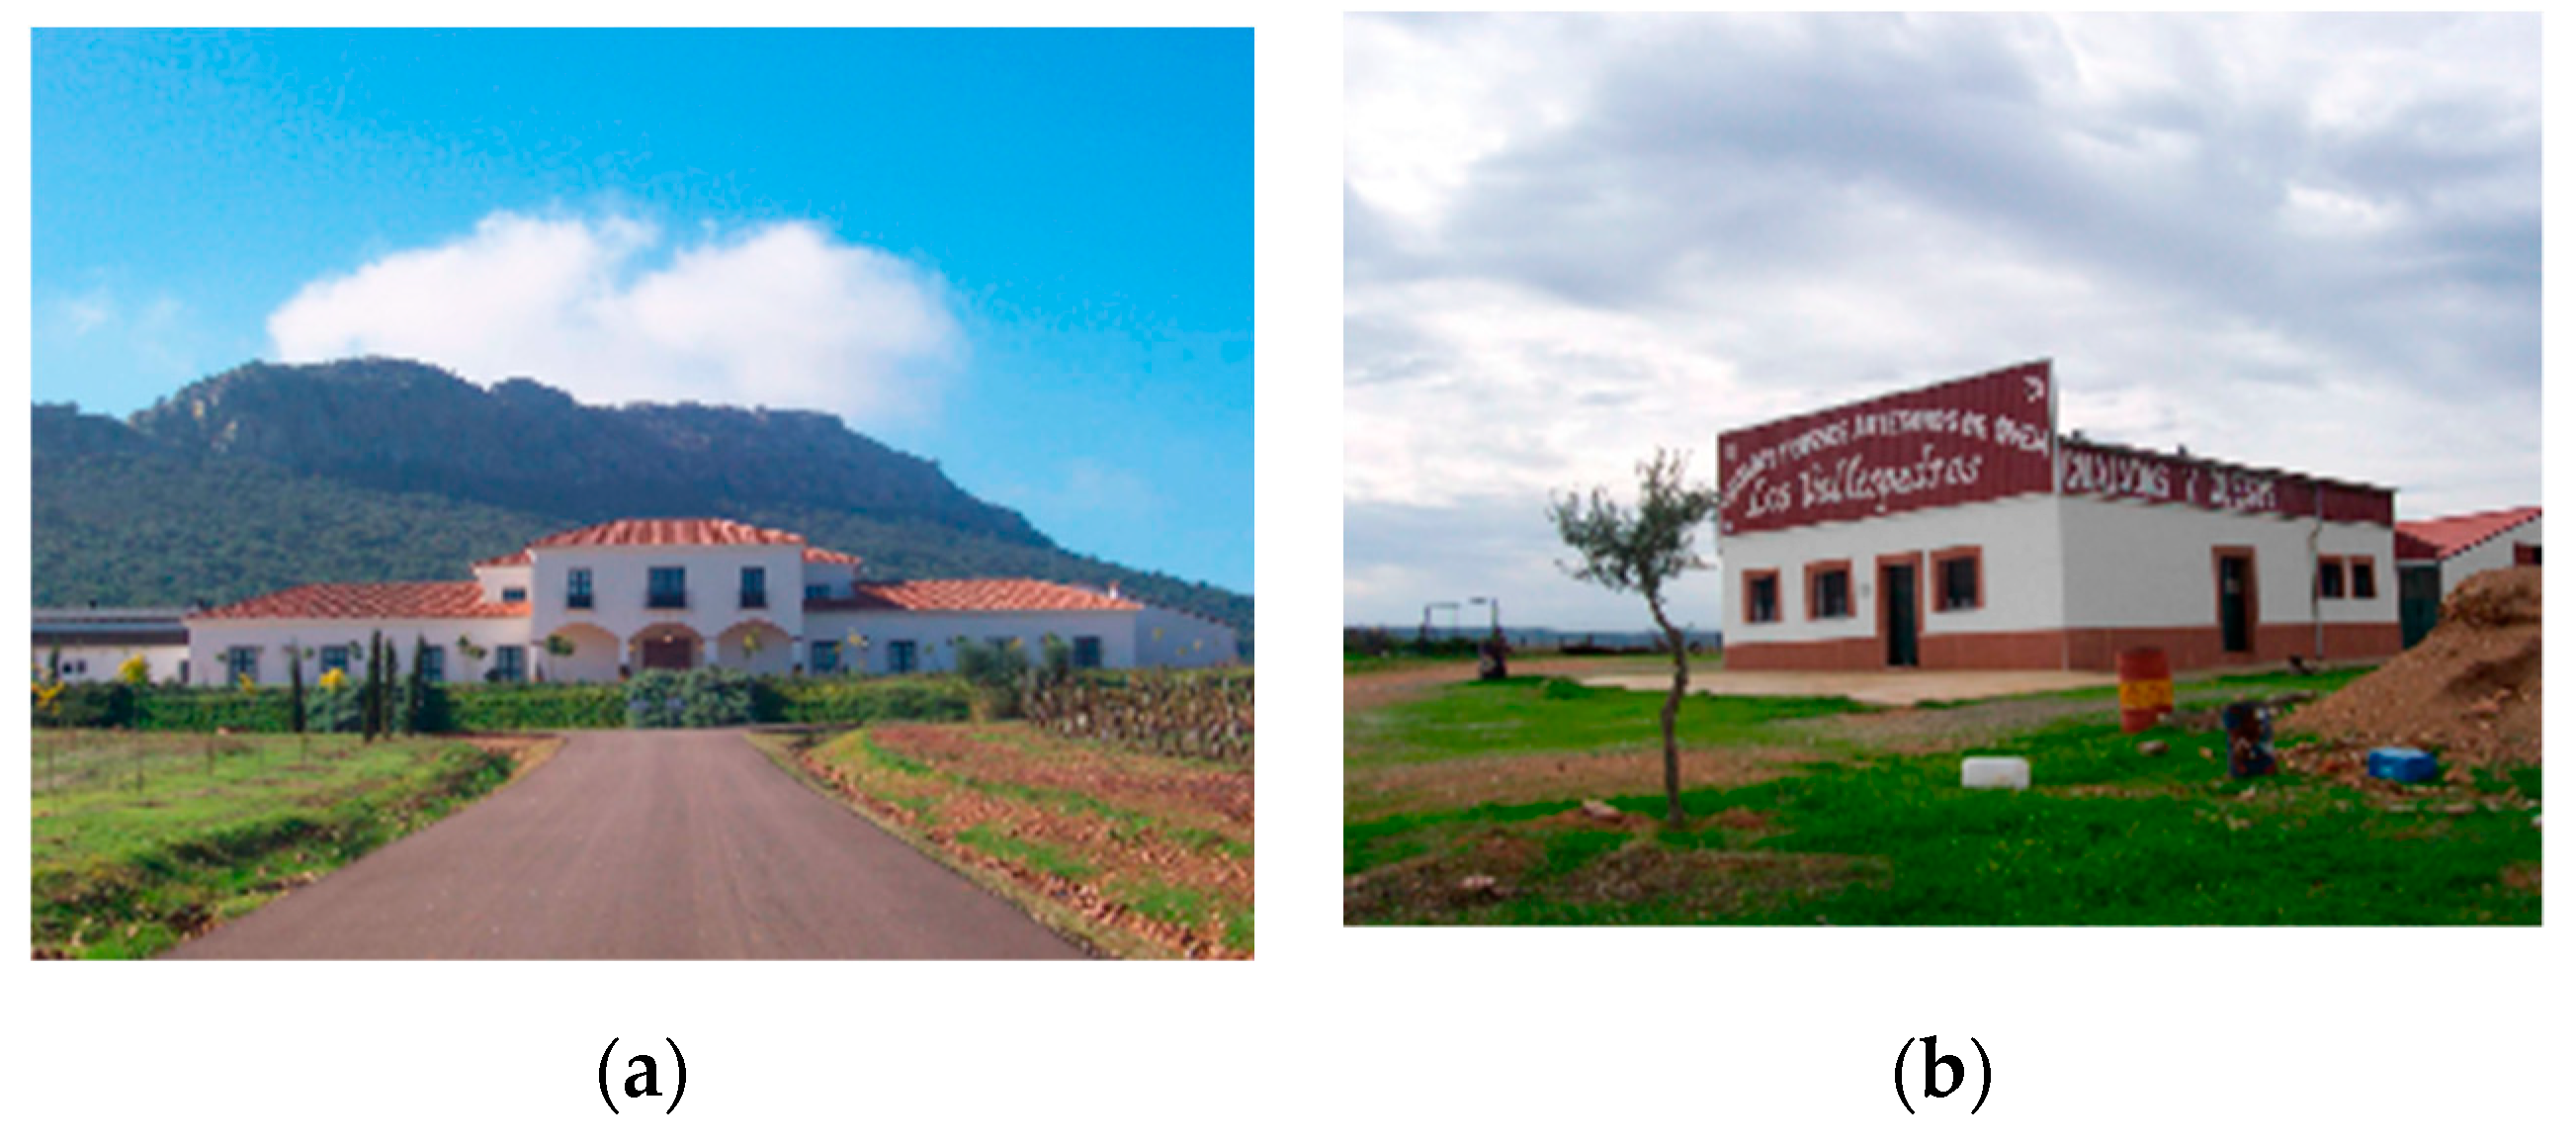
Figure 3 provides more details of two of the examples simulated using cases chosen for the two typologies.

2.6. Participants and Survey Procedure

The 20 infographs were initially shown to a group of 40 survey subjects. This preliminary study was conducted among inhabitants of the study areas and students at the University of Extremadura. The objective was to determine whether variables of a social nature such as age, gender, place of origin, and income affected the rating of the 20 survey scenarios. Respondents were selected randomly within these two easily accessible population groups. Many works in the literature indicate that university students are suitable subjects for this type of investigation [52,53,54,55,56]. From a total of 40 participants, 18 were men and 22 were women. The mean age, for both genders, was around 33 years. The income of 30% of respondents was less than €6000 a year, while 35% had an income of €6000–20,000. The remaining 25% did not state their income. With regard to place of origin, 37.5% were from villages with a population under 5000, 42.5% were from boroughs with a population of up to 7500, and 20% were from towns with a population of 7500–20,000.
After identifying the limited impact of the social variables on the results (see Section 3), the sample of survey subjects was increased to 120 participants, retaining the same territorial and social context as in the preliminary study, but without analyzing the effect of the social variables on the rating of the scenarios.
Respondents were shown images in a face-to-face interview [57,58,59,60,61,62,63]. A member of the research group was present during each survey [60]. Photo resolution was 100–150 dpi. For 10 × 15 pictures, the pixels corresponding to these resolutions were 393 × 591 to 591 × 886. These proportions were appropriate for distinguishing details of the building from its surroundings [14].
Respondents were asked to answer the following question for all photos:
  • Rate the visual integration of each building with its surroundings from 1 to 10
1 (very bad)   2   3   4   5   6   7   8   9   10 (very good)
An ascending scale of values is a simple and effective way to measure a respondent’s preference of a visual stimulus [54,64] and is appropriate for the objectives of the study. Minimal time was allowed for each visualization in order to record the first visual impulse the brain captures, following cognitive and psychological theories [29,33,34]. This type of questionnaire permitted comparison of results in previous works irrespective of the cultural context or the type of landscape [4].

2.7. Statistical Analysis

All statistical analyses were performed with the software IBM SPSS statistics 19 © [65].
The ascending scale from 1 to 10 allows the rating of each image to be analyzed using the arithmetic mean of all the responses the image receives [66]. The mean value of the ratings obtained for each image (rating average (RA)) was used as the dependent study variable in both surveys (preliminary and main).
(a) Preliminary survey
The independent variables are shown in Table 4: income (I), 4 levels; place of origin (P), 3 levels; age (A), 3 levels; gender (G), 2 levels; building typology (T), 2 levels; and corrective measure (CM), 2 levels.
The rating averages were analyzed with the following factorial repeated measures ANOVA design: 4(I) × 3(P) × 3(A) × 2(S) × 2(T) × 2(CM). The last two variables (T, CM) were within-subject statistical analysis and the four others (I, P, A, S) were between-subject analysis.
(b) Main survey
The independent variables of the main study were typology (T), with 2 levels, and corrective measure (CM), with 2 levels (Table 5).
The rating averages were analyzed with the following factorial repeated measures ANOVA design: 2(T) × 2(MC). These two variables were within-subject statistical analysis.
Paired comparison analysis of the mean values of each level and factor was performed using the Bonferroni test, with a significance level of p ≤ 0.05 (post hoc statistics). Using this type of analysis, we identified the levels of each factor in which significant differences occurred. In this study, it shows whether corrective measures in B cases are significantly better rated than A cases and whether response interactions occur between the study factors (T and CM).
Cohen’s d index was also used to analyze the effect size of the significant differences observed. Based on the literature consulted [67], Cohen’s d values higher than 0.8 were considered to have large effect sizes. The sample size used in the final survey (n = 120) was considered sufficient to detect at least medium effect sizes (Cohen’s d above 0.5) at significant thresholds of power analysis ((0.90 = 1 − β; β = 0.10); α = 0.01) [68].

3. Results and Discussion

3.1. Preliminary Survey

The results of the preliminary analysis show that the variables of a social nature (between-subject effects) analyzed have no significant impact on the rating of scenarios, and there appears to be some consensus in the responses (Table 6). For within-subject analysis, both typology (T) and corrective measure (CM) had a significant impact on the dependent variable RA and a large effect size, indicating their importance in visual impact [67]; (typology: F(1, 12) = 8.061; p = 0.015; Cohen’s d = 1.639; corrective measure: F(1, 12) = 9.118; p = 0.011; Cohen’s d = 1.743).
On average, typology I was always better rated (mean = 6.998 (SE = 0.189)) than typology II (mean = 6.342 (SE = 0.137)), and corrective measure B (mean = 6.887 (SE = 0.128)) was better rated than corrective measure A (mean = 6.454 (SE = 0.206)), irrespective of the respondents’ social context. Similar results obtained by other authors show that in visual impact rating there is overall consensus in key cognitive aspects such as color [1].

3.2. Main Survey

3.2.1. Analysis of Public Preferences

Given the results of the preliminary survey, the social variables were not analyzed. The study factors were those described in Section 2.7 (Table 5) corresponding to within-subject analysis.
The results agree with those of the preliminary study. Factors T and CM are significant and have a large effect size. Typology I (residential-winery) is better rated than typology II (agriculture-livestock) (mean = 6.138 (SE = 0.105) versus mean = 5.683 (SE = 0.086); F(1, 119) = 52.298; p = 5 × 10⁻¹¹; Cohen’s d = 1.326)), and proposal B (façades other than white) is better rated than proposal A (white façades) (mean = 6.239 (SE = 0.096) versus mean = 5.581 (SE = 0.097); F(1, 119) = 52.035; p = 8 × 10⁻⁷; Cohen’s d = 1.785)). Previous studies reported that rating results higher than 5 correlate to acceptable landscape integrations [1,14].
These main effects are clearly seen in Figure 4, which shows a positive linear trend or correspondence between the ratings (rating average) and the corrective measures (CM). The better the color of the finishings (proposal B), the higher the rating of the building, irrespective of the typology. The more highly rated effect of typology I can be seen in its trend line (red line), which is significantly above the trend line of typology II (green line).
Interaction between the two factors (T × CM) was also significant, with a medium effect size: F(1, 119) = 6.370; p = 0.013; Cohen’s d = 0.463. To determine where these differences occur, a post-hoc paired comparison was performed (Figure 4).
This analysis shows that the proposals for white façades, irrespective of typology, obtained similar ratings, with no significant differences (Figure 4, I-A versus II-A cases).
Cases in I-A and II-B show similar statistical behavior in observer preferences. An agricultural building painted a suitable color other than white (II-B) is rated the same as a white residential-winery building (I-A). The similar rating given for the two cases by an average respondent may be due to the differences in the building materials and finishings in the two groups of typologies. Other authors reported that agricultural buildings are normally rated lower than residential buildings, and one of the reasons for this may be the construction materials [14,54,64]. Using a suitable color to paint a building which, due to its typology, has no fine elements in its finishings such as tiles, stone, or wood can increase its rating [31]. In contrast, residential-winery buildings were expected to be rated higher than agricultural buildings because of their materials, but these typologies were rated the same when the façade color was white.
Although white is in theory a suitable color, it is less suitable than other colors that have less impact (impact levels of white CC-DWC versus impact levels of more suitable colors DWC-VC) [1,14]. Similar ratings were given to buildings with good materials and white façades (I-A cases) and buildings with poorer materials with façades of a more suitable color (II-B cases).
Lastly, statistical differences between typologies occur only in B cases painted in a suitable color other than white. In these cases, typology I is significantly better valued than typology II (Figure 4, II-B versus I-B), although this may also be due to differences in the construction materials. In this case, the combined improvements in materials and suitable color in I-B cases, compared to simple finishings and white painting in II-A cases, make their ratings significantly different (Figure 4), and residential-winery cases are always better valued than agriculture-livestock cases. Other authors have put forward similar theories regarding an aggregate visual impact of surface elements visible on façades [5,54].

3.2.2. Cost Analysis

Using the data in Table 2 and Table 3 (Section 2.5), an analysis was made of the costs of the compared means by the type of corrective measure for the two typologies.
The analysis shows that, irrespective of typology, painting a building a suitable color other than white is always a significantly better rated solution than painting it white, even though this option is slightly more expensive (by about 15%). These results are statistically equal both for typology I (14.26% (Table 7(a)) and typology II (14.96% (Table 7(b)) (F(1, 16) = 0.079; p = 0.073).
It can also be concluded that white is a slightly less expensive option, although this measure is rated significantly lower than a more suitable color. Despite this, the average ratings obtained for white were always higher than 5 out of 10, agreeing with the results of García et al. [14], who found that white was an acceptably rated color. Depending on the objectives of each individual building project, white could be an option due to its lower cost.

4. Conclusions

4.1. General Conclusions

Façade color is one of the elements with the greatest impact on the integration of a building. It can easily be changed during a building’s lifetime for little expense and is an ongoing cost in building maintenance. The results of this study will be useful for planners, architects, and planning legislators. It has been demonstrated that choosing a suitable façade color entails a small increase in cost and ensures that the integration will be rated significantly higher, although the final decision lies with the developer. The specific conclusions provide useful technical criteria for good practices to integrate buildings into the rural environment.

4.2. Specific Conclusions

  • Irrespective of the type of building analyzed, the rating averages of white were higher than 5 on an ascending scale from 1 (very bad) to 10 (very good). This means that using white as a finishing on façades is a viable building solution that aids visual integration, although façades in a color other than white were rated significantly higher (by 9%–14%).
  • From a cost analysis perspective, white is a less expensive technical solution than any other color (around 15% cheaper), irrespective of the typology analyzed.

4.3. Future Research

The apparent secondary visual effect of the finishing materials of other visible parts of the building such as roofs, cornices, trims, and plinths are mentioned in this study but not quantified by cost. A similar comparative cost study is needed to analyze these elements, including the costs of the materials.
The interaction between white and building materials must be taken into account. Simple or poor-quality materials on roofs and façades in combination with white paint lower the rating, although further research is also required in this issue.
The effect of outdoor landscaping was similarly not quantified in this study, and no cases with landscaping were chosen. Its positive visual effect as a filter using vegetation on frontal planes has been studied [8,47] but not quantified in economic terms, and could therefore be addressed in future studies.
The photos were analyzed exclusively in terms of façade color, without taking into account the individual numerical rating of each building and considering only the relative improvement from one proposal to another one. Although the mean ratings for each building were not very high (means no higher than 5–7), all the comparisons indicate that using only a suitable color is visually sufficient, in agreement with previous works [1,14]. The remaining margin for improvement in scores up to 10 could be explained by analyzing the visual impact aggregates of other variables not discussed in this study, such as lines, shapes, scales, volumes, and location [5,42], which could be included in future research.

Author Contributions

Formal analysis, M.J.M.-P., L.G.M., A.M.R.R., J.H.B., and J.G.V.; funding acquisition, L.G.M., A.M.R.R., and J.H.B.; investigation, M.J.M.-P., L.G.M., A.M.R.R., and J.H.B.; methodology, M.J.M.-P., L.G.M., A.M.R.R., and J.H.B.; project administration, M.J.M.-P., L.G.M., and A.M.R.R.; supervision, M.J.M.-P., L.G.M., A.M.R.R., J.H.B., and J.G.V.; writing—original draft, M.J.M.-P., L.G.M., A.M.R.R., and J.H.B.; writing—review and editing, M.J.M.-P., L.G.M., J.H.B., and J.G.V. All authors have read and agreed to the published version of the manuscript.

Funding

This work was partially funded by Junta de Extremadura (Spain) and ERDF funds (GR18176, GR18086, GR18052).

Acknowledgments

The authors wish to acknowledge funding for this research work from the VI Regional Research Plan and the Regional Government of Extremadura and the European Regional Development Fund (ERDF), associated with financing the research groups: Diseño, Sostenibilidad y Valor Añadido INNOVA (GR18176), Alcántara (GR18086), and Sustainable Development and Territorial Planning (GR18052).

Conflicts of Interest

The authors declare no conflicts of interest.

References

  1. García, L.; Hernández, J.; Ayuga, F. Analysis of the exterior colorof agroindustrial buildings: A computer aided approach to landscape integration. J. Environ. Manag. 2003, 69, 94–103. [Google Scholar] [CrossRef]
  2. Wathern, P. Environmental Impact Assessment: Theory and Practice; Unwin Hyman: London, UK, 1988. [Google Scholar]
  3. Mennella, V. Qualità dell’ambiente e sviluppo delle aree rurali. Genio Rural. 1997, 1, 75–78. [Google Scholar]
  4. Jeong, J.S.; García, L.; Hernández, J.; Montero, M.J. Evaluación de uan apliación web con participación púbilca en la planificación espacial y toma de decisiones para la integración de construcciones rurales. Inf. Constr. 2015, 16, 1–12. [Google Scholar]
  5. Montero-Parejo, M.J.; García-Moruno, L.; López-Casares, S.; Hernández Blanco, J. Visual impact assessment of color and scale of buildings on the rural landscape. Environ. Eng. Manag. J. 2016, 15, 1537–1550. [Google Scholar] [CrossRef]
  6. Codosero Rodas, J.; Naranjo Gómez, J.; Castanho, R.A.; Cabezas, J. Land Valuation Sustainable Model on Urban Planning Development: A Case Study in Badajoz, Spain. Sustainability 2018, 10, 1450. [Google Scholar] [CrossRef] [Green Version]
  7. Loures, L.; Castanho, R.A.; Vulevic, A.; Naranjo Gómez, J.; Cabezas, J.; Fernández-Pozo, L. The Multi-Variated Effect of City Cooperation in Land Use Planning and Decision-Making Processes-A European Analysis; Chapter in the Book: Urban Agglomerations; InTech: London, UK, 2018; pp. 87–106. [Google Scholar]
  8. Garrido-Velarde, J.; Montero-Parejo, M.J.; Hernández-Blanco, J.; García-Moruno, L. Using Native Vegetation Screens to Lessen the Visual Impact of Rural Buildings in the Sierras de Béjar and Francia Biosphere Reserve: Case Studies and Public Survey. Sustainability 2019, 11, 2595. [Google Scholar] [CrossRef] [Green Version]
  9. Van den Berg, A.; Vlek, C. The influence of planned-change context on the evaluation of natural landscapes. Landsc. Urban Plan. 1998, 43, 1–10. [Google Scholar] [CrossRef]
  10. Schmid, W.A. The emerging role of visual resource assessment and visualisation in landscape planning in Switzerland. Landsc. Urban Plan. 2001, 54, 213–221. [Google Scholar] [CrossRef]
  11. Tassinari, P.; Torreggiani, D.; Benni, S. Dealing with agriculture, environment and landscape in spatial planning, A discussion about the Italian case study. Land Use Policy 2013, 30, 739–747. [Google Scholar] [CrossRef]
  12. Sinha, S. Down to Earth Buildings. Architectural Design; Thames & Hudson: London, UK, 1997; Volume 67, pp. 91–93. [Google Scholar]
  13. Montero, M.J.; López-Casares, S.; García, L.; Hernández, J. Visual Impact on Wetlands: Consequence of Building Sprawls in Rural Areas of the West of Spain; Zerger, A., Argent, R.M., Eds.; MODSIM Intnl Cong on Modelling and Simulation; Modelling and Simulation Society of Australia and New Zealand: Melbourne, Australia, 2005; pp. 170–176. [Google Scholar]
  14. García-Moruno, L.; Montero Parejo, M.J.; Hernández, J.; Casares-López, S. Analysis of lines and forms to rural landscape integration. Span J Agric. Res. 2010, 8, 833–847. [Google Scholar] [CrossRef] [Green Version]
  15. Sheppard, S.R.J. Visual Simulation: A User’s Guide for Architects, Engineers and Planners; Van Nostrand Reinhold: New York, NY, USA, 1989. [Google Scholar]
  16. Torreggiani, D.; Tassinari, P. Landscape quality of farm buildings: The evolution of the design approach in Italy. J. Cult. Herit. 2012, 13, 59–68. [Google Scholar] [CrossRef]
  17. Jeong, J.S.; García-Moruno, L.; Hernández-Blanco, J.; Jaraíz-Cabanillas, F.J. An operational method to supporting siting decisions for sustainable rural second home planning in ecotourism sites. Land Use Policy 2014, 41, 550–560. [Google Scholar] [CrossRef]
  18. Mora, J.; Mora, C. Análisis De Las Cuencas Hídricas Transfronterizas De La Península Ibérica; Thomson-Reuters-Aranzadi: Navarra, Spain, 2015. [Google Scholar]
  19. Jaraíz-Cabanillas, F.J.; Mora-Aliseda, J.; Jeong, J.S.; Garrido-Velarde, J. Methodological proposal to classify and delineate natural protected áreas. Study case: Region of Extremadura, Spain. Land Use Policy 2018, 79, 310–319. [Google Scholar] [CrossRef]
  20. Montero-Parejo, M.J.; García-Moruno, L.; Hernández-Blanco, J.; Casares-López, S. Analysis of lines and forms of agroindustrial buildings: A photo-analytical approach to landscape integration. In Agricultural and Biosystems Engineering for a Sustainable World. In Proceedings of the International Conference on Agricultural Engineering, Hersonissos, Crete, Greece, 23–25 June 2008. [Google Scholar]
  21. Antonson, H. Bridging the gap between research and planning practice concerning landscape in Swedish infrastructural planning. Land Use Policy 2009, 26, 169–177. [Google Scholar] [CrossRef]
  22. Smardon, R.C. Appraising the reliability of Visual Impact Assessment methods. In Proceedings of the National Conference on Applied Technique for Analysis and Management of the Visual Resource, Village, NV, USA, 23–25 April 1979. [Google Scholar]
  23. Najd, M.D.; Ismal, N.A.; Maulan, S.; Yunos, M.Y.M.; Niya, M.D. Visual preference dimensions of historic urban areas: The determinants for urban heritage conservation. Habitat Int. 2015, 49, 115–125. [Google Scholar] [CrossRef]
  24. Swirnof, L. The visual environment: Consider the surface. Environmentalist 1982, 2, 217–222. [Google Scholar] [CrossRef]
  25. Shang, H.; Bishop, I.D. Visual Thresholds for detection, recognition and visual in landscape settings. J. Environ. Psychol. 2000, 20, 125–140. [Google Scholar] [CrossRef] [Green Version]
  26. García, L.; Hernández, J.; Ayuga, F. Analysis of the materials and exterior texture of agro-industrial buildings: A photo-analytical approach to landscape integration. Landsc. Urban Plan. 2006, 74, 110–124. [Google Scholar] [CrossRef]
  27. O’Connor, Z. Colour psychology and colortherapy: Caveat emptor. Color Forum. 2011, 36, 229–234. [Google Scholar]
  28. Frazer, R. Design in the Built Environment; Edward Arnold: London, UK, 1972. [Google Scholar]
  29. Bell, S. Elements of Visual Design in the Landscape; E & FN Spon: London, UK, 1993. [Google Scholar]
  30. Reyes-Rodriguez, A.M. Criterios De Diseño De Las Construcciones Rurales Atendiendo A Los Costes De Sus Acabados y a Su Integración En El Paisaje. Ph.D. Thesis, University of Extremadura, Badajoz, Spain, 2009. [Google Scholar]
  31. Montero-Parejo, M.J.; Jeong Su, J.; Hernández-Blanco, J.; García-Moruno, L. Rural Landscape Architecture: Traditional versus Modern Façade Designs in Western Spain. In Landscape Architecture. The Sence of Places, Models and Applications; Intechopen: London, UK, 2018. [Google Scholar]
  32. British Standard Institution. Buildings and Structures for Agriculture; BS 5502 parte 20: Code of practice for general design considerations; British Standard Institution: London, UK, 1990. [Google Scholar]
  33. Smardon, R.C.; Palmer, J.F.; Felleman, J.P. Foundations for Visual Project Analysis; John Wiley: New York, NY, USA, 1986. [Google Scholar]
  34. Antrop, M.; Van Eetvelde, V. Holistic aspects of suburban landscapes: Visual image interpretation and landscape metrics. Landsc. Urban Plan. 2000, 50, 43–58. [Google Scholar] [CrossRef]
  35. Táboas, T. El Color En Arquitectura; De Castro Ediciones: La Coruña, Spain, 1990. [Google Scholar]
  36. Parramón, J.M. Teoría y Práctica Del Color; Parramón Ediciones: Barcelona, Spain, 1988. [Google Scholar]
  37. Kaplan, R.; Kaplan, S. The Visual Environment: Public participation in design and planning. J. Soc. Issues 1989, 45, 59–86. [Google Scholar] [CrossRef]
  38. Nasar, J.L. Adult viewers’ preferences in residential scenes: A study of the relationship of the environmental attributes to preference. Environ. Behav. 1983, 15, 589–614. [Google Scholar] [CrossRef]
  39. Purcell, T. Experiencing American and Australian high and popular style houses. Environ. Behav. 1995, 27, 771–800. [Google Scholar] [CrossRef]
  40. Samavatekbatan, A.; Gholami, S.; Karimimoshaver, M. Assessing the visual impact of phisycal fetaures of tall buildings: Height, top, color. Environ. Impact Assess. 2016, 57, 53–62. [Google Scholar] [CrossRef]
  41. Wang, W.; Wang, W.; Namgung, M. Linking people’s perceptions and physical components of sidewalk environments: An application of rough sets theory. Environ. Plan. B 2010, 37, 234–247. [Google Scholar] [CrossRef]
  42. Hernández, J.; García, L.; Ayuga, F. Assessment of the visual impact made on the landscape by new buildings: A methodology for site selection. Landsc. Urban Plan. 2004, 68, 15–28. [Google Scholar] [CrossRef]
  43. Dupont, L.; Ooms, K.; Antrop, M.; Eetvelde, V. Comparing saliency maps and eye-tracking forms maps: The potencial use in visual impact assessment base on landscape photographs. Landsc. Urban Plan. 2016, 148, 17–26. [Google Scholar] [CrossRef]
  44. Dupont, L.; Ooms, K.; Antrop, M.; Eetvelde, V. Testing the validity of a saliency-based method for visual assessment of constructions in the landscape. Landsc. Urban Plan. 2017, 167, 325–338. [Google Scholar] [CrossRef]
  45. Jeong, J.S.; García, L.; Hernández, J. Integration Building into a rural landscape using a multi-criteria apatial decision analysis in GIS-enabled web environment. Biosyst. Eng. 2012, 112, 82–92. [Google Scholar] [CrossRef]
  46. Ramírez, A.; Ayuga, E.; Gallego, E.; Fuentes, J.M.; García, A.I. A simplified model to assess landscape quality from rural roads in Spain. Agric. Ecosyst. Environ. 2011, 142, 205–212. [Google Scholar] [CrossRef]
  47. Garrido-Velarde, J.; Montero-Parejo, M.J.; Hernández-Blanco, J.; García-Moruno, L. Use of video and 3D scenario visualisation to rate vegetation screens for integrating buildings into the landscape. Sustainability 2017, 9, 1102. [Google Scholar] [CrossRef] [Green Version]
  48. Garrido-Velarde, J.; Montero-Parejo, M.J.; Hernández-Blanco, J.; García-Moruno, L. Visual analysis of the height ratio between building and background vegetation. Two rural cases of study: Spain and Sweden. Sustainability 2018, 10, 2593. [Google Scholar] [CrossRef] [Green Version]
  49. Brush, R.G.; Williamson, D.N.; Fabos, J.G.Y. Visual screening potential of forest vegetation. Urban Ecol. 1979, 4, 207–216. [Google Scholar] [CrossRef]
  50. Grèt-Regemy, A.; Bishop, I.D.; Bebi, P. Predicting the scenic beauty value of mapped landscape changes in a mountainous region through the use of GIS. Environ. Plan. B 2007, 34, 50–67. [Google Scholar] [CrossRef] [Green Version]
  51. Bishop, I.D. Determination of thresholds of visual impact: The case of wind turbines. Environ. Plan. B 2002, 29, 707–718. [Google Scholar] [CrossRef]
  52. Nasar, J.L.; Stamps, A.E., III. Infill McMansions: Style and the psychophysics of size. J. Environ. Psychol. 2009, 29, 110–123. [Google Scholar] [CrossRef]
  53. Li, L.; Homma, R.; Kazuhisa, I. Preferences for a lake landscape: Effects of building height and lake width. Environ. Impact Assess. 2018, 70, 22–33. [Google Scholar]
  54. Stamps, A.E., III. Physical determinants of preferences for residential façades. Environ. Behav. 1999, 31, 723–751. [Google Scholar] [CrossRef]
  55. Wohlwill, J.F. Amount of stimulus exploration and preference as differential functions of stimulus complexity. Percept Psychophys. 1968, 14, 307–312. [Google Scholar] [CrossRef] [Green Version]
  56. Daniel, T.C.; Boster, R.S. Measuring Landscape Aesthetics: The Scenic Beauty Estimation Method; USDA Forest Service Research Paper RM-167; Rocky Mountain Forest and Range Experiment Station: Fort Collins, CO, USA, 1976. [Google Scholar]
  57. Pinto-Correia, T.; Barroso, F.; Surová, D.; Menezes, H. The fuzziness of Montado landscapes: Progress in assessing user preferences through photo-based surveys. Agrofor. Syst. 2011, 82, 209–224. [Google Scholar] [CrossRef] [Green Version]
  58. Arriaza, M.; Cañas-Ortega, J.F.; Cañas-Madueño, J.A.; Ruiz-Avilés, P. Assessing the visual quality of rural landscapes. Landsc. Urban Plan. 2004, 69, 115–125. [Google Scholar] [CrossRef]
  59. Paar, P. Landscape visualizations: Applications and requirements of 3D visualization software for environmental planning. Comput. Environ. Urban Syst. 2006, 30, 815–839. [Google Scholar] [CrossRef]
  60. Lange, E.; Hehl-Lange, S.; Brewer, M.J. Scenario-visualization for the assessment of perceived green space qualities at the urban-rural fringe. J. Environ. Manag. 2008, 89, 245–256. [Google Scholar] [CrossRef] [PubMed]
  61. Christopher, J.P.; Christopher, M.R.; Brett, A.B.; Hayden, L. Identifying strengths and weaknesses of landscape visualization for effective communication of future alternatives. Landsc. Urban Plan. 2011, 100, 231–241. [Google Scholar]
  62. Azqueta, D. Valoración Económica De La Calidad Ambiental; Economic valuation of environmental quality; McGraw Hill: New York, NY, USA, 1994. [Google Scholar]
  63. Riera, P. Manual De Valoración Contingente; Manual of contingent valuation; Instituto de Estudios Fiscales: Madrid, Spain, 1994. [Google Scholar]
  64. Akalin, A.; Yildirim, K.; Wilson, C.; Kilicoglu, O. Architecture and engineering students’ evaluations of house façades: Preference, complexity and impressiveness. J. Environ. Psychol. 2009, 29, 124–132. [Google Scholar] [CrossRef]
  65. Norusis, M. IBM SPSS Statistics 19 Guide to Data Analysis; International Edition; Pearson: London, UK, 2012. [Google Scholar]
  66. Kendrick, J. Social Statistics: An Introduction to Using SPSS, 2nd ed.; Allyn and Bacon: Boston, MA, USA, 2005. [Google Scholar]
  67. Stamps, A.E., III; Nasar, J.L. Design review and public preferences: Effects of geographical location, public consensus, sensation seeking, and architectural styles. J. Environ. Psychol. 1997, 17, 11–32. [Google Scholar] [CrossRef] [Green Version]
  68. Rosenthal, R.; Rosnow, R.L. Essentials of Behavioral Research: Methods and Data Analysis, 2nd ed.; McGraw Hill: New York, NY, USA, 1991. [Google Scholar]
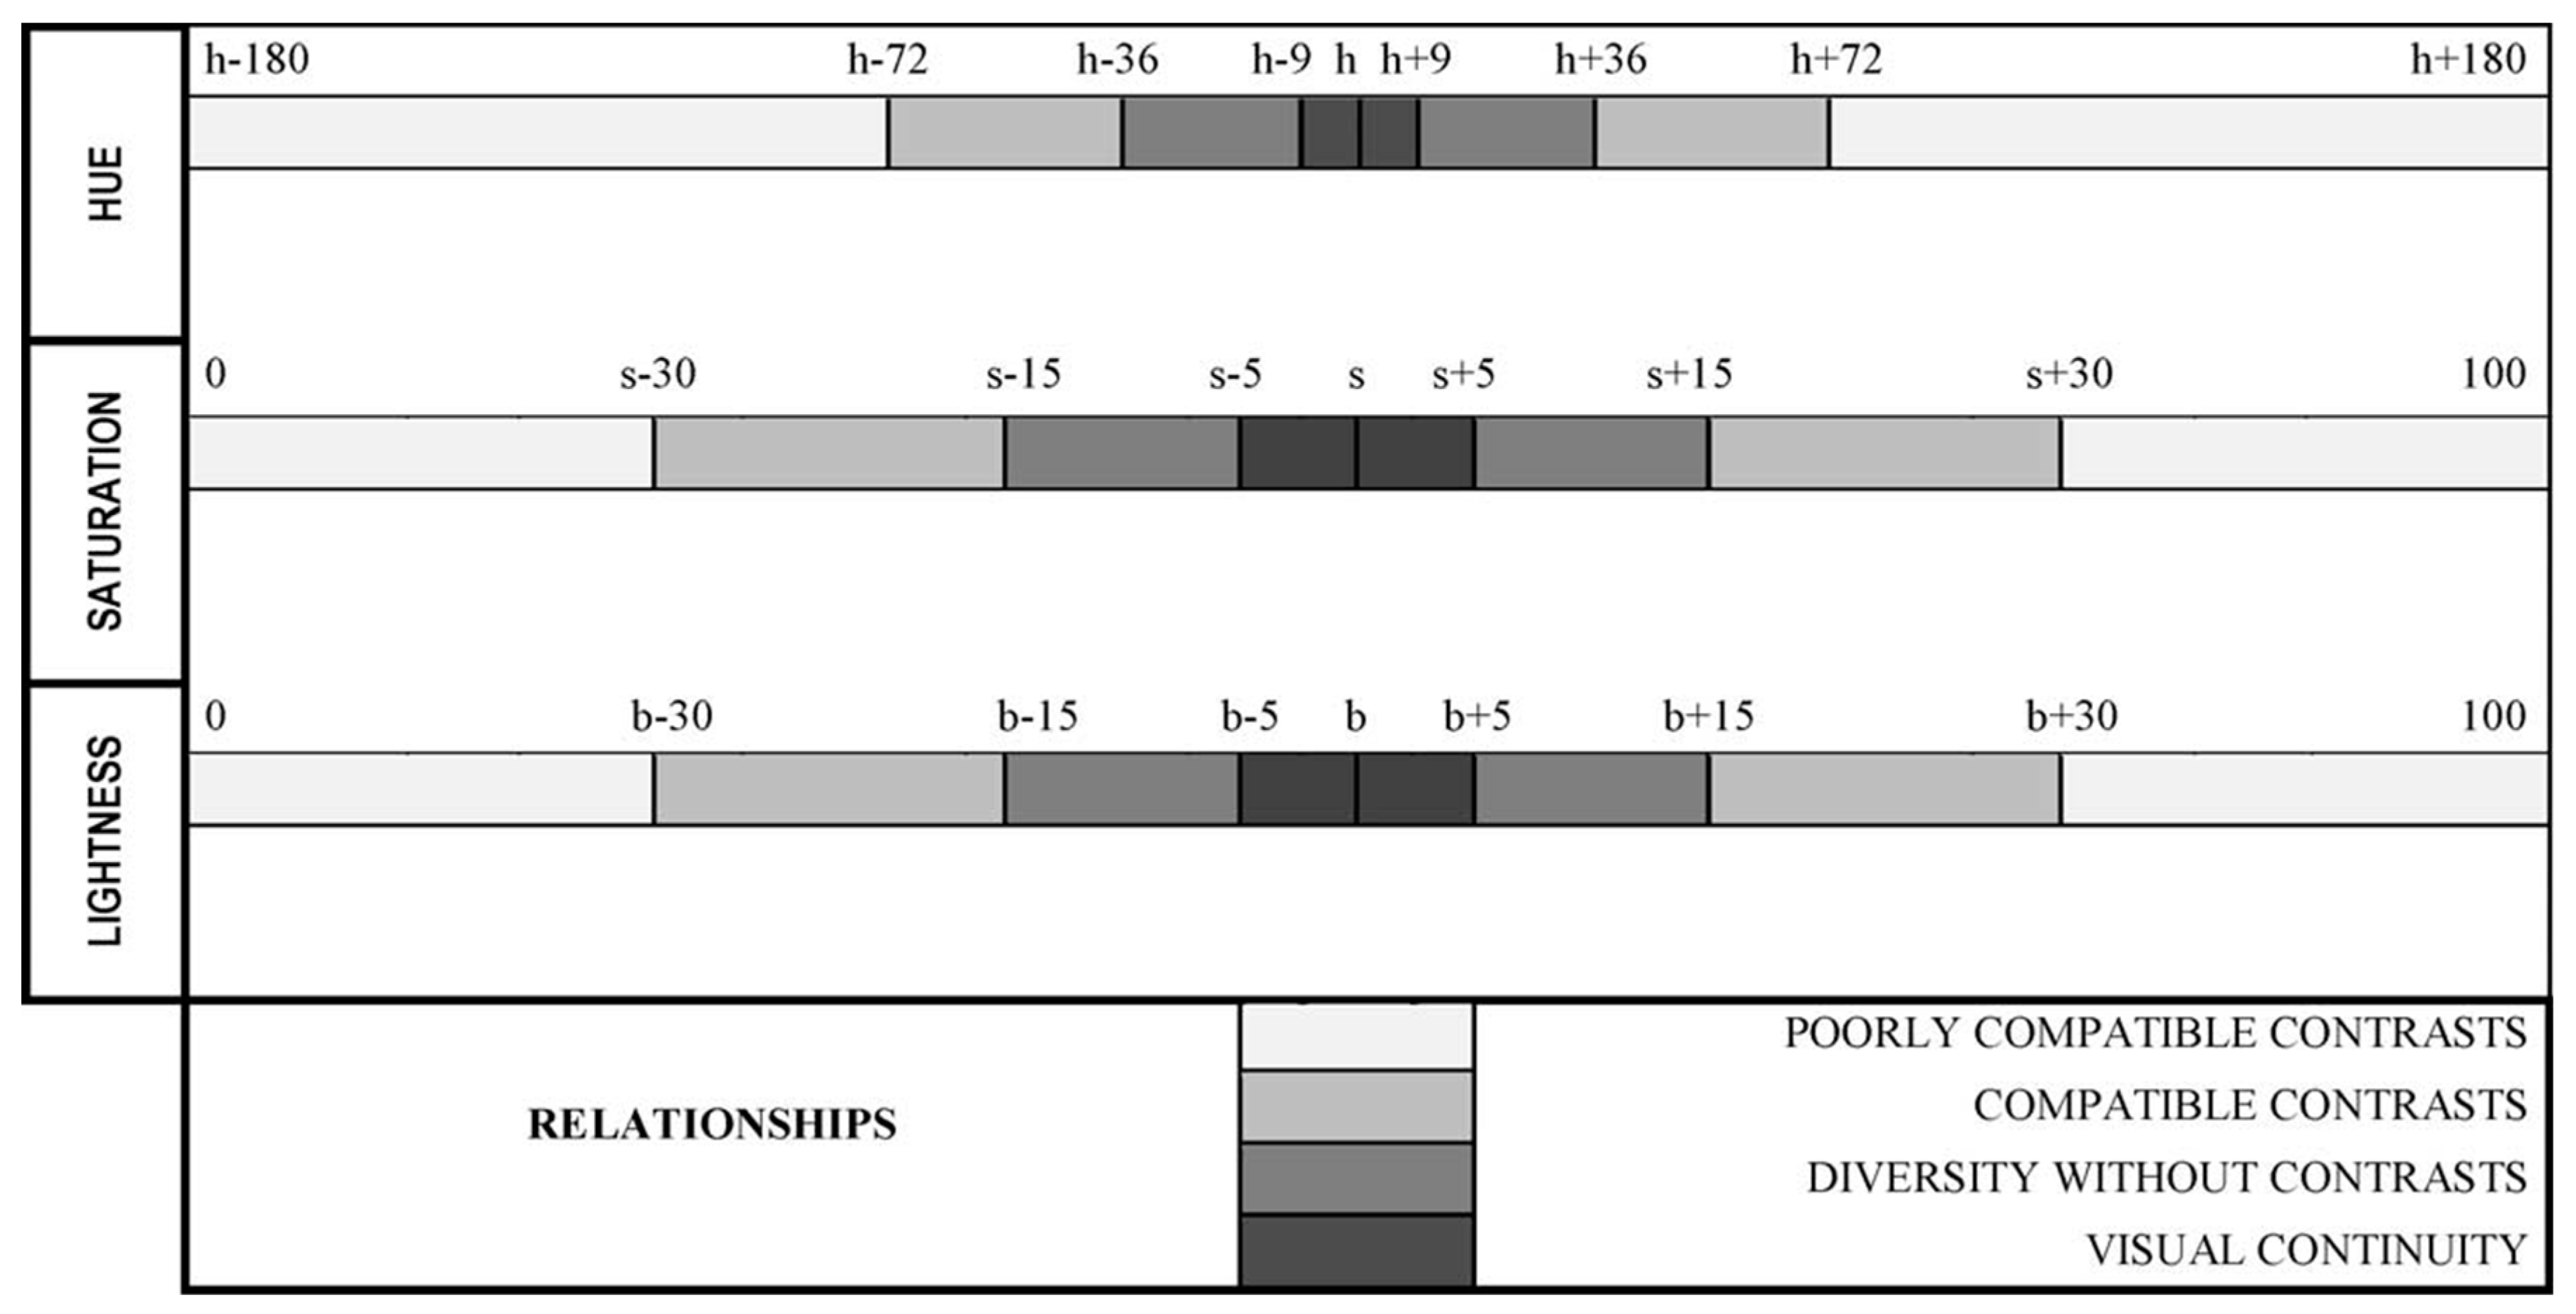
Figure 1. Hue, saturation, and brightness (or lightness) relationships [1]. The central values—h, s, and b—are the mean values of these variables calculated for the main color of the surrounding terrain.
Sustainability 12 03840 g001
Figure 2. Location of study area.
Sustainability 12 03840 g002
Figure 3. Examples detailed of two scenarios: (a) typology I and (b) typology II.
Sustainability 12 03840 g003
Figure 4. Means of preferences per typology and corrective measure. Different letters indicate significant differences in pair cross comparison; identical letters indicate similar behavior in responses: (Bonferroni test; univariate analysis in direction of dotted black arrows: F(3, 476) = 19.698, p < 4.7 × 10⁻¹², d = 0.705.
Sustainability 12 03840 g004
Table 1. Summary of visual relationships between color comparison of buildings and surrounding terrain [1].
Possible Relationships
Without diversityVisual continuity (VC)
With diversityDiversity without contrasts (DWC)
Compatible contrasts (CC)
Poorly compatible contrasts (PCC)
Table 2. Scenarios for residential-winery typology (I).
Corrective Measure
Typology
A. Whitewashed or Painted WhiteAverage Cost (€)B. Painted a Suitable Color (Other Than White)Average Cost (€)B More Expensive Than A by (%)
I Sustainability 12 03840 i00142,454.08 Sustainability 12 03840 i00248,713.7414.7%
Sustainability 12 03840 i0038235.10 Sustainability 12 03840 i0049142.3311.02%
Sustainability 12 03840 i00516,526.54 Sustainability 12 03840 i00619,259.1916.53%
Sustainability 12 03840 i0079235.46 Sustainability 12 03840 i00810,601.2114.78%
Sustainability 12 03840 i0094554.72 Sustainability 12 03840 i0104843.556.34%
Table 3. Scenarios for agriculture-livestock typology (II).
Corrective Measure
Typology
A. Whitewashed or Painted WhiteAverage Cost (€)B. Painted a Suitable Color (Other Than White)Average Cost (€)B More Expensive Than A by (%)
II Sustainability 12 03840 i0111163.90 Sustainability 12 03840 i0121344.8115.54%
Sustainability 12 03840 i0132695.56 Sustainability 12 03840 i0143066.713.77%
Sustainability 12 03840 i0158103.44 Sustainability 12 03840 i0169511.6817.38%
Sustainability 12 03840 i0172663.82 Sustainability 12 03840 i0183014.0413.15%
Sustainability 12 03840 i0198459.91 Sustainability 12 03840 i0209604.0613.52%
Table 4. Independent variables of preliminary study (40 participants).
Income1not stated
2≤ €3000–6000
3> €6000–9000
4≥ €9000
Place of origin (population)12500–5000
2≥ 5000–7500
3≥ 7500–20,000
Age1< 25 years
230–50 years
3> 50 years
GenderMmale
Ffemale
TypologyIresidential-winery
IIagricultural-livestock
Corrective measureAwhite paint
Bpainting in a suitable color other than white
Table 5. Independent variables of main study (120 participants).
Typology (T)Iresidential-winery
IIagricultural-livestock
Corrective measure
(CM)
Awhite paint
Bpainting in a suitable color other than white
Table 6. Between-subjects test. Effects of preliminary survey.
SourceType III Sum of SquaresdfMean SquareFSig.
Income12.54334.1811.5080.263
Place of origin4.15122.0750.7490.494
Age0.97520.4880.1760.841
Gender0.50410.5040.1820.677
Error33.260122.772
Table 7. Cost comparisons between corrective measures by typology.
(a) T = Residential-WineryI-AI-BComparison I-B/I-A (%)(b) T = Agriculture-Livestock II-AII-BComparison II-B/II-A (%)
Mean cost (€) 16,201.1818,512.0014.26%Mean cost (€) 4617.335308.2614.96%
Rating average 5.734 *
(SE = 0.118)
6.542 *
(SE = 0.112)
14.09%Rating Average 5.428 *
(SE = 0.093)
5.937 *
(SE = 0.098)
9.38%
* Significant differences were found at 0.05 level.