1. Introduction
Hydropower is one of the most efficient, cost-effective, and clean source of electricity generation. The worldwide installed capacity of hydropower rose to 1292 GW in 2018 [
1]. China, United States, Brazil and Canada are the countries with the highest hydropower installed capacity. Hydropower generation is growing rapidly in East Asia, followed by South America, South, and Central Asia, Europe, Africa, and North and Central America. Canada had 81 GW of installed hydropower capacity in 2018. Approximately 63% of Canada’s total electricity demand and most of Canada’s electricity exports come from hydropower [
2]. Canada has the potential of another 160 GW of hydro capacity. In addition to clean and low-cost energy production, hydropower has a high ramp rate and a quick start capability which support the integration of highly intermittent renewable energy resources such as wind and solar into the conventional grid [
3].
A hydro unit can be unavailable or only partially available due to river inflow restrictions. In a hydro dominant power system, the scarcity of water in the dry season can cause inadequate generation to meet the load demand. This issue is even more severe in a dry year. Furthermore, there has been an increase in the occurrence of extreme adverse weather in recent years. The energy uncertainty will have an adverse impact on system reliability [
4]. Therefore, the high risks associated with the extreme dry hydrological condition should not be ignored in long term system adequacy planning of hydro dominant utilities.
Many approaches have been explored and developed to properly model energy uncertainty as a constraint in hydro units in their reliability models. In [
5,
6], the models are developed to represent an energy source with limited energy input for generation reliability evaluation. The energy management of hydro units due to energy uncertainty is studied and applied mainly into two areas.
The first area of study is to develop the operating policy based on energy uncertainty of hydro plants to optimize the operating cost of the system. In reference [
7,
8], with limited energy, the usage of a hydro unit as a base unit and/or peak shaving unit are compared based on reliability and production cost factors. In reference [
9], the optimal allocation of stored energy resulting from random river inflows to the different sub-periods of a year to sell in the energy market as well as to cover any unplanned outages of thermal units is presented. The main objective of this work is to manage the energy generation from the hydro units and to assess the impact of the market rules on the reliability of the system. However, these researches did not consider the coordination of energy management among different hydro units in a hydro dominant system when facing energy uncertainty. The main focus of these works was on optimizing the operating cost.
The second area of study is to coordinate the periodic energy uncertainty of hydro units with other types of generation in a mixed generation system. An integrated model for long term operation planning and reliability evaluation of hydrothermal systems is presented in [
10]. An optimal amount of discharge of hydro units and energy output of thermal units is developed in that work with the objective of minimizing the total cost of the energy. A simple multivariable weather model is developed in [
11] to include rainfall for hydro units. The hydropower plant is used as energy storage to study wind and solar penetration into the system from a reliability point of view. Three types of weather conditions, wet, dry and normal, were modeled in [
12] with equal probability of occurrence and randomly chosen during the simulation. The operation incorporated the coordination with thermal and wind power systems to show the system adequacy depending on the capacity and number of hydro units assigned to operate in coordination with wind power.
The focus of the existing literature is either on the energy management of hydropower for optimizing the operation cost or on the coordination of hydropower with other types of generation to manage the energy uncertainty due to hydrological conditions. However, the impact of energy uncertainty caused by hydrological variability from year to year on system reliability in the hydro dominant system has not been studied. Moreover, there is a need for research in the field of reliability enhancement strategies under energy limitation for hydro plants without getting assistance from other types of energy sources.
This paper develops a new probabilistic method to incorporate diurnal, seasonal and yearly management strategies of run-of-river and storage hydro units in a hydro dominant system. The impacts of reservoir size and demand side management on water utilization and system reliability are investigated. The proposed strategies consider energy uncertainty and strategically manage energy utilization, based on water availability patterns to minimize reliability issues in energy deficient seasons [
13]. Two analytical methods are developed and integrated for reliability evaluation of hydro dominant systems. A diurnal energy management method [
14] is applied to the run of river hydro units to manage energy to follow the daily load variation. A seasonal energy management method [
15] is applied to large storage hydro units to transfer energy so that it follows seasonal load variation. These two methods are integrated and used simultaneously to maximize the utilization of limited energy and minimize the reliability impact of energy uncertainty in order to enhance long-term system adequacy. The contribution of this paper is to provide an appropriate adequacy evaluation methodology for long term resource planning of hydro dominant systems. The short-term operational aspects of market forces and cost optimization are out of scope of this paper. The proposed strategies are applied to the modified IEEE Reliability Test System (RTS) [
16] which incorporates the hydrological data of wet year, normal year, dry year and extreme dry year. The proposed methodology and illustrative results will be useful in planning and policy decisions in long-term investment and utilization of hydro resources for the sustainable growth of reliable hydro dominant systems.
2. Reliability Evaluation of Hydro Dominant Power System
This generation system reliability can be defined as the ability of total installed power generation to meet the total system load considering generating unit failures and load variations. The energy availability is also considered for energy-based generations, such as hydro units. The generation model is developed by combining hydro units and other conventional units in the system to create a probability distribution of generation capacity states, commonly known as the capacity outage probability table (COPT) [
17]. The loss of load expectation (LOLE) and loss of energy expectation (LOEE) are the most widely used reliability indices, which are calculated by convolving the COPT with the load model of the system. The LOLE is the expected time that the system load exceeds the available generating capacity, and LOEE is the expected amount of energy that is not supplied when needed due to power interruptions [
17]. The LOLE and LOEE can be calculated using Equations (1) and (2), respectively.
where
n is the number of capacity outage states,
is the probability of the
outage state,
is the energy not supplied in the outage state, and
is the time of load loss due to the outage.
The monthly energy availability of a hydropower plant varies due to river inflow variations from one month to another in the wet, normal, dry and extreme dry years. Therefore, the reliability indices are evaluated in monthly intervals in this paper. The annual LOLE and LOEE are then determined by summing the monthly LOLEs and LOEEs in the study year.
2.1. Modeling of a Hydro Unit
The water level in the reservoir of a hydropower plant depends on the discharge rate of the hydro unit and the river inflow rate into the reservoir. The output ability of the hydro unit depends on the availability of the unit and the water operating policy based on available energy and water usage regulations at the instant. The turbine discharge rate Q (
i) in the
hour can be adjusted to generate a steady output power P as shown in (3).
where
g is the gravitational constant, α is the overall efficiency of the turbine generator, and
s is the specific weight of water. The net head
H (
i) in the
hour can be obtained by dividing the reservoir volume
V (
i) by its area A as shown in (4). The reservoir volume changes continuously depending on the river inflow and outflow and is obtained from (5).
where,
V (
i − 1) is the reservoir volume in the previous hour, In
V(
i) is the inflow water volume into the reservoir at
hour, and Out
V(
i − 1) is the outflow water volume from the reservoir in the previous hour. It is assumed that the reservoir is a cuboidal shape to illustrate the method developed in this work.
The total period of study is divided into sub-periods with similar hydrological conditions. The generation output varies in the different sub-periods based on hydrological condition and water operating policy. The total energy output
E of the study period can be found by summing up the energy outputs in the sub-periods as given in (6)
where
is the output power and
is the duration of the
sub-period.
2.2. Diurnal and Seasonal Energy Management Modeling
A run-of-river hydro plant has a small head pond with limited storage capacity. The underlying concepts used in evaluating the power output from a run-of-river hydro plant are described in [
14]. It usually has limited ability to manage water resource to follow the load variation within a day to enhance system reliability [
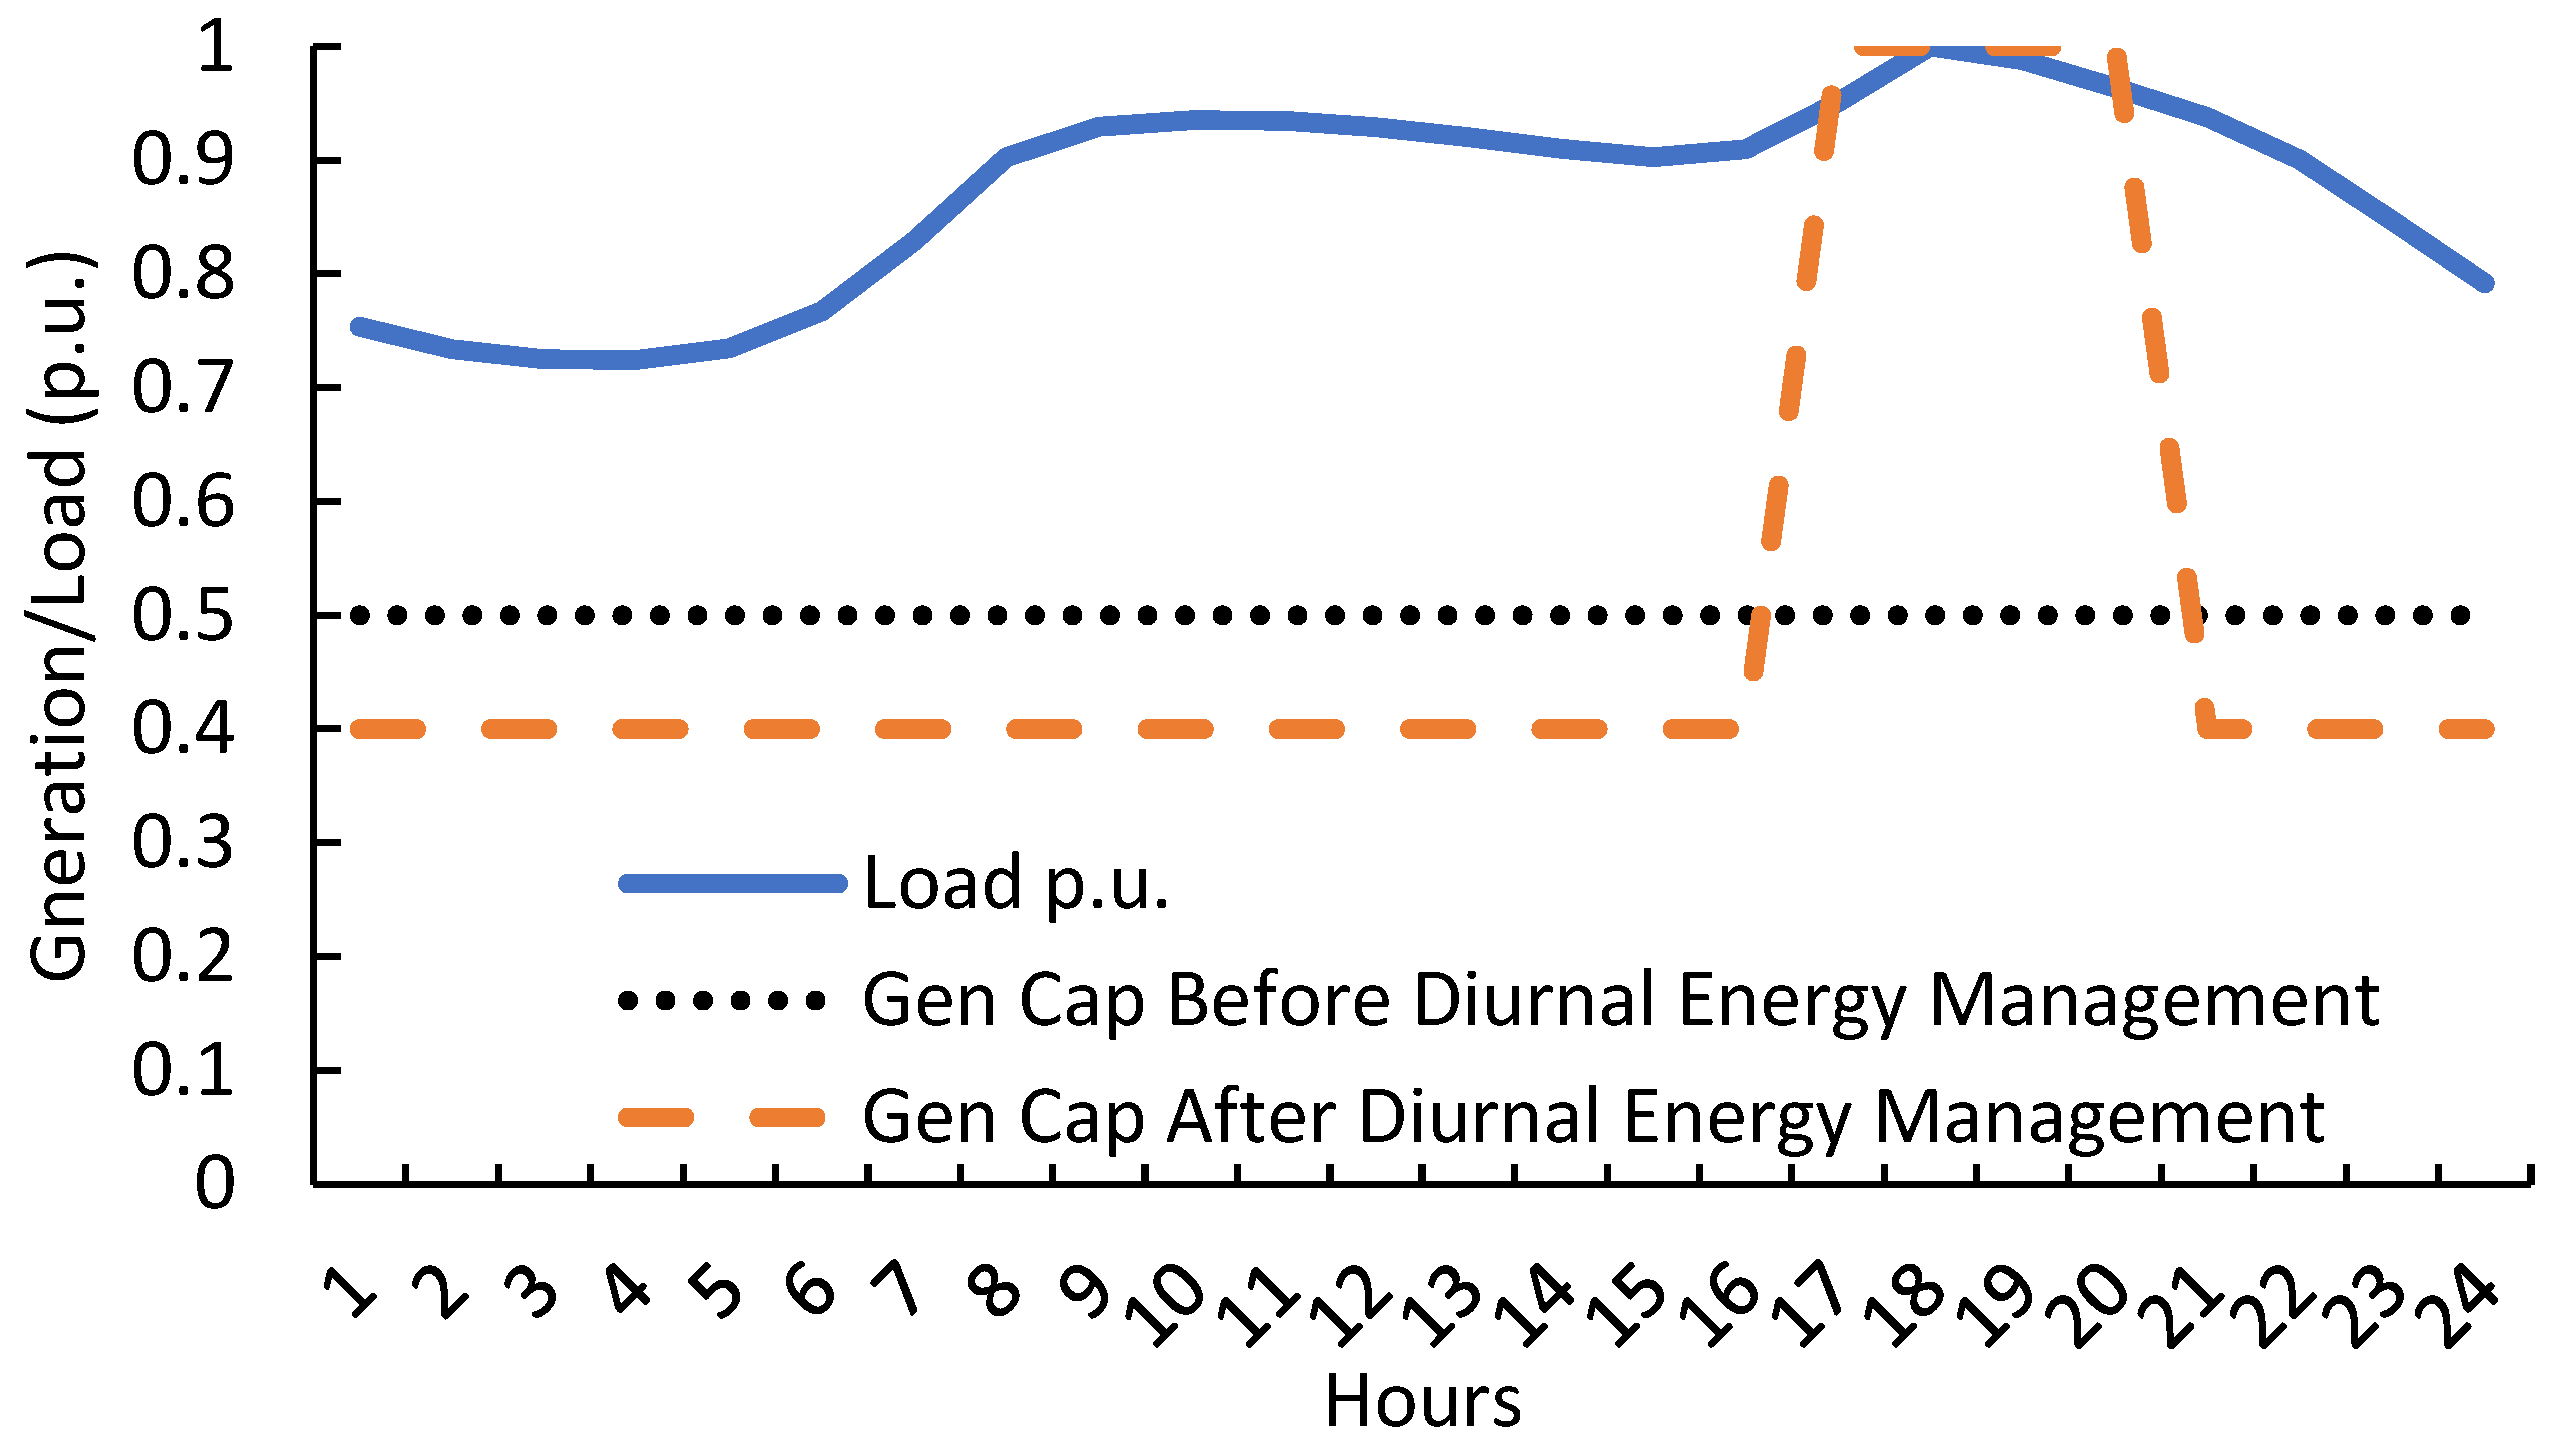
18]. The generating capacity in each hour of the day can be calculated by (3), and the total available energy of the day can be calculated by (6). The hydro unit is operated at rated capacity C for
hours during peak hours of the day, and the remaining energy in the reservoir is utilized to supply load at a constant reduced generation capacity D that is calculated in (7).
An example of diurnal energy management of a run-of-river plant is shown in
Figure 1. The hydro unit operates at rated capacity during peak load hours from Hour 17 to Hour 20 and at 40% of its rated capacity during the off-peak load hours.
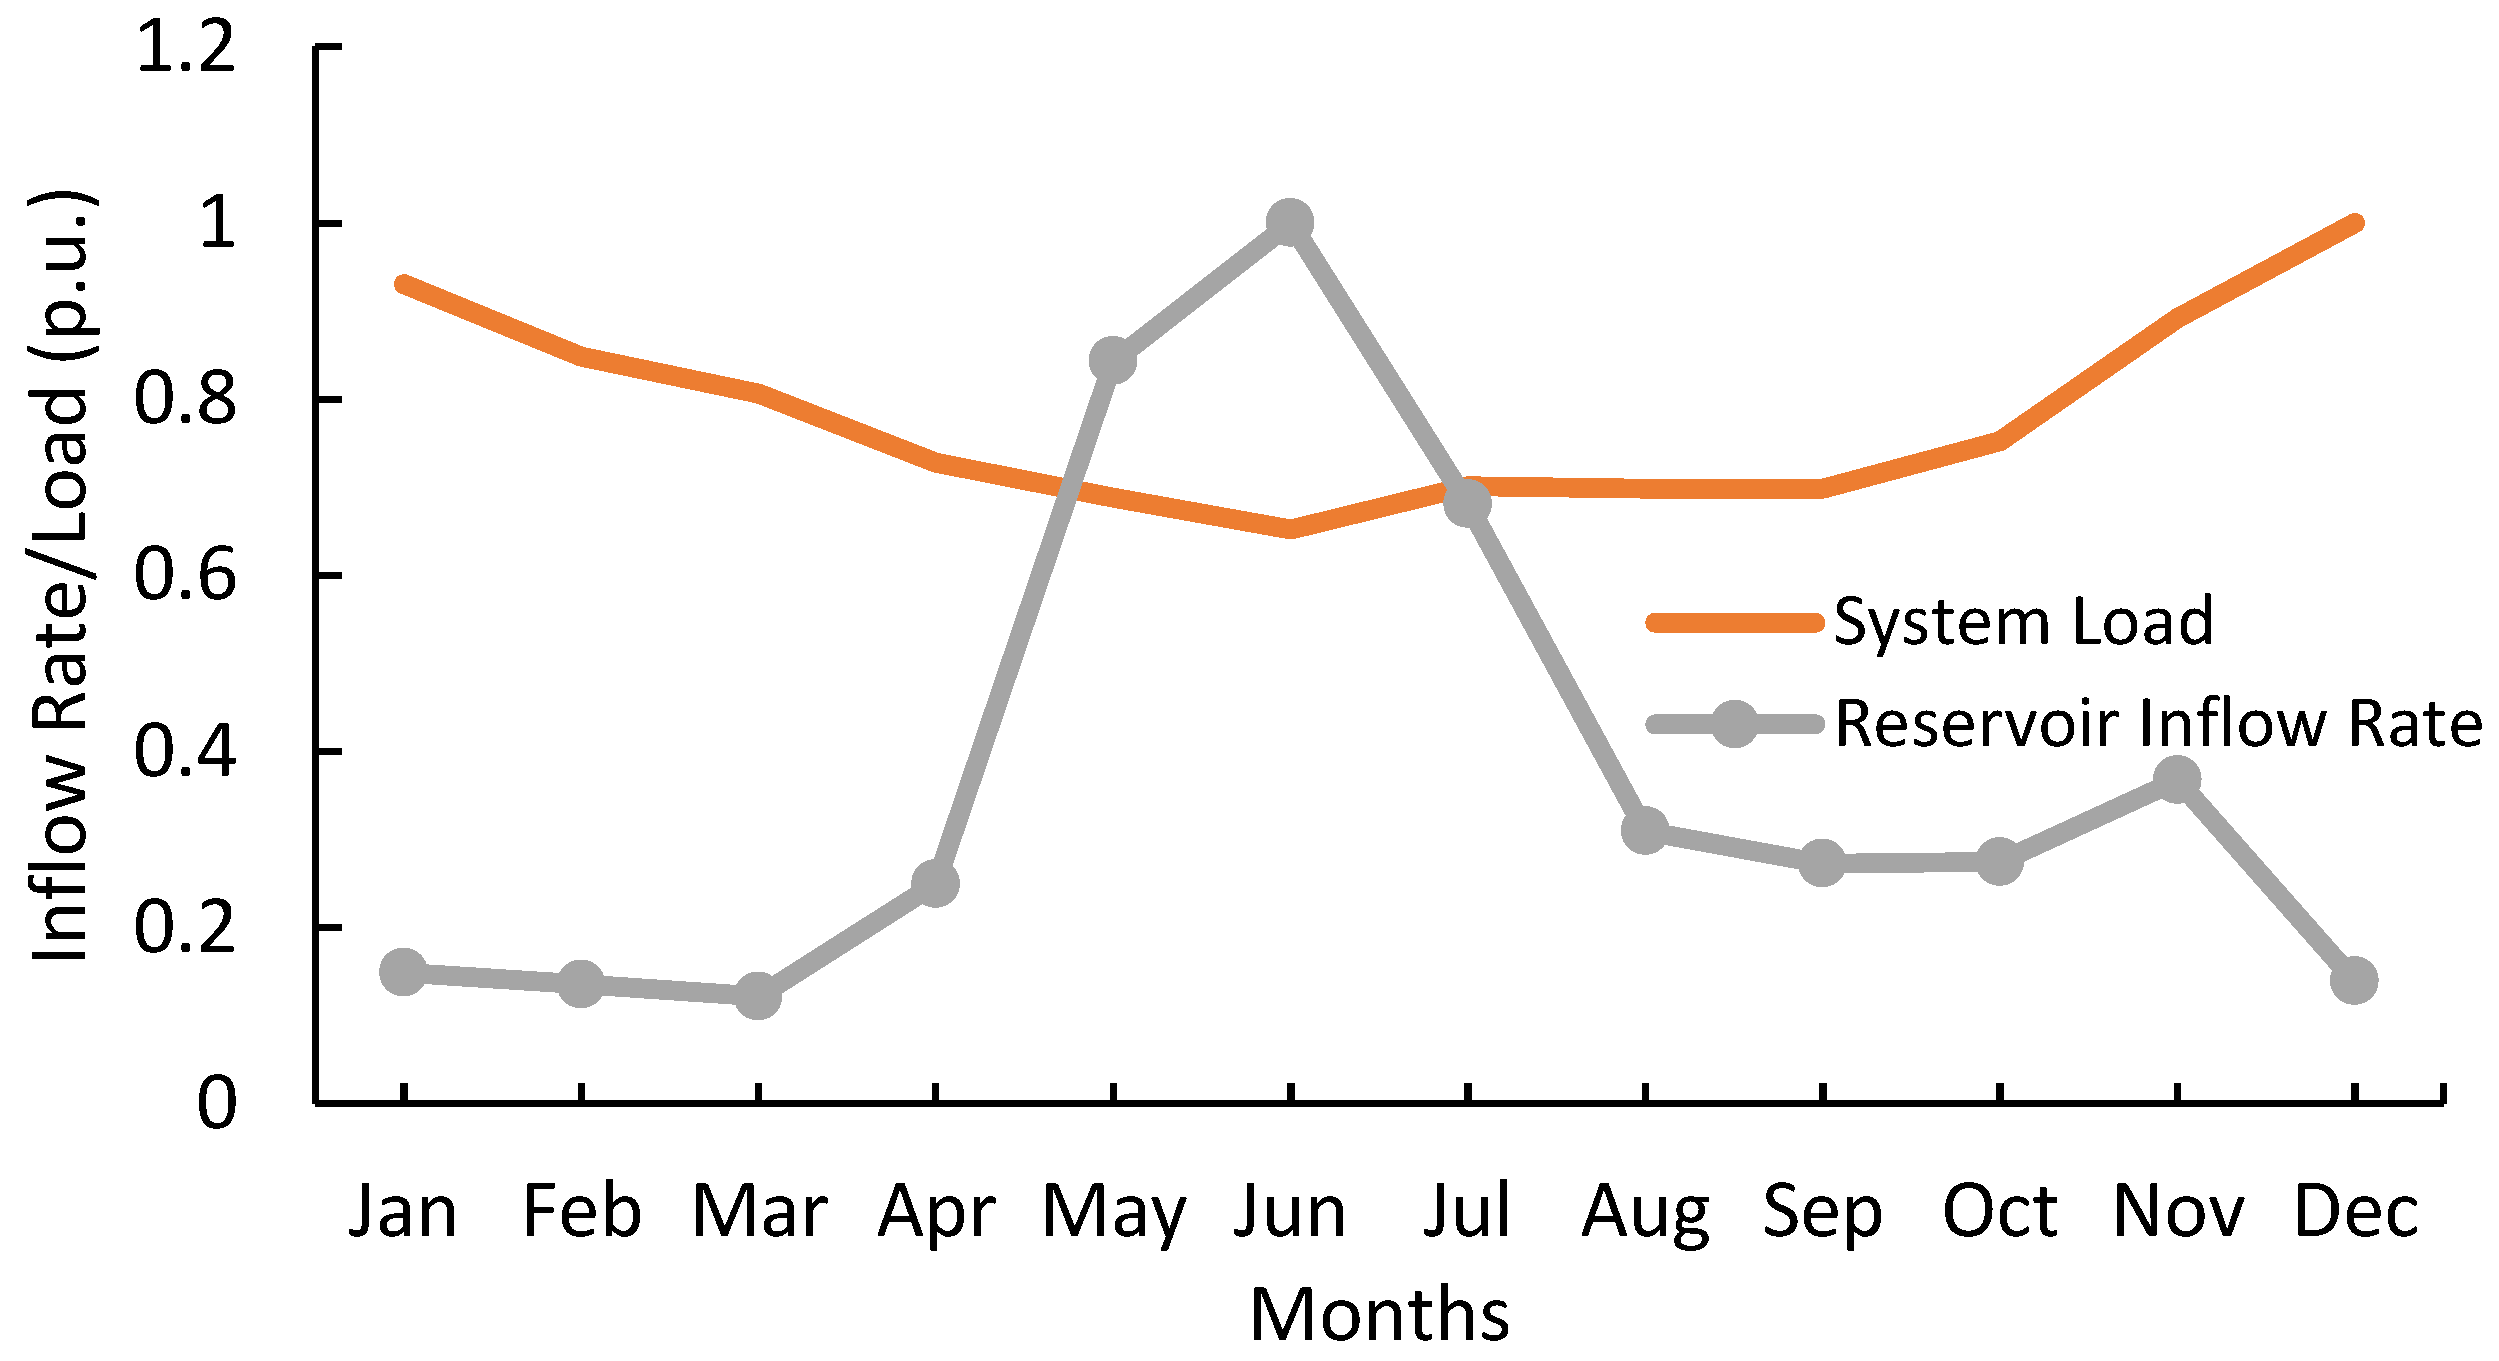
A large storage type hydro unit has the ability to carry water from one season to another. It can, therefore, be operated to save water by reducing generation output during high inflow and low load periods. The accumulated water can be carried to next year and utilized to increase the generation capacity output during peak load periods in the dry months.
Figure 2 depicts the monthly water inflow of a large storage type hydro plant and the total system load variation over a year. The figure shows that there is plenty of water from April to August that can be saved and used in the months of scarce water with peak loads from October to March.
The method described in [
19] is used to integrate the diurnal and seasonal energy management strategies of hydro dominant systems. The study year is divided into p periods consisting of a number of days with similar load and river inflow. The p period is divided into the q sub-periods as energy limitation days and energy adequate days. The energy limitation days represent days when the generation capacity output is not adequate to satisfy the load demand resulting in a high number in loss of load. The q sub-periods are further divided into two diurnal sub-periods of peak and off-peak periods in hours. The generation models of run-of-river are created for two diurnal sub-periods in the energy-limited months, so it can increase capacity in peak load hours of the day. The generation models of storage type hydro are created for each sub-period to manage the energy in the energy-limited period. During the q sub-periods, the run-of-river hydro generation model in peak load period is combined with the storage type hydro generation model in the same month to get the overall generation model in peak period. The system load models are created as load duration curves for each diurnal peak and off-peak period in each sub-period. The system generation models are convolved with each corresponding load model in the sub-period to obtain the risk index
, with i period and j sub-period, where
and
is the number of the days in period
. The annual reliability index of combined run-of-river and storage hydro units can be obtained by using (8).
where,
is the number of days in the
sub-period, and
is the risk index calculated for the
period of the
sub-period of the year.
3. Proposed Method
This section presents a probabilistic method to incorporate diurnal, seasonal and yearly energy management strategies to operate the run-of-river and storage type hydro units to minimize the impact of energy uncertainty and maintain long-term system adequacy. The impacts of reservoir size and demand side management on water utilization and system reliability are also investigated in this section.
3.1. Year to Year Energy Management
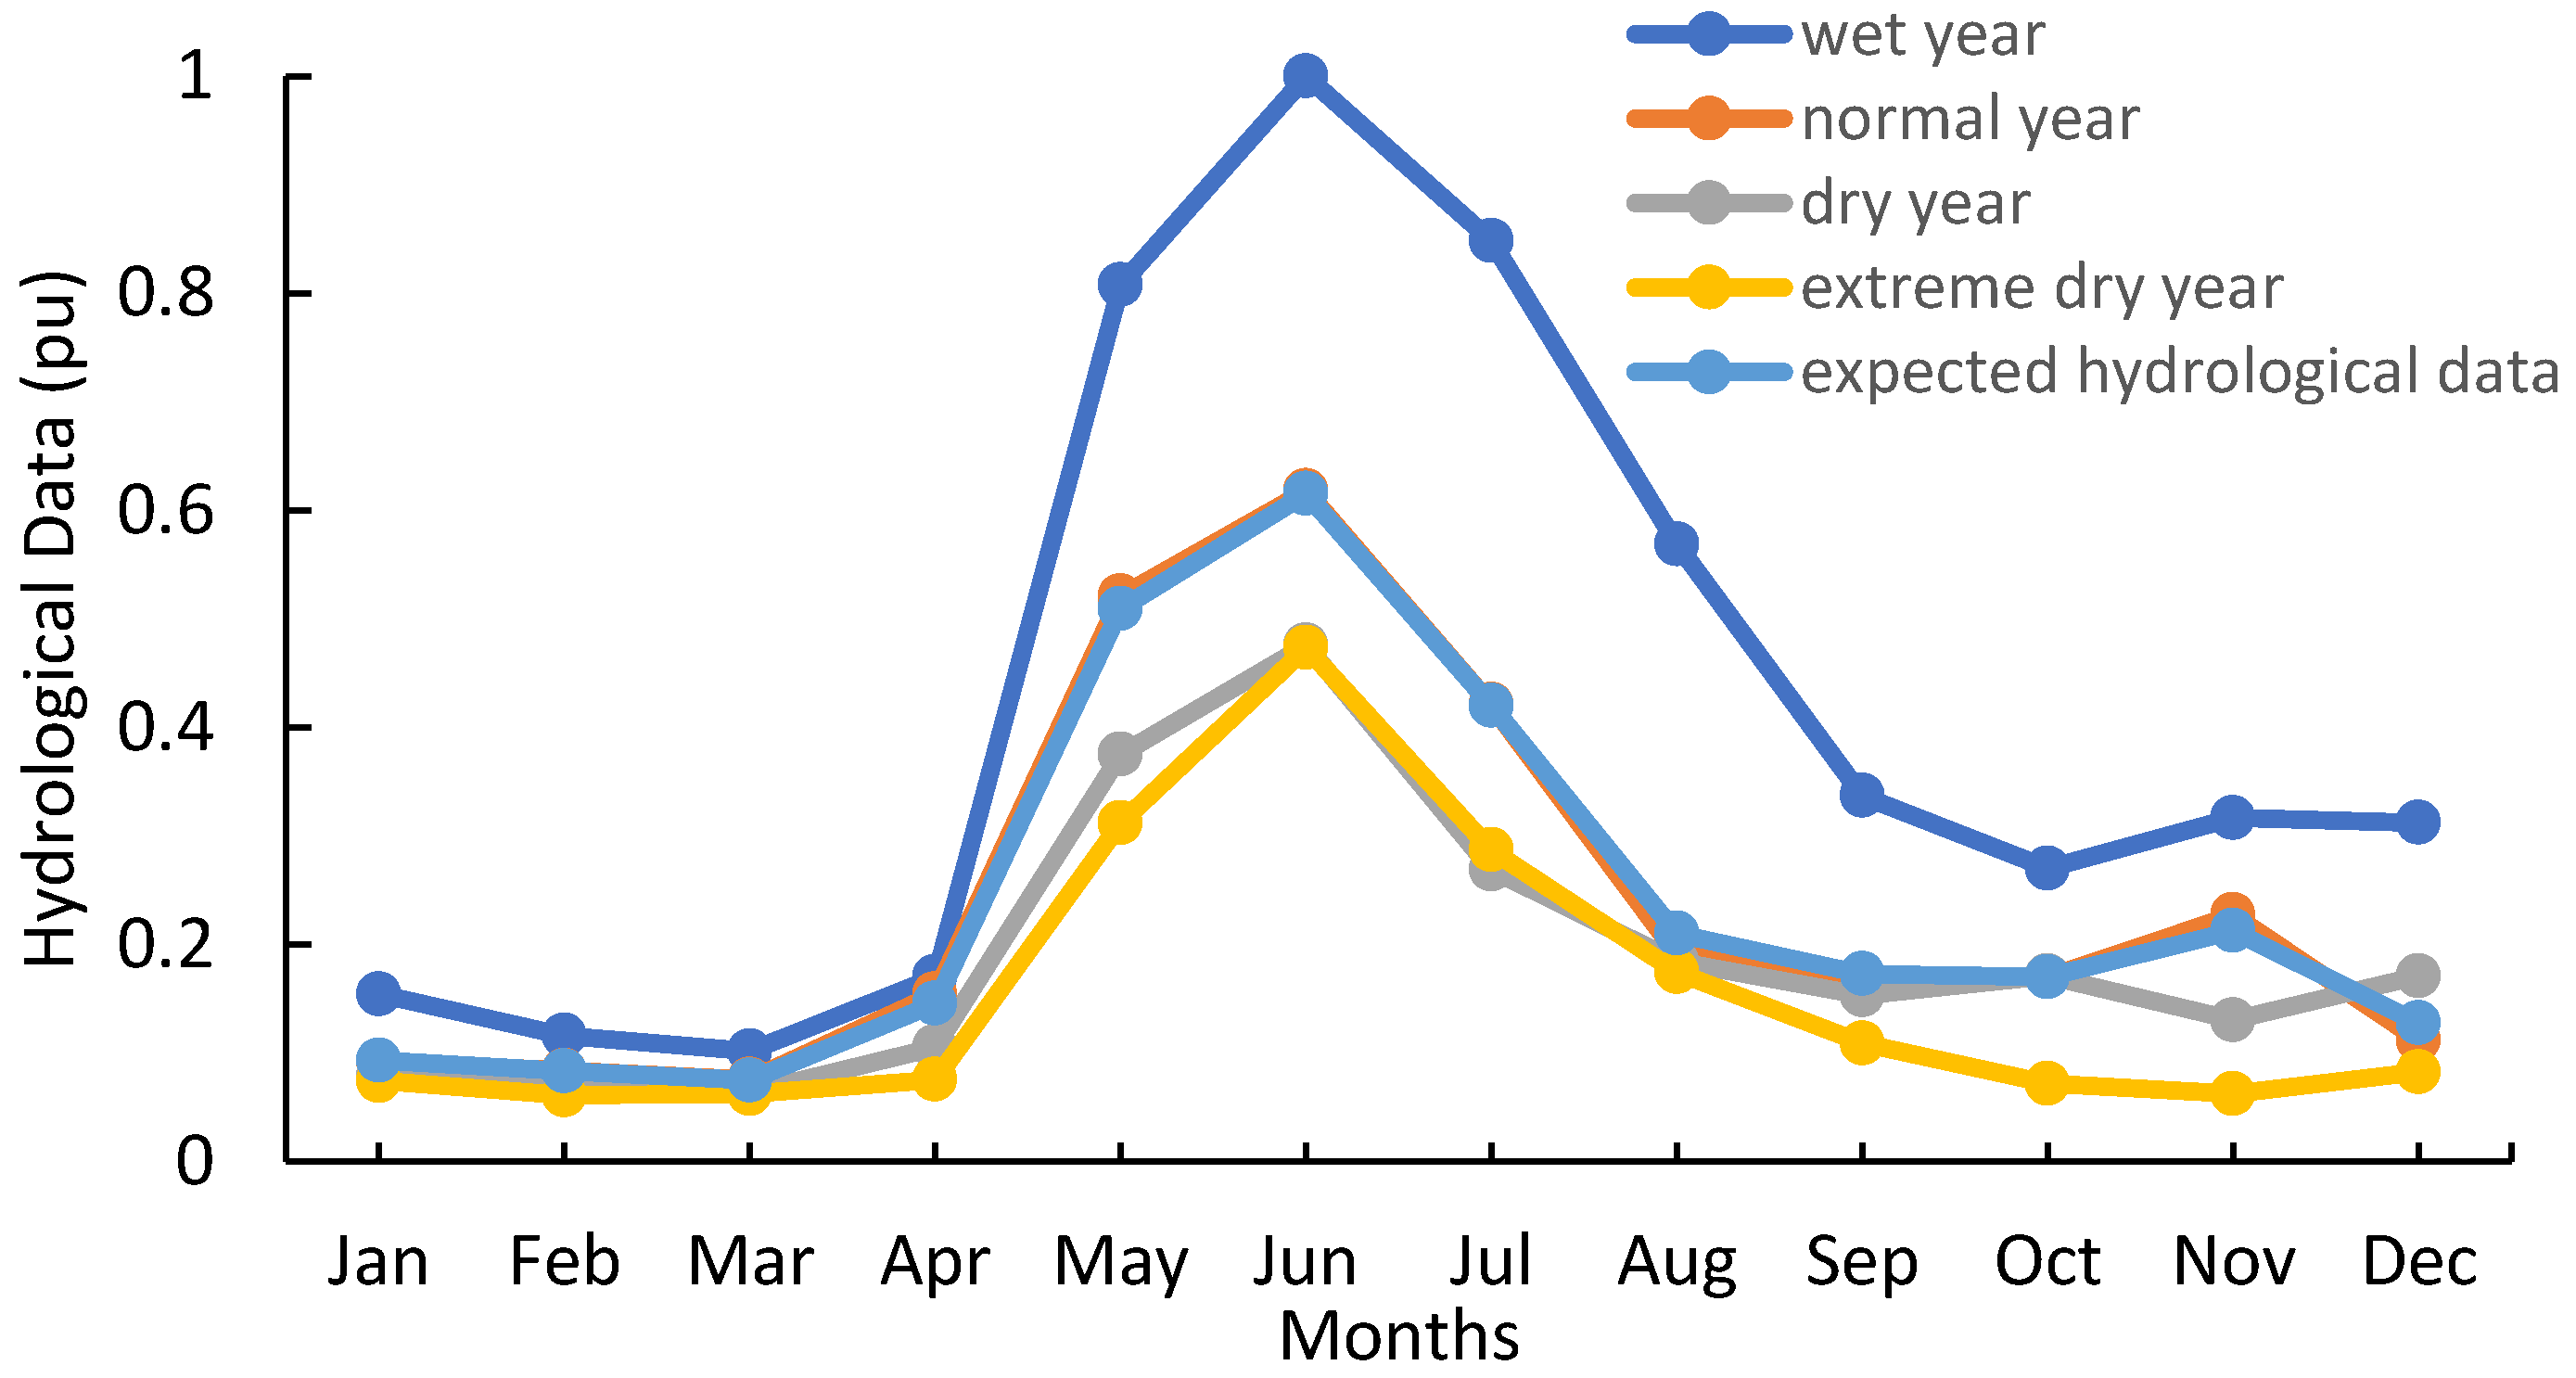
The energy management of hydro units depends on the reservoir size, load variation profiles and hydrological conditions in the study year. The objective of this method is to save water in a normal or wet year with minimal adverse impact on the system reliability by incorporating diurnal, seasonal and yearly energy management, such that a maximum amount of water will be available for the upcoming energy uncertainty year. The uncertainty in the hydrological condition in an upcoming year is represented by an expected monthly or seasonal variation in hydrological data in this work, which is obtained using Equation (9).
where
X represents the hydrological condition of the year,
W_X is the average monthly or seasonal hydrological data for the year with hydrological condition
X as shown in
Figure 3, and
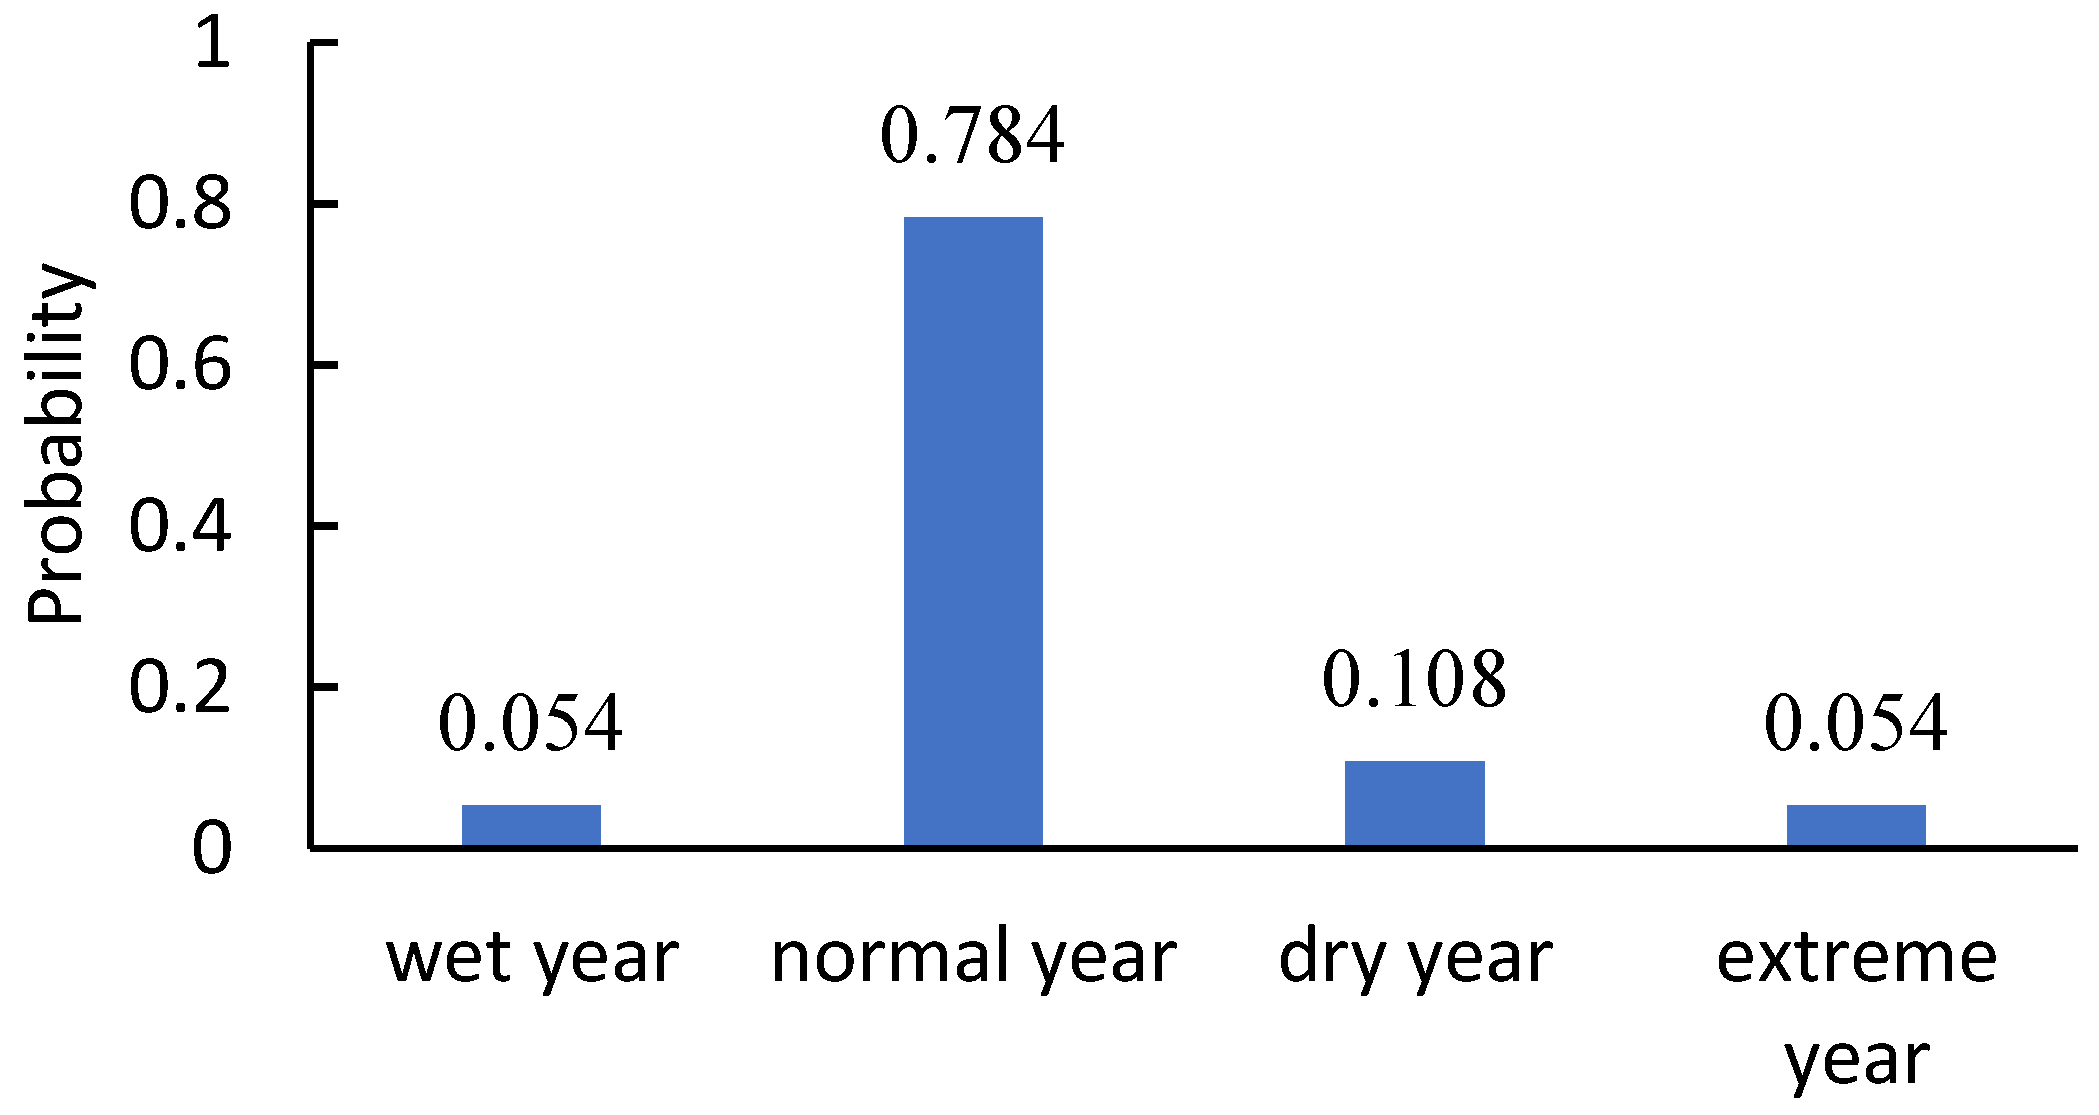
P(
X) is the probability that a year will have hydrological condition
X which is shown in
Figure 4 for the four different hydrological conditions: wet year, normal year, dry year and extreme dry year.
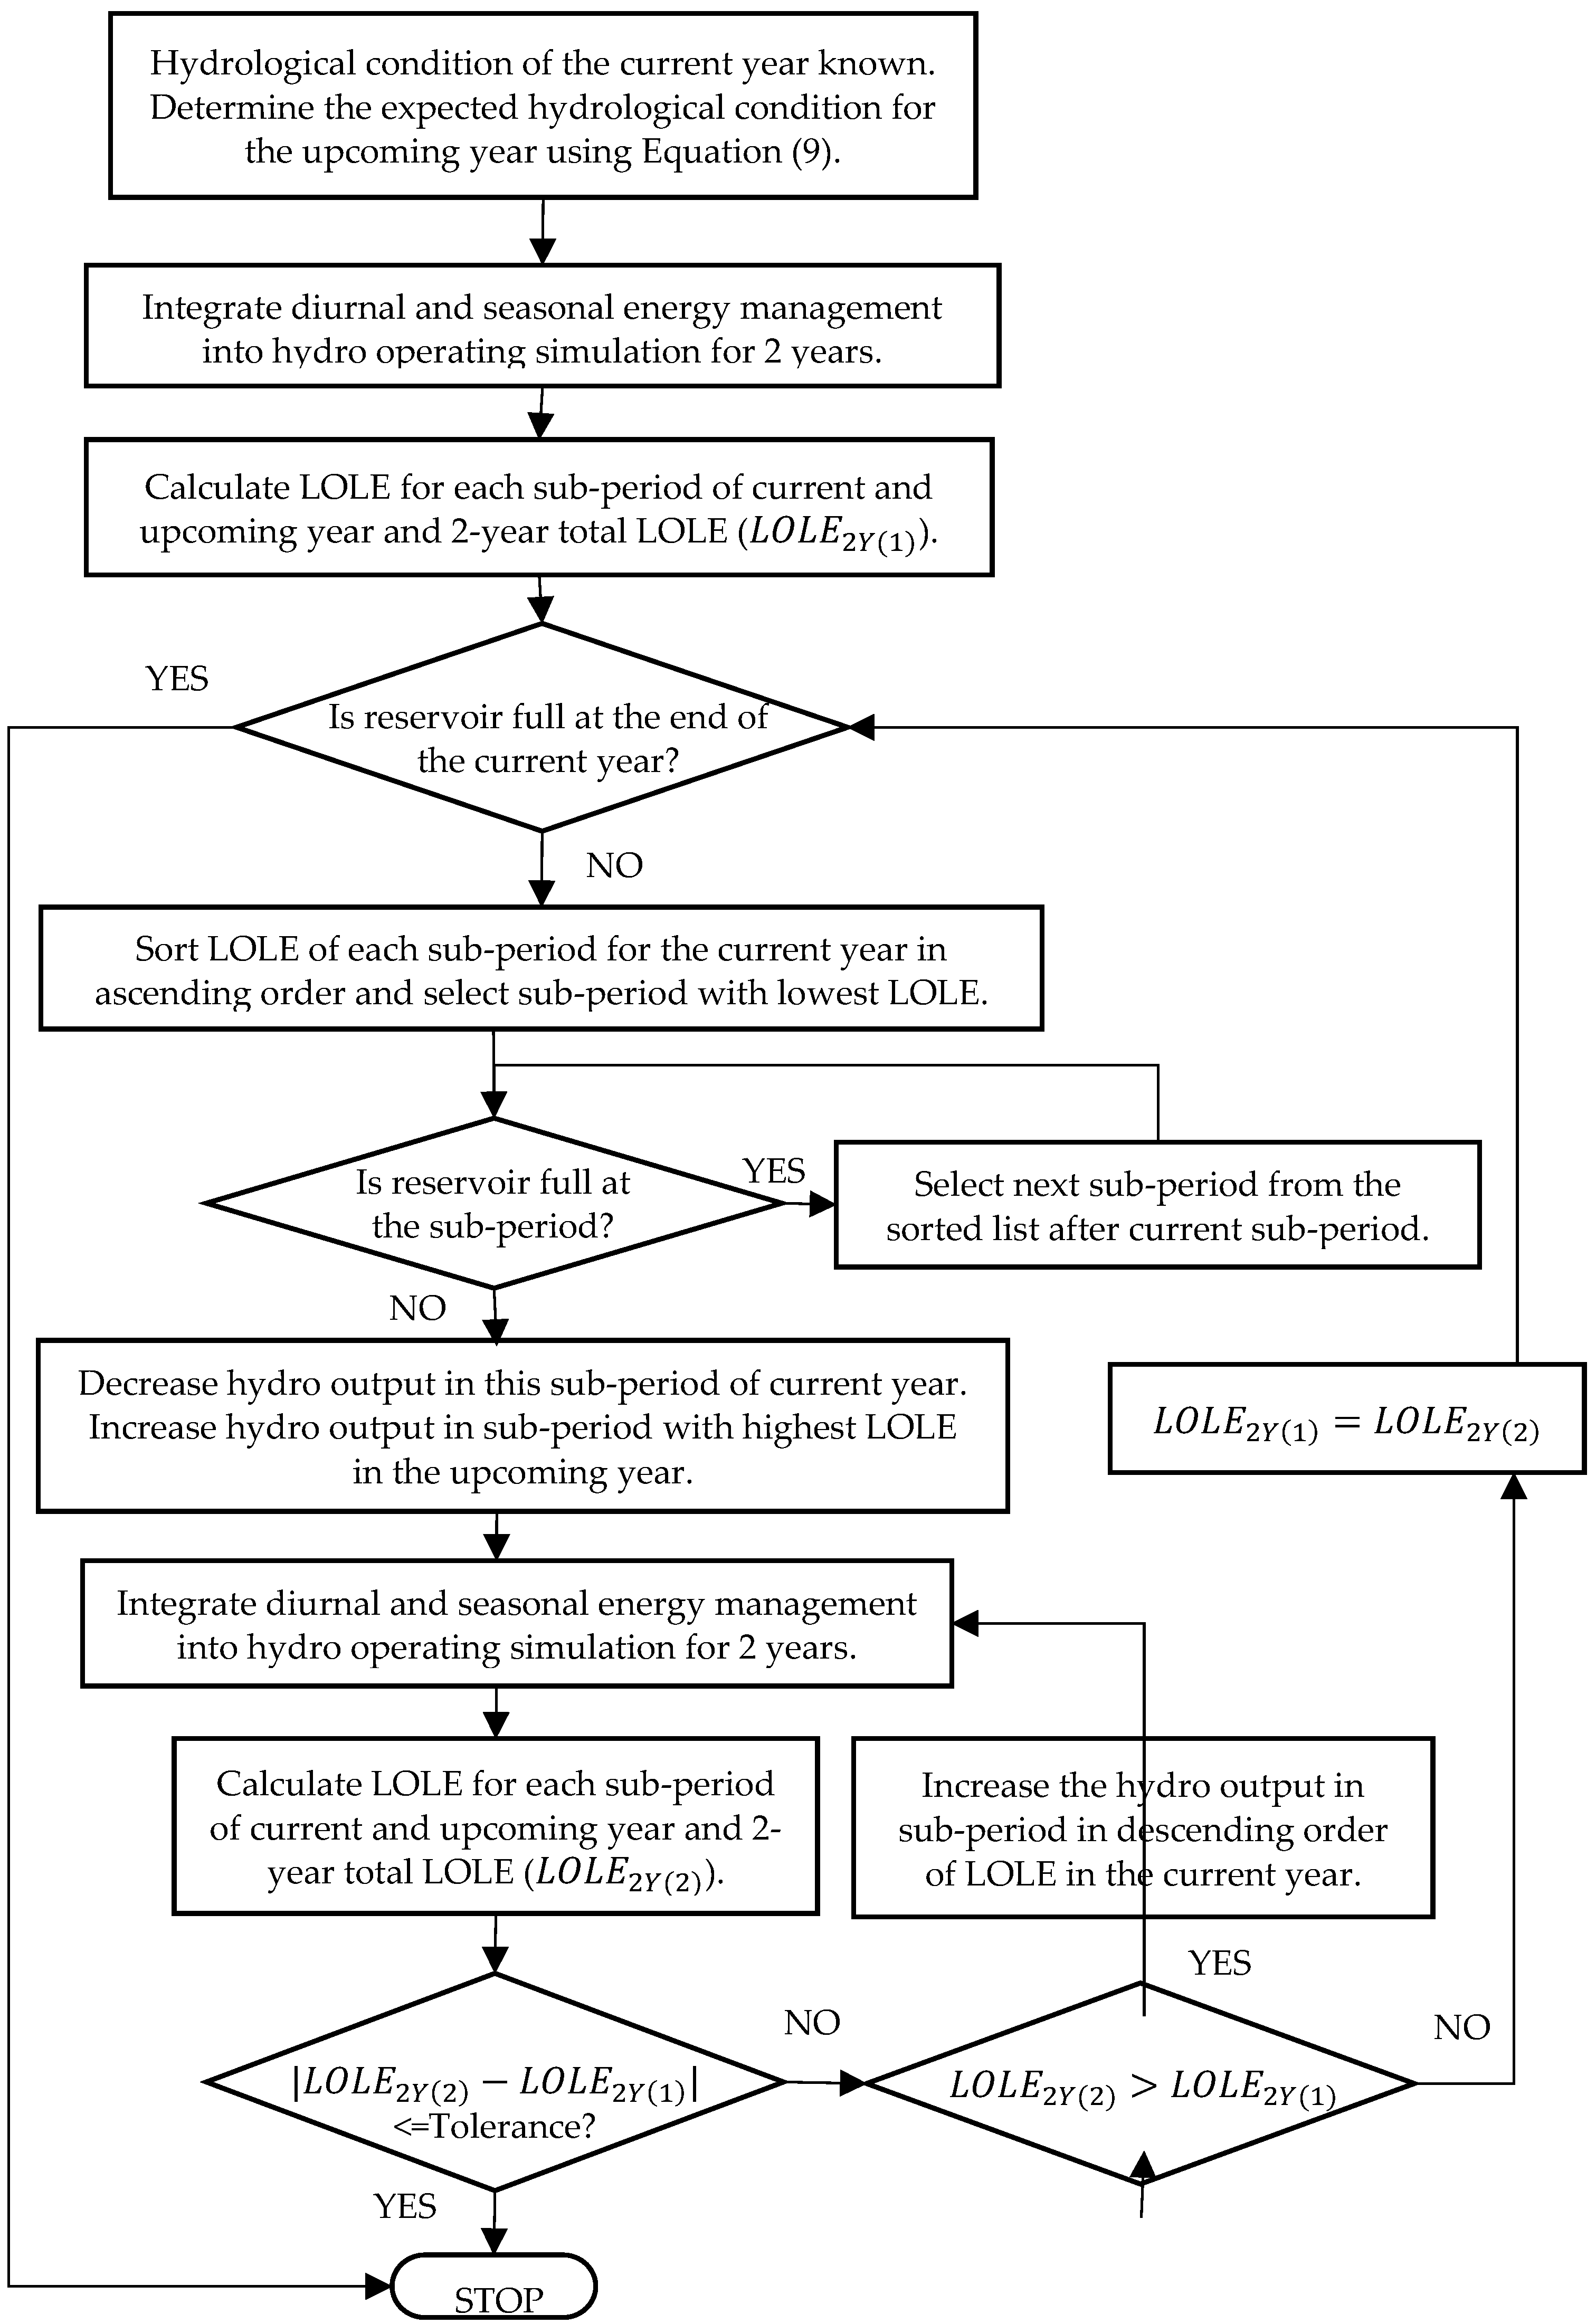
The algorithm involved in implementing the methodology is shown in
Figure 5 and described in the following steps:
The hydrological condition of the current year is known. Determine the expected hydrological data of the upcoming year using the probabilistic hydrological model obtained from Equation (9).
Integrate the diurnal and seasonal energy management strategy of the hydro dominant system as described in
Section 2 into the hydro operating simulation. Evaluate the system reliability indices, such as the LOLE, for each sub-period of the current year and following year using Equation (8) to understand the characteristics of the system.
If the reservoir is full at the end of the current year, further energy management is not needed. Otherwise, sort the LOLE values of the sub-period in the current year in ascending order. Check the reservoir capacity of the sub-period with the lowest LOLE. If it is not full, decrease the hydropower output in the sub-period to save more water in the reservoir. Then run the whole year simulation again to evaluate the LOLE values and reservoir levels for each sub-period.
If the hydro operating simulation results in reservoir full in the lowest LOLE sub-period, then follow the ascending order and find the next lowest LOLE sub-period with water storage capability in a reservoir in the current year, and modify year to year energy management strategy to reduce the amount of generation in the sub-period. In the following year, the generation output capability of the hydro unit is increased in the sub-periods with the highest LOLE values by utilizing saved water from the year to year energy management in the previous year. Then run the two-year simulation again to update the LOLE values for each sub-period and the water level in reservoirs.
If the total two-year LOLE value after applying the most recent year to year energy management is lower than the previous LOLE value, then repeat step 3.
If the total two-year LOLE value after applying the most recent year to year energy management is higher than the previous LOLE value, then slightly increase the hydropower output in the sub-period in the descending order of the LOLE values of the current year. If the small amount of increase of hydropower output will result in a huge amount of LOLE increase, then move to the next highest LOLE value sub-period. Again, run the two-year simulation to identify the total LOLE values.
Repeat step 5 and 6 to keep adjusting the year to year energy management until the maximum storage of water is reached with the lowest two-year total LOLE values.
The year to year energy management is applied to the modified IEEE RTS system consisting of six hydro plants (with three run-of-river and three storage hydro plants) and two thermal plants. The historical river flow pattern of BC province in Canada [
20] was used in the study. The data includes the inflow rate at monthly intervals for the different rivers in different hydrological years as shown in
Figure 3. The generation output capability can be calculated using Equation (3) based on the inflow pattern for each month in
Figure 3 and the reservoir condition of every hour can be updated using Equations (4) and (5). A study was done assuming the current as a normal hydrological year which has a wet season from May to October, and a dry season from November to April. The following year was assumed as a dry year in the study with reduced water in the wet season and inadequate water in the dry season as shown in
Figure 3.
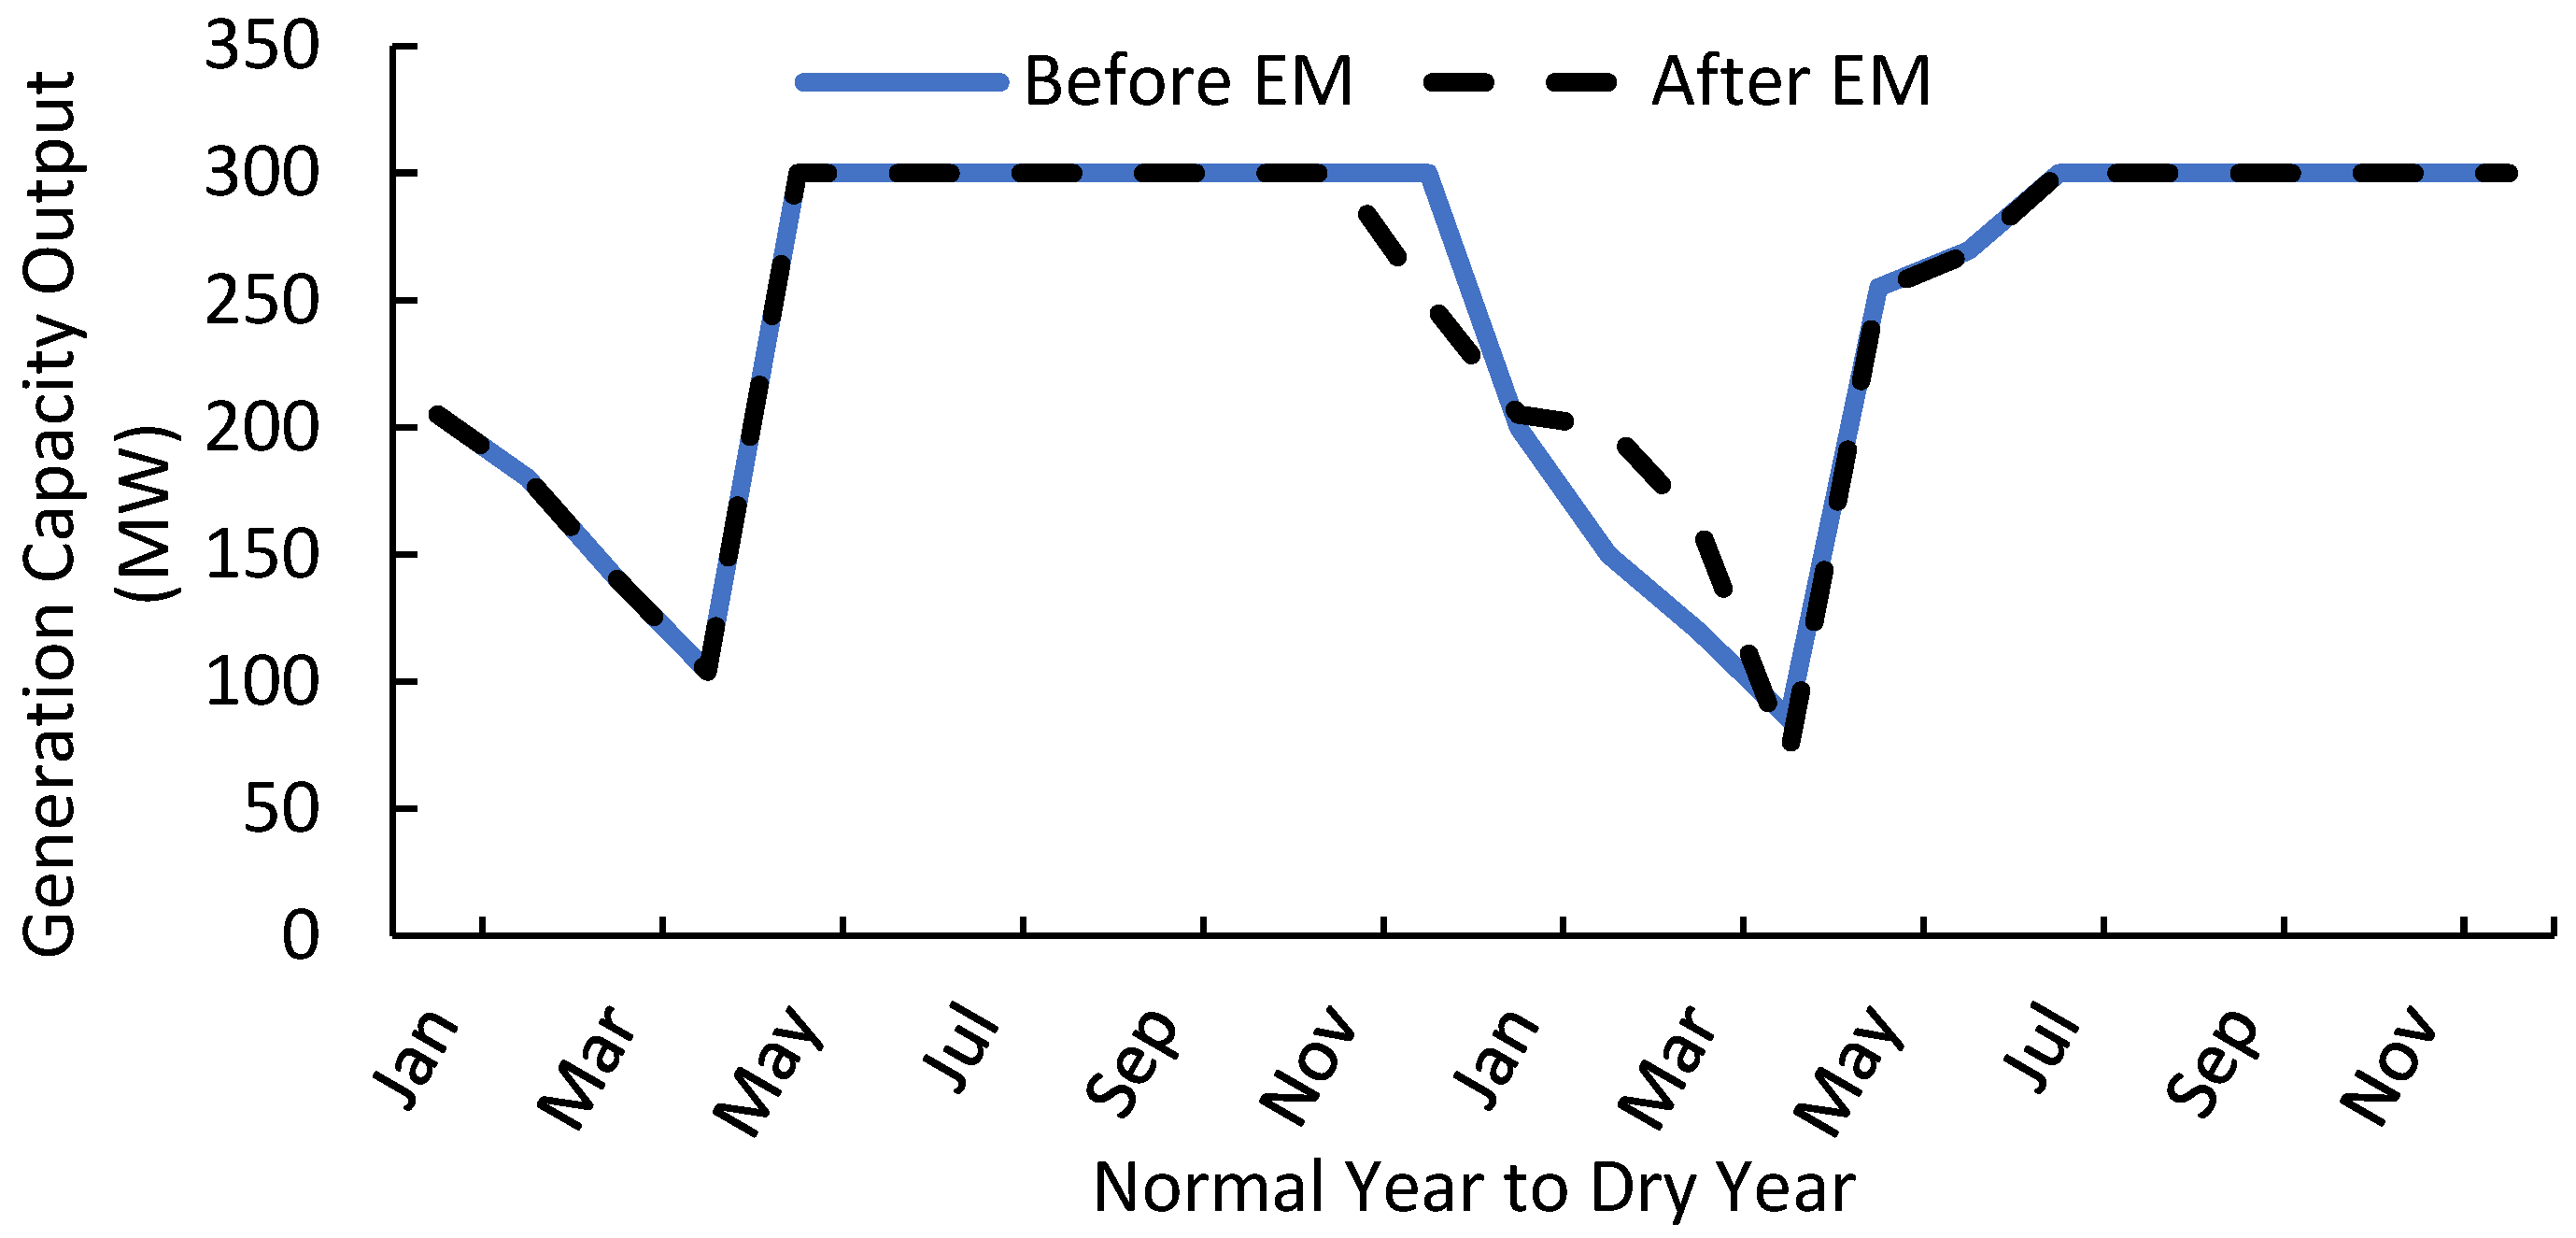
Without the year to year energy management, November and December in the current year were simulated at its rated generation capacity to meet peak load demand as shown in
Figure 6. As a result, the reservoir was full until October and the stored water in the reservoir began to rapidly decrease from the November of the current year due to low river inflow in the dry season. The generation capacity output dropped each month from the current year to the next year in the dry season.
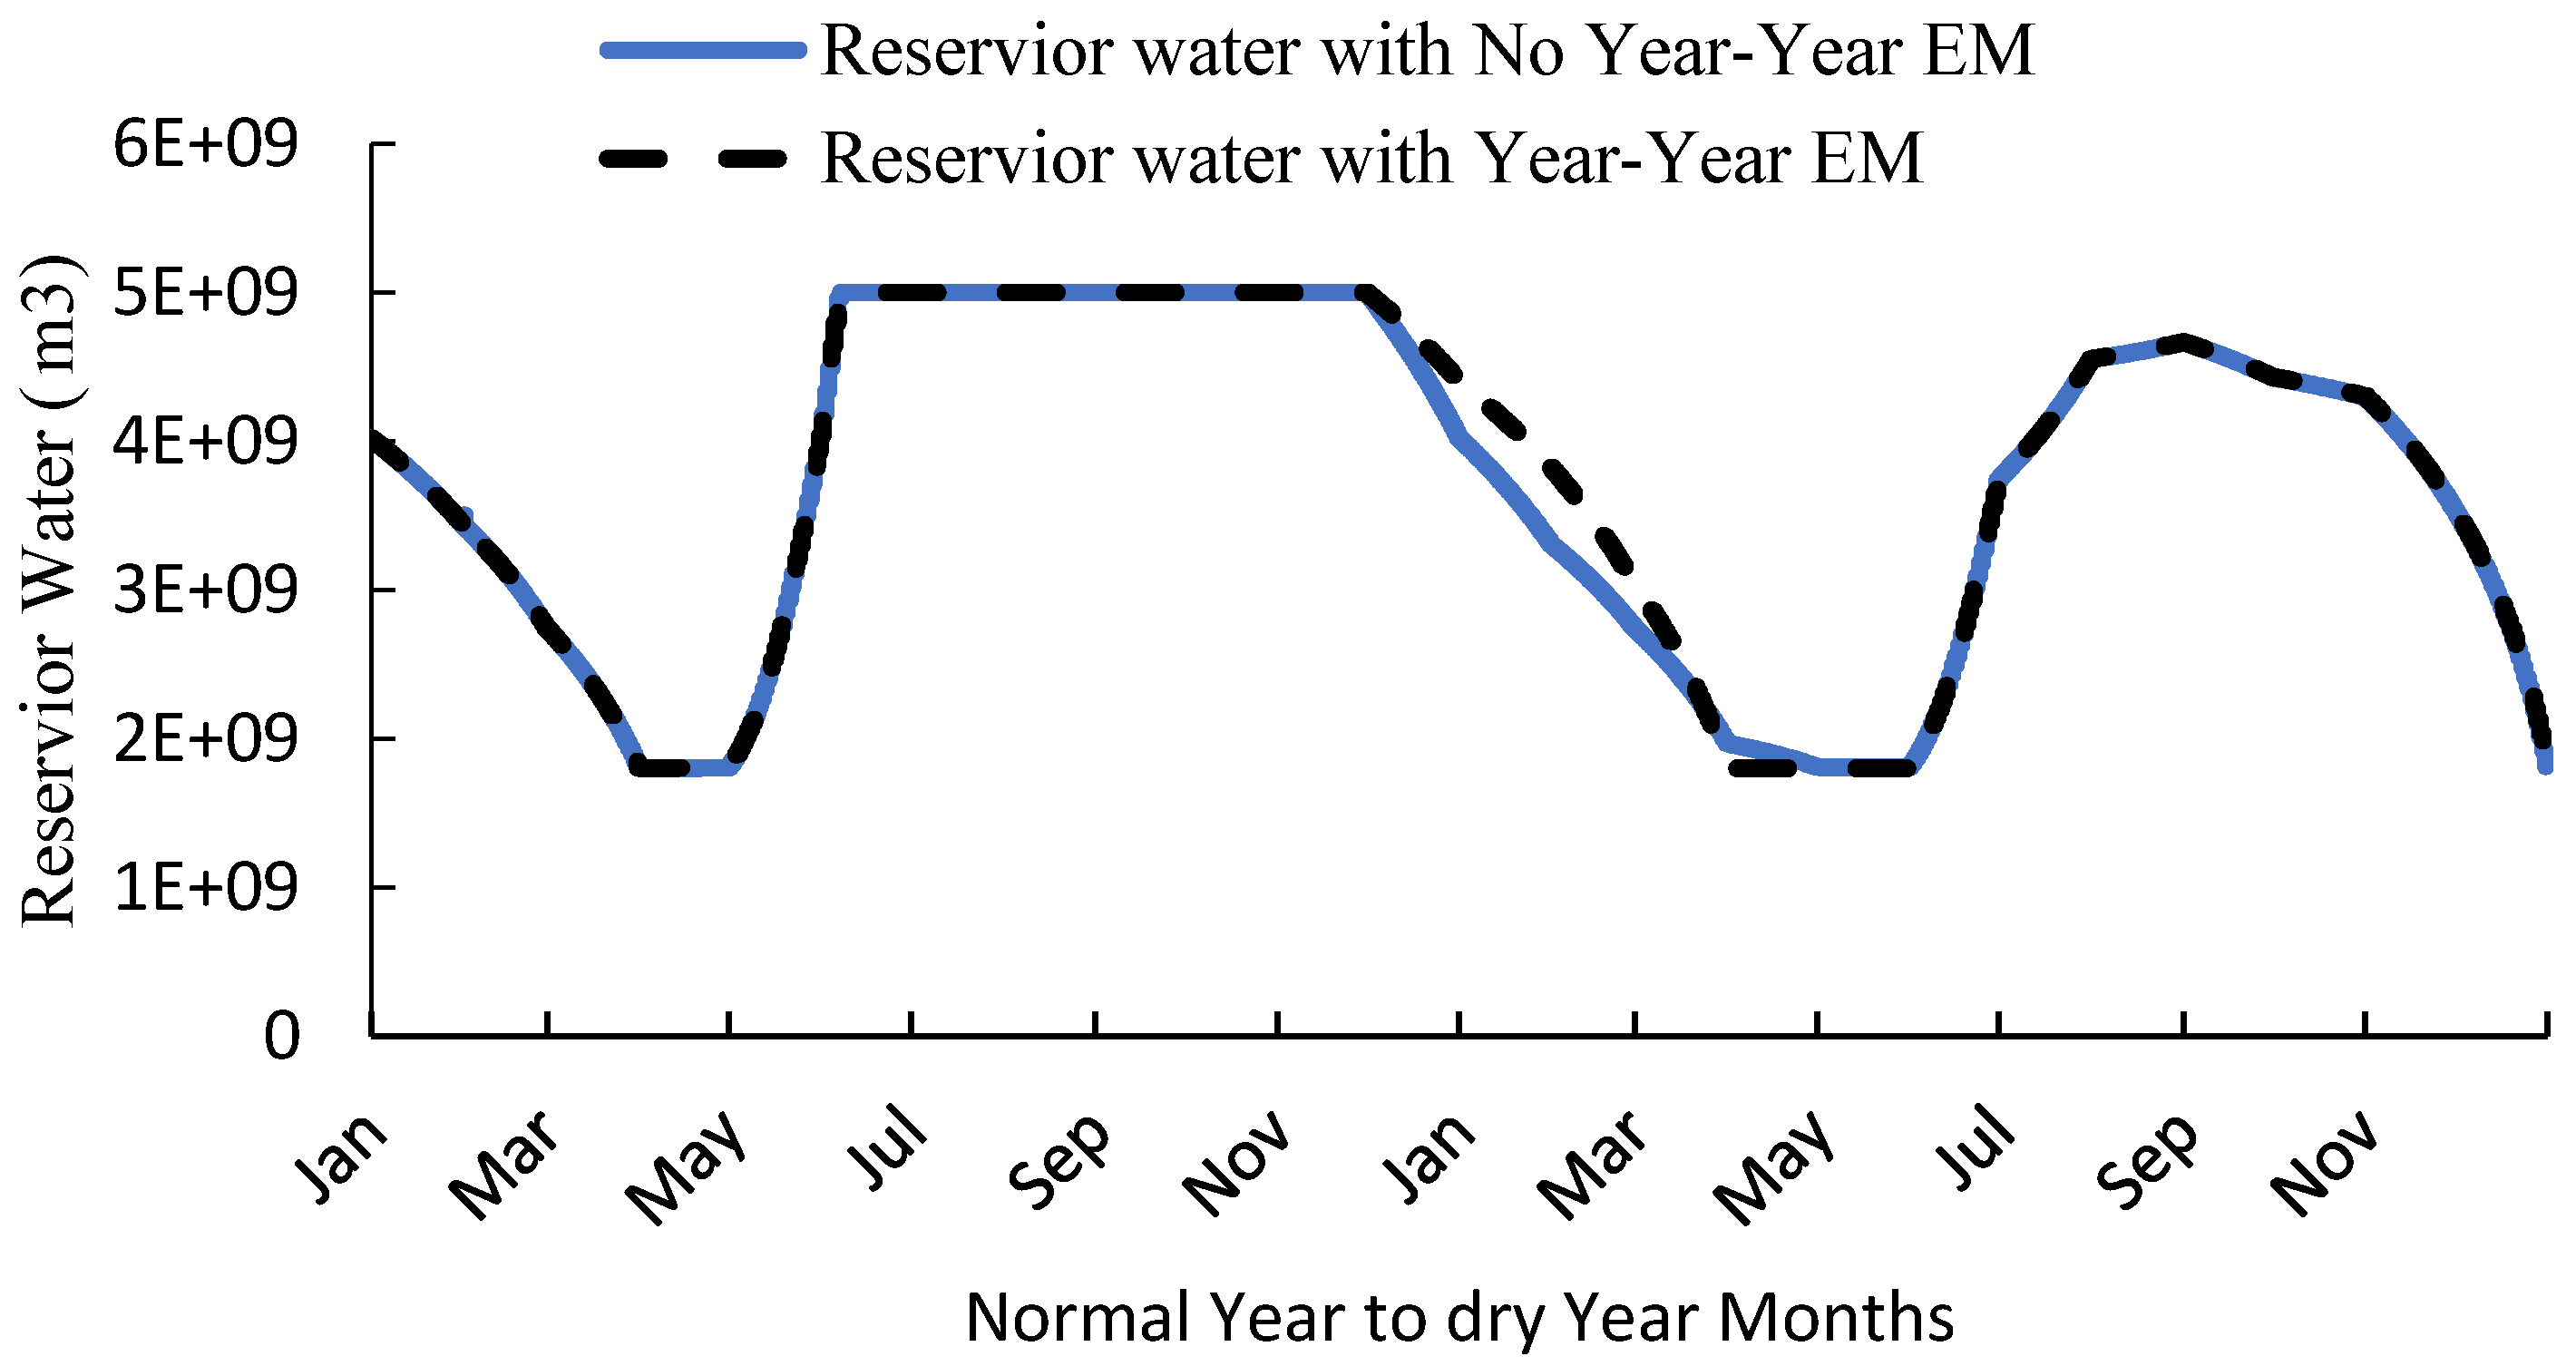
With the implementation of the year to year energy management, the amount of water that can be carried from one year to another is very restricted due to the reservoir capacity as shown in
Figure 7. However, the amount of water can be distributed at critical times between January to March to mitigate the scarcity of energy during the dry months of the following dry year. The contribution of the saved water can be seen in
Figure 6. The water saved by reducing generation in the current year is used to increase the generation capacity output from January to March in the following year to meet the load demand.
3.2. Increase of Reservoir Size
The size or capacity of the reservoir is one of the main limitations in energy management, as discussed in
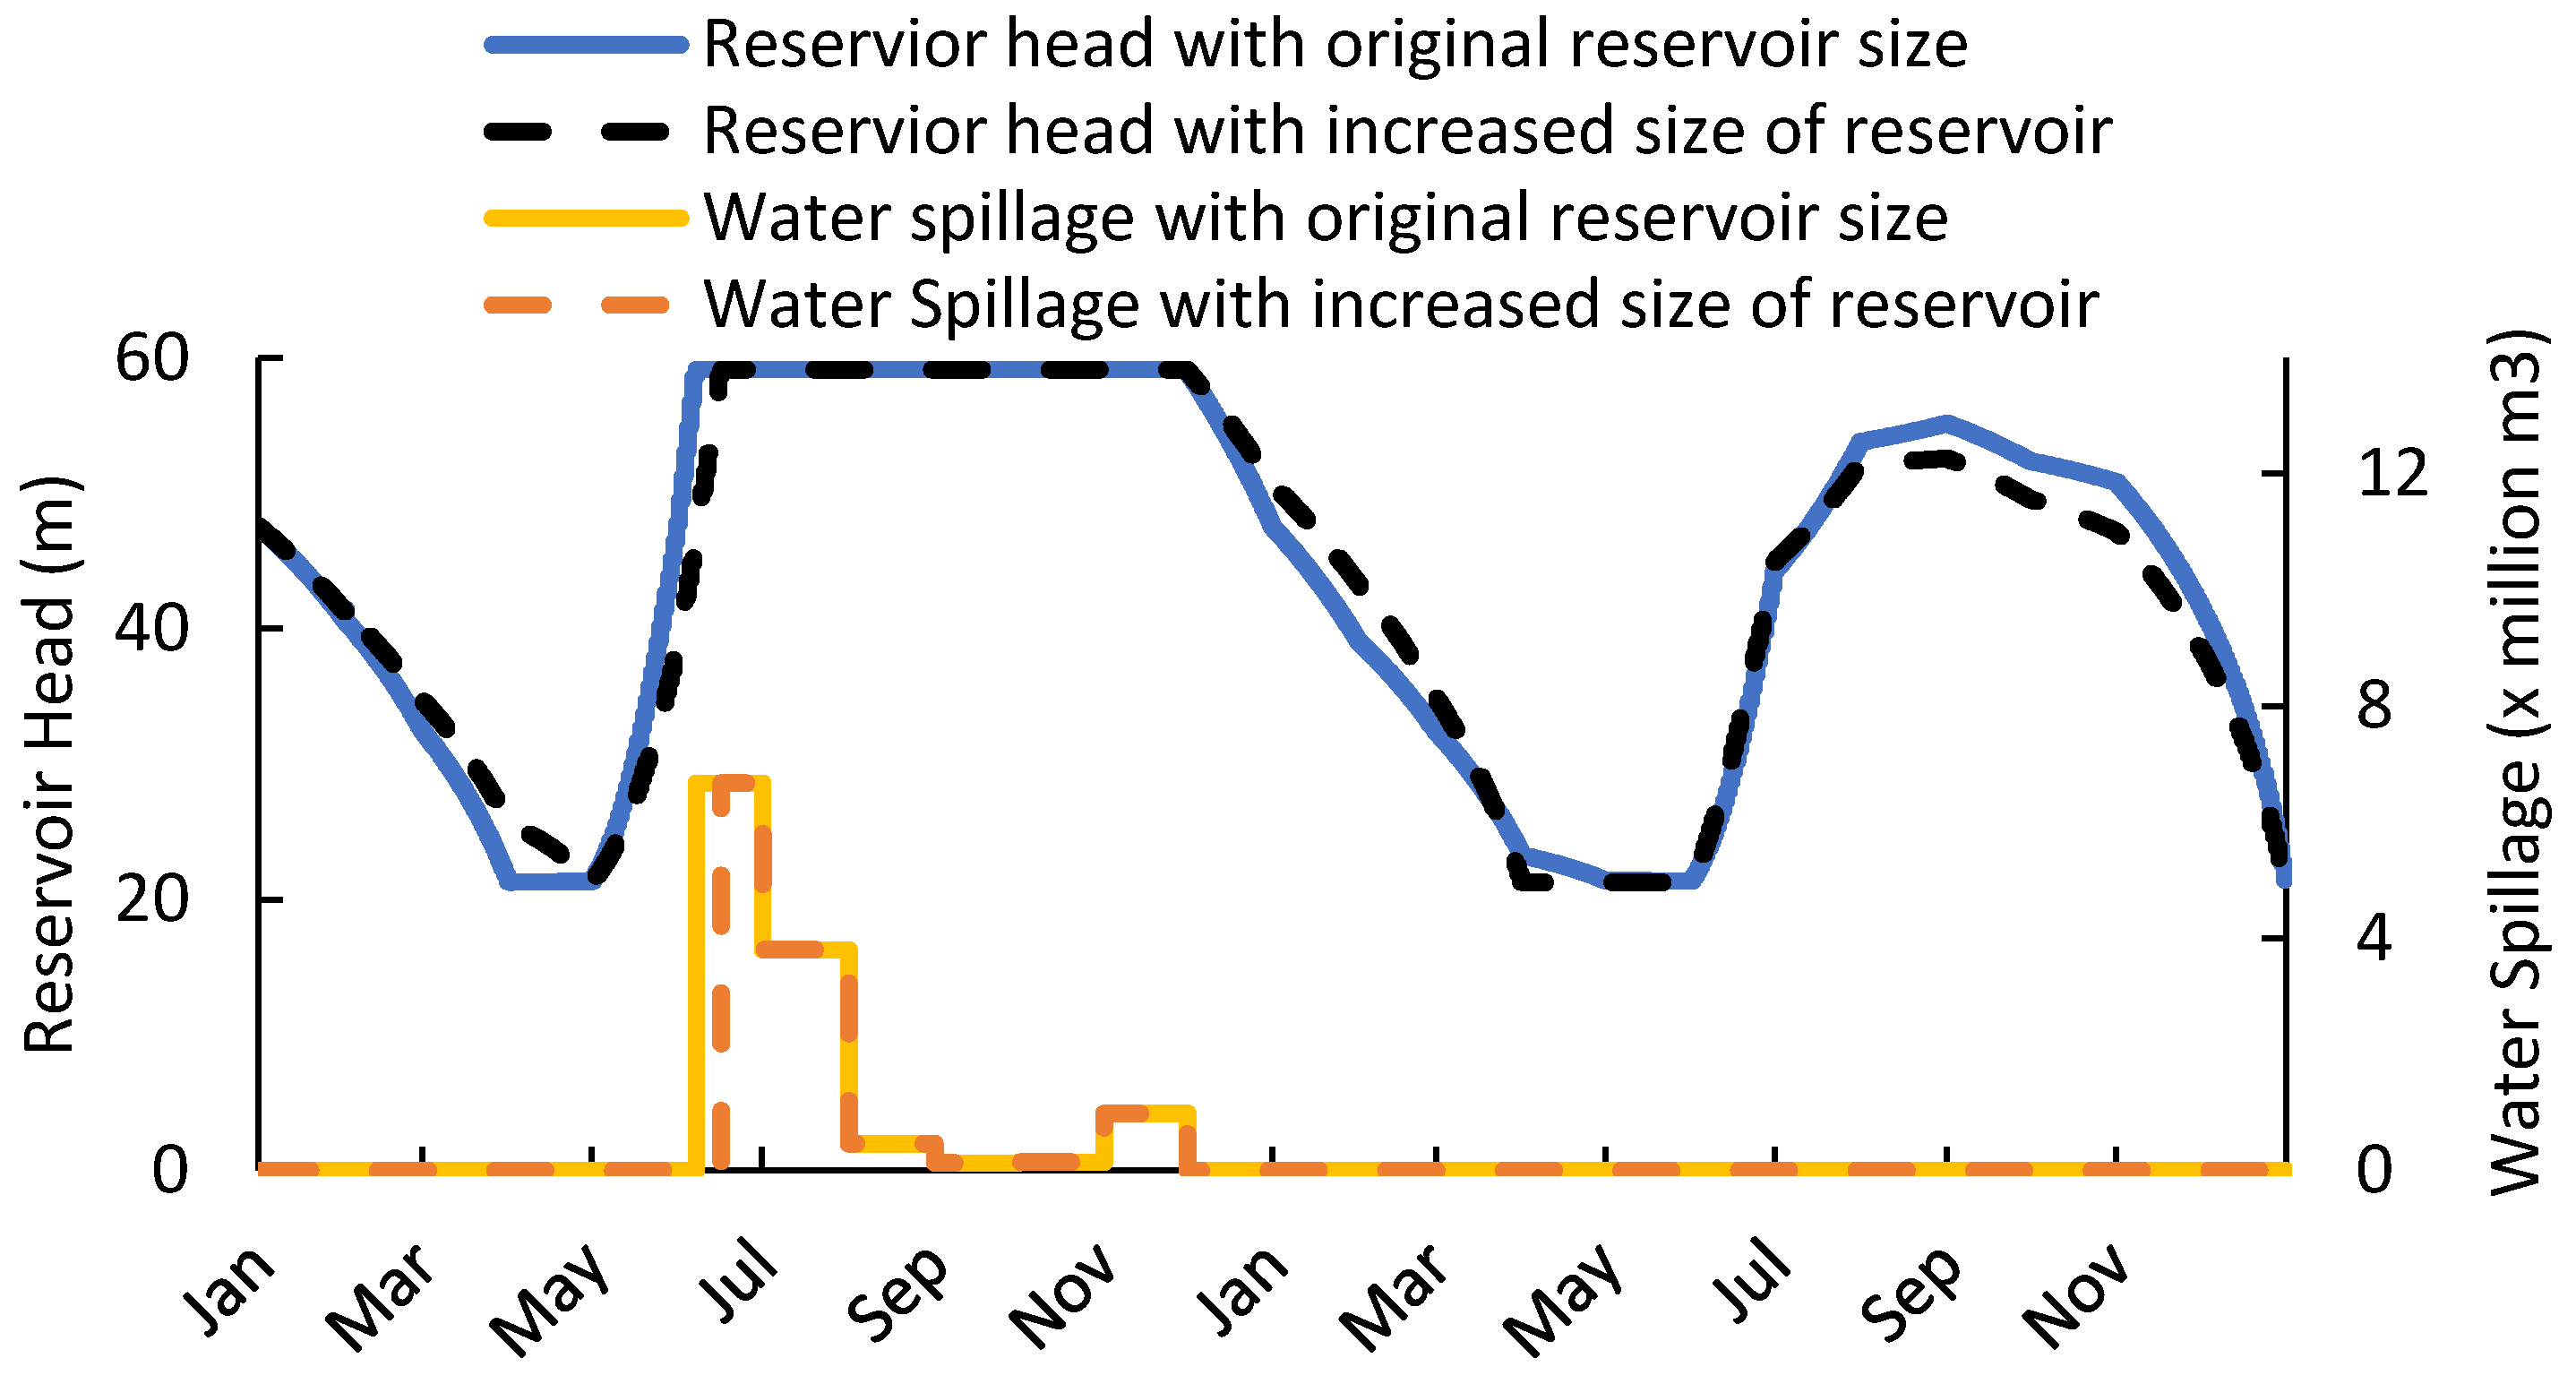
Section 3.1. With current reservoir size restraints, a large amount of water in the wet season is wasted as spillage. The reliability can be enhanced by increasing the reservoir size to avoid water spillage. It can store and manage additional energy from year to year as needed.
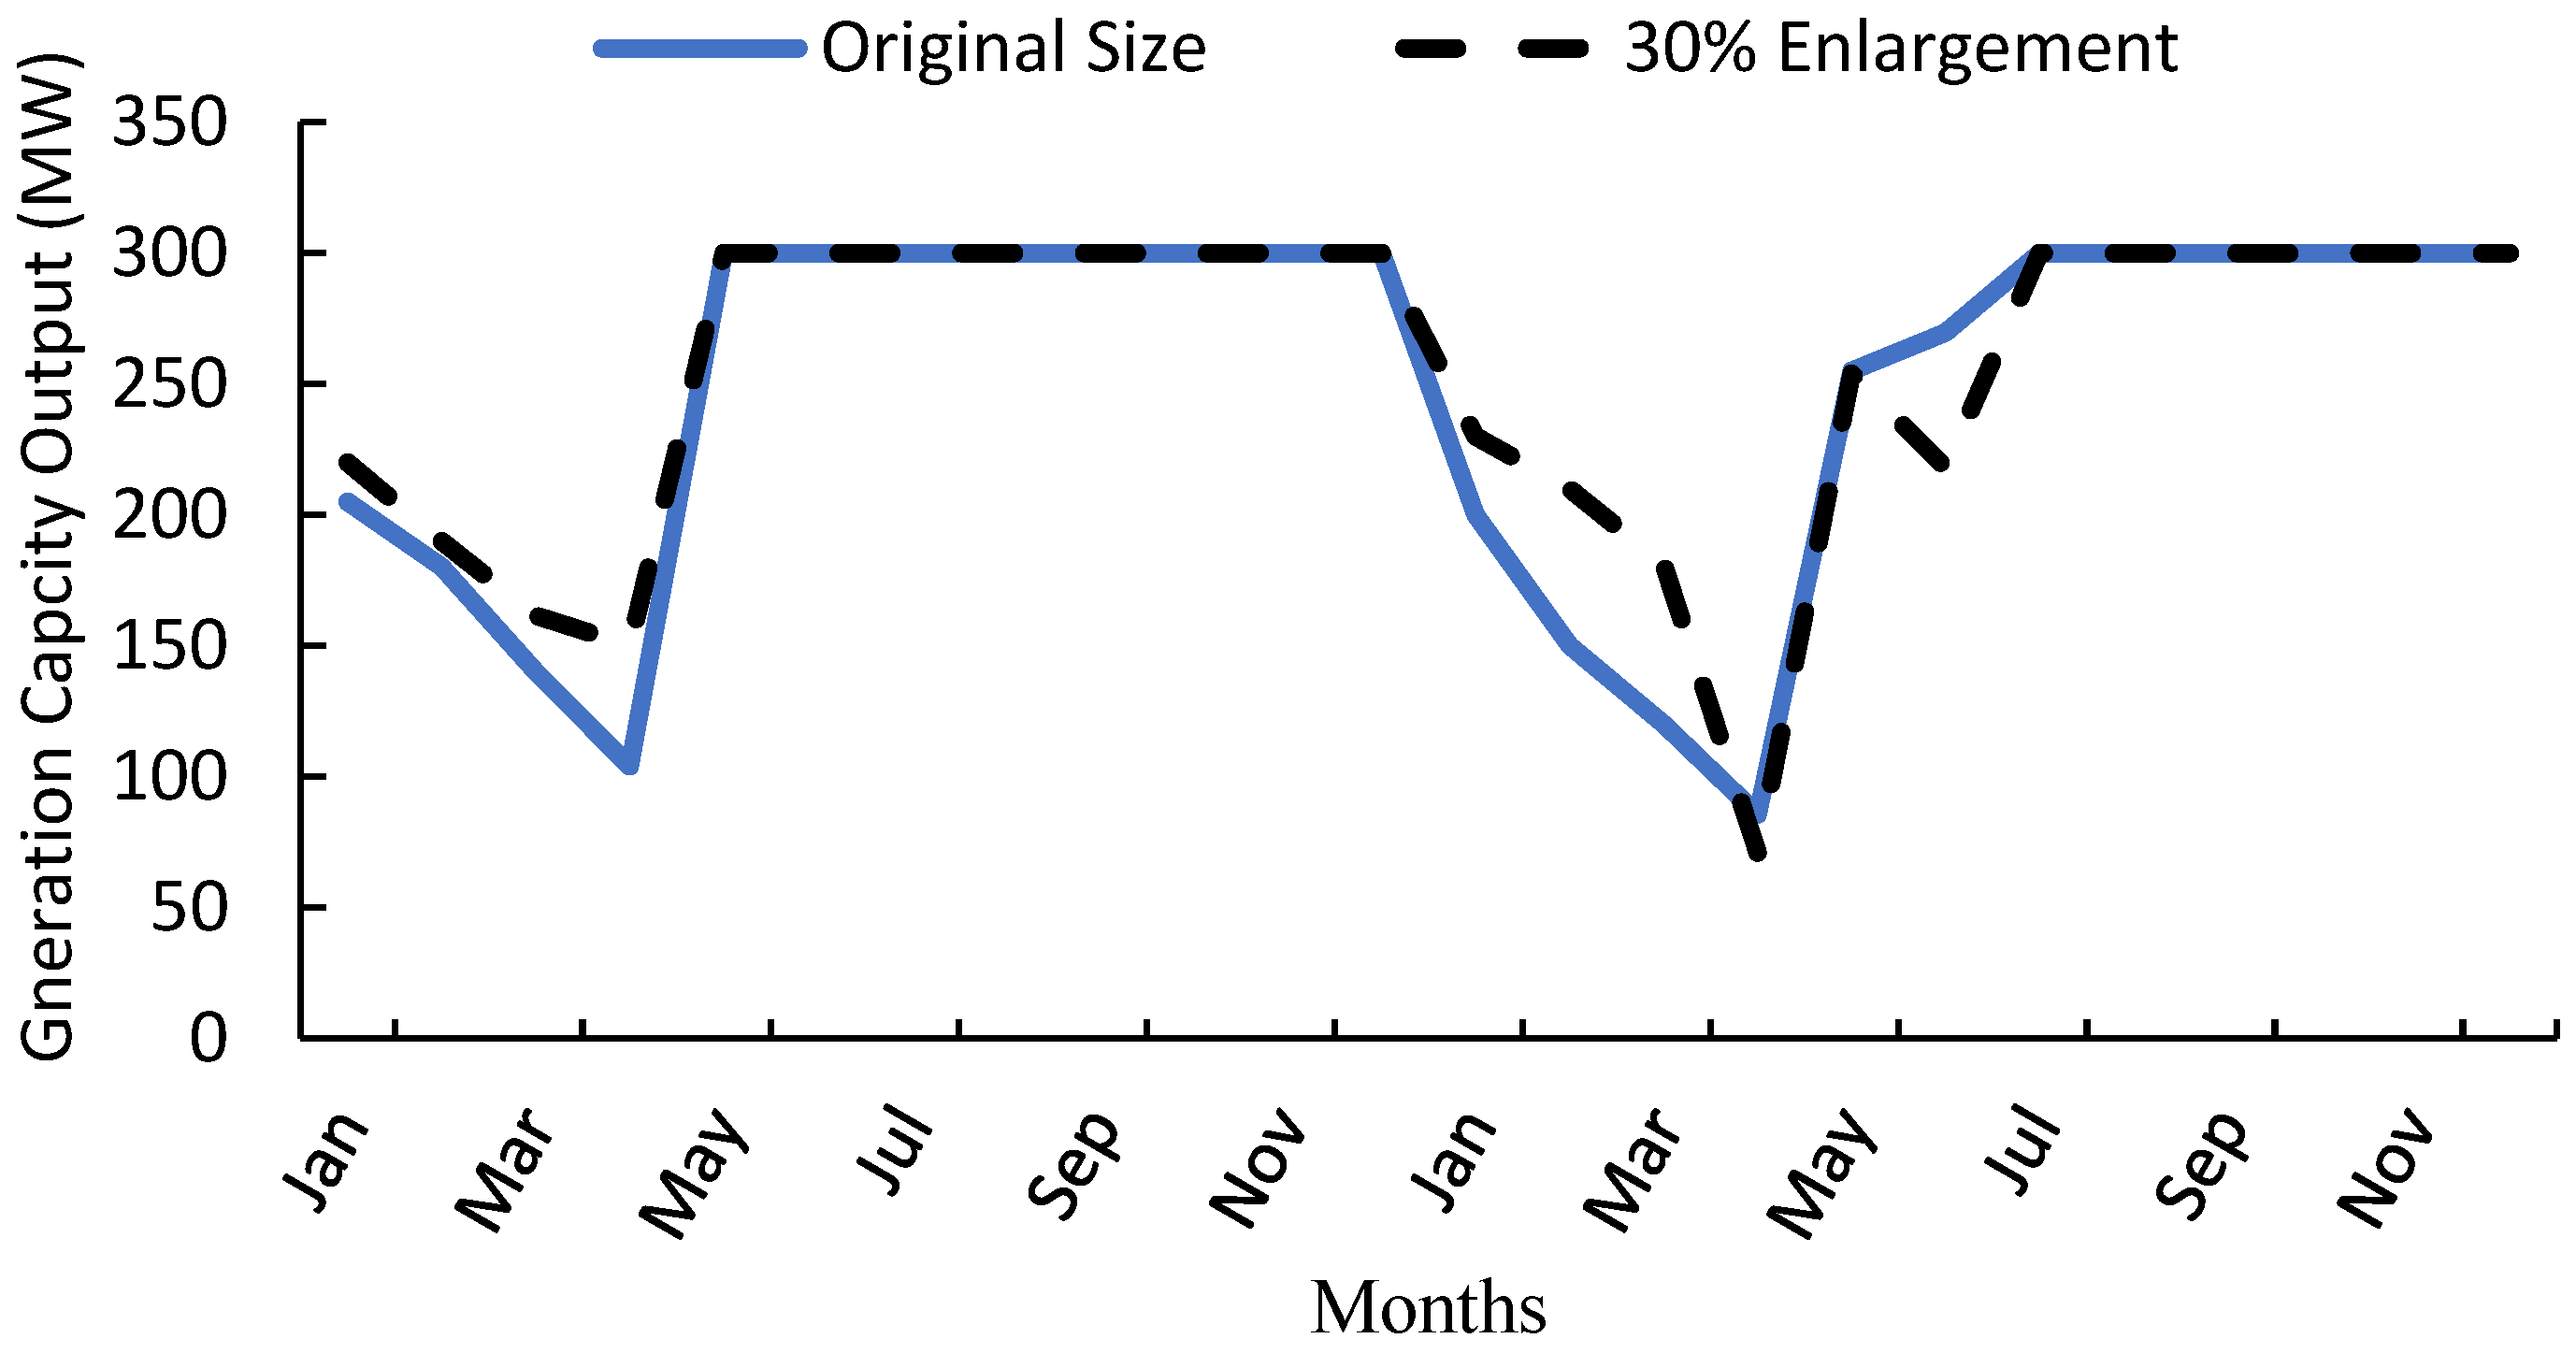
Figure 8 shows a reservoir head and water spillage for 300 MW storage type hydro plant. A study was carried out by increasing the reservoir size by 30%. With the increased size, it takes a longer time to fill the reservoir to its maximum head in July as shown in
Figure 8. More water is saved during the wet season due to reduced spillage in July, and the stored water is carried over from the current year to the upcoming year. The saved water is distributed in the dry months from January to March of the following dry year where there is a severe shortage of water. At the end of April, the saved water is all used up and the head value reaches its lowest limit. The corresponding MW capacity output of the 300 MW hydro unit after the increase in reservoir size is shown in
Figure 9. Starting with the same head, the reservoir with 30% increased size stores more water in the reservoir and yields more capacity output in the energy-limited months than the original size reservoir from January to April in the current year. With the increased reservoir size, the capacity output in the dry months from January to April of the following dry year will increase significantly due to additional water stored from the current year to use in the upcoming year.
3.3. Demand Side Management
A winter peaking load and a summer peaking load represent two distinctly different load patterns. They are studied in this paper to investigate the impact of correlation between load pattern and generation capacity output on the system reliability.
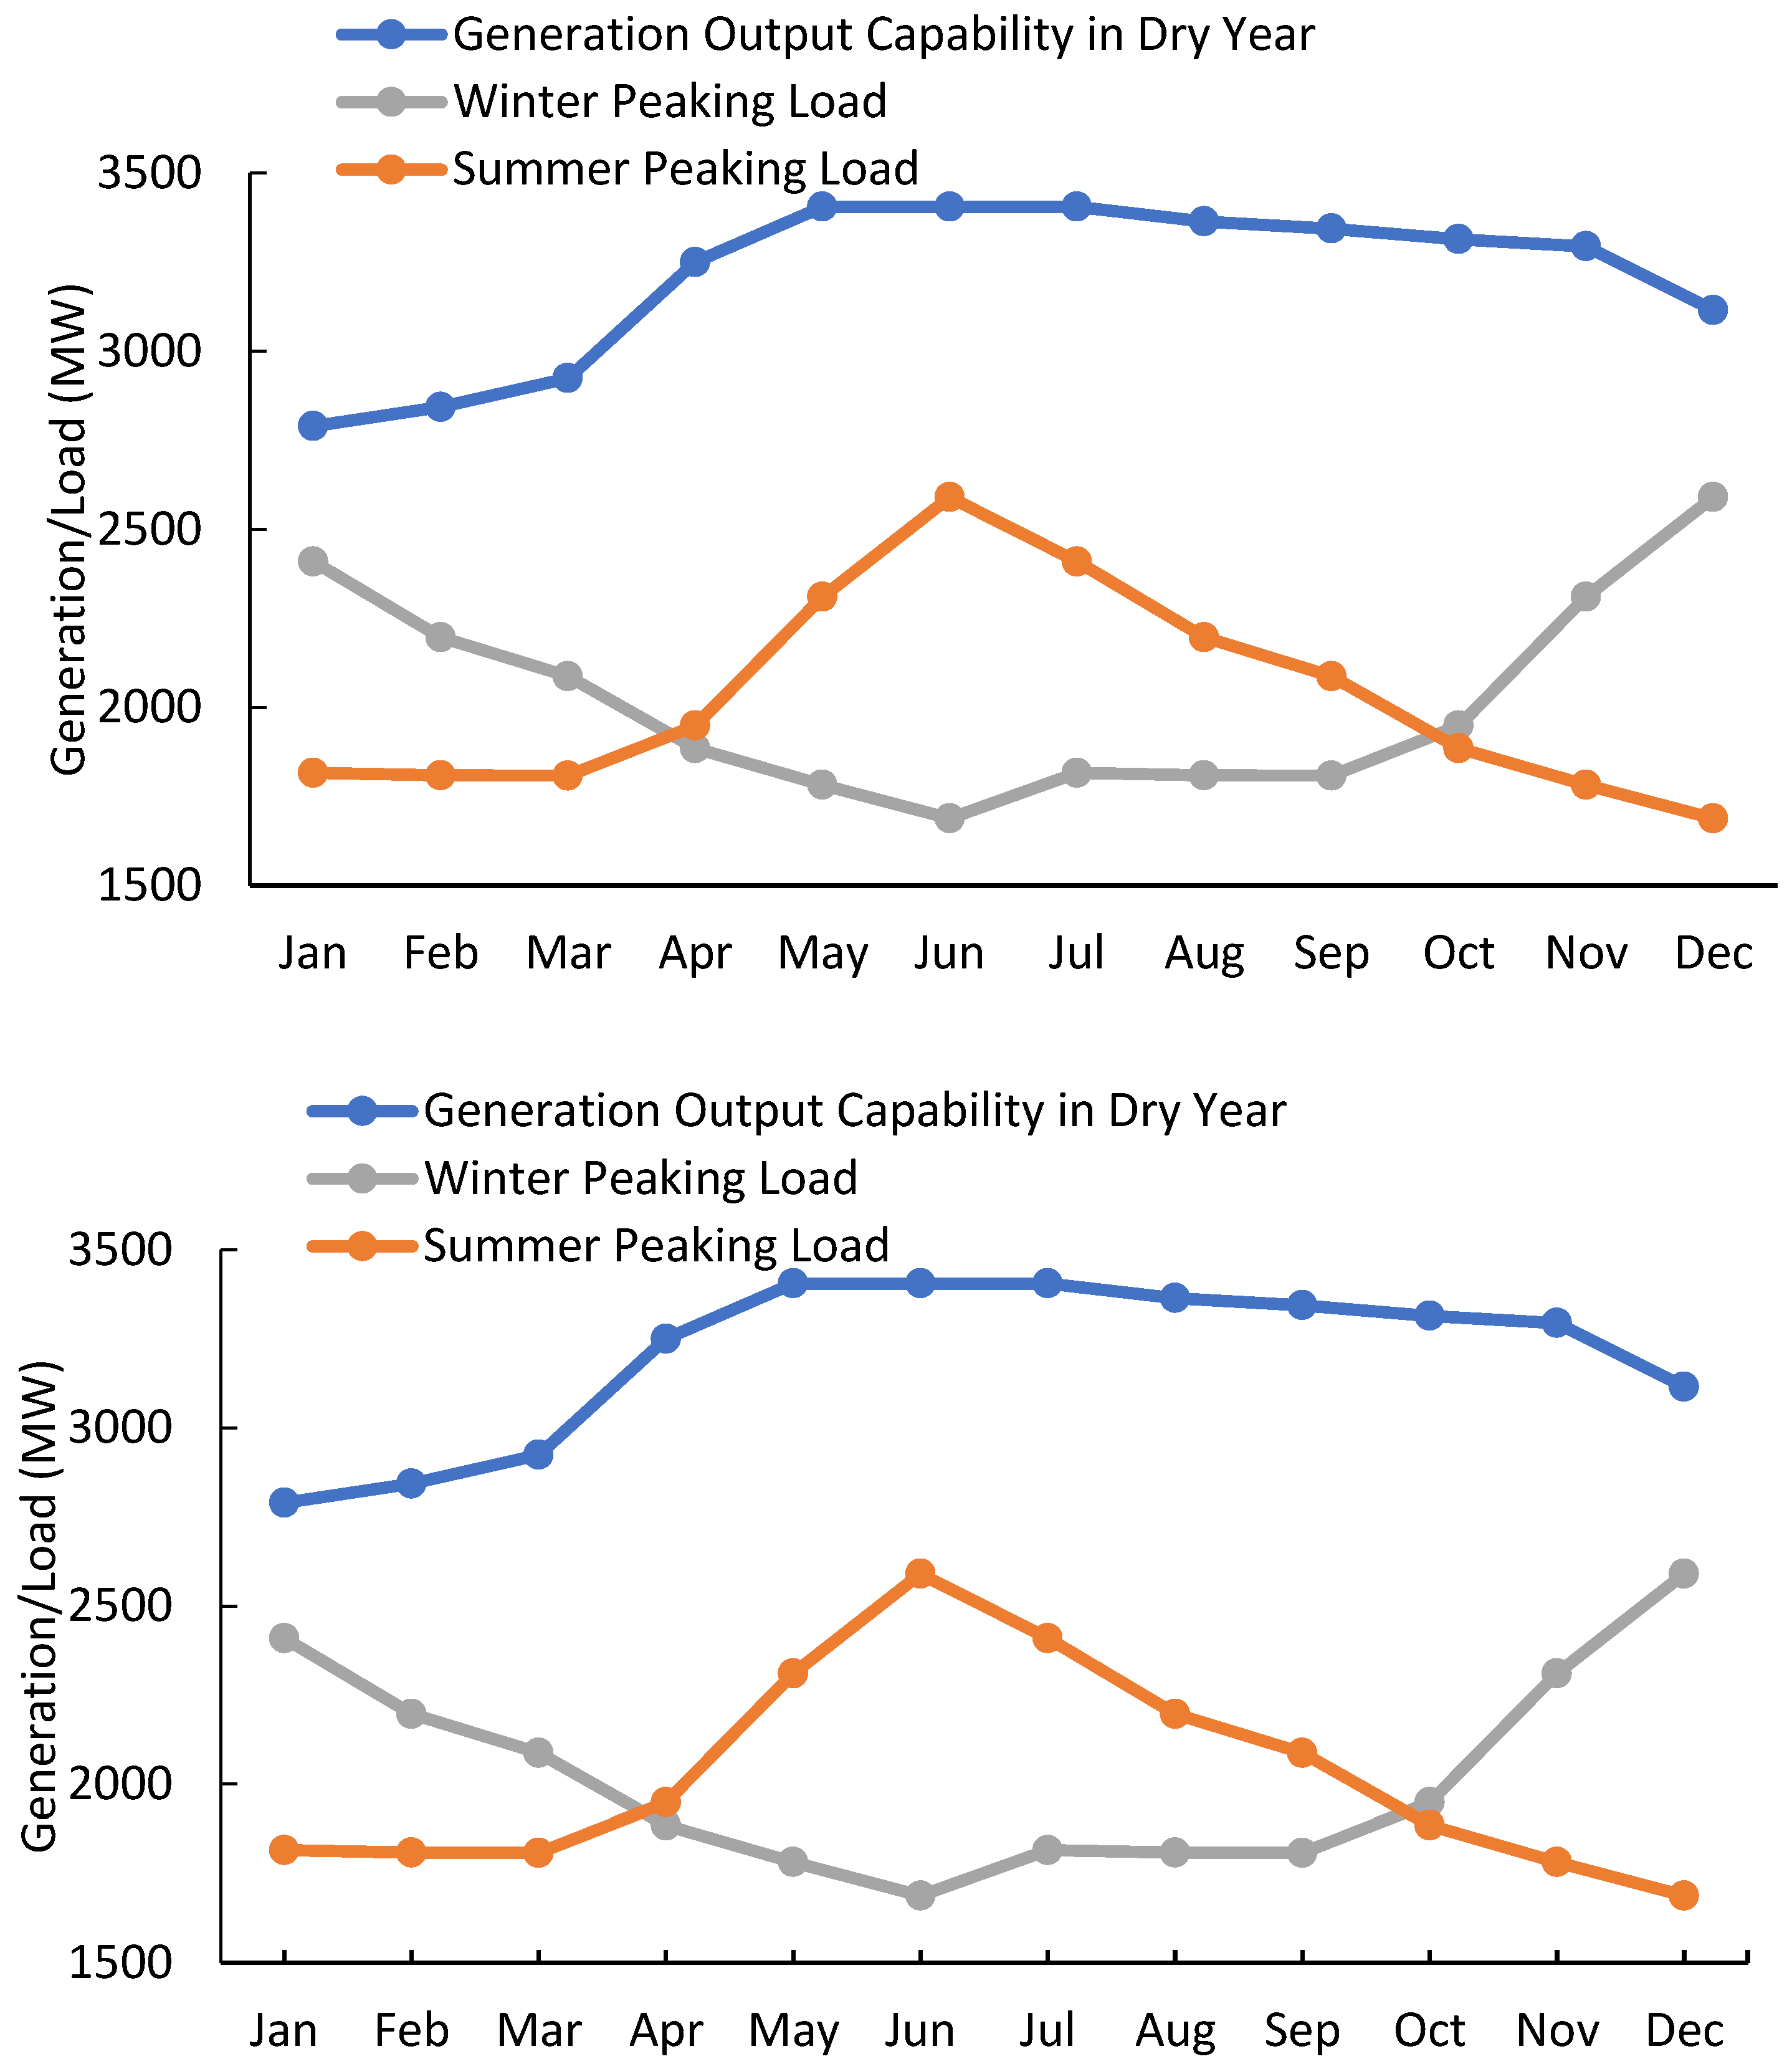
Figure 10 shows the winter peaking load and summer peaking load patterns, and the generation output capability of the hydro dominant system with the dry year hydrological pattern. The hydro units can generate rated output during the wet season from May to September but generate reduced output during the dry season from December to April.
A winter peaking load pattern shows a negative correlation with the generation capability of the hydro generation output as depicted in
Figure 10. The system peak load occurs during the dry months (Dec–Jan) when the generating units have derated outputs, which increases the loss of load probability. On the other hand, the system off-peak load occurs during the wet months (May–Jul) when the generation units have rated capacity output which is not necessary to meet the light load demand.
For a system with the summer peaking load pattern, the system peak load occurs in the wet season where the hydro units can generate the rated capacity output to meet the high load demand. In the dry season, the generation output capability is derated, but the load is also at the minimum during the period, so the loss of load mainly depends on random failures of the generating units during this period.
It is desired that the load variation pattern and the generation output capability have a positive correlation so that the hydro units have adequate energy in time sequence to satisfy the system peak load. Applying demand side management is one of the effective ways to slow the increase in electricity demand and transform the system load pattern toward to the desired trend, in this case, following positive correlation with the hydropower output capability.
Therefore, a strong positive correlation between the generation output capability and the load pattern has a great positive impact on system reliability. Application of the demand side management to change the system’s load pattern to obtain the desired correlation with the hydrological condition can significantly improve the reliability of the hydro dominant system.
4. Simulation Results of Applying the Developed Models to the Test System
Long term reliability analysis of a power system is normally carried out every year for a planning horizon of several years using annual indices. Such analysis can also be conducted for a season, a year or a longer period of time. This paper considers long term energy uncertainty of hydro dominant power system due to hydrological uncertainty. Since proper management of reservoir water usage requires the knowledge of energy availability and demand scenarios in the immediate future years, a two-year study period was chosen to incorporate the current year and future year’s hydrological conditions.
A modified IEEE RTS system as described in
Section 3 is used for reliability studies. A calendar year is assumed to have one of the four hydrological conditions, namely wet, normal, dry and extreme dry year as shown in
Figure 3, with the probabilities shown in
Figure 4. This data was obtained from hydrological information obtained for the Canadian province of British Columbia. The normal hydrological year has the highest occurrence probability of 0.78. Therefore, the study is assumed to start with a normal hydrological year, but in fact, the hydrological condition of the current year is known with relatively low uncertainty. A winter peaking load pattern as shown in
Figure 10 [
21] was used considering a peak load of 2380 MW in the following studies.
The proposed methodology of water management for reliability enhancement was applied to the modified RTS system to investigate the reliability impacts.
Figure 11 shows the LOLE for the four hydrological condition years with and without implementing the energy management strategy.
Figure 11 also shows the expected LOLE for the upcoming year obtained by multiplying the LOLE for each of the four hydrological conditions by the probability of its occurrence. The expected LOLE is 0.48 h/year. This is equivalent to LOLE of 0.1 days/year, which is the widely used reliability planning criterion [
22] in major power utilities.
Figure 11 shows that the LOLE is the lowest in the wet year. The LOLE in the normal year almost reaches the criterion value even before applying the energy management strategy. After applying the year to year energy management strategy, LOLE decreases to 0.35 h/year. The LOLE values in dry and extreme dry years are very high. Although the year to year energy management in these conditions can significantly improve the system reliability, it is not able to transfer enough energy to meet the reliability criterion. It should, however, be noted that the expected LOLE meets the reliability criterion after the year to year energy management. The widely accepted LOLE criterion may be suitable for a particular year, but its compliance would require significant capital investment in dry and extremely dry years. An appropriate value of expected LOLE considering the different hydrological years can be used as a planning criterion for hydro dominant systems.
Figure 11, however, shows that the equivalent of 0.1 days/year may not be an acceptable value since the LOLE in the dry and extreme dry year cases are very high. A reliability cost worth analysis in the dry and extreme dry scenarios is needed to determine the suitable criterion values.
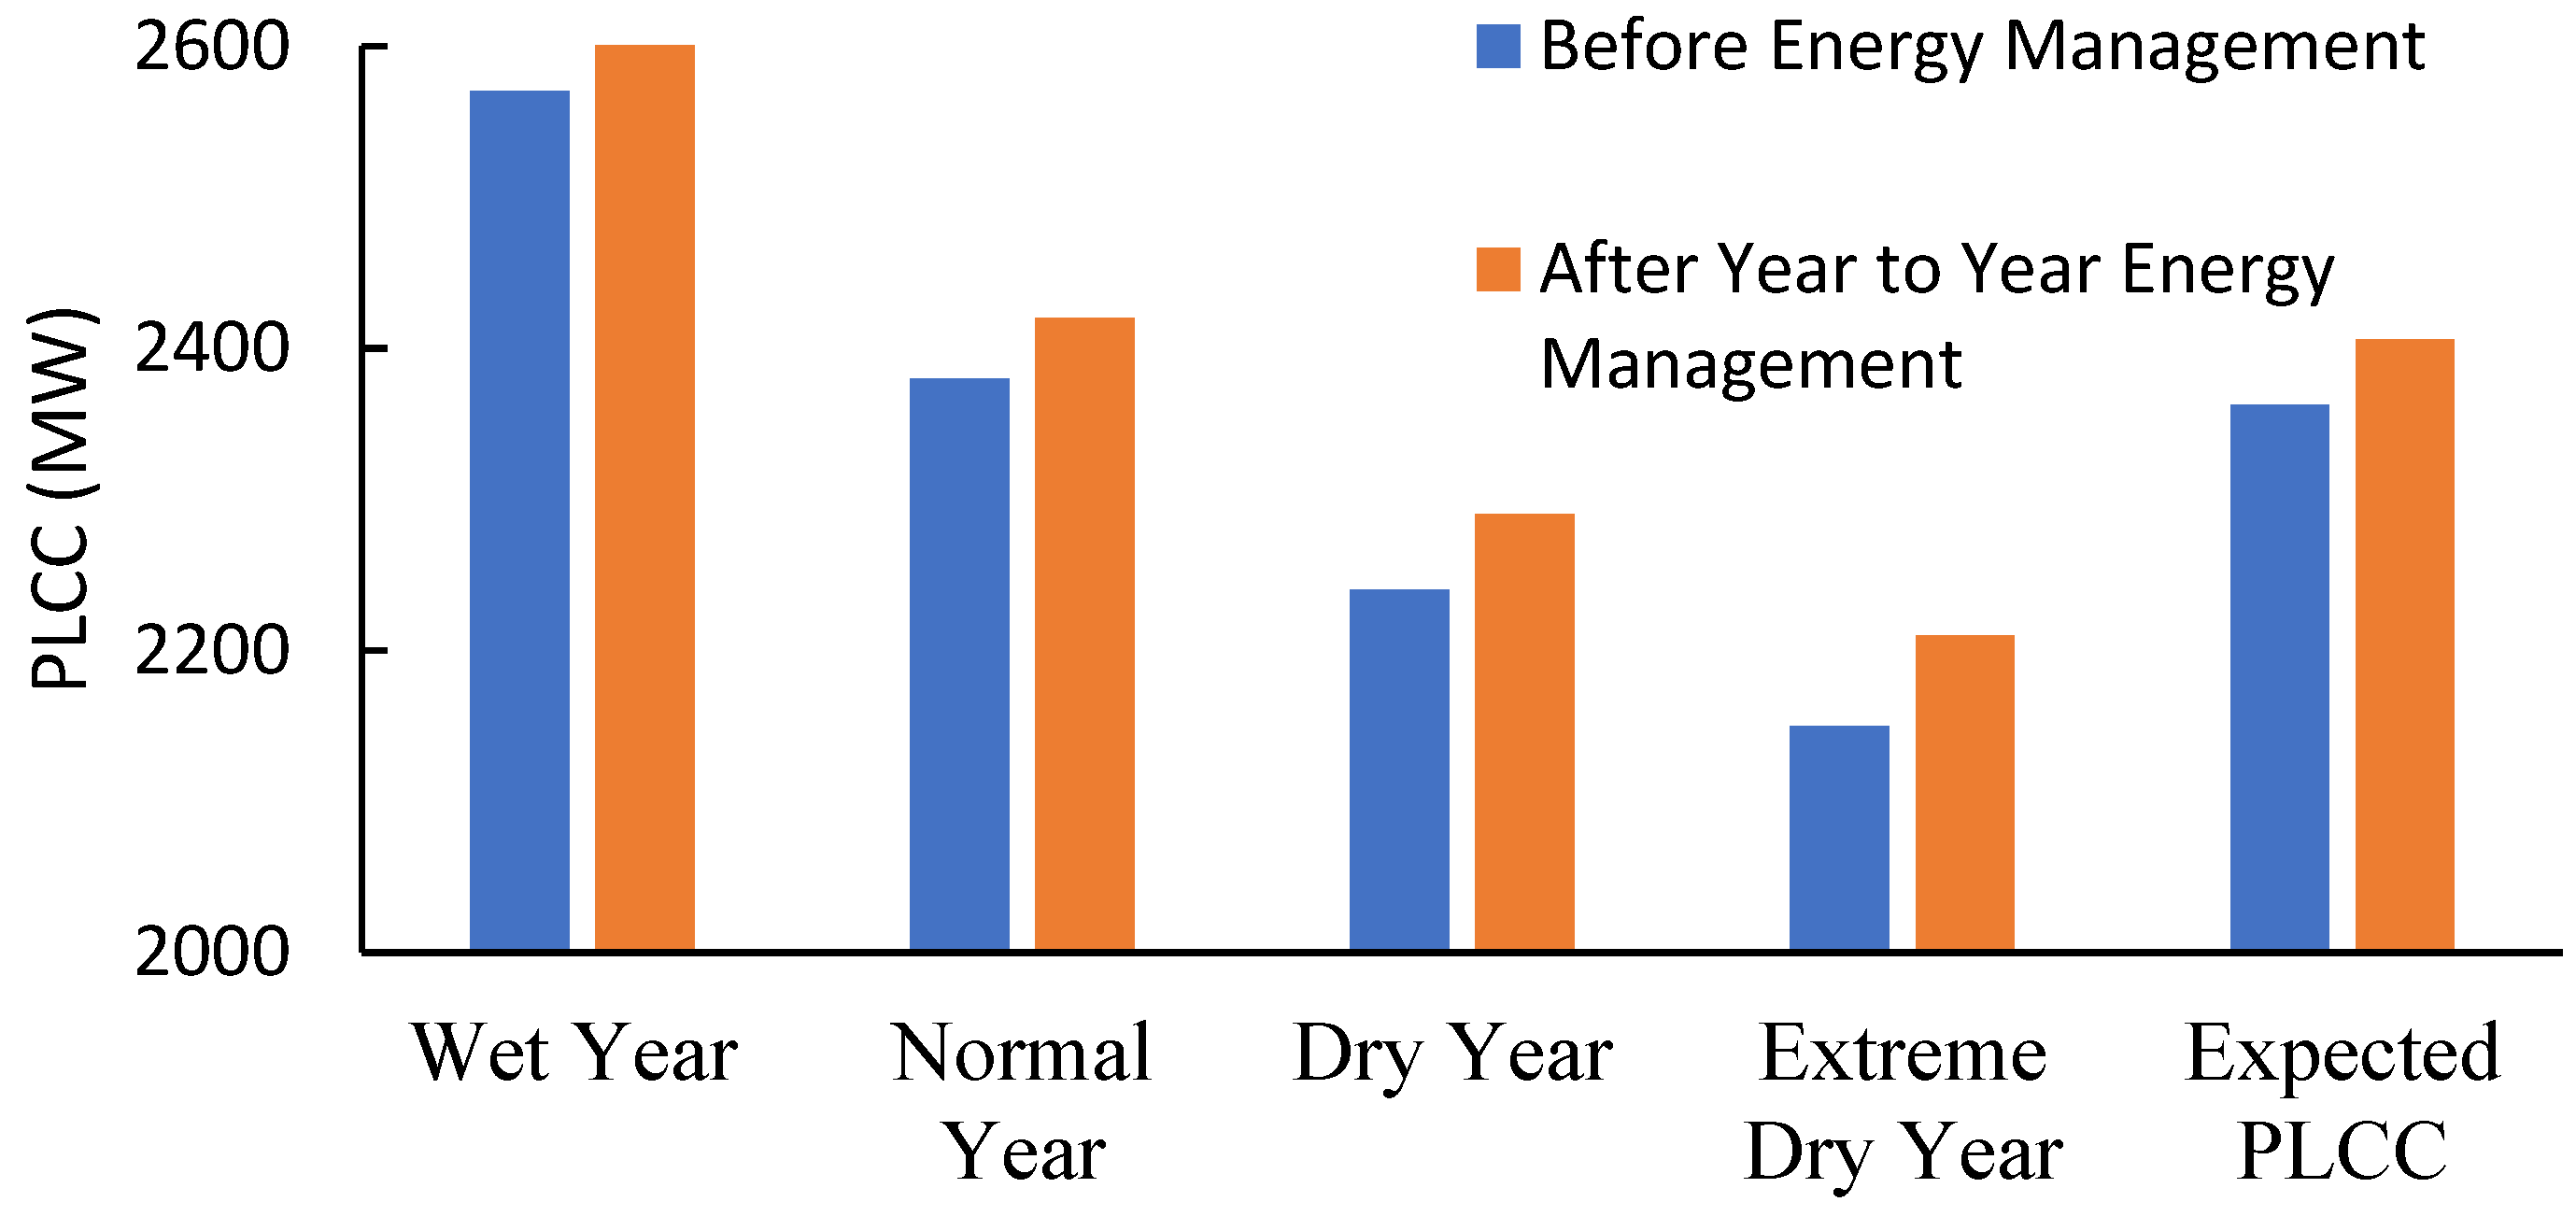
The peak load carrying capacity (PLCC) [
17] of a system is the peak load that the system can carry without violating its reliability planning criterion. The PLCCs of the system are shown in
Figure 12 for the four hydrological conditions assuming a planning criterion of LOLE = 0.48 h/year. The system can carry a higher peak load after applying the year to year energy management in all hydrological conditions.
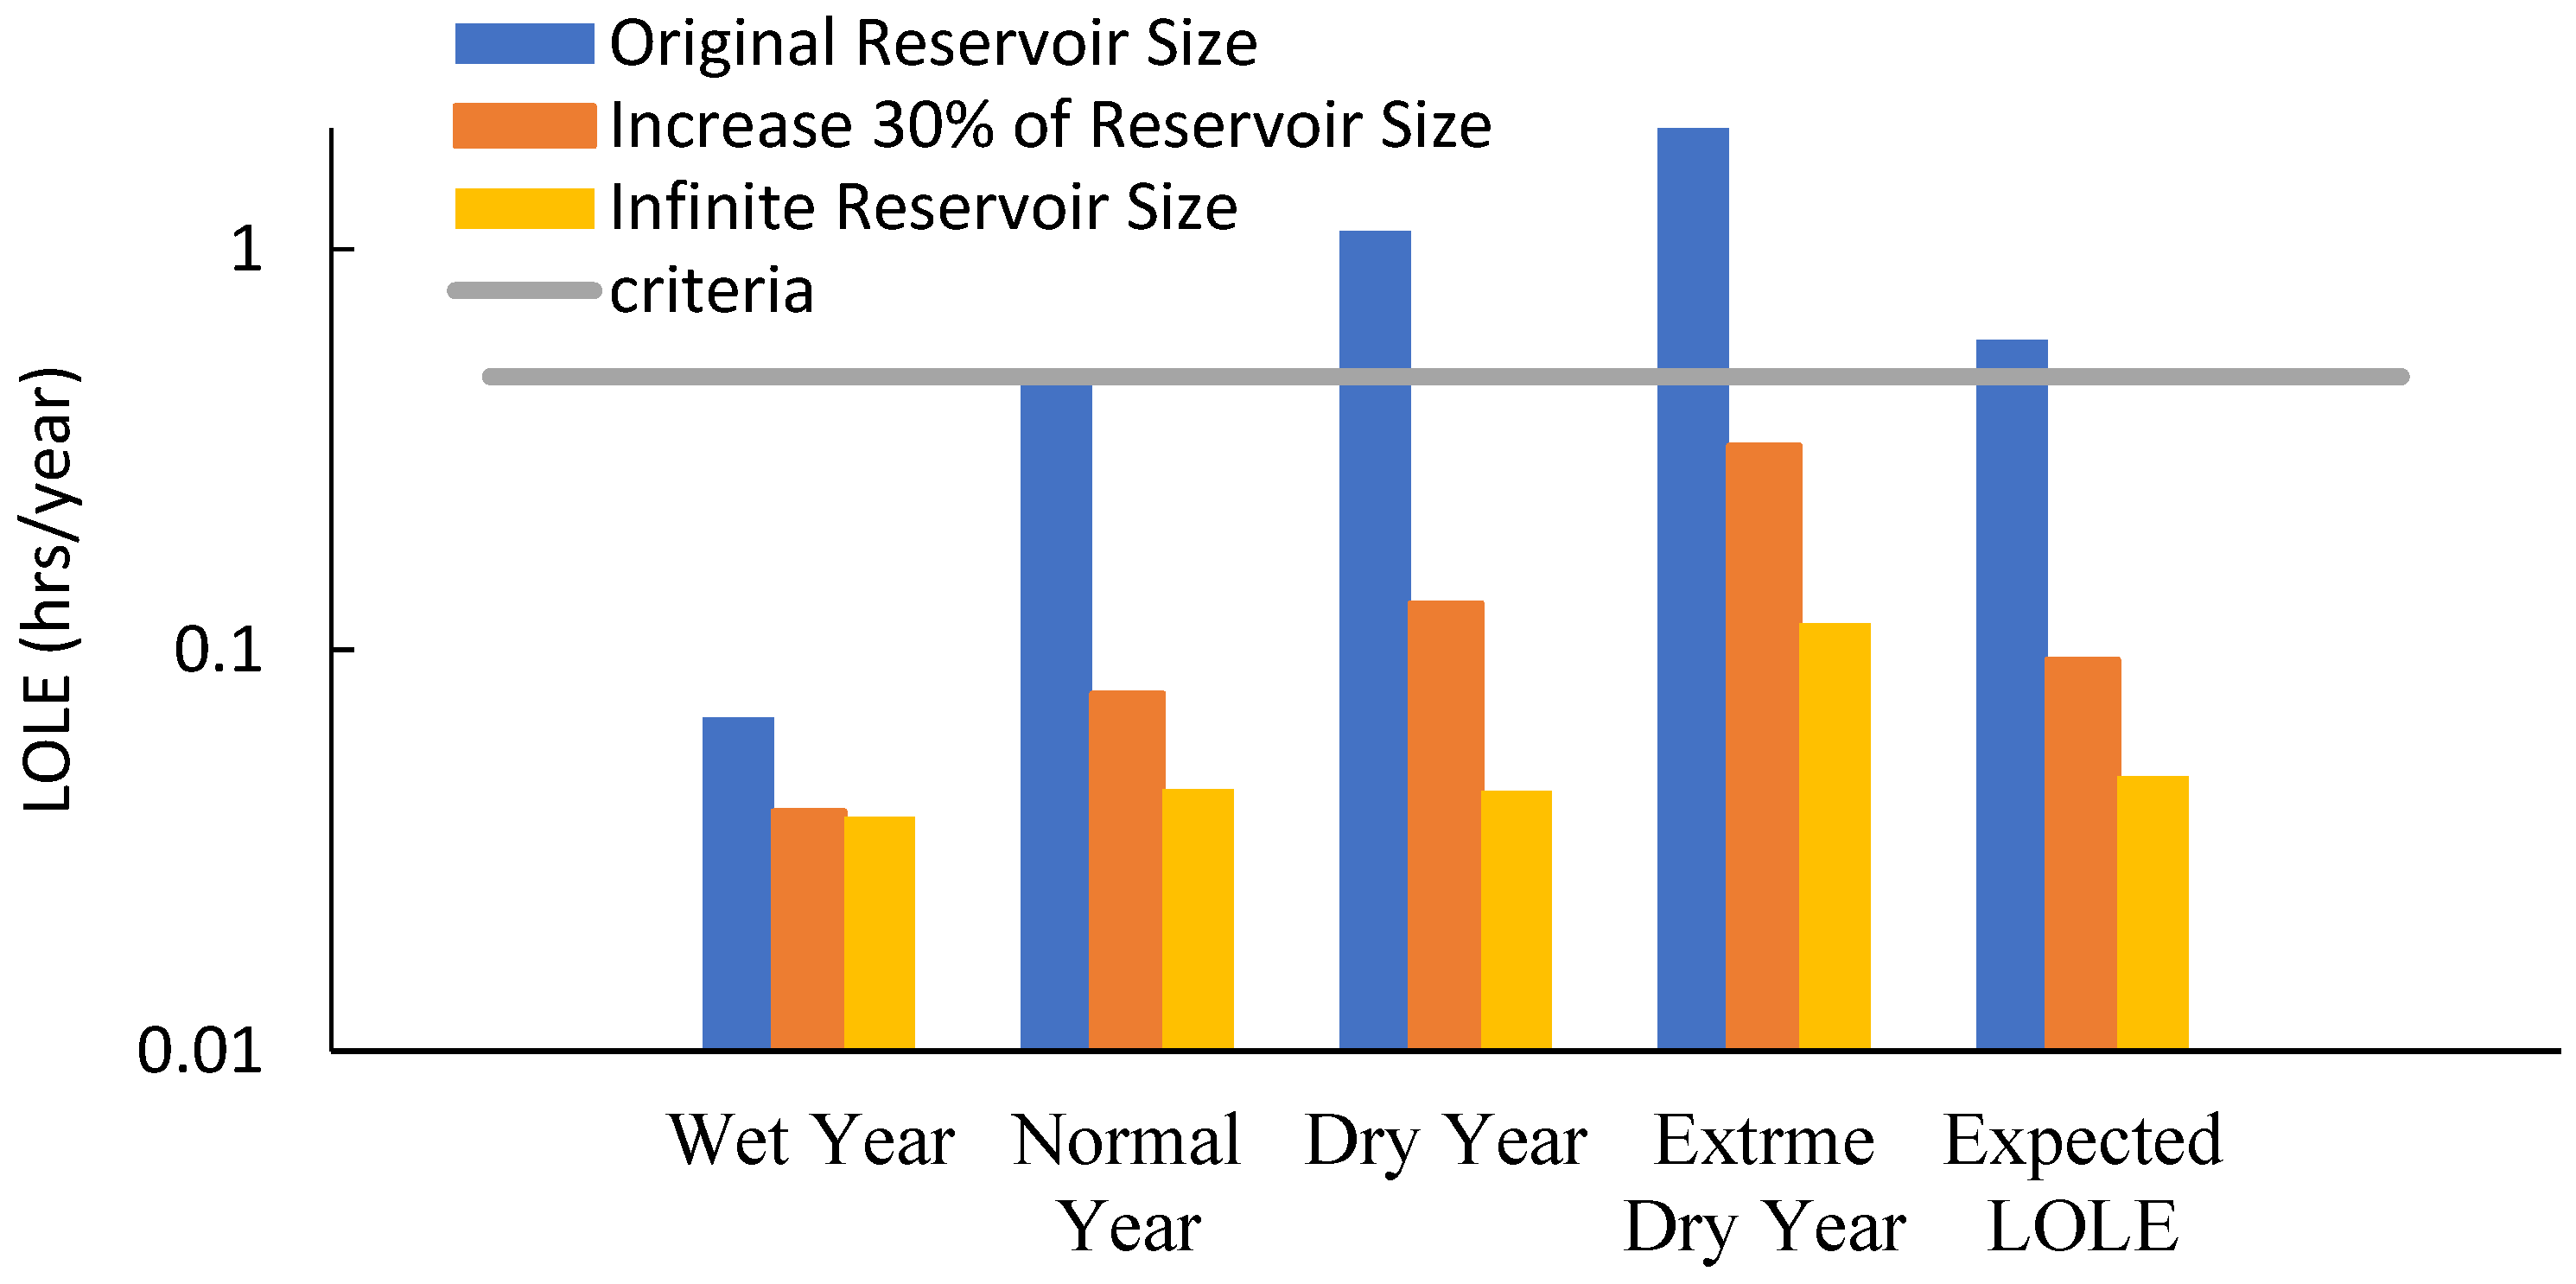
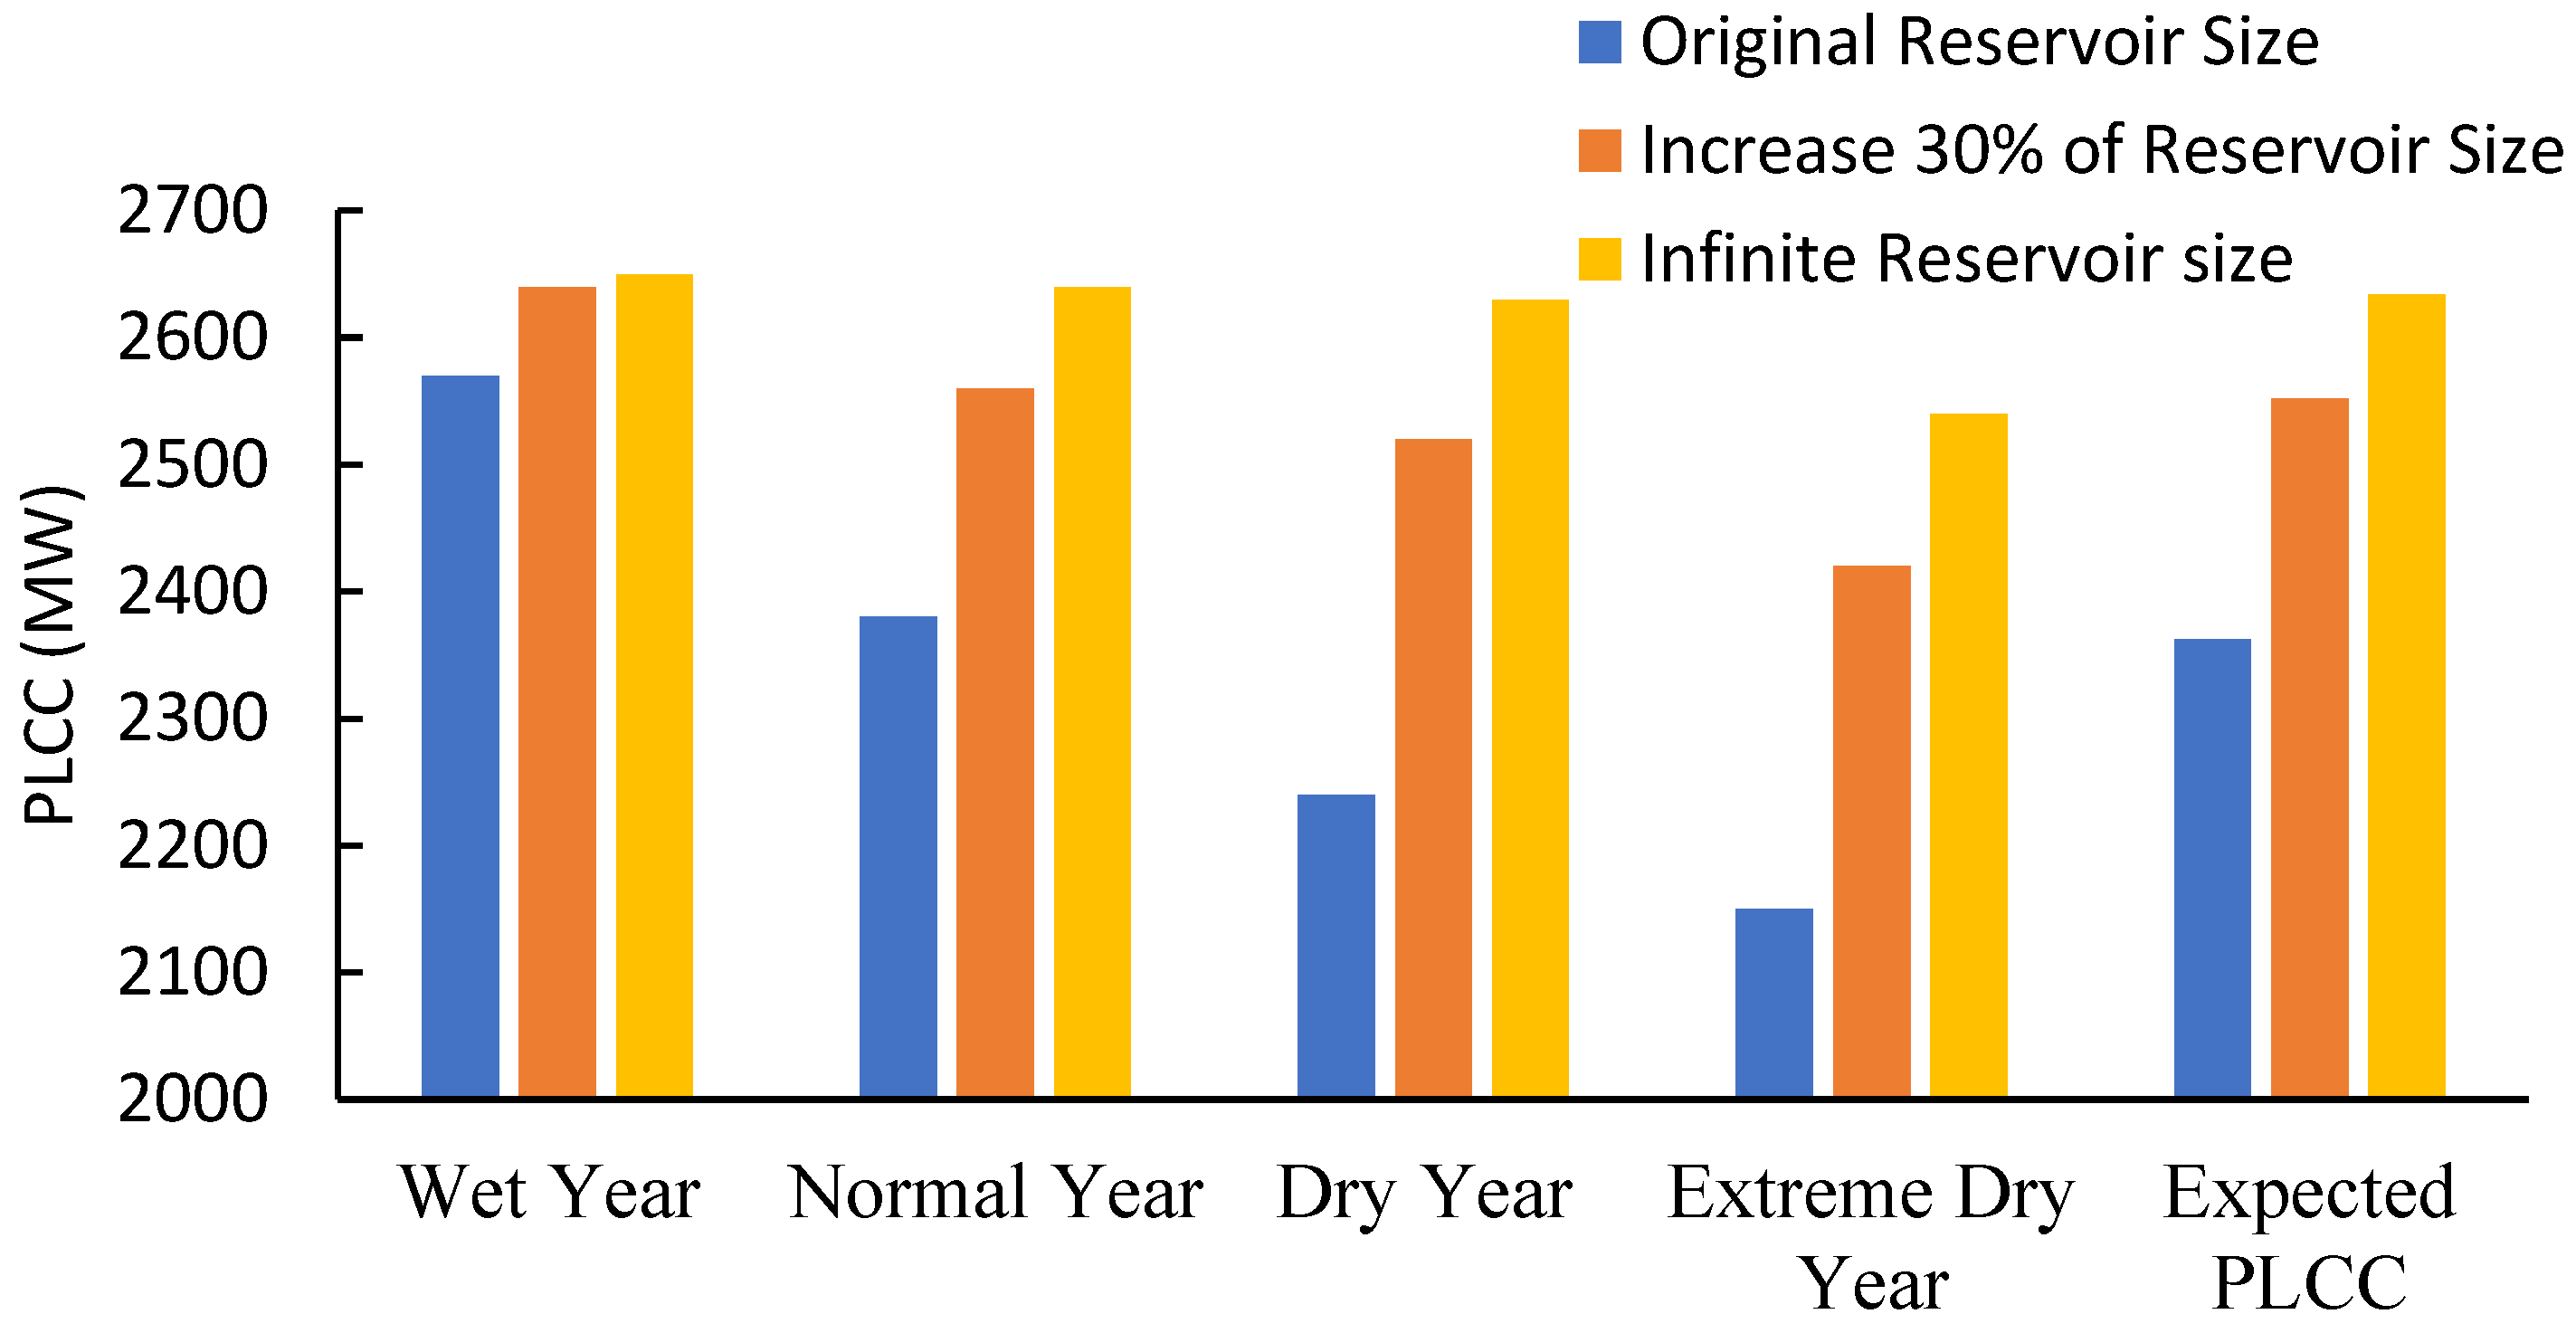
Another study was carried out to investigate the impact of reservoir capacity on the system reliability in the different hydrological years with year to year energy management. Three different reservoir sizes were considered: (1) the original size, (2) a 30% increase in reservoir volume, and (3) a reservoir with infinite volume. The results are shown in
Figure 13.
The LOLE in the normal hydrological year is 0.46 h/year which scarcely meets the reliability criterion of 0.48 h/year without any changes in the reservoir size. When the reservoir size is increased by 30%, there is an additional 30% of stored water volume in the current year. The additional 30% increase in reservoir size improved the system reliability by lowering the LOLE to 0.08 h/year. Similar reliability improvements are observed for the dry and extreme dry years as shown in
Figure 13. An infinite reservoir has sufficient size to prevent the spillage of water that makes the hydro system as a non-energy limited system with energy management. In this case, the LOLE is mainly caused by the forced outages of the generating units. The infinite reservoir has lower expected LOLE than an increase 30% of reservoir size as shown in
Figure 13.
Figure 14 shows the PLCC of the system considering the impact of the three reservoir sizes and the four hydrological condition years. The PLCC increased for all hydrological condition years with 30% increase of reservoir size and infinite reservoir size. The PLCC increased significantly in a dry year from 2240 MW to 2520 MW for 30% increase of reservoir, and in an extreme dry year from 2150 MW to 2420 MW. With infinite reservoir size, the PLCC increased to 2630 MW in a dry year and 2540 MW in extreme dry year.
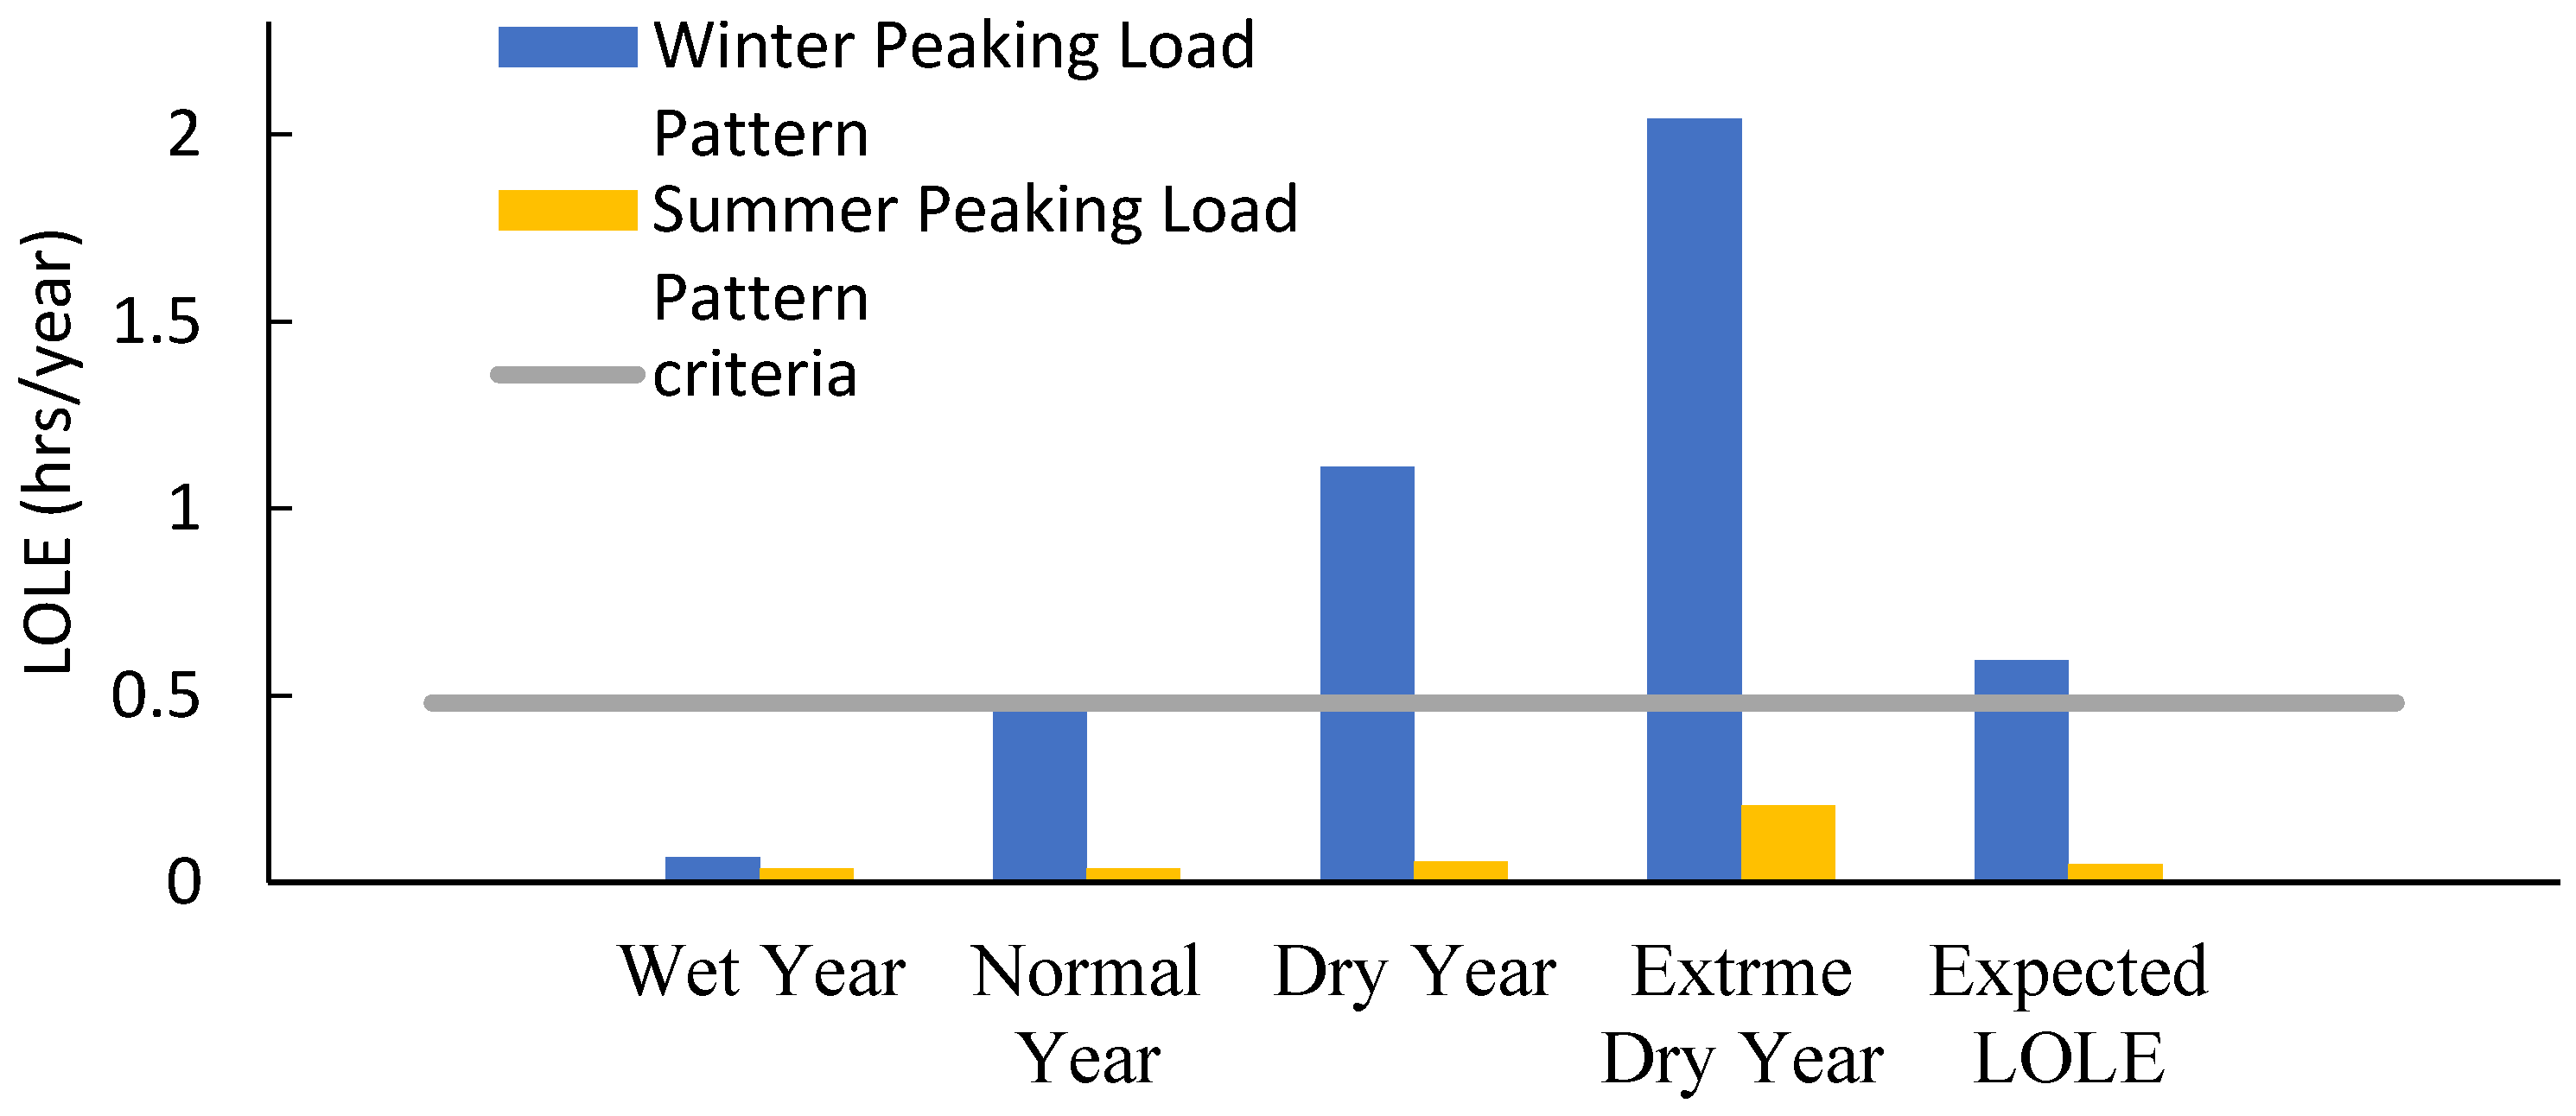
The correlation between the system load variation pattern and the hydrological pattern determines the energy limitation levels in a hydro dominant system. A study was carried out considering two different load variation patterns: (1) a winter peaking load which has a poor correlation with the hydrological pattern, and (2) a summer peaking load system which has a high correlation with the hydrological pattern. The impact on system reliability of the correlations of the load and river-flow patterns in the years with the different hydrological conditions is reflected in the LOLE results as shown in
Figure 15.
For the winter peaking load pattern, LOLE in the normal year is 0.46 h/year. This value is within the reliability criterion of 0.48 h/year. In the dry year and extreme dry year, the LOLE values exceed the reliability criterion of the system due to the energy limitation of the hydro system caused by the poor correlation between the river-flow and load variation patterns. However, for the summer peaking load pattern, the wet year, normal year and even dry year have high system reliability with LOLE of 0.04 h/year, 0.04 h/year and 0.06 h/year, respectively. The LOLE of the extreme year is 0.21 h/year which shows that the capacity reserve is well above that required by the reliability criterion.
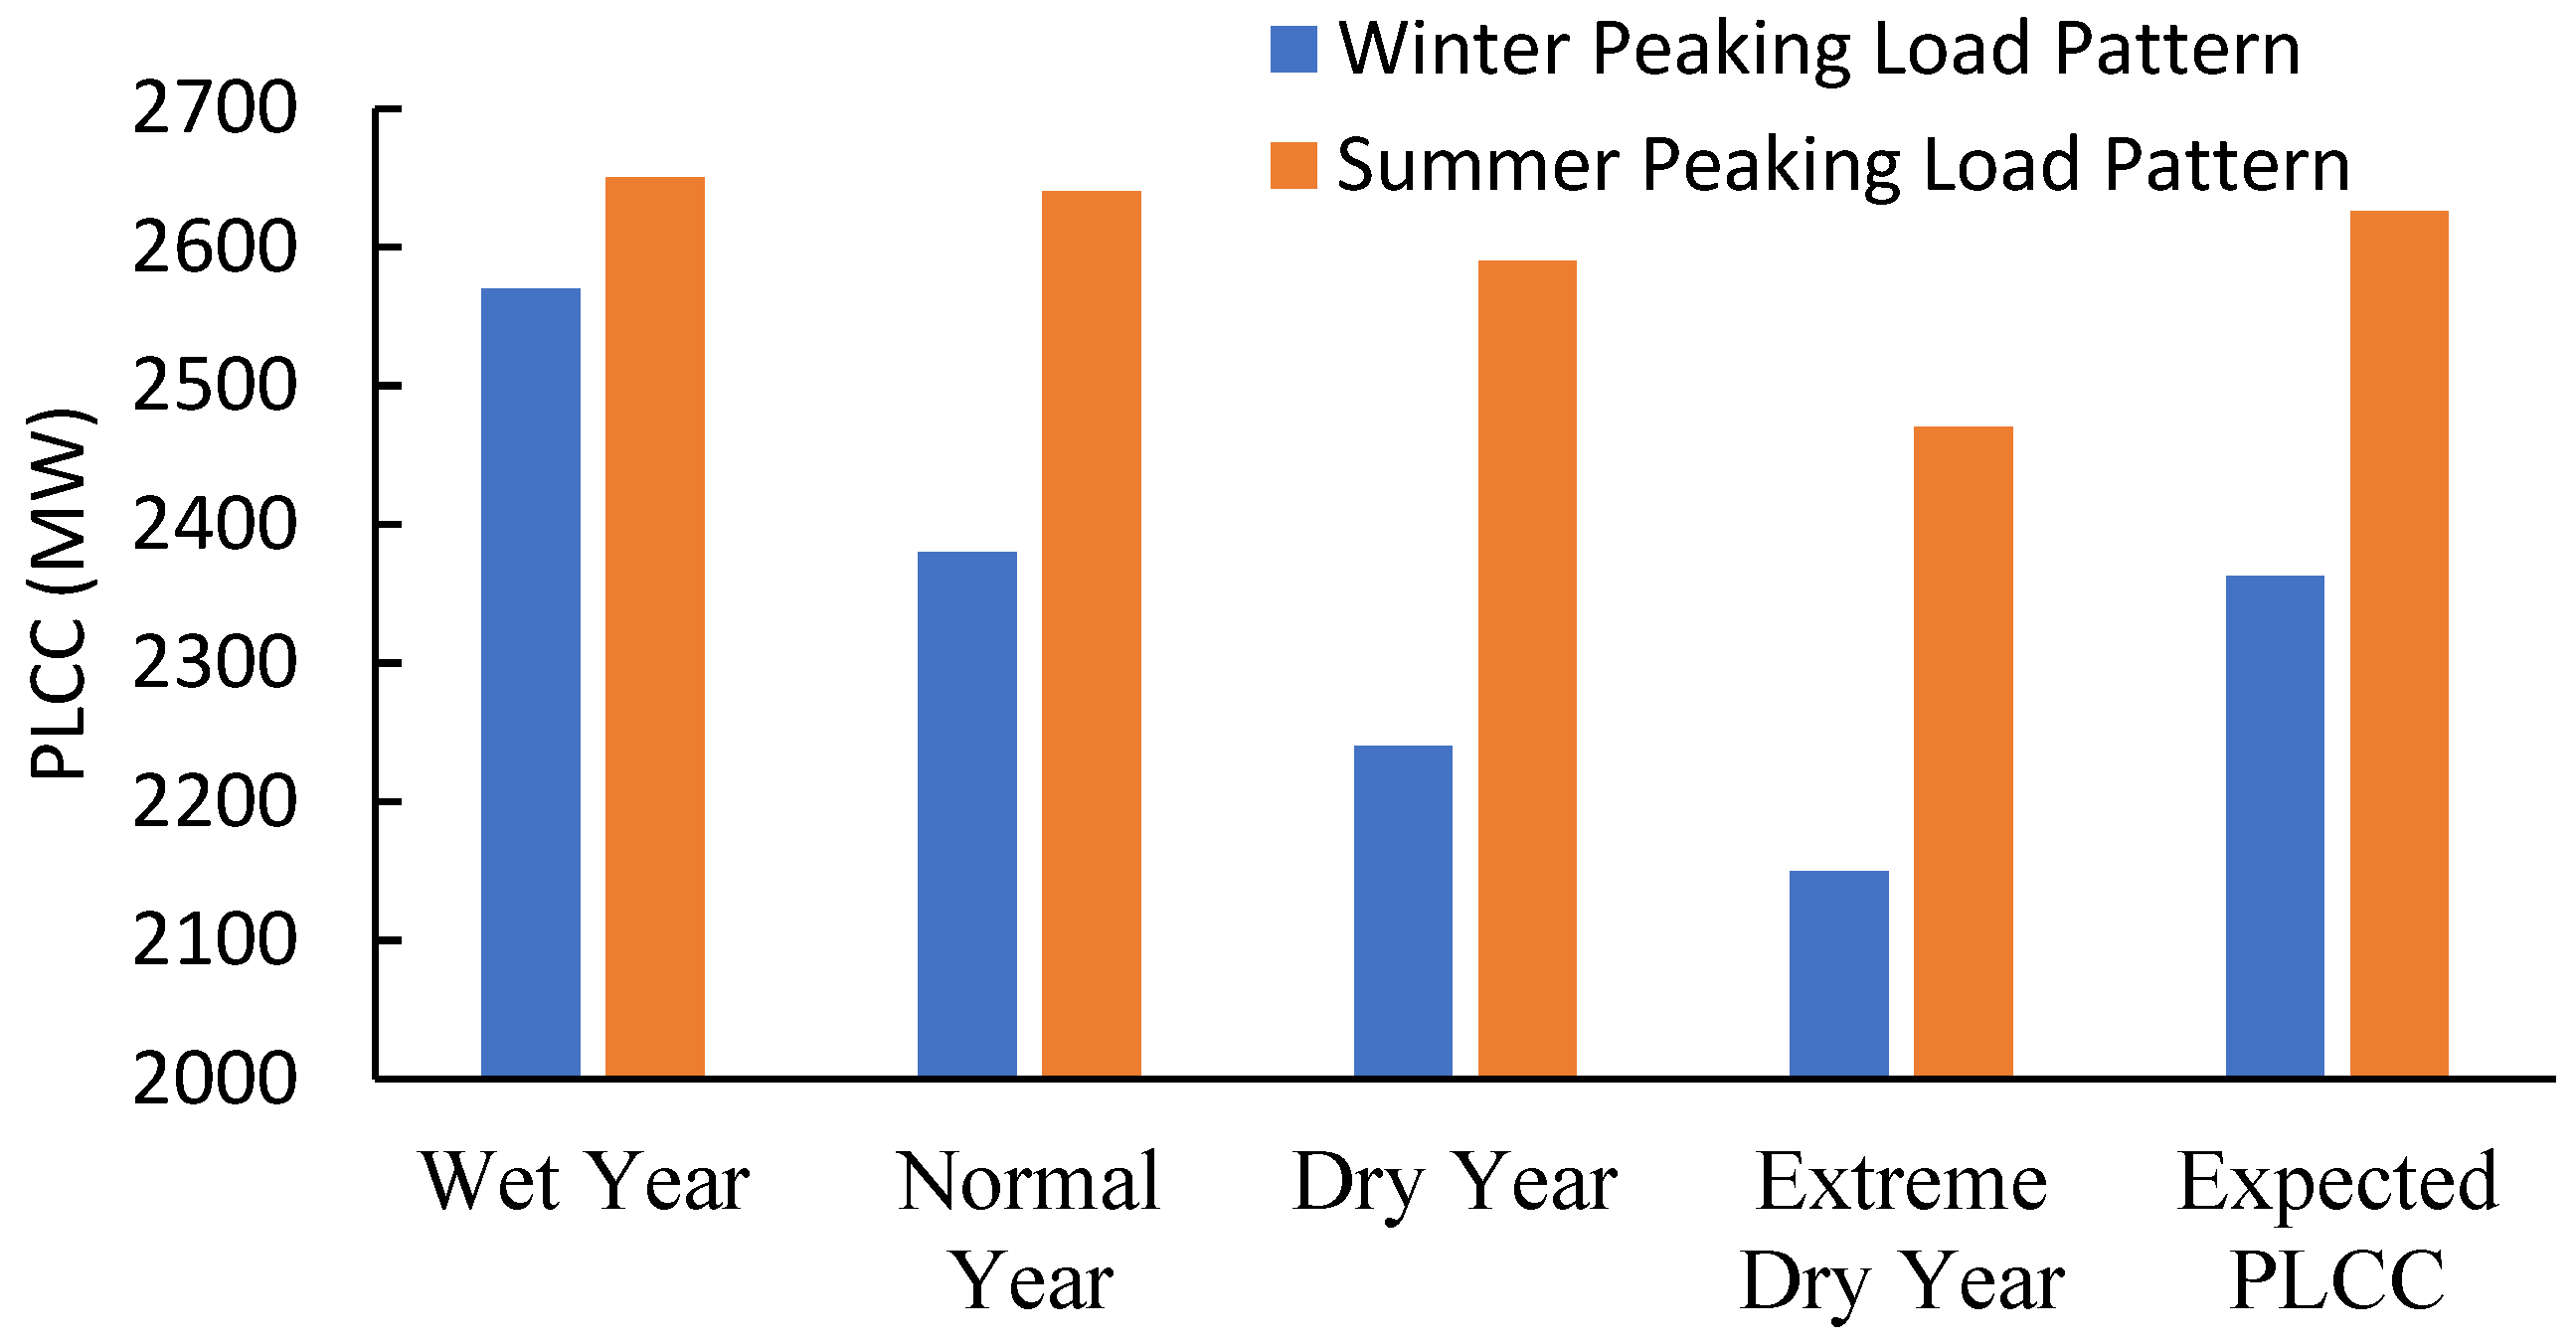
Figure 16 shows the PLCC at the LOLE criterion of 0.48 h/year. For winter peaking load pattern, the PLCC varies from 2570 MW in the wet year to 2150 MW in the extreme dry year. The difference in capacity reserve requirements in the two extreme hydrological conditions is at least 420 MW, which amounts to huge capacity investments under uncertainty. For the summer peaking load pattern, the PLCC values of the hydro system reduce gradually from 2650 MW in the wet year to 2470 MW in the extreme dry year. It should be noted that the peak load of the test system is 2380 MW, but the system can carry 90 MW additional system load even in an extreme dry year if the load variation is in high correlation with the river-flow variation. With the summer peaking load, the difference in PLCC in the two extreme hydrological conditions is only 180 MW, the capacity costs of which can be compared to the costs of 420 MW for the winter peaking load. A demand side management policy to improve the correlation of the load with the river-flow variation is highly desired in a hydro dominant power system.
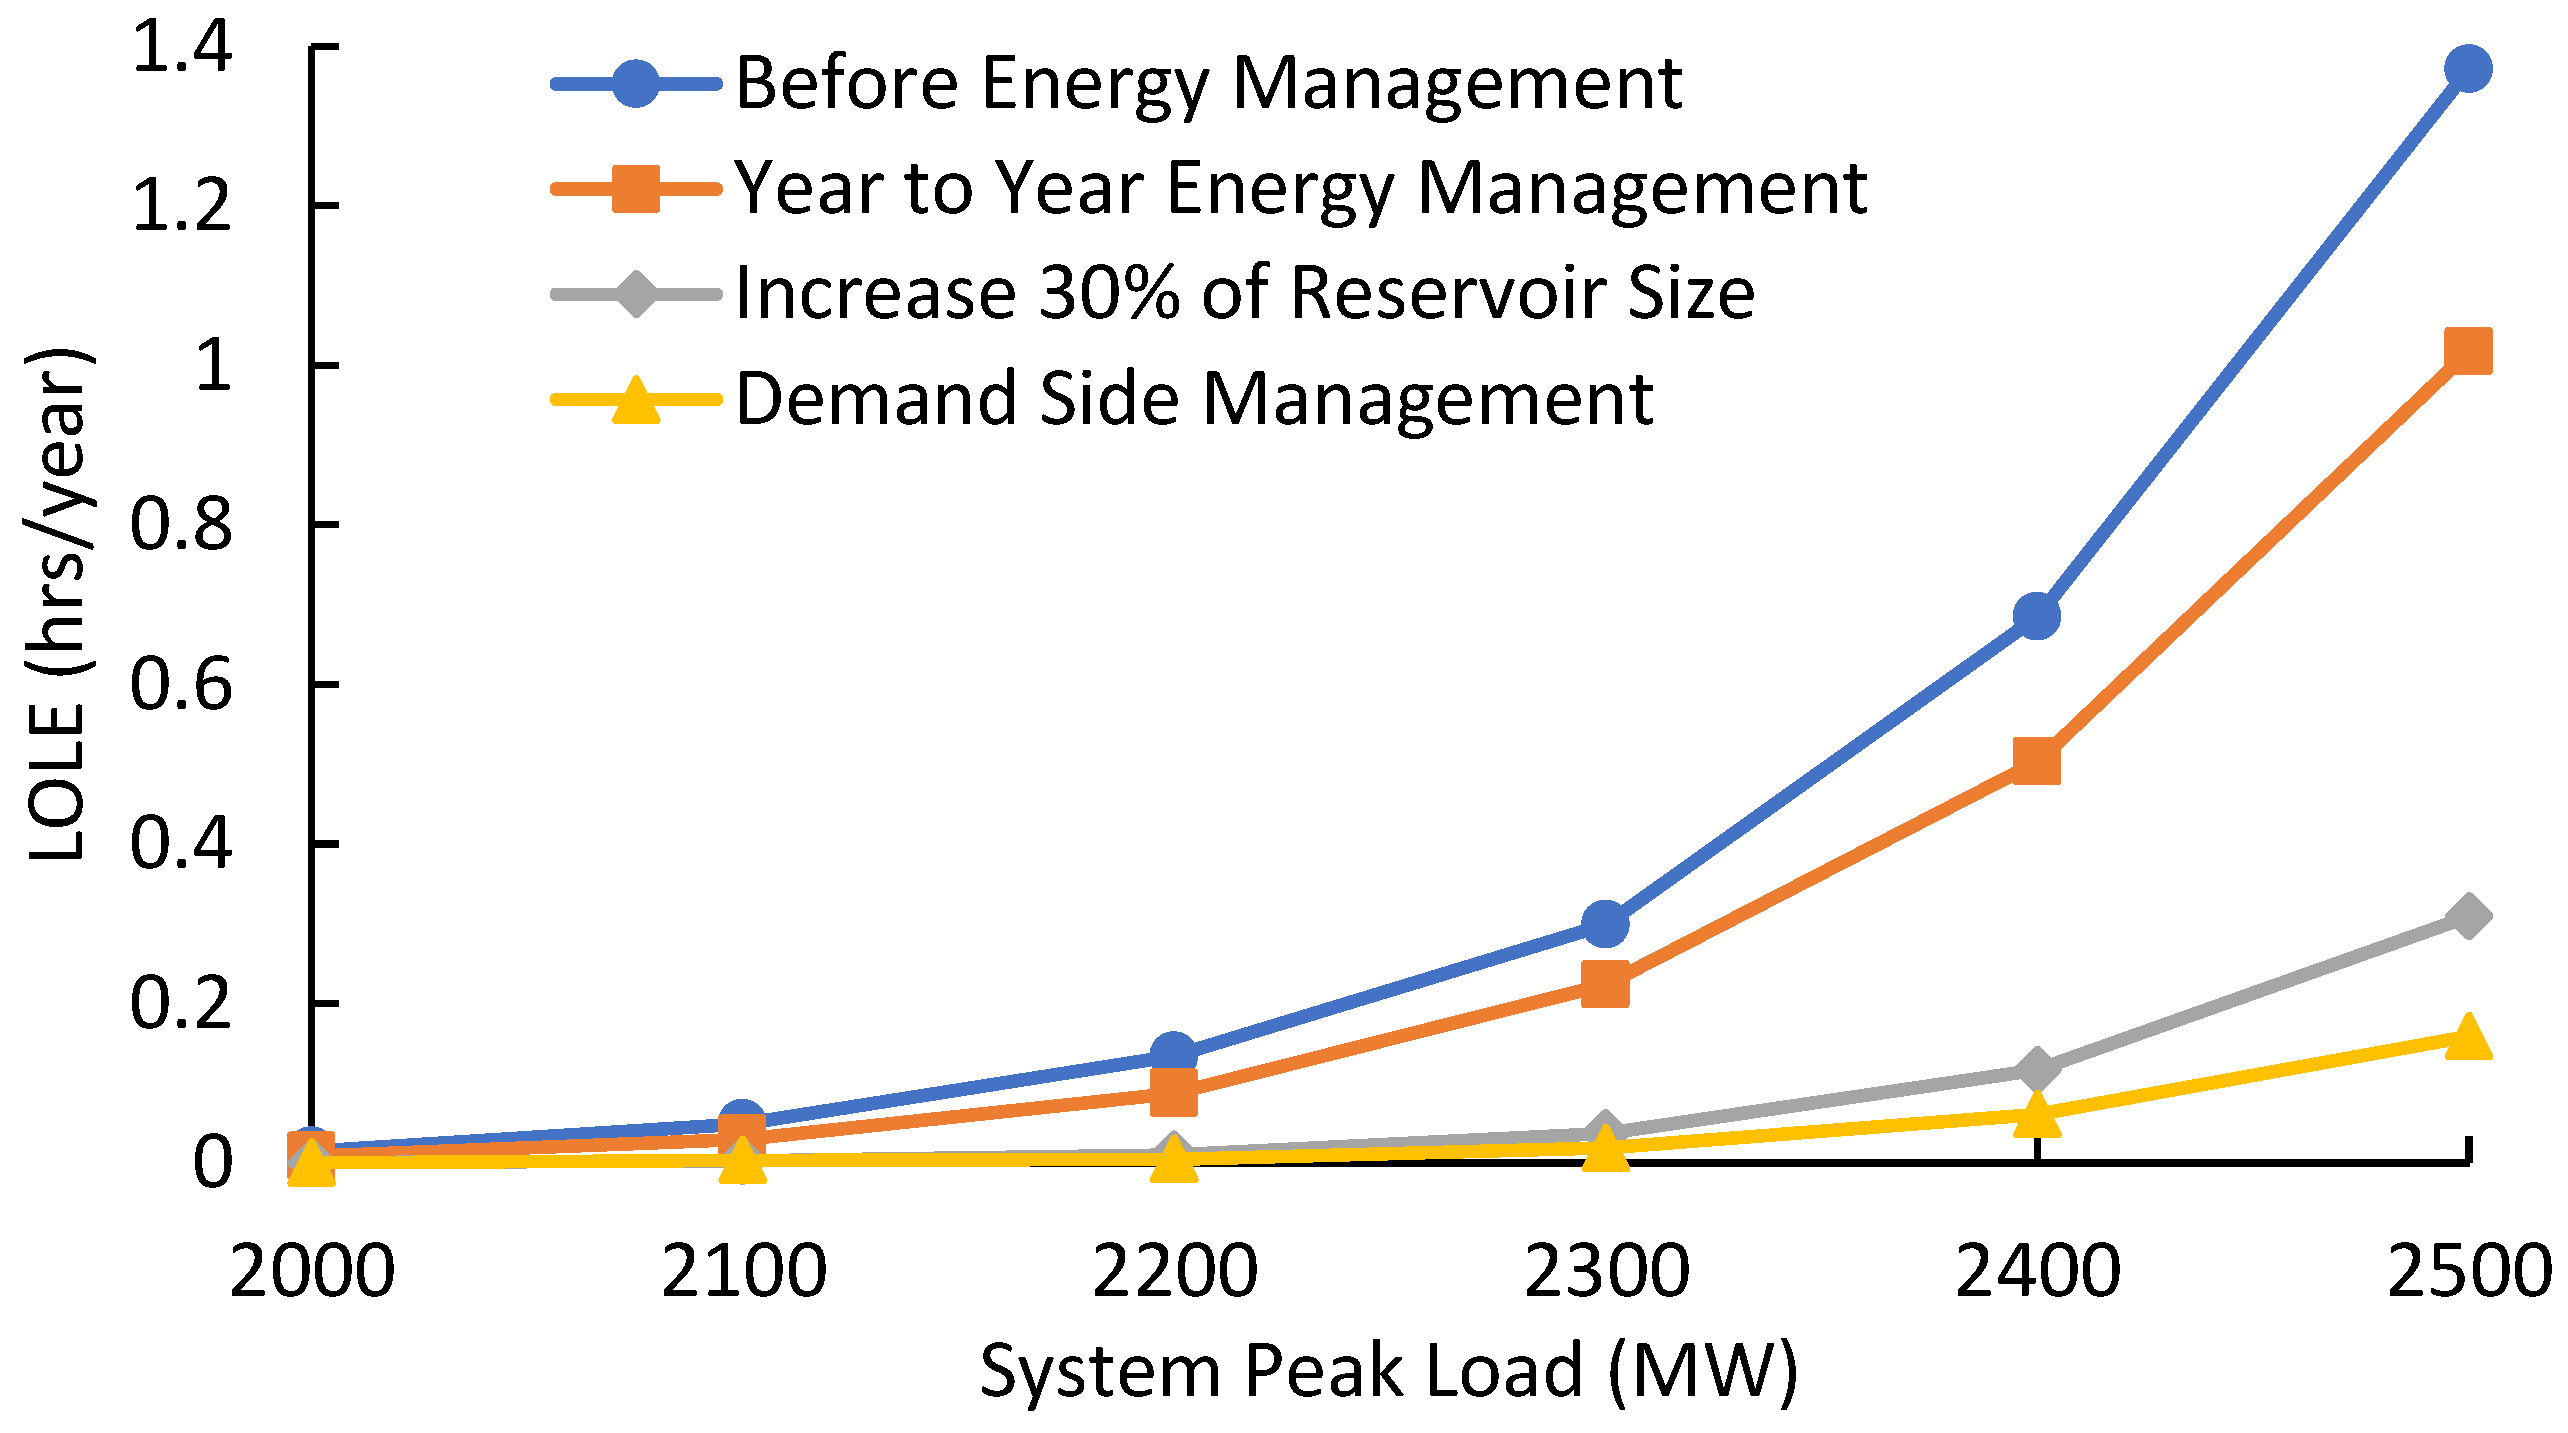
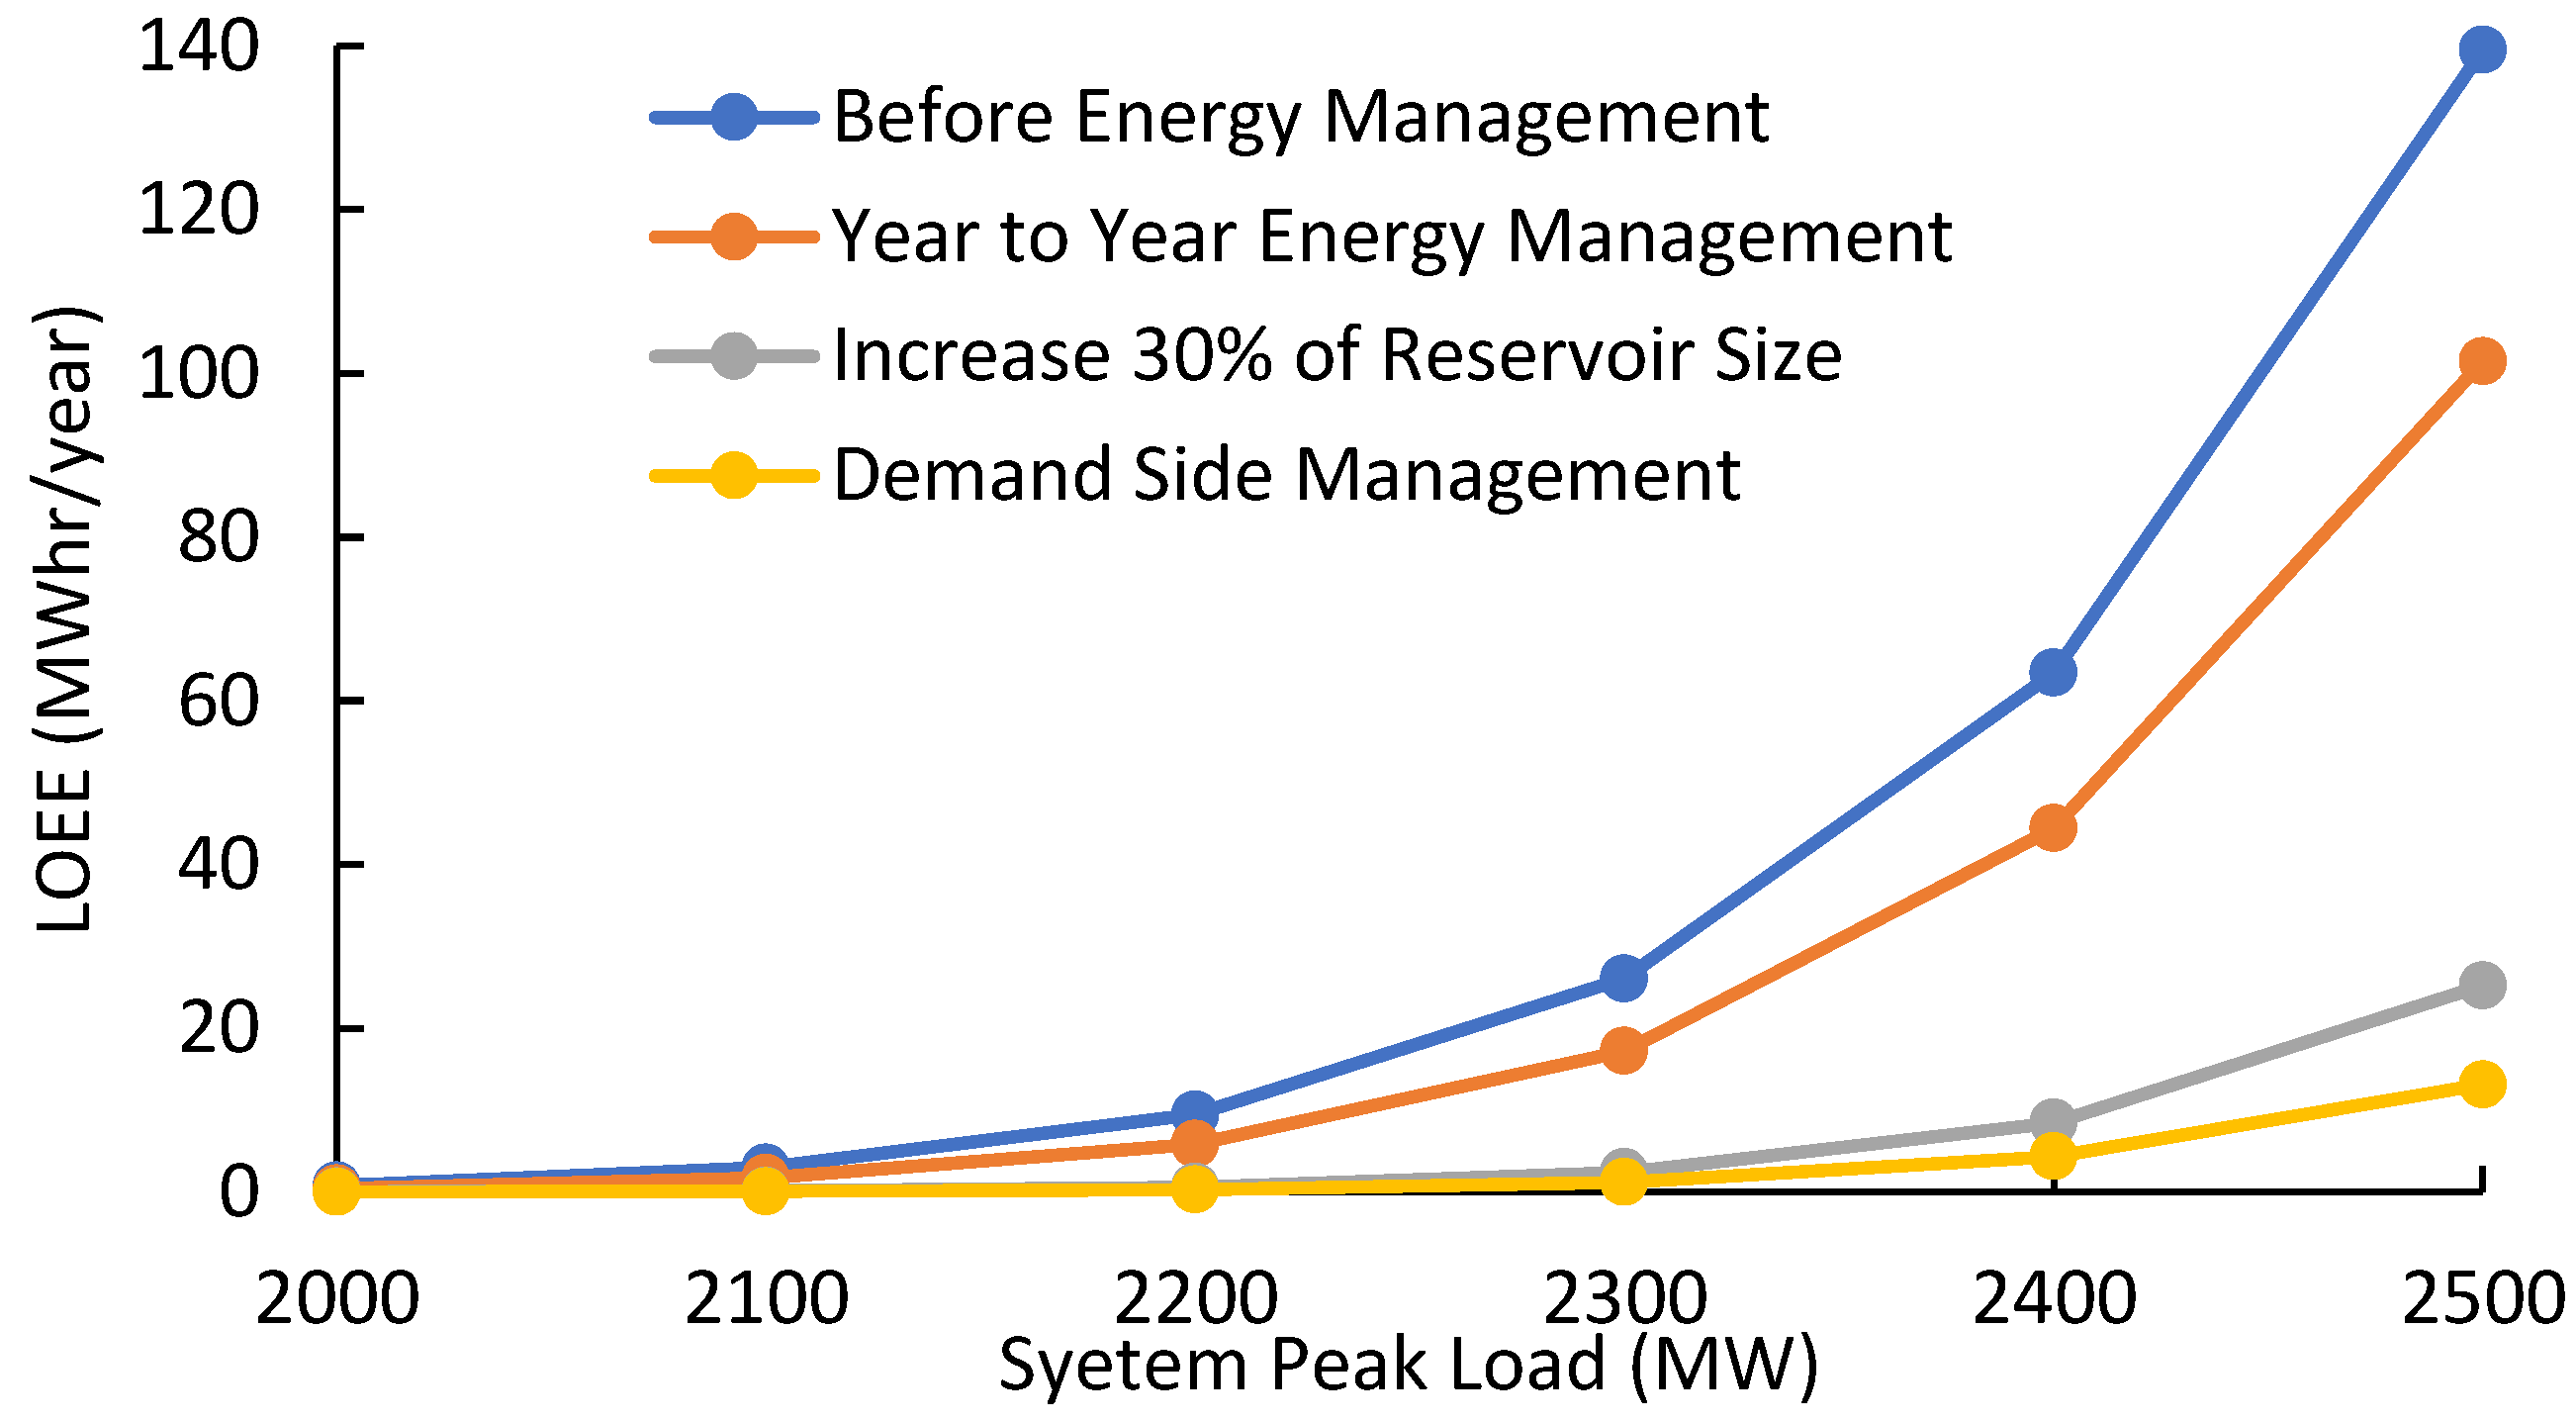
A sensitivity analysis was performed on the modified IEEE RTS to assess the impact of the energy management strategy on the loss of load and energy indices by varying the system peak demand, reservoir size and system load variation pattern. The expected system LOLE and LOEE were evaluated with and without implementing the year to year energy management strategy for reliability enhancement on the base system. These indices were also evaluated considering 30% increase in reservoir volume and varying the system peak load and the load profile obtained through demand-side management with high correlation with the seasonal river-flow.
Figure 17 and
Figure 18 respectively show the expected system LOLE and LOEE increase with the increase in the system peak load considering the above-mentioned factors. As compared to the case without energy management, the year to year energy management results in a significant reduction in the system LOLE and LOEE. The figures show that there is further improvement in system reliability with the increase in reservoir size by 30%, and the implantation of the demand side management. It can be noted that the application of the demand side management provides a relatively large improvement in the reliability of the system as shown in
Figure 17 and
Figure 18.


