Abstract
Brewers’ spent grains (BSGs) are the most important by-product of the brewing industry and are rich in protein and fiber. However, abundant amounts of BSGs are discarded annually worldwide. This project aimed to employ and compare innovative drying techniques to introduce snacks with protein sources derived from leftover BSGs. This study explored the dehydration kinetics of BSGs and the effect of three different drying methods—oven drying (OD), freeze drying (FD), and vacuum microwave drying (VMD)—on their protein content and functionality. Then, an energy and exergy analysis for the drying methods was given. Accordingly, a snack product (baked chips) using the dehydrated BSGs was developed by a sensory panel study to assess consumer acceptability of the final products. It was found that the VMD process took less drying time (48 min) compared to OD (50 min), with higher effectiveness as a drying process. VMD-treated BSG also showed moderate protein functionality and the highest overall acceptability when used in baked chips. Thus, VMD might be used as a sustainable drying technology for thermal treatment and valorization of BSG. In addition to having implications for dietary health, findings can help improve the economy of the breweries and other industries that deal with the processing of grains by valorizing their process waste and contributing to sustainability.
1. Introduction
Beer is the world’s most popular alcoholic beverage, and third-most-popular beverage after water and tea, with the global beer production being 1.94 billion hectoliters in 2018 [1]. Brewers’ spent grains (BSGs) are the most abundant by-product generated from the beer-brewing process, representing ~85% of the total by-products obtained. Every hectoliter of beer produces approximately 15–20 kg of BSG, which corresponds to 34 million tons of wet BSG generated annually [2]. BSG is the residue left after separation of the wort during the brewing process and comprises majorly of the barley grain husks, and also minor fractions of pericarp and fragments of endosperm. The barley variety, harvest time, malting, mashing conditions, the quality and type of adjuncts added in the brewing process affect the chemical composition of the BSG [3]. Typically, the collected BSG, immediately after fermentation, is usually wet and contains 77–81% (w/w) water [4], which makes it very unstable and liable to microbiological deterioration owing to high water activity [5]. Drying can be employed as a preliminary step to reduce the moisture content of BSGs to a level that impedes microbial growth, slows down other deteriorative reactions, and reduces product mass, thereby prolonging shelf life considerably [6]. Dry BSGs are mainly composed of 14.2–26.7% proteins, 3.9–13.3% lipids, 12.0–25.4% cellulose, 21.8–40.2% hemicellulose and 4.0–27.8% lignin [7]. This chemical composition of BSG, along with its high fiber content, enables it to act as a potential feedstock for several commercial processes, with applications in biotechnology, thermochemical, and biochemical engineering, such as renewable energy, substrate cultivation, enzyme production, breadmaking, ethanol, butanol and xylitol, activated carbon, charcoal, lignin, and oligosaccharides production [8,9]. Therefore, the application of BSG as a low-cost source of nutrients like protein, fiber, and phytochemicals for the dietary purposes is of particular interest nowadays and was successfully demonstrated for a number of bakery products, including breads, muffins, cookies, mixed grain cereals, cakes, waffles, tortillas, brownies, and doughnuts [5]. Furthermore, a pasteurization step is usually desirable for microbiological safety, if the valorized BSG has to be used for human consumption. However, the aim should be to minimize the changes caused by processing techniques on the overall quality of the spent grains for end uses in food formulations.
Drying is one of the oldest and most efficient methods used for preservation of food [10]. However, conventional methods of drying, like oven drying, involve exposure to high temperatures for extended periods of time, which results in adverse effects on the physicochemical and nutritional properties of food products. Freeze drying (FD), often considered the best for preserving functional food products, is costly and time-consuming [11]. Vacuum-microwave drying (VMD) was recently developed as an effective strategy of using a combination of microwave and vacuum [10], wherein the application of vacuum serves the dual role of increasing the moisture removal rate and lowering the boiling point of water to control the temperature at which drying occurs. By controlling the vacuum and microwave levels, one could effectively control both the temperature-time treatment (for ensuring food safety) and the water activity of the product (for extending shelf-life), the two factors considered critical for food preservation.
The aim of this study is to evaluate the dehydration kinetics and effectiveness analyses of different drying techniques (namely, oven drying (OD), FD, and VMD), and to assess its impact on the protein content and functionality of the dehydrated BSG. Furthermore, we explore the feasibility of valorizing BSGs as a potential plant-protein source for nutritious value-added products (baked chips) fit for human consumption. In particular, we attempt to develop a process that will enable the shelf-life extension and ensure food safety for the dehydrated BSGs. In addition to having implications for dietary health, findings can help improve the economy of the breweries and other industries that deal with the processing of grains by valorizing their process waste and contributing to sustainability.
2. Materials and Methods
2.1. Materials
Fresh spent grains were supplied by CraftGrain (Upcycle Foods Ltd., Vancouver, BC, Canada). BSGs were collected from Bridge and Andina Brewing Companies, Vancouver, Canada, quickly after the mashing process, and were composed of 95% pilsner malt with small portions of wheat and corn flakes.
Chemicals required for protein analysis (sulphuric acid, H2SO4, 98% and 0.1 M sodium hydroxide) were procured from Fisher Scientific, Ottawa, ON, Canada.
2.2. Moisture Content and Water Activity Determination
The moisture content of collected BSGs was determined by using the Association of Official Analytical Chemists (AOAC) method [12]. In brief, around 3 g of BSG sample was taken in a clean, pre-dried, and pre-weighed dish. The initial sample weight (Wo) and sample weight after drying (Wf) in an oven at 105 °C (until no further weight change was observed) were recorded. The measurements were triplicated. The moisture content (% on wet basis) was calculated using Equation (1) as follows.
The water activity of the samples was determined using a water activity meter (Aqualab Inc., Washington, DC, USA). The measurements were triplicated.
2.3. Dehydration
The BSGs were subjected to three different dehydration treatment, namely, VMD below 180 torr vacuum level in a Radiant Energy Vacuum REVTM dryer (Enwave Corporation, Vancouver, BC, Canada), OD in an oven drier (HerathermTM oven, Thermo Fisher Scientific, BC, Canada) at three temperatures under a constant airflow velocity, and freeze-dried (1.1 mBar and −54 °C) in a lyophilizer (Labconco Corporation, Kansas City, MO, USA) at the UBC Food and Beverage Innovation Center (Faculty of Land and Food Systems, University of British Columbia, Vancouver, BC, Canada). Freeze-drying was employed as it is considered a golden standard in drying processes. The dried samples were then milled to obtain a coarsely-ground flour with particle size less than 5 mm. The dried BSG flour were subsequently stored in refrigerated conditions (4 °C) in glass containers until further analyses. The flour samples were subsequently used in baked chip formulations by the company for sensory study.
2.3.1. Dehydration Kinetics
The drying behavior and drying calculations for design and optimization of grain drying were facilitated by the evaluation of drying kinetics. Drying kinetics were established for the VMD and OD process based on a thin-layer drying approach. Consequently, a 0.5 cm thin layer of fresh BSG samples (about 5 g) was taken in a clean, pre-weighed dish. These fresh samples were VMD dried at power levels of 250 W and vacuum levels below 180 torr (0.24 bar), at which a saturation temperature 65 °C was considered in the product. Only one power level was considered because there was considerable burning of product observed above 250 W. The sample dishes were weighed and recorded every 1 min until no mass changes were observed. Similarly, samples were oven-dried at three different temperatures (60 °C, 65 °C, and 70 °C) under a constant airflow of velocity 0.05 m/s. Three rounds of replications were completed for both methods. The average room air characteristics were 26 °C and 35% relative humidity (same for drying air in OD).
2.3.2. Drying Process Modeling
The drying behavior of the samples was studied using drying kinetics. The underlying assumptions of the analysis included that: (a) the drying process is isothermal, (b) no contraction or deformation of BSG layer takes place, (c) the grains layer was assumed to be isotropic. Water was considered to be lost from the system by the diffusion mechanism and having constant effective moisture diffusivity. Hence, the moisture diffusion could be modeled using Fick’s diffusion law as in Equation (2) for a slab geometry, with boundary conditions described by Equations (3)–(5):
where M is the moisture content (dry basis); t is the time (s); Deff is the effective moisture diffusivity (m2/s); x is the dimension of slab (m); L is the slab thickness (m); are Mi and Me are the initial and equilibrium moisture content (dry basis), respectively. Assuming that the initial moisture content in the sample to be uniform throughout, the differential equation can be solved by separation of variables and moisture content can be expressed in a dimensionless (as Moisture ratio, MR) way, as in Equation (6).
t = 0 0 < x < L M = Mi,
t > 0 x = L M = Me,
The solution to Equation (2) becomes an infinite series [13,14,15]:
Considering only the first term as the approximate solution of the Equation (7), we get:
From Equation (8), the time required in a drying process to obtain a specific moisture content can be calculated as a function of the effective diffusivity, Deff. Equation (8) can also be written in general logarithmic form as Equation (9):
where a = and b = .
When the data on weight loss of sample with time were transformed into moisture content (dry basis), and thereby ln MR was plotted versus drying time for each treatment, straight lines were obtained (coefficient of determination, R2 > 0.9). Linear regression analysis was carried out to calculate the Deff from the slope, b.
In the case of OD, the effect of drying temperatures 60 °C, 65 °C, and 70 °C on diffusivity was studied and considered to follow the Arrhenius equation, as shown in Equation (10) [14]:
where Do is the pre-exponential factor of diffusivity (m2/s); Ea is the activation energy (J/mol); and T is the absolute temperature (K). Do and Ea were ascertained by plotting the values of ln Deff versus 1/T(K) and the slope of the graph.
Once drying kinetics were established according to a thin layer geometry, the drying process was modeled mathematically. The drying data, especially the MR, were expressed as a function of drying time by fitting the data into seven thin layer drying models, namely exponential, Page, modified Page, Henderson–Pabis, logarithmic, power-law, Wang and Singh. The acceptability of a model was determined by calculating the coefficient of determination (R2). The goodness of fit for the models was determined by calculating the standard error of estimate (SEE) (Equation (11)), χ2 (Equation (12)), and root mean square error (ERMS) (Equation (13)) between the experimental data and model data. All the calculations were carried out using non-linear regression analysis in Microsoft® Excel software (Solver program). Consequently, the statistical values and model parameters were calculated.
2.4. Energy and Exergy Analyses
As drying is one of the most energy intensive unit operations, contributing to 12–20% of energy consumption in the industries [16], the effectiveness of the drying processes (OD and VMD) was studied. Parameters like specific moisture extraction rate (SMER), specific energy consumption (SEC), energy efficiency (ηen), and exergy efficiency (ηex) were evaluated for these two drying processes.
Firstly, SMER was calculated as ratio of moisture evaporated to the energy consumption during drying process by employing the following Equation (14) [16]:
where Et is the energy consumption during drying (kWh). In the case for VMD treatment, microwave energy was used and thus Et = microwave power × drying time (t), while for oven drying, thermal energy was considered, and thus Et = A × va × ρa × ca × ∆T × t (A = drying container area, m2; va = air velocity (0.05 m/s); ρa = air density (1.06, 1.045, and 1.029 kg/m3 at 60, 65, and 70 °C [17]); ca = specific heat of air (from equation ca = 1.005 + 1.88w taken from Motaveli et al. [18], values were 1.0802, 1.099, and 1.1178 kJ/kg dry air-K for 60, 65, and 70 °C at different values of w taken from literature [19]); ∆T = temperature difference between drying air and sample, considering sample remains at wet bulb temperature of drying air, which were taken from literature [19]; t = drying time, h).
The parameter SEC was calculated as amount of energy required (MJ) to dry a kg of sample as given by Equation (15) [16]:
Energy efficiency (ηen) was calculated as the ratio of energy required for moisture removal to total energy consumption during drying, as given by the following Equation (16) [16]:
where λw = latent heat of water (2257 kJ/kg [16]).
Additionally, an exergy analysis was also carried out. Exergy analysis is an important thermodynamic concept to design and optimize the performance of drying systems. From a thermodynamic aspect, the exergy is the maximum work that can be derived from a system or a stream of matter or energy as that system comes to equilibrium with a reference environment [20]. It is believed to portray a more reliable evaluation of drying systems [20]. For the current study, exergy analysis was done by calculating the parameter exergy efficiency (ηex) for the drying operations. It was calculated as the ratio of rate of exergy used by the process for moisture removal to the total power consumption based on Equation (17) [16]:
where Exevap = rate of exergy used for moisture removal, as calculated by Equation (18):
where To = ambient temperature (26 °C); Tp = product temperature (considering wet bulb temperatures of product at each drying temperature as the temperature of product for oven drying. Product temperature of 65 °C was considered for VMD as saturation temperature equivalent to 180 Torr); mw’ = rate of moisture removal, kg/s; λwp = latent heat of product, kJ/kg product.
2.5. Protein Content Determination
The protein content of the BSGs of dried samples (VMD, FD, and OD samples at three different temperatures, 60, 65, and 70 °C), and fresh sample was determined by using the Kjeldahl method based on the measurement of total nitrogen [21,22]. Briefly, dried flour samples from BSGs were digested in Kjeldahl digestion assembly using 98% H2SO4 and then distilled to liberate ammonia, which was titrated against standard 0.1 N NaOH. Consequently, nitrogen content (%) of the samples was obtained (%Nitrogen = [volume of NaOH × Normality of NaOH × 14 × 100]/sample weight in mg). A nitrogen conversion factor of 6.25 was used for conversion into protein as per Equation (19). Measurements were triplicated for each of the samples.
2.6. Protein Functionality
Since the spent grains are a rich protein source, their functionality plays a major role in product development, especially the baked chips. Thus, the protein functionality of all BSGs flour using three different techniques of dehydration (VMD, FD, and OD (65 °C)) were studied. Only oven drying at 65 °C was further considered, as it was comparable to the VMD process, which had saturation temperature at 65 °C.
2.6.1. Water and Oil Holding Capacity Determination
Water holding capacity (WHC) and oil holding capacity (OHC) were determined by the method of Stone et al. [23], with few modifications. Briefly, water/oil holding capacity was determined by suspending 1.0 g of dried sample in 1.0 g of water/oil (sunflower oil) in a 50 mL centrifuge tube. Samples were vortexed every 5 min for 10 s for a total of 30 min and then centrifuged at 1000× g for 15 min. The supernatant was carefully decanted, and the remaining pellet was weighed. Water/oil holding capacity was calculated by dividing the weight gained by the sample by the original sample weight (×100%) as per the following Equation (20). Measurements were triplicated for each sample.
2.6.2. Foaming Capacity and Foam Stability Determination
Foaming attributes (foaming capacity, FC, and foam stability, FS) for each sample were tested according to Stone et al. [23]. A 1.00% (w/w) dried sample solution (based on weight protein content within the dried sample) was prepared with 10 mM sodium phosphate buffer (pH 7.00) and stirred overnight at 4 °C. A total of 30 mL of the protein solution was transferred into a 400 mL glass beaker. The protein solution was placed in a high-speed homogenizer (Polytron PCU-2-110, Brinkmann Ind. Westbury, NY, USA) to foam. The probe blades were merged into the solution, and the probe was not in contact with the beaker. The sample was allowed to foam for a total of 5 min at speed setting 3. After homogenization, the foam was transferred into a 100 mL graduated cylinder immediately using a spatula. The volume was recorded at time 0 min and time 30 min. The foaming capacity and foaming stability were calculated, as shown in Equations (21) and (22).
2.7. Sensory Evaluation of the Manufactured Baked Chips
Different baked chips were prepared using the dried BSG samples (OD at 65 °C, VMD, FD) as per the proprietary formulation for making baked chips. Affective Sensory evaluations of six different attributes of these chips (namely appearance, taste, smell, texture, aftertaste, and overall acceptability) were conducted based on a nine-point Hedonic scale (from 9—like extremely to 1—dislike extremely) by a panel of 25 untrained panelists presented with randomized samples [24]. The panelists comprised the undergraduate and graduate students in our department, aged 20–30 years. The panelists were selected based on their likeness of baked products. Panelists’ discriminating ability and consistency were verified through various statistical measures including means, standard deviations, and Analysis of Variance (ANOVA).
2.8. Statistical Analysis
All data were expressed as means ± SD after carrying out technical replicate experiments. Student’s t-test was used to test for differences at a significance level of p ≤ 0.05 where appropriate. ANOVA was carried out using Microsoft® Excel software. Drying kinetics evaluation and drying model fitting were carried out using statistical tools available in Microsoft Excel.
3. Results and Discussion
3.1. Moisture Content and Water Activity
The BSGs had a high moisture content (77.35 ± 0.484% on wet basis) with water activity (aw) of 0.99 ± 0.003. High moisture content and water activity values for the samples show their susceptibility to microbial and biochemical degradation. Thus, there is a need to dry the BSGs for longer shelf life and usage. Further, the storage and transport of BSG from the breweries to the processing center might often result in microbial growth, particularly when fresh BSG has such a higher moisture content and water activity. To use such a product as a food ingredient, it is not only necessary to lower the water content by drying, but also to ensure that the minimum pasteurization conditions have been met. Final moisture content of the dried BSGs ranged from 4.3–4.7% on wet basis.
3.2. Dehydration Kinetics and Process Modeling
3.2.1. Drying Behavior
The Figure 1 shows the dehydration moisture removal rate. For conventional oven-drying, temperature significantly affected the drying process time, with the lowest drying time recorded at 70 °C. The drying time for the VMD sample also was similar to that of the 70 °C OD dried sample. This can also be ascertained from the drying rate curves for the experimental data, as shown in Figure 1a, wherein the drying rates were calculated from the drying data by taking change in moisture content for each interval and expressed as g H2O/ g dry matter /min. As expected, drying rates of OD at the three temperatures followed the order 70 °C > 65 °C > 60 °C during the entire drying process. During the initial constant rate drying period at high moisture content, VMD’s drying rate was 33–67% faster than OD at the three temperatures studied. At moisture content below 100% db moisture content, the curves made a slope with x-axis depicting a falling rate period. The falling rates of drying for all samples indicate an increase in resistance to moisture migration from inside to the surface. The dimensionless moisture content, or the moisture ration MR, kept on decreasing for all the drying processes with drying time. This has been illustrated in Figure 1b. Decreasing MR with drying time is in agreement with the drying of most biological materials and spent grain drying [25,26]. In this zone, VMD drying rates and slopes were similar to that of OD at 65 °C, with 70 °C OD depicting a faster drying phenomenon.
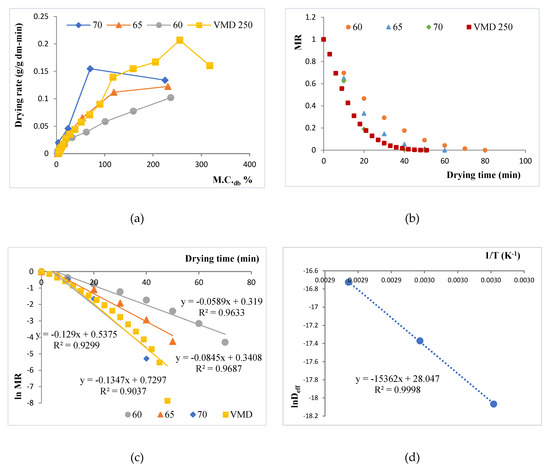
Figure 1.
Plots for drying kinetics of vacuum microwave drying (VMD) and oven drying (OD) at 60 °C, 65 °C, and 70 °C. (a) Drying rate curve for brewers’ spent grains (BSG) samples for different OD temperatures (60 °C, 65 °C, and 70 °C) and for VMD; (b) Moisture Ratio (MR) versus drying time for the samples; (c) plotting ln MR versus drying time for the samples at 60 °C, 65 °C, and 70 °C oven drying and VMD treatment; (d) ln Deff versus 1/T.
This relative slowing of the VMD drying process during the falling rate period may be attributed to the relatively higher-pressure levels (180 torr, as compared to lower than 40 torr used in other works like Kwok et al. [10], Wojdyło et al. [6]) used during the VMD process in this study to maintain the product temperature in the critical zone. A higher level of VMD pressure was used in this study to raise the critical temperature to 65 °C for simultaneous pasteurization of the BSG waste. At 180 torr, as confirmed by the temperature collected from the VMD drier, a greater than 40 min of equivalent lethality at 65 °C was recorded for the BSGs. This would tend to pasteurize the product by the generated heating.
3.2.2. Effect of Drying Conditions on Moisture Diffusivity
A continuous decrease in MR with time shows that kinetics could be established based on Fick’s diffusion model, as diffusion governs the falling rate period. As already discussed, Equation (5) was obtained after solving the diffusion equation, considering a constant moisture diffusivity. When the experimental data were plotted as ln MR against time (Figure 1c), the data conformed to be linear with R2 > 0.9. This allowed for linear regression analysis to use the slope (b) in Equation (6) to evaluate the effective diffusivity (Deff), shown in Table 1. As evident, the Deff values were profoundly affected by drying temperatures. The value of Deff for the VMD was also within range of OD, with VMD values being slightly lower than OD at 70 °C, and larger than OD at 60 °C and 65 °C. Overall, the Deff varied from 1.42 × 10−08 to 5.45 × 10−08 m2/s. The values lie well within the Deff values of most food materials (between 10−08 and 10−12 m2/s) [27], like apricots [28] and pomegranate [29]. Using the Arrhenius relationship, the values of ln Deff at each temperature were plotted against 1/T and showed a straight line with high linearity (R2 > 0.99) (Figure 1d). The activation energy (Ea) was found to be 7095.5 J/g, whereas the pre-exponential factor for effective diffusivity (Do) was evaluated to be 1.52 × 10¹² m2/s.

Table 1.
Calculation of effective diffusivity (Deff) values for the drying treatments.
3.2.3. Drying Process Modeling
Since MR was a function of drying time, and it decreased continuously, the drying data were fitted to seven different thin-layer drying models. The fitness of the model to approximate the drying data was determined by using R2, χ2, SEE, and ERMS values. In general, the R2 value has to be close to 1, and χ2, SEE, and ERMS values needed to be minimized. Table 2 shows these values for various model with their parameters. The page model was seen to fit the experimental data better than other models with the highest value of R2 (0.9996–0.9999) and lower values of χ2 (0.0018–0.0141), SEE (0.0034–0.0143), and ERMS (<0.0001). Figure 2a shows the fitting of the Page model on the experimental MR values for each drying treatment. The Page model had also been reported to fit drying data for several food materials, like raw mango slices [30] and bay leaves [31]. Nevertheless, Figure 2b shows a highly positive correlation between experimental and predicted MR values. Thus, the Page model was found to best represent the thin-layer drying behavior of BSGs.
Table 2.
Values of various model constants and statistical parameters.
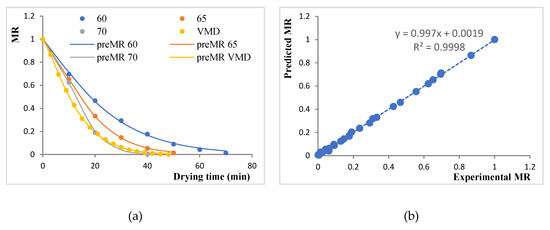
Figure 2.
Plots for modeling the moisture ratio (MR): (a) Experimental MR versus drying time fitted with the Page model for various drying treatments; (b) correlation between experimental and predicted MR values as per the Page model.
3.3. Energy and Exergy Analyses
Energy and exergy analyses have been extensively carried out for conventional drying methods like hot air oven drying, vacuum drying, and microwave drying treatments. There have been studies related to energy efficiency analysis for vacuum-microwave drying [32]. However, no previous work has been done discussing the exergy analysis related to vacuum-microwave drying as compared to conventional thermal processes. In order to suggest effective ways of valorizing the breweries wastes, an energy and effectiveness analysis is always handy. This study is the first to discuss the energy and exergy analyses for drying brewers’ spent grains by different techniques like oven drying and vacuum microwave drying. Figure 3a–d shows the variation in SMER, SEC, ηen, and ηex among all the treatments. The values of SMER varied from 0.165 to 0.388 kg/kWh, with the highest value for the VMD 250 W treatment. This was due to more moisture expulsion and drying for a given energy consumption in vacuum microwave drying. Previous work suggests higher SMER values for the microwave drying of carpet as compared to conventional drying [33].
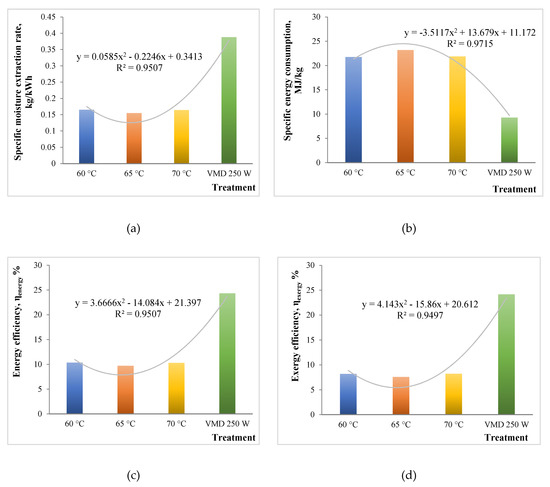
Figure 3.
Energy and exergy analyses plots for different drying treatments: (a) Specfic Moisture Extraction Rate; (b) Specific Energy Consumption; (c) Energy efficiency, ηen; (d) Exergy efficiency, ηex.
SEC values represent reciprocation of SMER values, with a range from 9.274 to 23.201 MJ/kg. The lowest value was obtained for the VMD 250 W process. Apparently, a 60% reduction was observed in SEC by microwave application. This was in close agreement with the study by Sharma and Prasad [34], who obtained 70% reduction in microwave drying as compared to convective drying processes.
Efficiencies (ηen, and ηex) were observed to be contrasting between the different drying processes. The ηen ranged from 9.7% to 24.3%, with a significantly higher value in the case of VMD. Similarly, the ηex also seemed to be in line with the former, ranging from 7.6% to 24.2%. It was apparent that the values of ηen and ηex were low, which could be due to the smaller quantity of sample taken for the drying (around 5 g) [16]. Overall, VMD seemed to be better in terms of efficiency and energy saving for the drying of BSGs.
3.4. Protein Content
The protein content of the dried BSGs, as well as fresh sample, are shown in Table 3. The result showed that only drying method generally had no significant effect on the protein content of the sample, as the protein contents of VMD, FD, and oven drying 60 °C were not significantly different (p > 0.05) from each other. This is consistent with other findings about the impact of drying on total protein content [35]. Mostly the protein content of 22–24% on dry basis for the BSGs indicated the need to extract this valuable food by-product for utilization in product development.
Table 3.
The protein content and functionality of BSG samples.
3.5. Protein Functionality
The interactions of water and oil with proteins are significant in food systems because of their effects on food flavor and texture [36]. Water/oil holding capacity values for all dried BSGs with three different techniques are presented in Table 3.
3.5.1. Water Holding Capacity and Oil Holding Capacity
The data showed that grains dried by OD at 65 °C had the highest WHC (1.52 g/g), followed by VMD (1.31 g/g) and FD (1.18 g/g). The range of oil holding capacity was from 2.27 g/g (FD) to 3.33 g/g (OD-65 °C). The values of WHC and OHC were statistically significantly higher (p < 0.05) for OD-65 °C and VMD than FD samples. Since air drying and VMD involve the application of heat for dehydration process, it can be deduced that heat application may lead to denaturation and conformational changes in protein structure, which might affect the functional properties [37]. Lesser values in the case of FD might be reflective of the fact that the proteins would still be in their native state, allowing minimum functionality. WHC and OHC in BSG flour varied based on the BSGs compositions after mashing process in the breweries. Replacement of wheat flour with barley flour significantly increased the water absorption capacity. Increasing the levels of barley flour in wheat flour blend insignificantly increased the oil absorption capacity of the blends [38]. Although the BSGs are a rich in fiber, they too affect the functionality of BSG products. Öztürk et al. [39] used BSGs for making cookies and observed the spread ratio (width/thickness) of cookies. This suggests that the fiber could bind the matrix together and lessen the spread. The impact of fibers of BSG chips could be a topic of further research.
3.5.2. Foaming Capacity and Foaming Stability
Table 3 also illustrates the relevant data for foaming capacity and stability. There was no significant difference (p < 0.05) for these values in all the three different samples. The foaming capacity and foaming stability of BSG flours from three different techniques at pH 7.00 was not very noticeable and was almost the same value (1.5 mL), and the stability of foaming for all samples was low and nearly at the same value (0.5 mL). Foaming capacity and stability were affected by drying at high temperatures of 105 °C, as shown earlier [40]. However, no differences were observed between oven drying at 80 °C and vacuum drying by them, which supports our results. Intensity of the drying treatment affects the interfacial properties of proteins. Similarity with the FD samples meant that the treatment conditions were not so intense to affect these properties.
3.6. Sensory Analysis of Baked Chips
Baked chips were prepared by incorporating the dried BSG flours obtained using OD-65 °C, VMD and FD (Figure 4) The sensory profiles for the baked chips made by using different dried BSGs are given in Figure 5. The diagram shows mean scores of each sensory attribute (namely appearance, texture, taste, smell, aftertaste, and overall acceptability) on a scale of 1 to 9 for all the types of chips on a cobweb plot radiating from the center point. The results showed (also statistical analysis) that there was no significant difference (p > 0.05) between the appearance of baked chips made using dried BSG obtained from any technique. In fact, there was no visual difference between the chip samples of each type. The appearance was “liked slightly” according to the mean score by panelists. What is more, the sensory characters like smell and aftertaste were also not significantly different (p > 0.05) and indistinguishable for all types of chips. However, VMD samples still got slightly higher mean scores for these characteristics than OD and FD chips. Also, these characteristics were “like moderately” for all types. For texture, the mean score for OD chips sample was slightly higher than VMD and FD samples, which did not differ much. The taste characteristics for the FD sample were significantly lower (p < 0.05) than both VMD and OD samples. This suggests that heat treatment during drying in the case of VMD and OD enhances the taste of BSG greatly. The taste of VMD and OD chips was “liked very much” by panelists. This also affected the overall acceptability of the chips. FD chips obtained the lowest mean scores compared to both the VMD and OD chips. Overall, the VMD chips attained the highest mean scores and were liked very much by panelists.
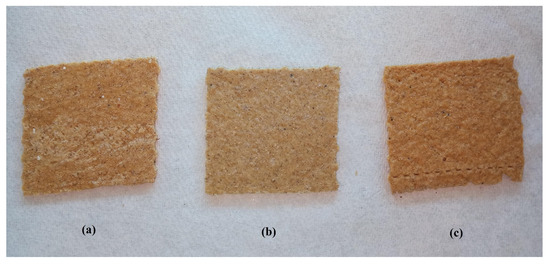
Figure 4.
Images of the prepared baked chips: (a) OD; (b) VMD; (c) FD.
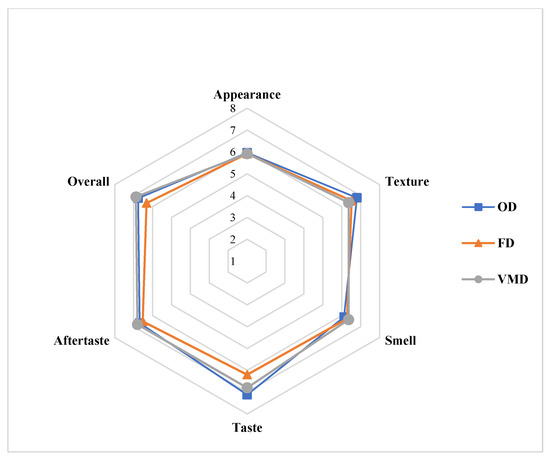
Figure 5.
Cobweb plots for sensory profiles of baked chips using different dried BSG samples.
4. Conclusions
This study aimed to convert wasted brewers’ grains into some value-added product by drying and grinding them to be added to baked chip formulations. The study could be summarized into the following points:
- Drying times were reduced using the VMD process;
- Drying curves showed a good fit to the Page model;
- The VMD process showed high effectiveness while drying;
- Chips made with VMD-treated BSGs attained high overall acceptability.
The drying behavior of BSG showed that with increasing temperature from 60 °C to 70 °C, the drying time reduced from 70 during OD-60 °C to 48 min during VMD and OD-70 °C. Also, the falling rate period persisted during drying, with effective moisture diffusivity of the order 10−08 m2/s. Drying data for all drying treatment fitted the Page model at high R2 value. The effectiveness of drying methods analyzed in terms of SMER, SEC, ηen and ηex revealed that the VMD treatment had the best results as compared to OD. In terms of protein functionality of dried BSGs, there was a significant difference (p < 0.05) between different dried samples for WHC and OHC. On the contrary, FS and FC were almost the same for each. For the sensory analyses of baked chips, the OD (65 °C) samples attained higher scores for taste and texture. However, highest score for overall acceptability was achieved by the VMD sample. In total, it can be said that owing to the higher overall acceptability, lower drying time of 48 min (VMD) as compared to 50 min (OD-65 °C), and also moderate values of OHC, WHC, the VMD may prove to be a remarkable technology for drying BSGs and thereby for waste valorization and sustainability strategies.
Author Contributions
A.P.S. and R.M. are both first authors for this manuscript. Conceptualization, A.P.S., R.M. and M.S.; Data curation, M.S.; Formal analysis, R.M.; Funding acquisition, A.P.S.; Investigation, R.M. and M.S.; Methodology, R.M. and M.S.; Project administration, A.P.S.; Software, R.M.; Supervision, A.P.S.; Validation, A.P.S., R.M. and M.S.; Visualization, M.S.; Writing—original draft, A.P.S., R.M., A.S., P.Ł.K., M.L., J.P. and M.J. All authors have read and agreed to the published version of the manuscript.
Funding
This project was funded by of University of British Columbia’s Material and the Manufacturing Research Institute (MMRI) Contributions to Organizations (CTO) Award No. R1-04-CTO2018, awarded to APS, through The National Research Council of Canada Industrial Research Assistance Program (NRC IRAP). Authors also thank the Natural Sciences and Engineering Research Council of Canada (NSERC) for financial support through the Discovery Grants Programme (Grant no. RGPIN-2018-04735) and Collaborative Research & Development Grant (Grant no. CRDPJ 522283-17 and Grant no. CRDPJ 522364-17) to APS.
Acknowledgments
We would like to sincerely thank UpCycle Foods Ltd., Vancouver, BC for providing the fresh brewer spent grains (BSGs) from the Vancouver local breweries and the chips produced by them.
Conflicts of Interest
Authors declare no conflict of interests. The funders had no role in the design of the study; in the collection, analyses, or interpretation of data; in the writing of the manuscript, or in the decision to publish the results.
References
- Beer Production Worldwide from 1998 to 2018. Statistics Portal. Available online: https://www.statista.com/statistics/270275/worldwide-beer-production/ (accessed on 20 March 2020).
- Xiros, C.; Christakopoulos, P. Biotechnological potential of brewers spent grain and its recent applications. Waste Biomass Valorization 2012, 3, 213–232. [Google Scholar] [CrossRef]
- Forssell, P.; Kontkanen, H.; Schols, H.A.; Hinz, S.; Eijsink, V.G.; Treimo, J.; Robertson, J.A.; Waldron, K.W.; Faulds, C.B.; Buchert, J. Hydrolysis of brewers’ spent grain by carbohydrate degrading enzymes. J. Inst. Brew. 2008, 114, 306–314. [Google Scholar] [CrossRef]
- Russ, W.; Mörtel, H.; Meyer-Pittroff, R. Application of spent grains to increase porosity in bricks. Constr. Build. Mater. 2005, 19, 117–126. [Google Scholar] [CrossRef]
- Mussatto, S.I.; Dragone, G.; Roberto, I.C. Brewers’ spent grain: Generation, characteristics and potential applications. J. Cereal Sci. 2006, 43, 1–14. [Google Scholar] [CrossRef]
- Landymore, C.; Durance, T.D.; Singh, A.; Pratap Singh, A.; Kitts, D.D. Comparing different dehydration methods on protein quality of krill (Euphausia Pacifica). Food Res. Int. 2019, 119, 276–282. [Google Scholar] [CrossRef]
- McCarthy, A.L.; O’Callaghan, Y.C.; Piggott, C.O.; FitzGerald, R.J.; O’Brien, N.M. Brewers’ spent grain; bioactivity of phenolic component, its role in animal nutrition and potential for incorporation in functional foods: A review. Proc. Nutr. Soc. 2012, 72, 117–125. [Google Scholar] [CrossRef]
- Ferraz, E.; Coroado, J.; Gamelas, J.; Silva, J.; Rocha, F.; Velosa, A. Spent brewery grains for improvement of thermal insulation of ceramic bricks. J. Mater. Civil. Eng. 2012, 25, 1638–1646. [Google Scholar] [CrossRef]
- Ravindran, R.; Jaiswal, A. Microbial enzyme production using lignocellulosic food industry wastes as feedstock: A review. Bioengineering 2016, 3, 30. [Google Scholar] [CrossRef]
- Kwok, B.H.L.; Hu, C.; Durance, T.; Kitts, D.D. Dehydration techniques affect phytochemical contents and free radical scavenging activities of Saskatoon berries (Amelanchier alnifolia Nutt.). J. Food Sci. 2004, 69, SNQ122–SNQ126. [Google Scholar] [CrossRef]
- San, H.; Meng, Q.; Liu, L.; Zhang, L.; Du, J. Creative Optimization and Industrial Research of Freeze Drying Process of the Cardiomyopeptidin for Injection. Chem. Eng. Trans. 2018, 70, 1201–1206. [Google Scholar]
- Horwitz, W.; George, W.; Latimer, G.W. (Eds.) Official Methods of Analysis of AOAC International, 17th ed.; AOAC International: Gaithersburg, MD, USA, 1999. [Google Scholar]
- Rossello, C.; Canellas, J.; Simal, S.; Berna, A. Simple mathematical model to predict the drying rates of potatoes. J. Agric. Food Chem. 1992, 40, 2374–2378. [Google Scholar] [CrossRef]
- Khraisheh, M.A.M.; Cooper, T.J.R.; Magee, T.R.A. Transport mechanisms of moisture during air drying processes. Food Bioprod. Process. 1997, 75, 34–40. [Google Scholar] [CrossRef]
- Bakal, S.B.; Sharma, G.P.; Sonawane, S.P.; Verma, R.C. Kinetics of potato drying using fluidized bed dryer. J. Food Sci. Technol. 2012, 49, 608–613. [Google Scholar] [CrossRef] [PubMed]
- Surendhar, A.; Sivasubramanian, V.; Vidhyeswari, D.; Deepanraj, B. Energy and exergy analysis, drying kinetics, modeling and quality parameters of microwave-dried turmeric slices. J. Therm. Anal. Calorim. 2019, 136, 185–197. [Google Scholar] [CrossRef]
- Air—Density, Specific Weight and Thermal Expansion Coefficient at Varying Temperature and Constant Pressures. Available online: https://www.engineeringtoolbox.com/air-density-specific-weight-d_600.html. (accessed on 30 March 2020).
- Motevali, A.; Minaei, S.; Khoshtaghaza, M.H.; Amirnejat, H. Comparison of energy consumption and specific energy requirements of different methods for drying mushroom slices. Energy 2011, 36, 6433–6441. [Google Scholar] [CrossRef]
- Psychrometric Chart and Air Characteristics. Available online: http://nswhvacnm.com/engineering/psychrometric-chart/ (accessed on 30 March 2020).
- Darvishi, H.; Zarein, M.; Minaei, S.; Khafajeh, H. Exergy and energy analysis, drying kinetics and mathematical modeling of white mulberry drying process. Int. J. Food Eng. 2014, 10, 269–280. [Google Scholar] [CrossRef]
- Official Methods of Analysis of the Association of Official Analytical Chemists, 16th ed.; AOAC Official Method 930.29. Protein in Dried Milk; AOAC International: Arlington, VA, USA, 1995; Volume 2.
- Official Methods of Analysis of the Association of Official Analytical Chemists, 16th ed.; AOAC Official Method 991.20. Nitrogen (Total) in Milk-Kjeldahl Method; AOAC International: Arlington, VA, USA, 1995; Volume 2.
- Stone, A.K.; Karalash, A.; Tyler, R.T.; Warkentin, T.D.; Nickerson, M.T. Functional attributes of pea protein isolates prepared using different extraction methods and cultivars. Food Res. Int. 2015, 76, 31–38. [Google Scholar] [CrossRef]
- Staffolo, M.D.; Bertola, N.; Martino, M. Influence of dietary fiber addition on sensory and rheological properties of yogurt. Int. Dairy J. 2004, 14, 263–268. [Google Scholar] [CrossRef]
- Piga, A.; Pinna, I.; Özer, K.B.; Agabbio, M.; Aksoy, U. Hot air dehydration of figs (Ficus carica L.): Drying kinetics and quality loss. Int. J. Food Sci. Technol. 2004, 39, 793–799. [Google Scholar] [CrossRef]
- Tang, Z.; Cenkowski, S.; Izydorczyk, M. Thin-layer drying of spent grains in superheated steam. J. Food Eng. 2005, 67, 457–465. [Google Scholar] [CrossRef]
- McMinn, W.A.M.; Magee, T.R.A. Principles, methods and applications of the convective drying of foodstuffs. Food Bioprod. Process. 1999, 77, 175–193. [Google Scholar] [CrossRef]
- Riva, M.; Campolongo, S.; Leva, A.A.; Maestrelli, A.; Torreggiani, D. Structure–property relationships in osmo-air-dehydrated apricot cubes. Food Res. Int. 2005, 38, 533–542. [Google Scholar] [CrossRef]
- Mundada, M.; Hathan, B.S.; Maske, S. Convective dehydration kinetics of osmotically pretreated pomegranate arils. Biosyst. Eng. 2010, 107, 307–316. [Google Scholar] [CrossRef]
- Goyal, R.K.; Kingsly, A.R.; Manikantan, M.R.; Ilyas, S.M. Thin-layer drying kinetics of raw mango slices. Biosyst. Eng. 2006, 95, 43–49. [Google Scholar] [CrossRef]
- Demir, V.; Gunhan, T.; Yagcioglu, A.K.; Degirmencioglu, A. Mathematical modelling and the determination of some quality parameters of air-dried bay leaves. Biosyst. Eng. 2004, 88, 325–335. [Google Scholar] [CrossRef]
- Leiker, M.; Adamska, M.A. Energy efficiency and drying rates during vacuum microwave drying of wood. Holz Roh-und Werkst. 2004, 62, 203–208. [Google Scholar] [CrossRef]
- Haghi, A.K. Thermal analysis of drying process. J. Therm. Anal. Calorim. 2003, 74, 827–842. [Google Scholar] [CrossRef]
- Sharma, G.P.; Prasad, S. Specific energy consumption in microwave drying of garlic cloves. Energy 2006, 31, 1921–1926. [Google Scholar] [CrossRef]
- Kaldy, M.S.; Hanna, M.R.; Smoliak, S. Influence of drying methods on protein content and amino acid composition of three forage legumes. Can. J. Plant Sci. 1979, 59, 707–712. [Google Scholar] [CrossRef]
- Amza, T.; Amadou, I.; Kamara, M.T.; Zhu, K.X.; Zhou, H.M. Nutritional and functional characteristics of gingerbread plum (Neocarya macrophylla): An underutilized oilseed. Grasas Aceites 2011, 62, 290–298. [Google Scholar]
- Pratap Singh, A.; Singh, A.; Ramaswamy, H.S. Heat transfer phenomena during thermal processing of liquid particulate mixtures–A Review. Crit. Rev. Food Sci. Nutr. 2017, 57, 1350–1364. [Google Scholar] [CrossRef] [PubMed]
- Sharma, P.; Gujral, H.S. Cookie making behavior of wheat–barley flour blends and effects on antioxidant properties. LWT-Food Sci. Technol. 2014, 55, 301–307. [Google Scholar] [CrossRef]
- Öztürk, S.; Özboy, Ö.; Cavidoğlu, İ.; Köksel, H. Effects of brewer’s spent grain on the quality and dietary fibre content of cookies. J. Inst. Brew. 2002, 108, 23–27. [Google Scholar] [CrossRef]
- Wang, Y.; Li, D.; Wang, L.J.; Li, S.J.; Adhikari, B. Effects of drying methods on the functional properties of flaxseed gum powders. Carbohydr. Polym. 2010, 81, 128–133. [Google Scholar] [CrossRef]


© 2020 by the authors. Licensee MDPI, Basel, Switzerland. This article is an open access article distributed under the terms and conditions of the Creative Commons Attribution (CC BY) license (http://creativecommons.org/licenses/by/4.0/).