A DSGE-VAR Analysis for Tourism Development and Sustainable Economic Growth


Abstract
1. Introduction
2. Literature Review
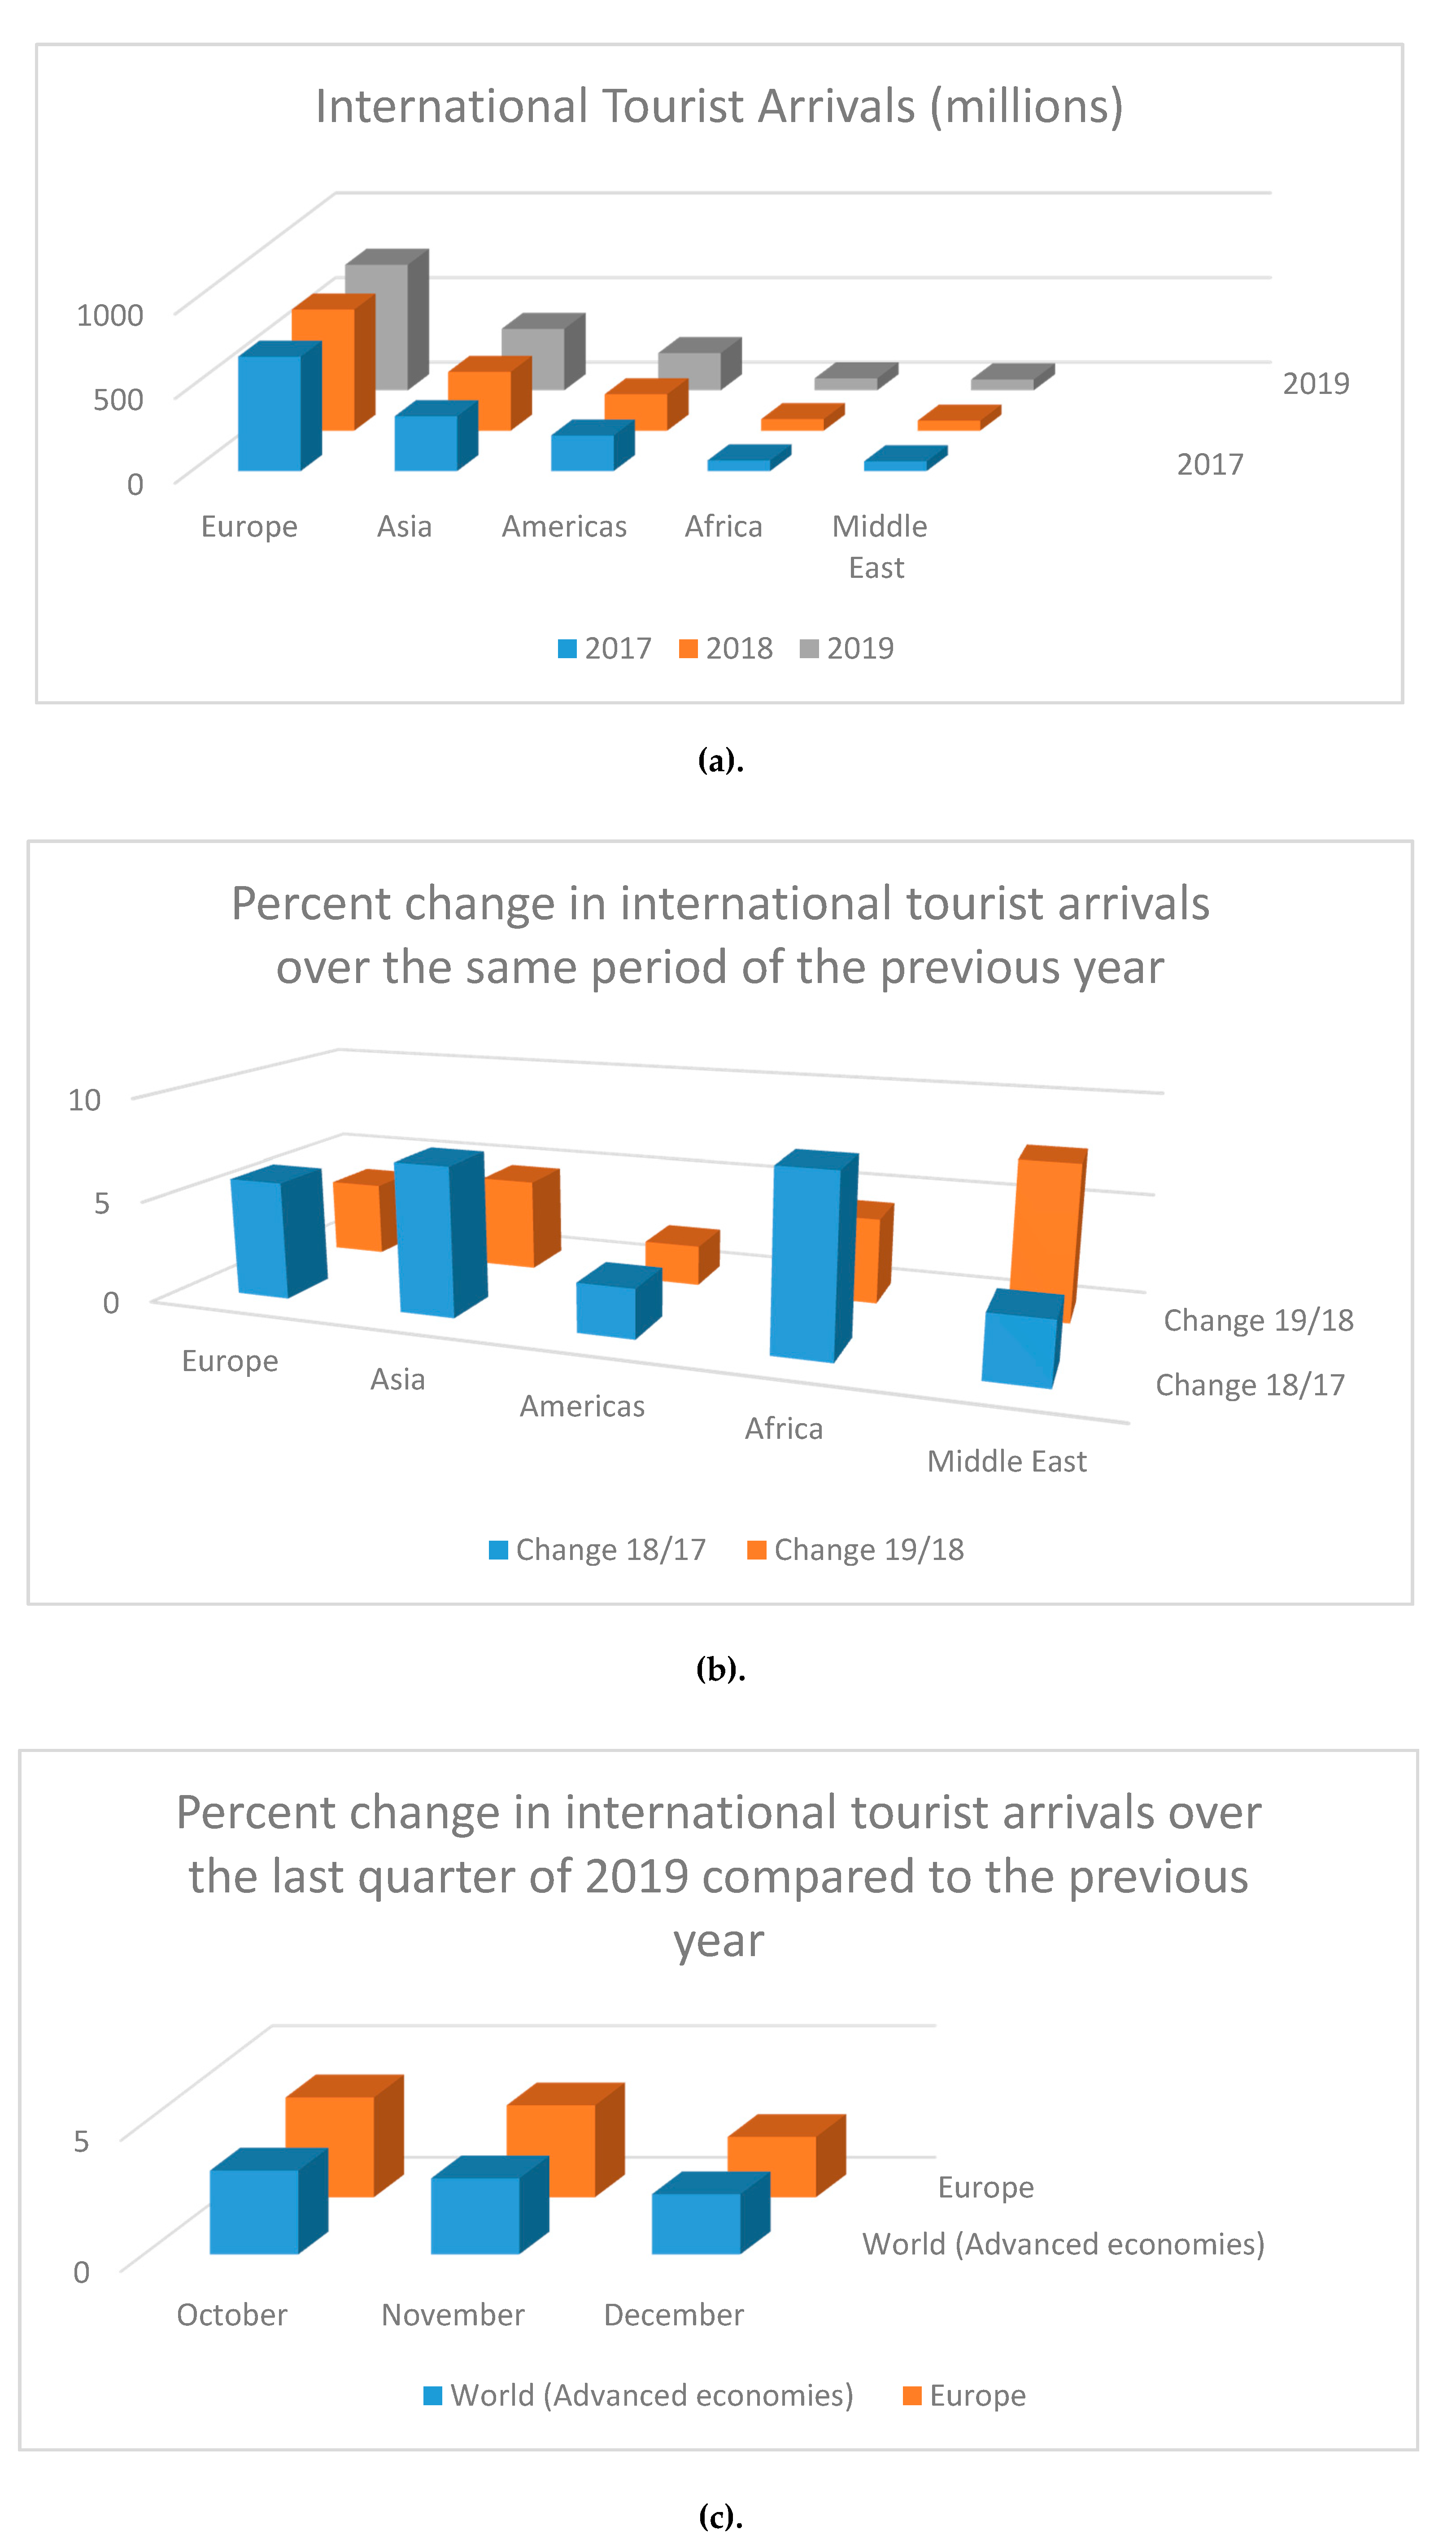
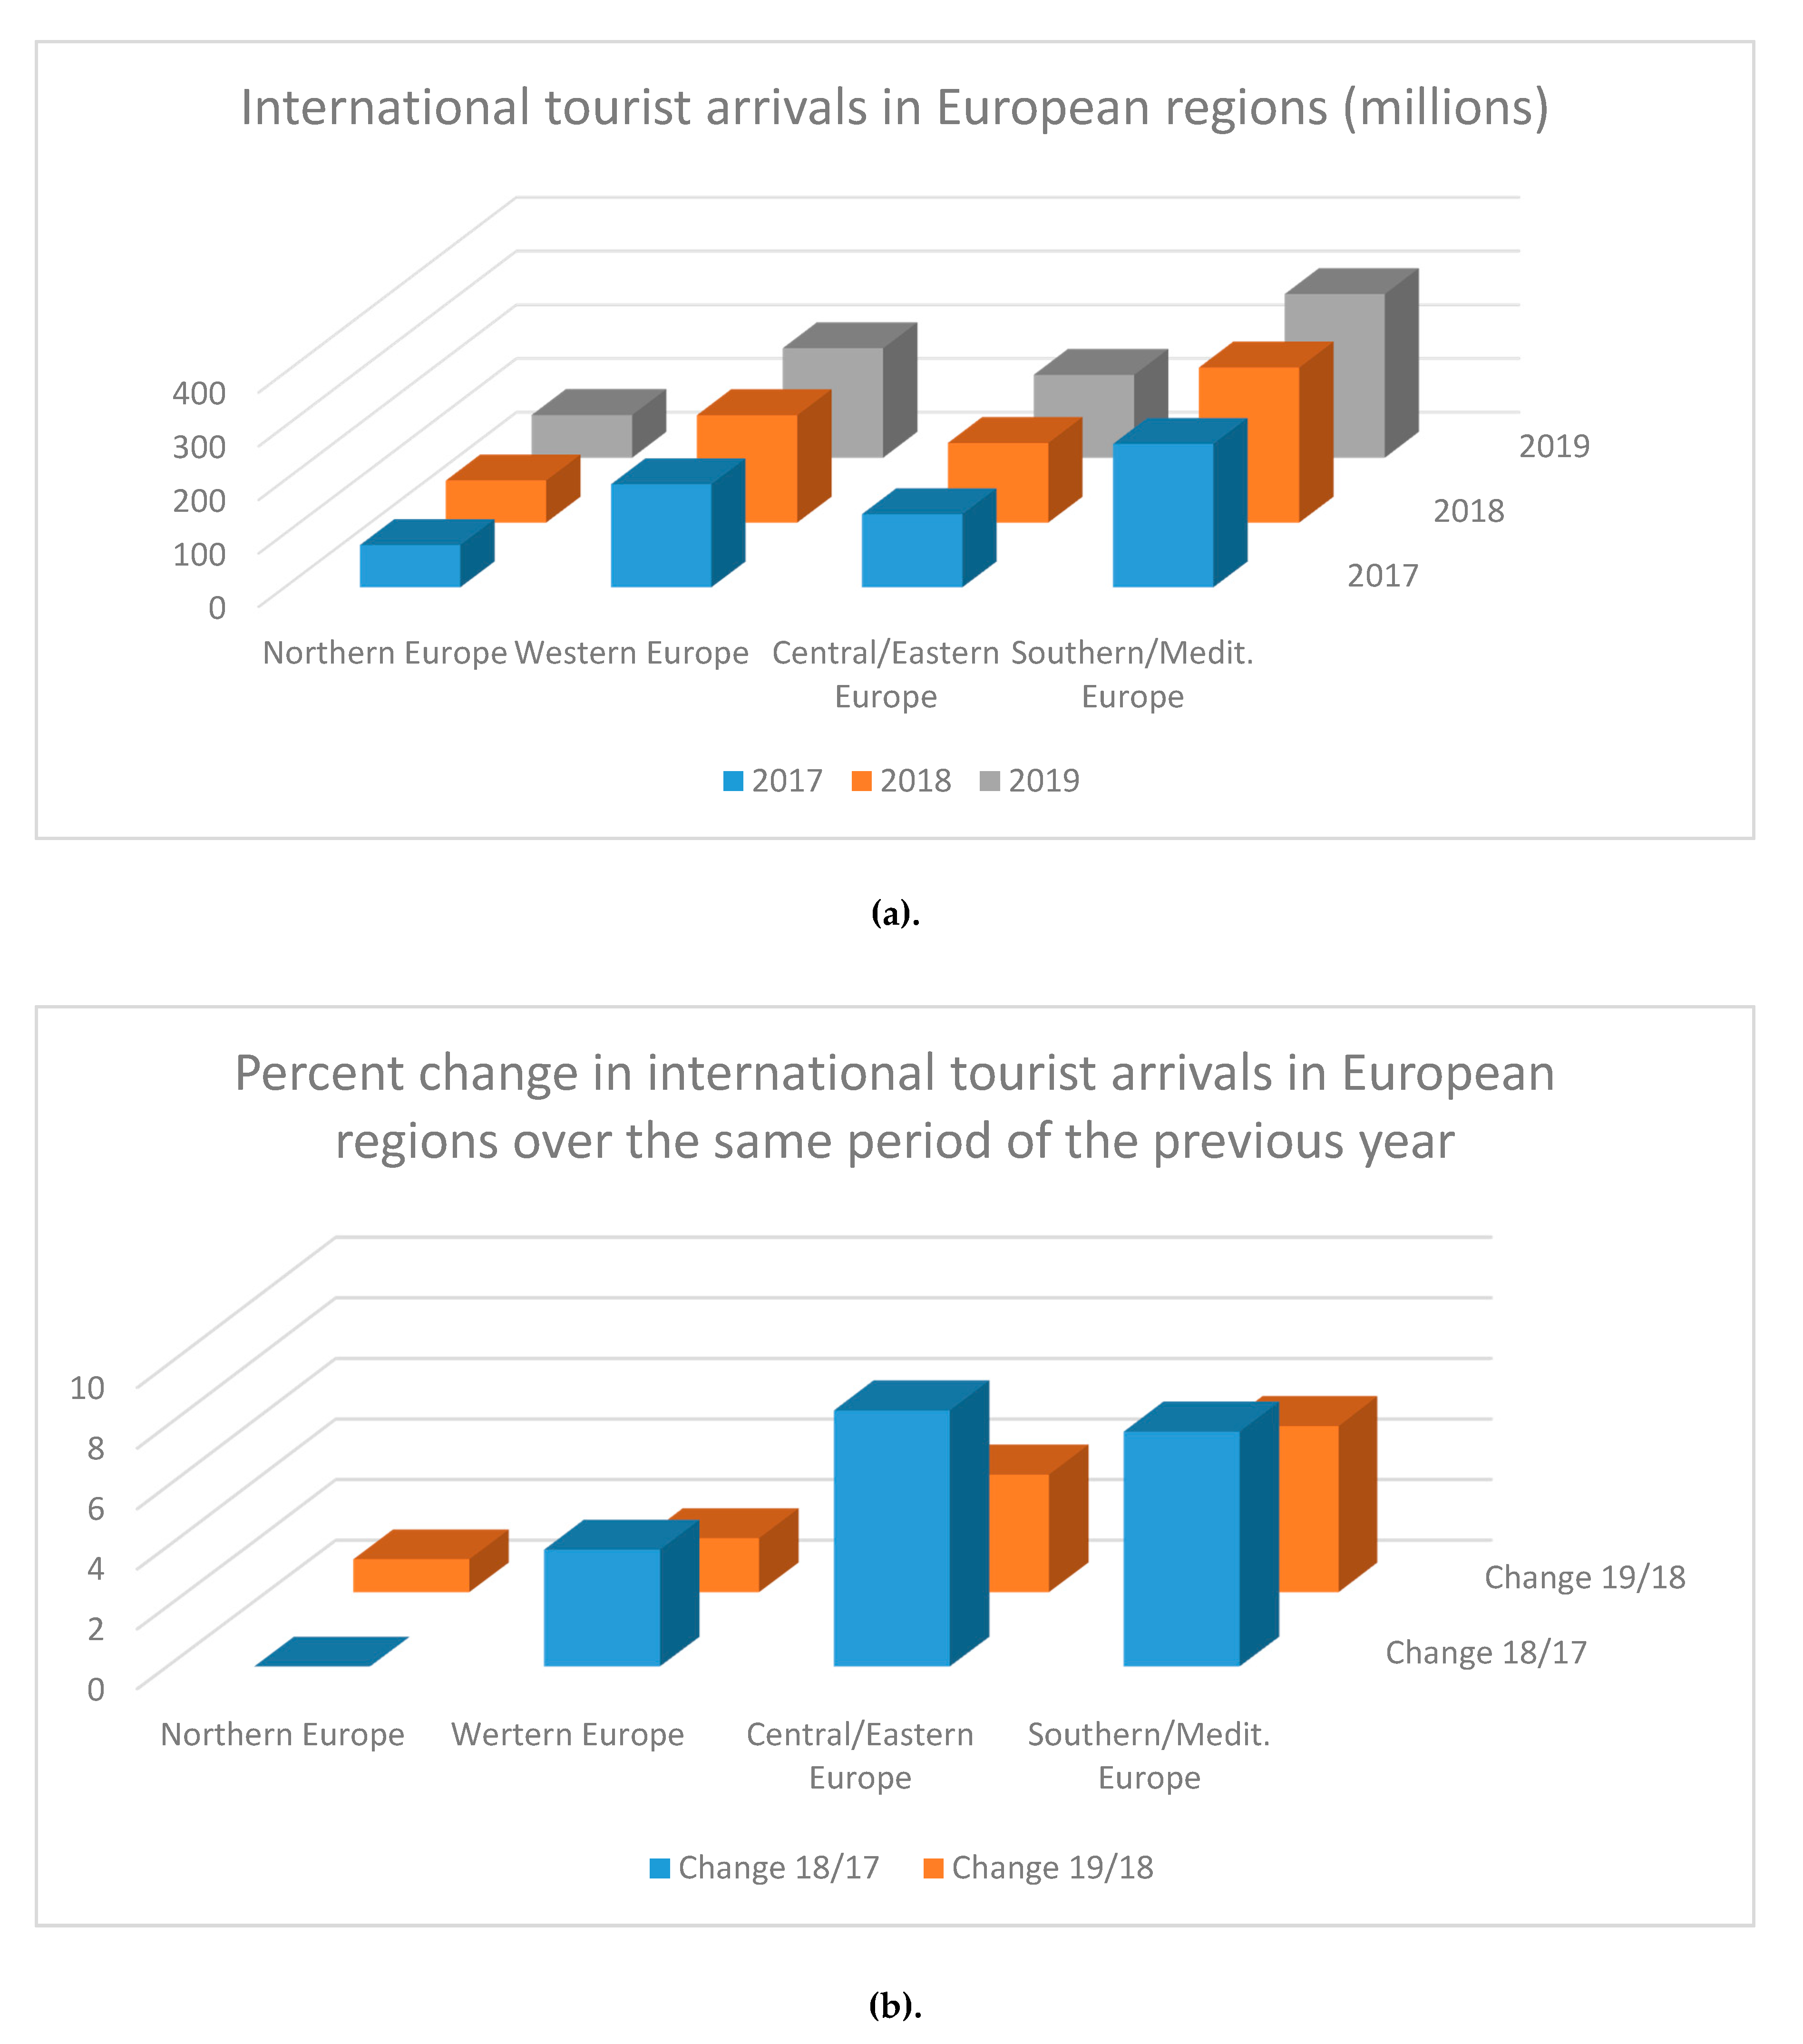
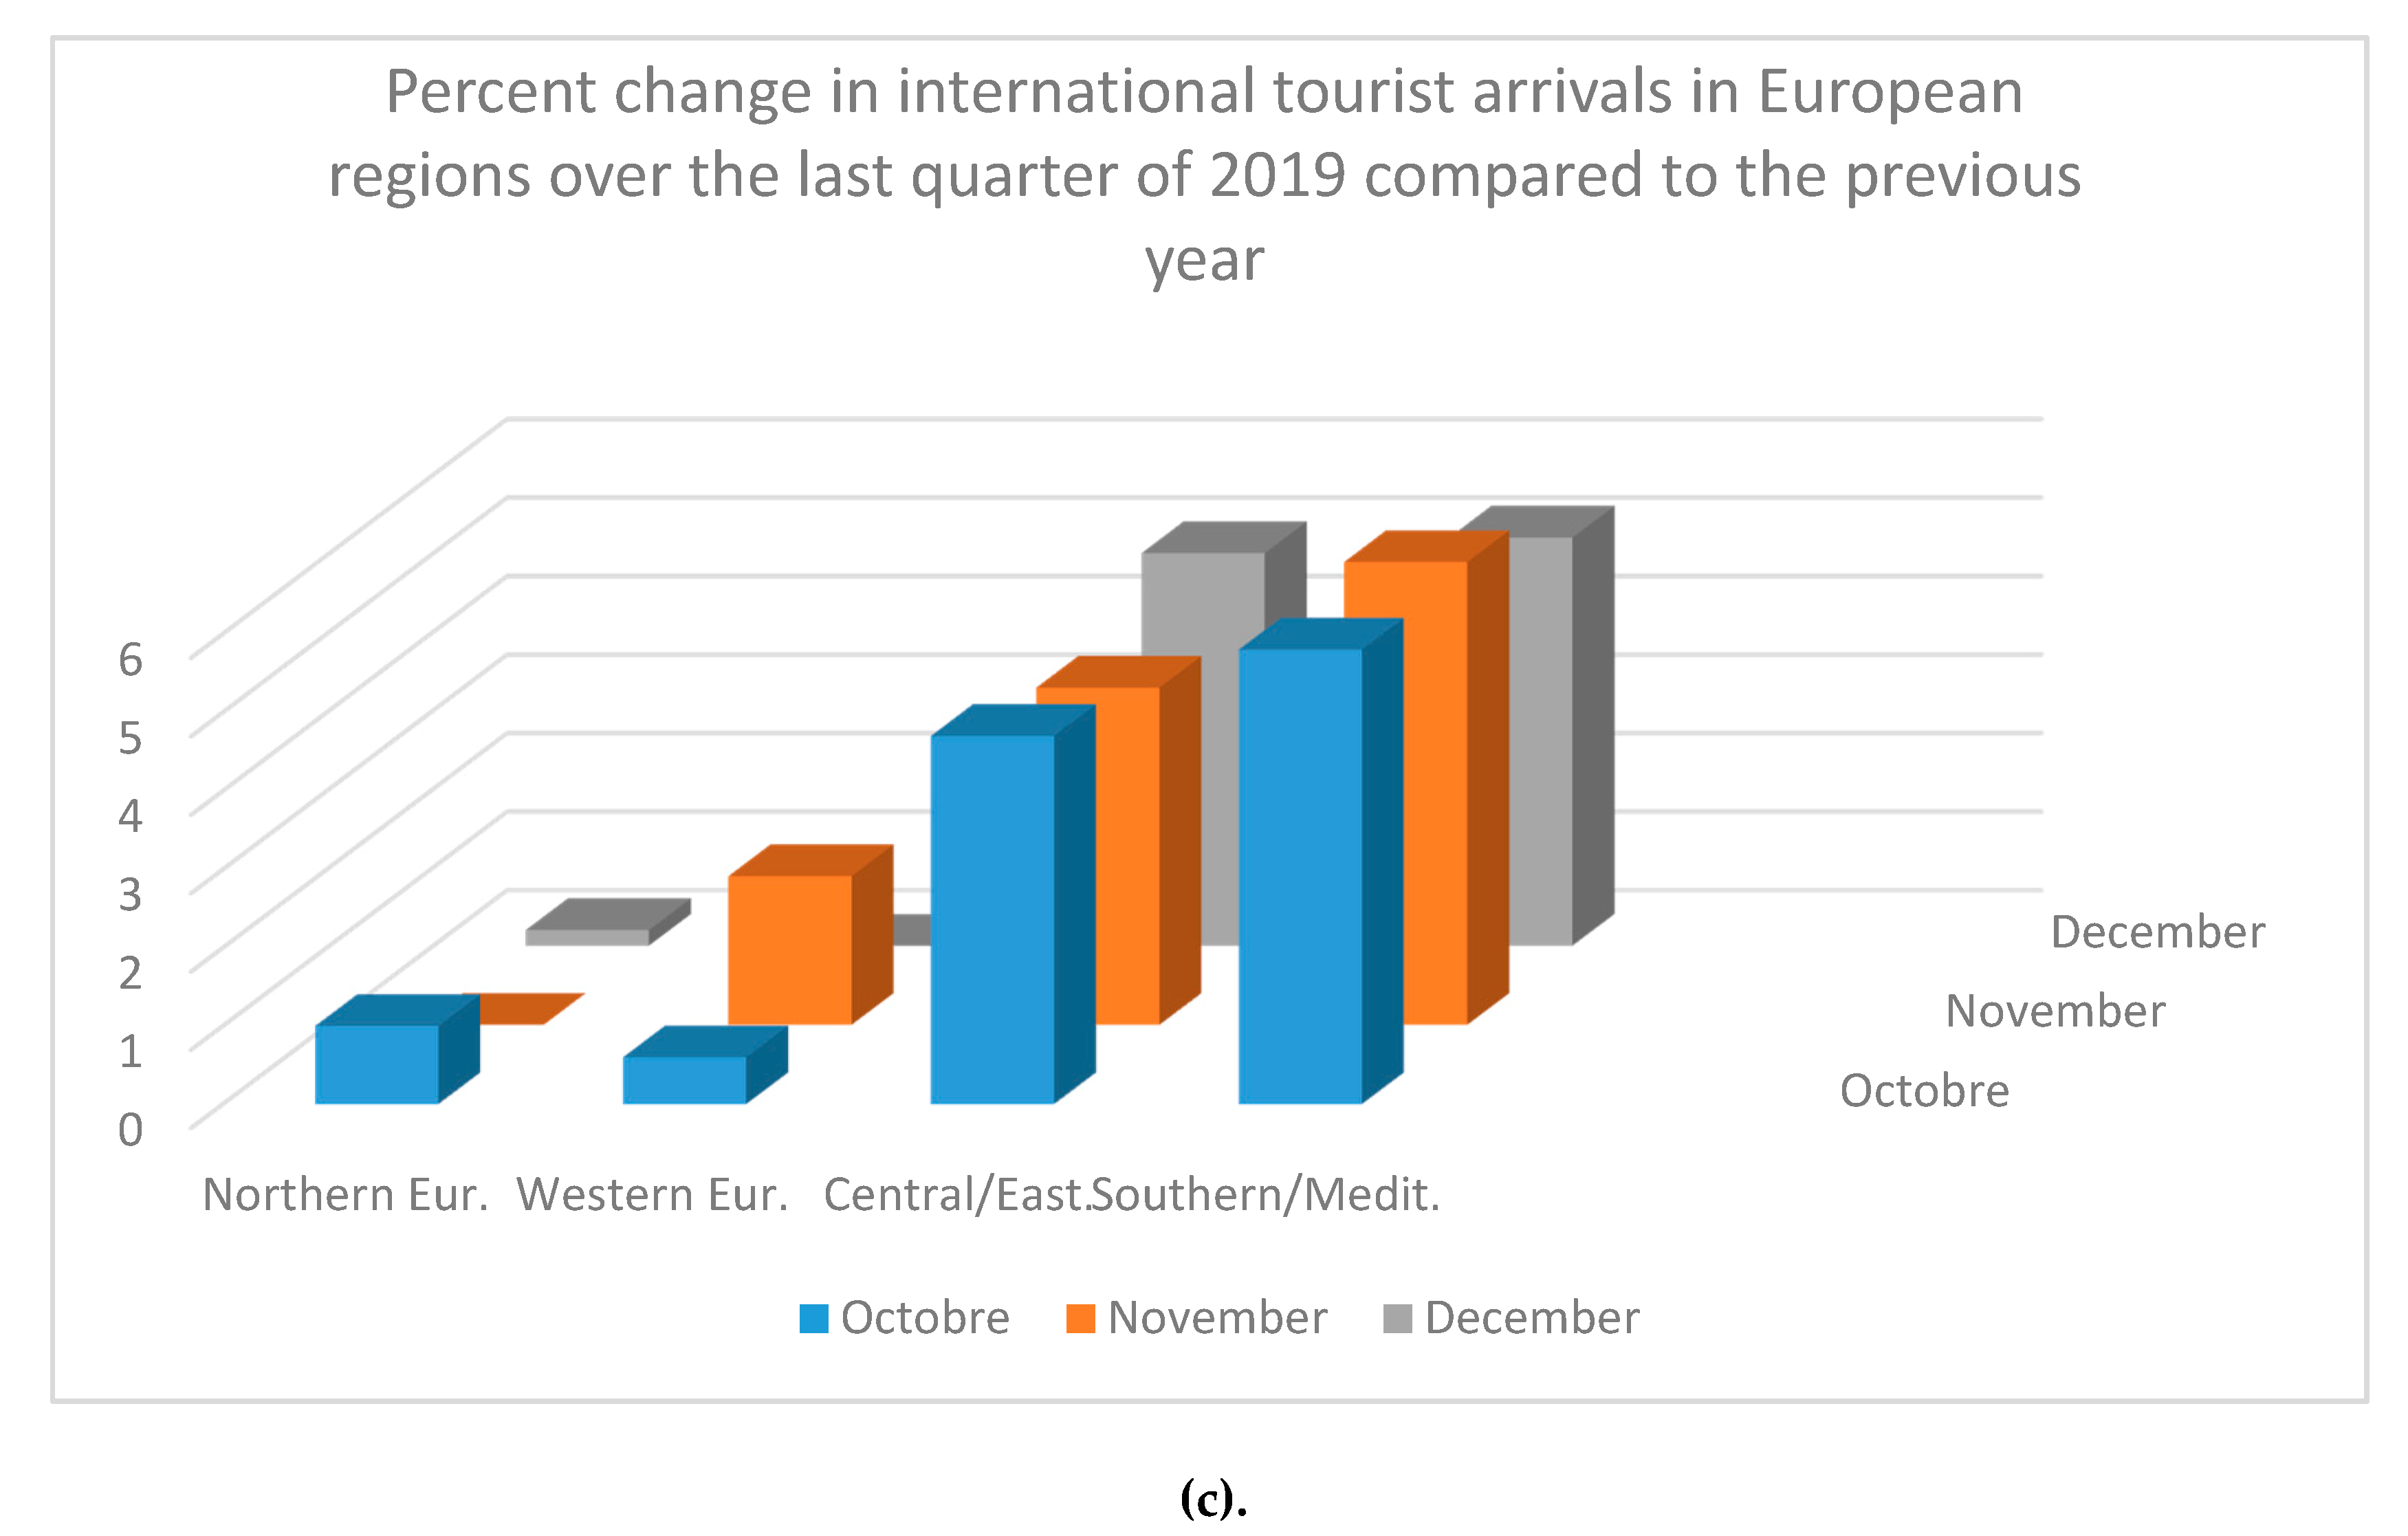
2.1. Background of Tourism Development
2.2. Tourism and Economic Growth.
3. Method
4. Model Estimation
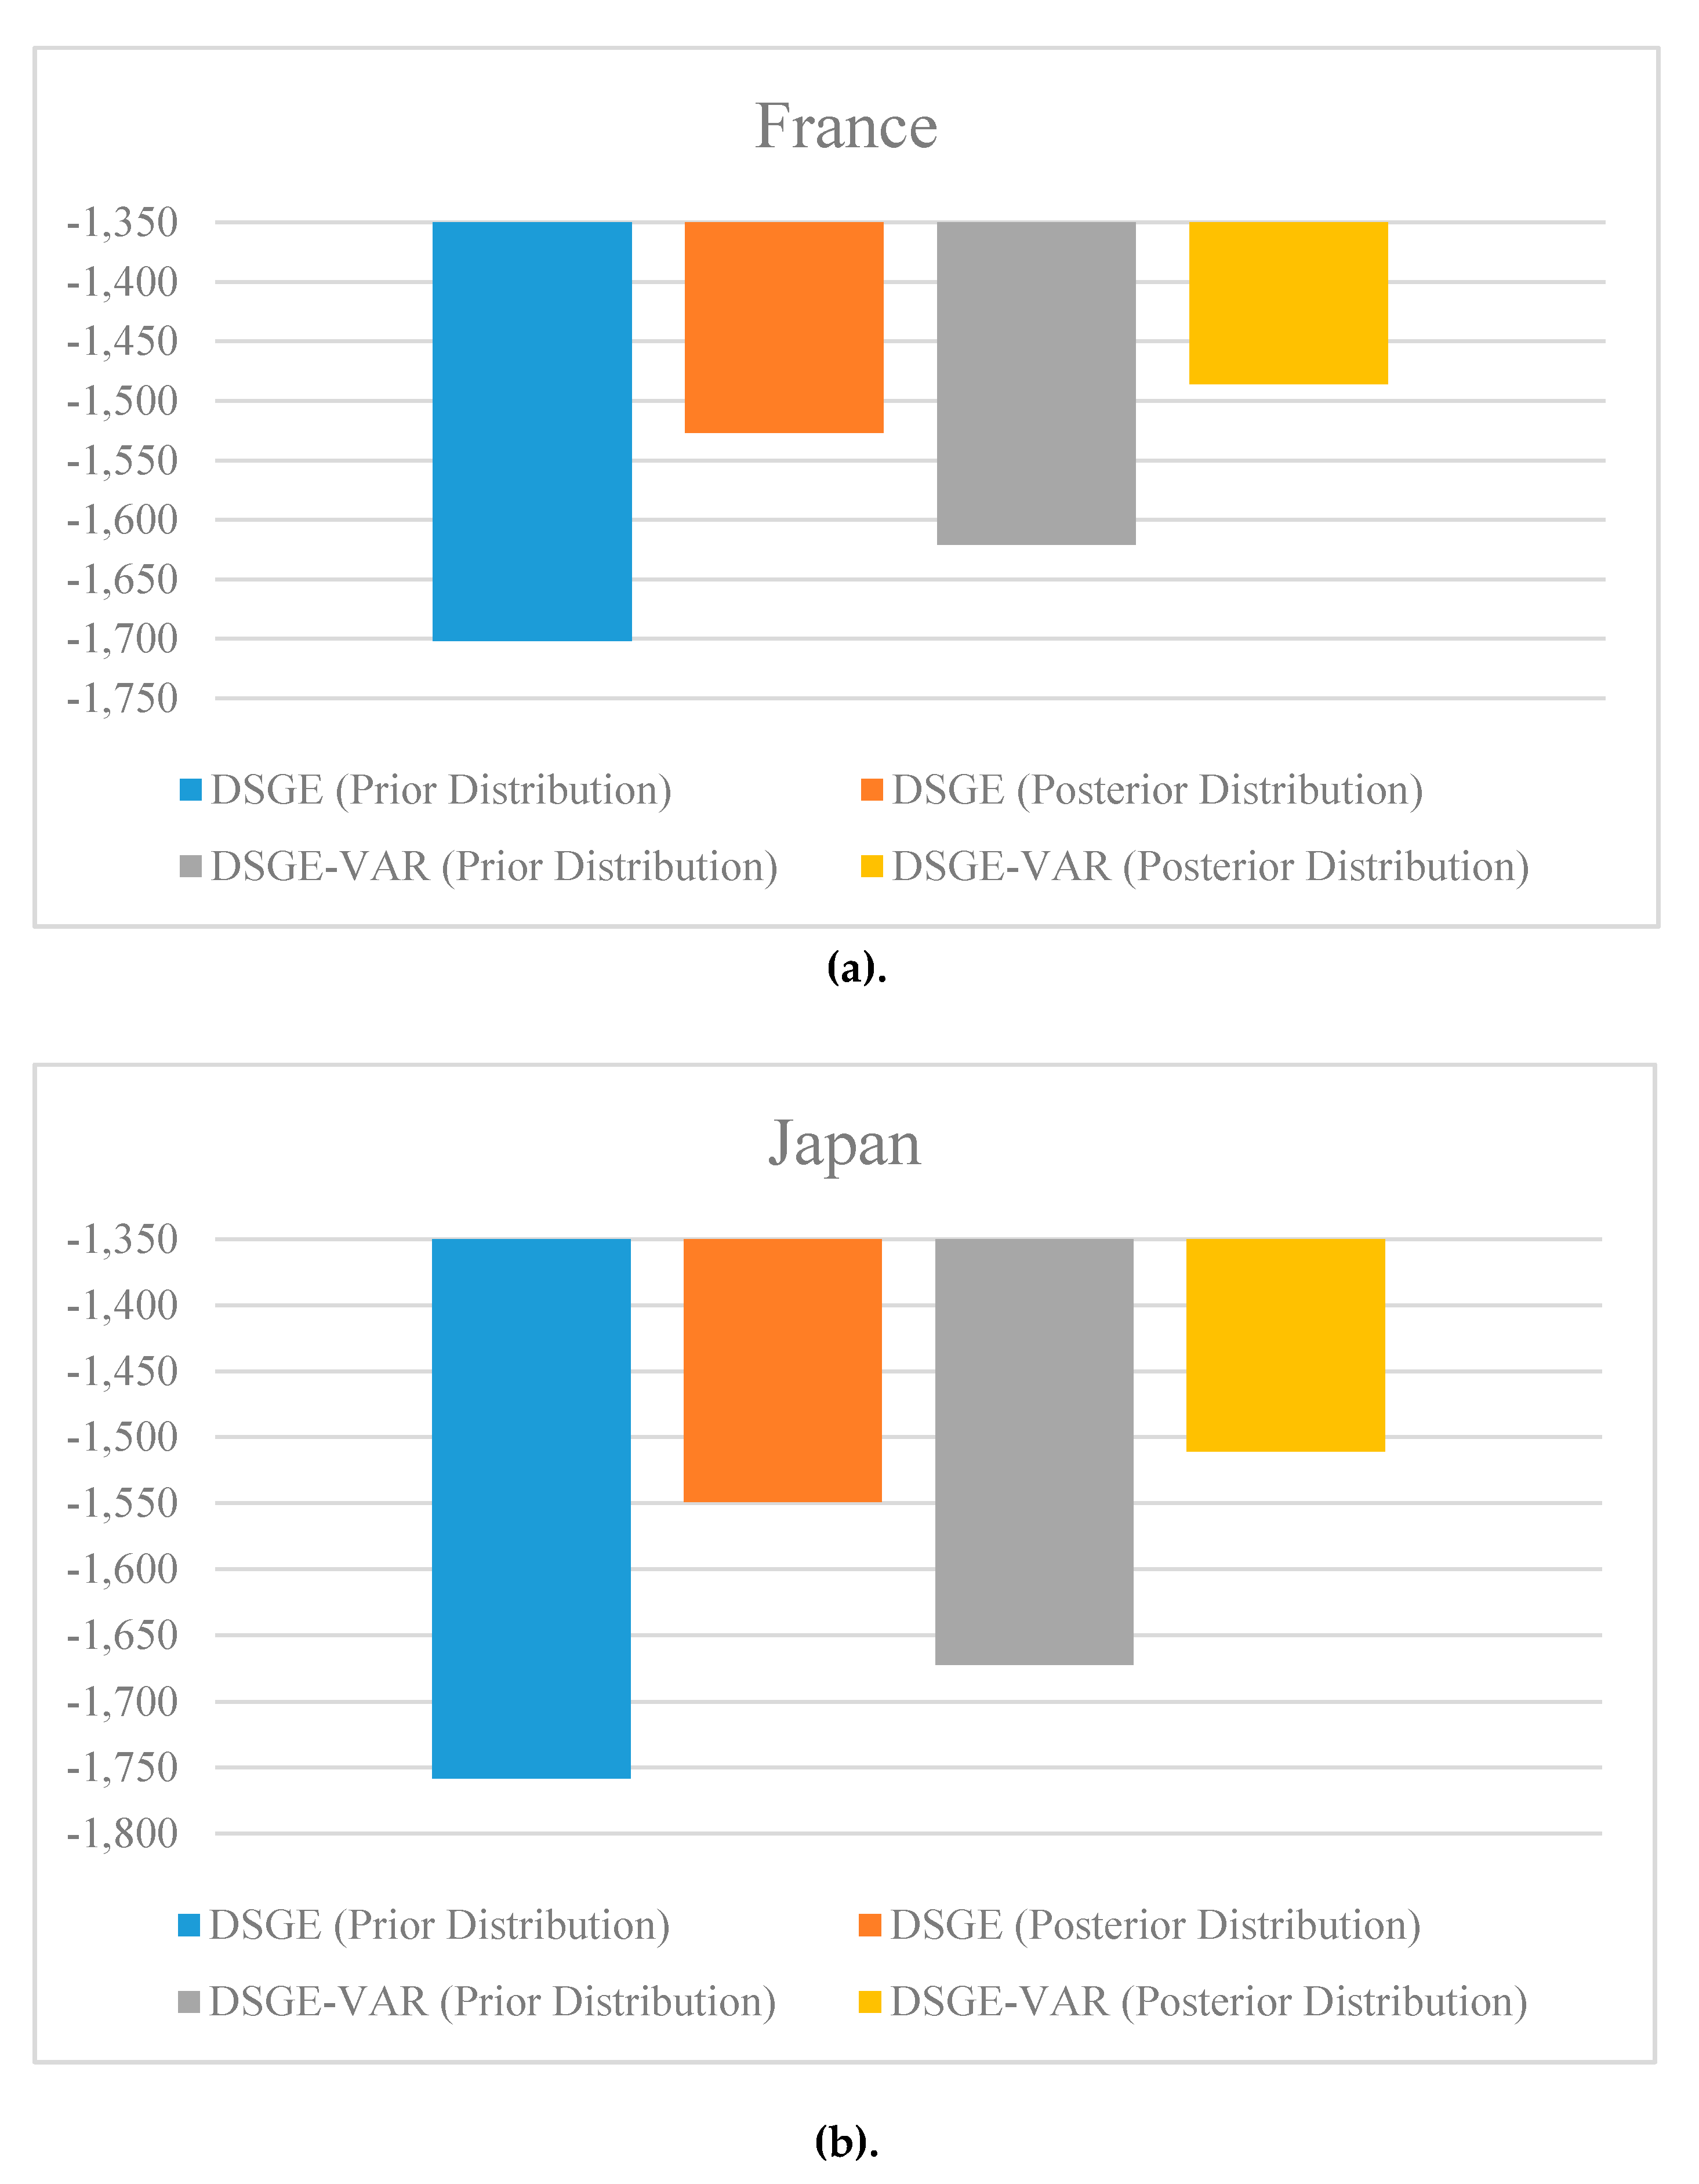
4.1. Empirical Results
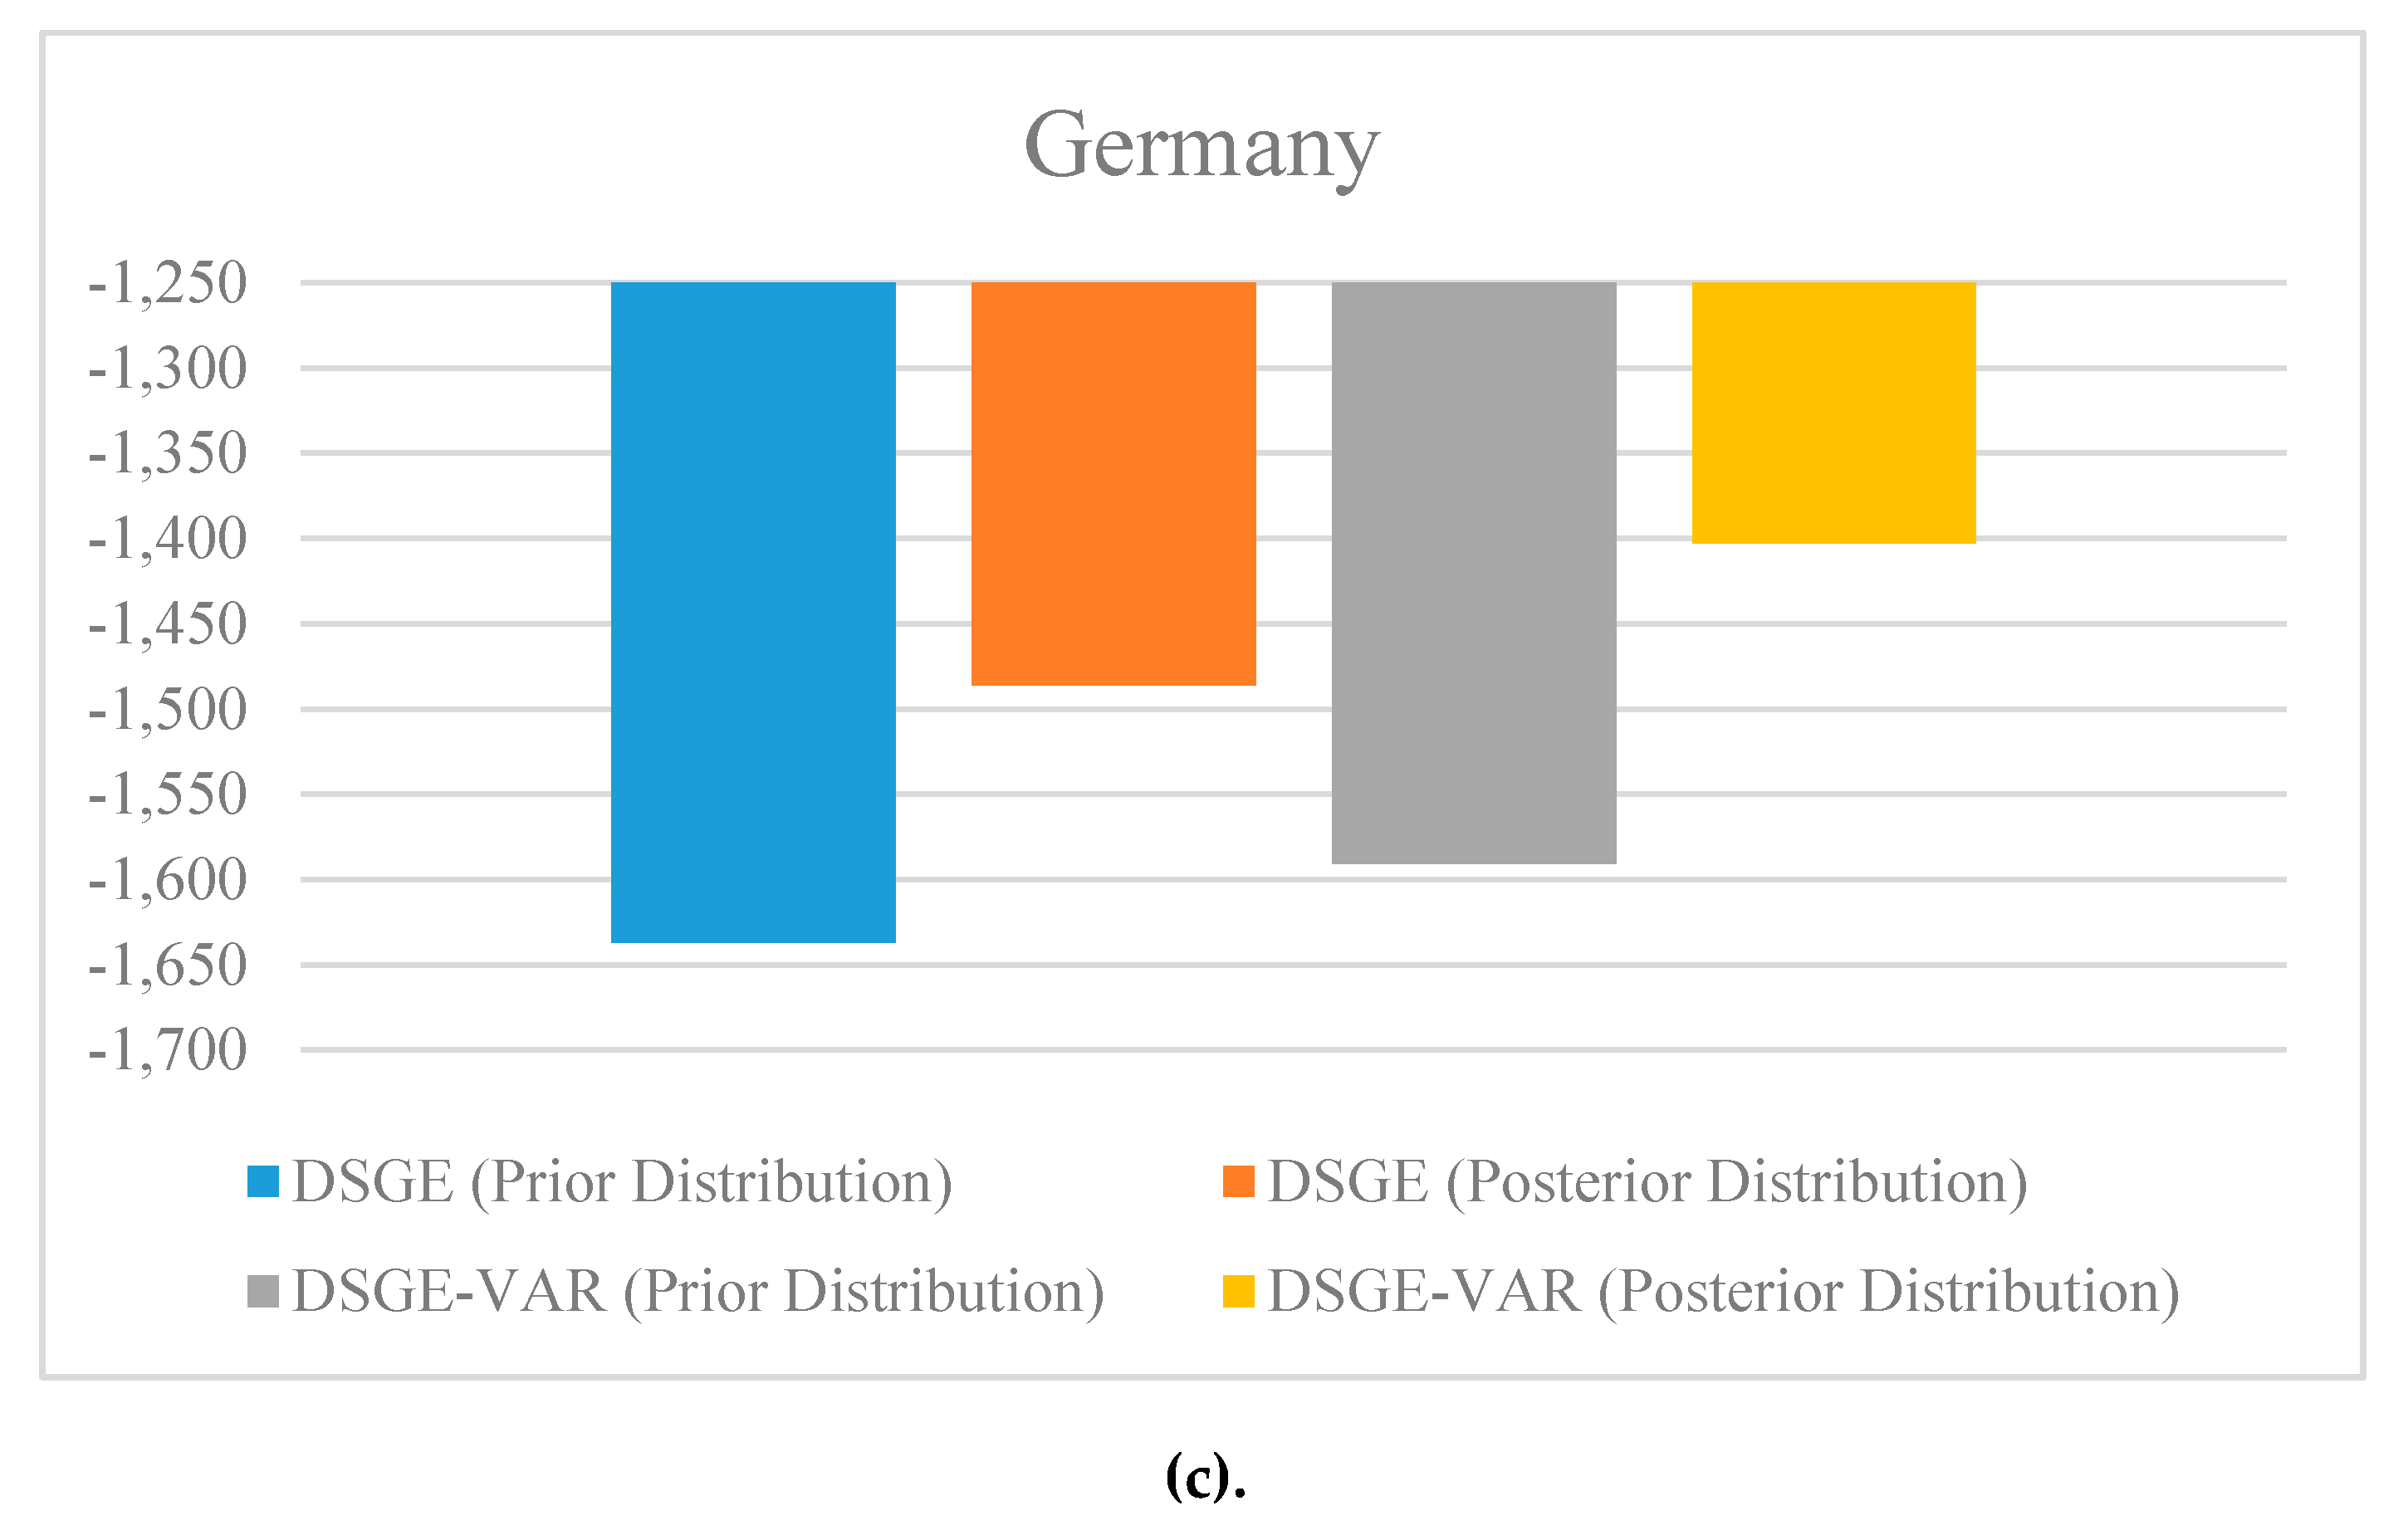
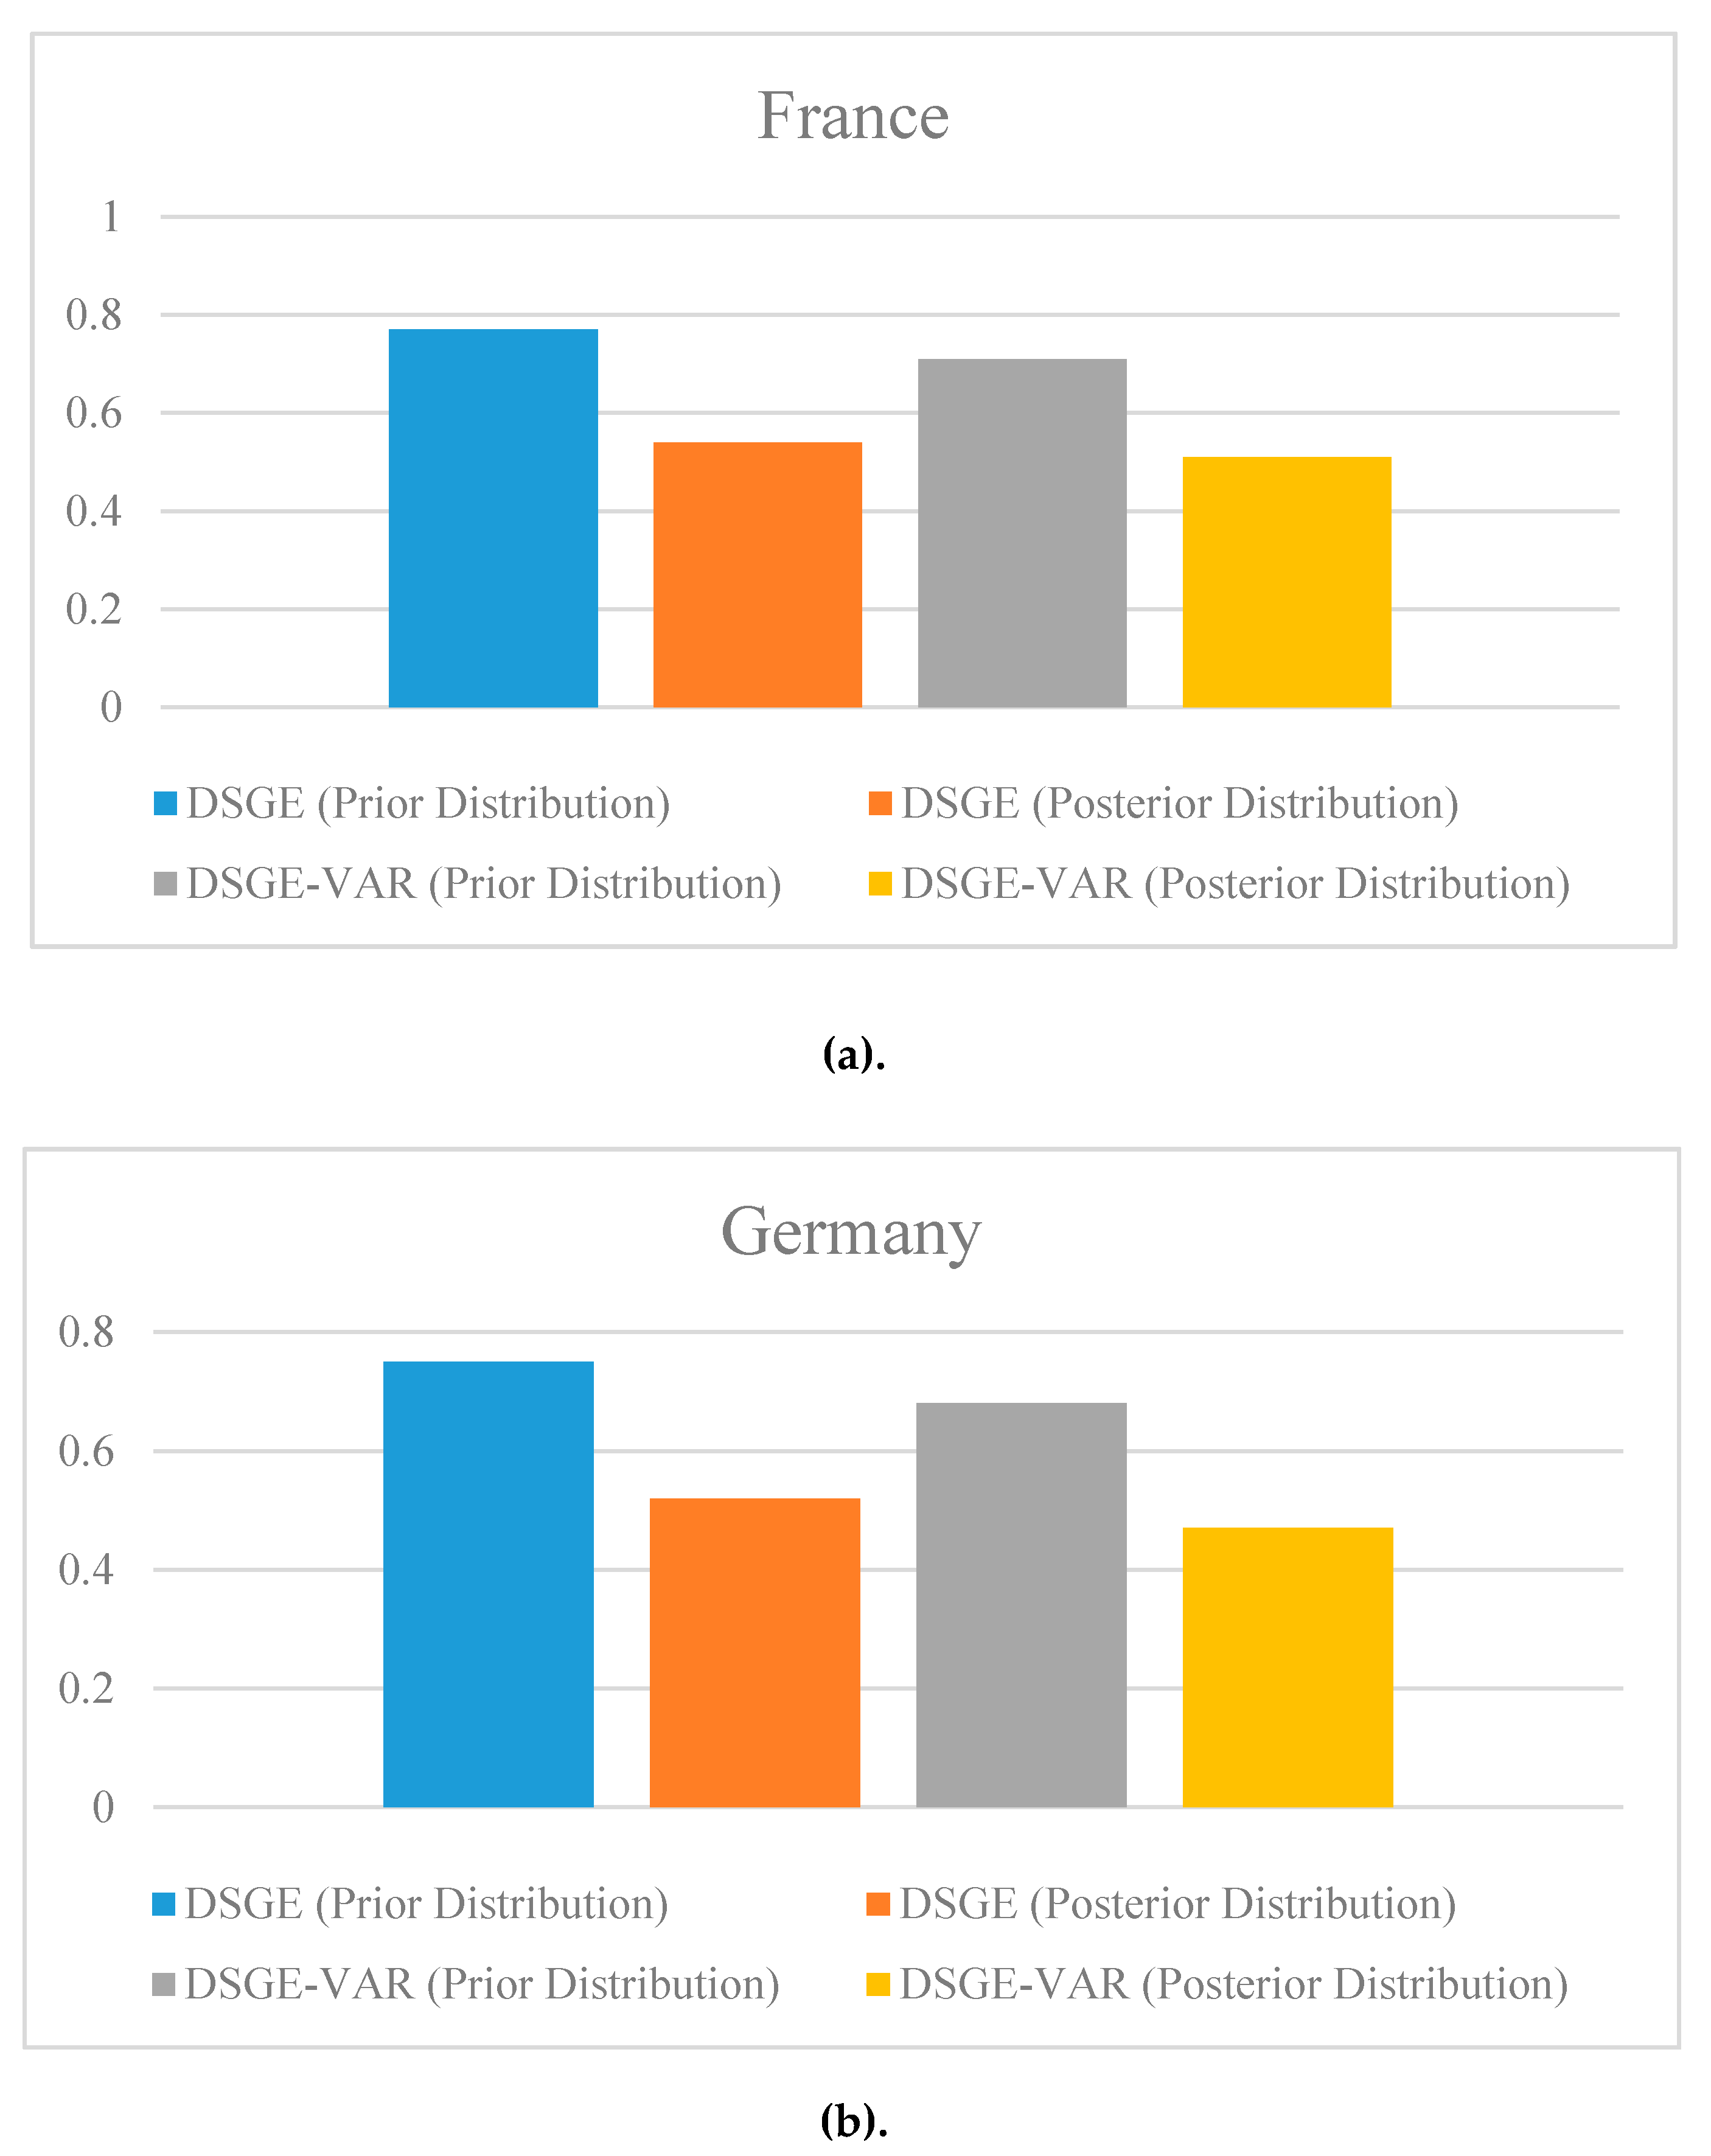
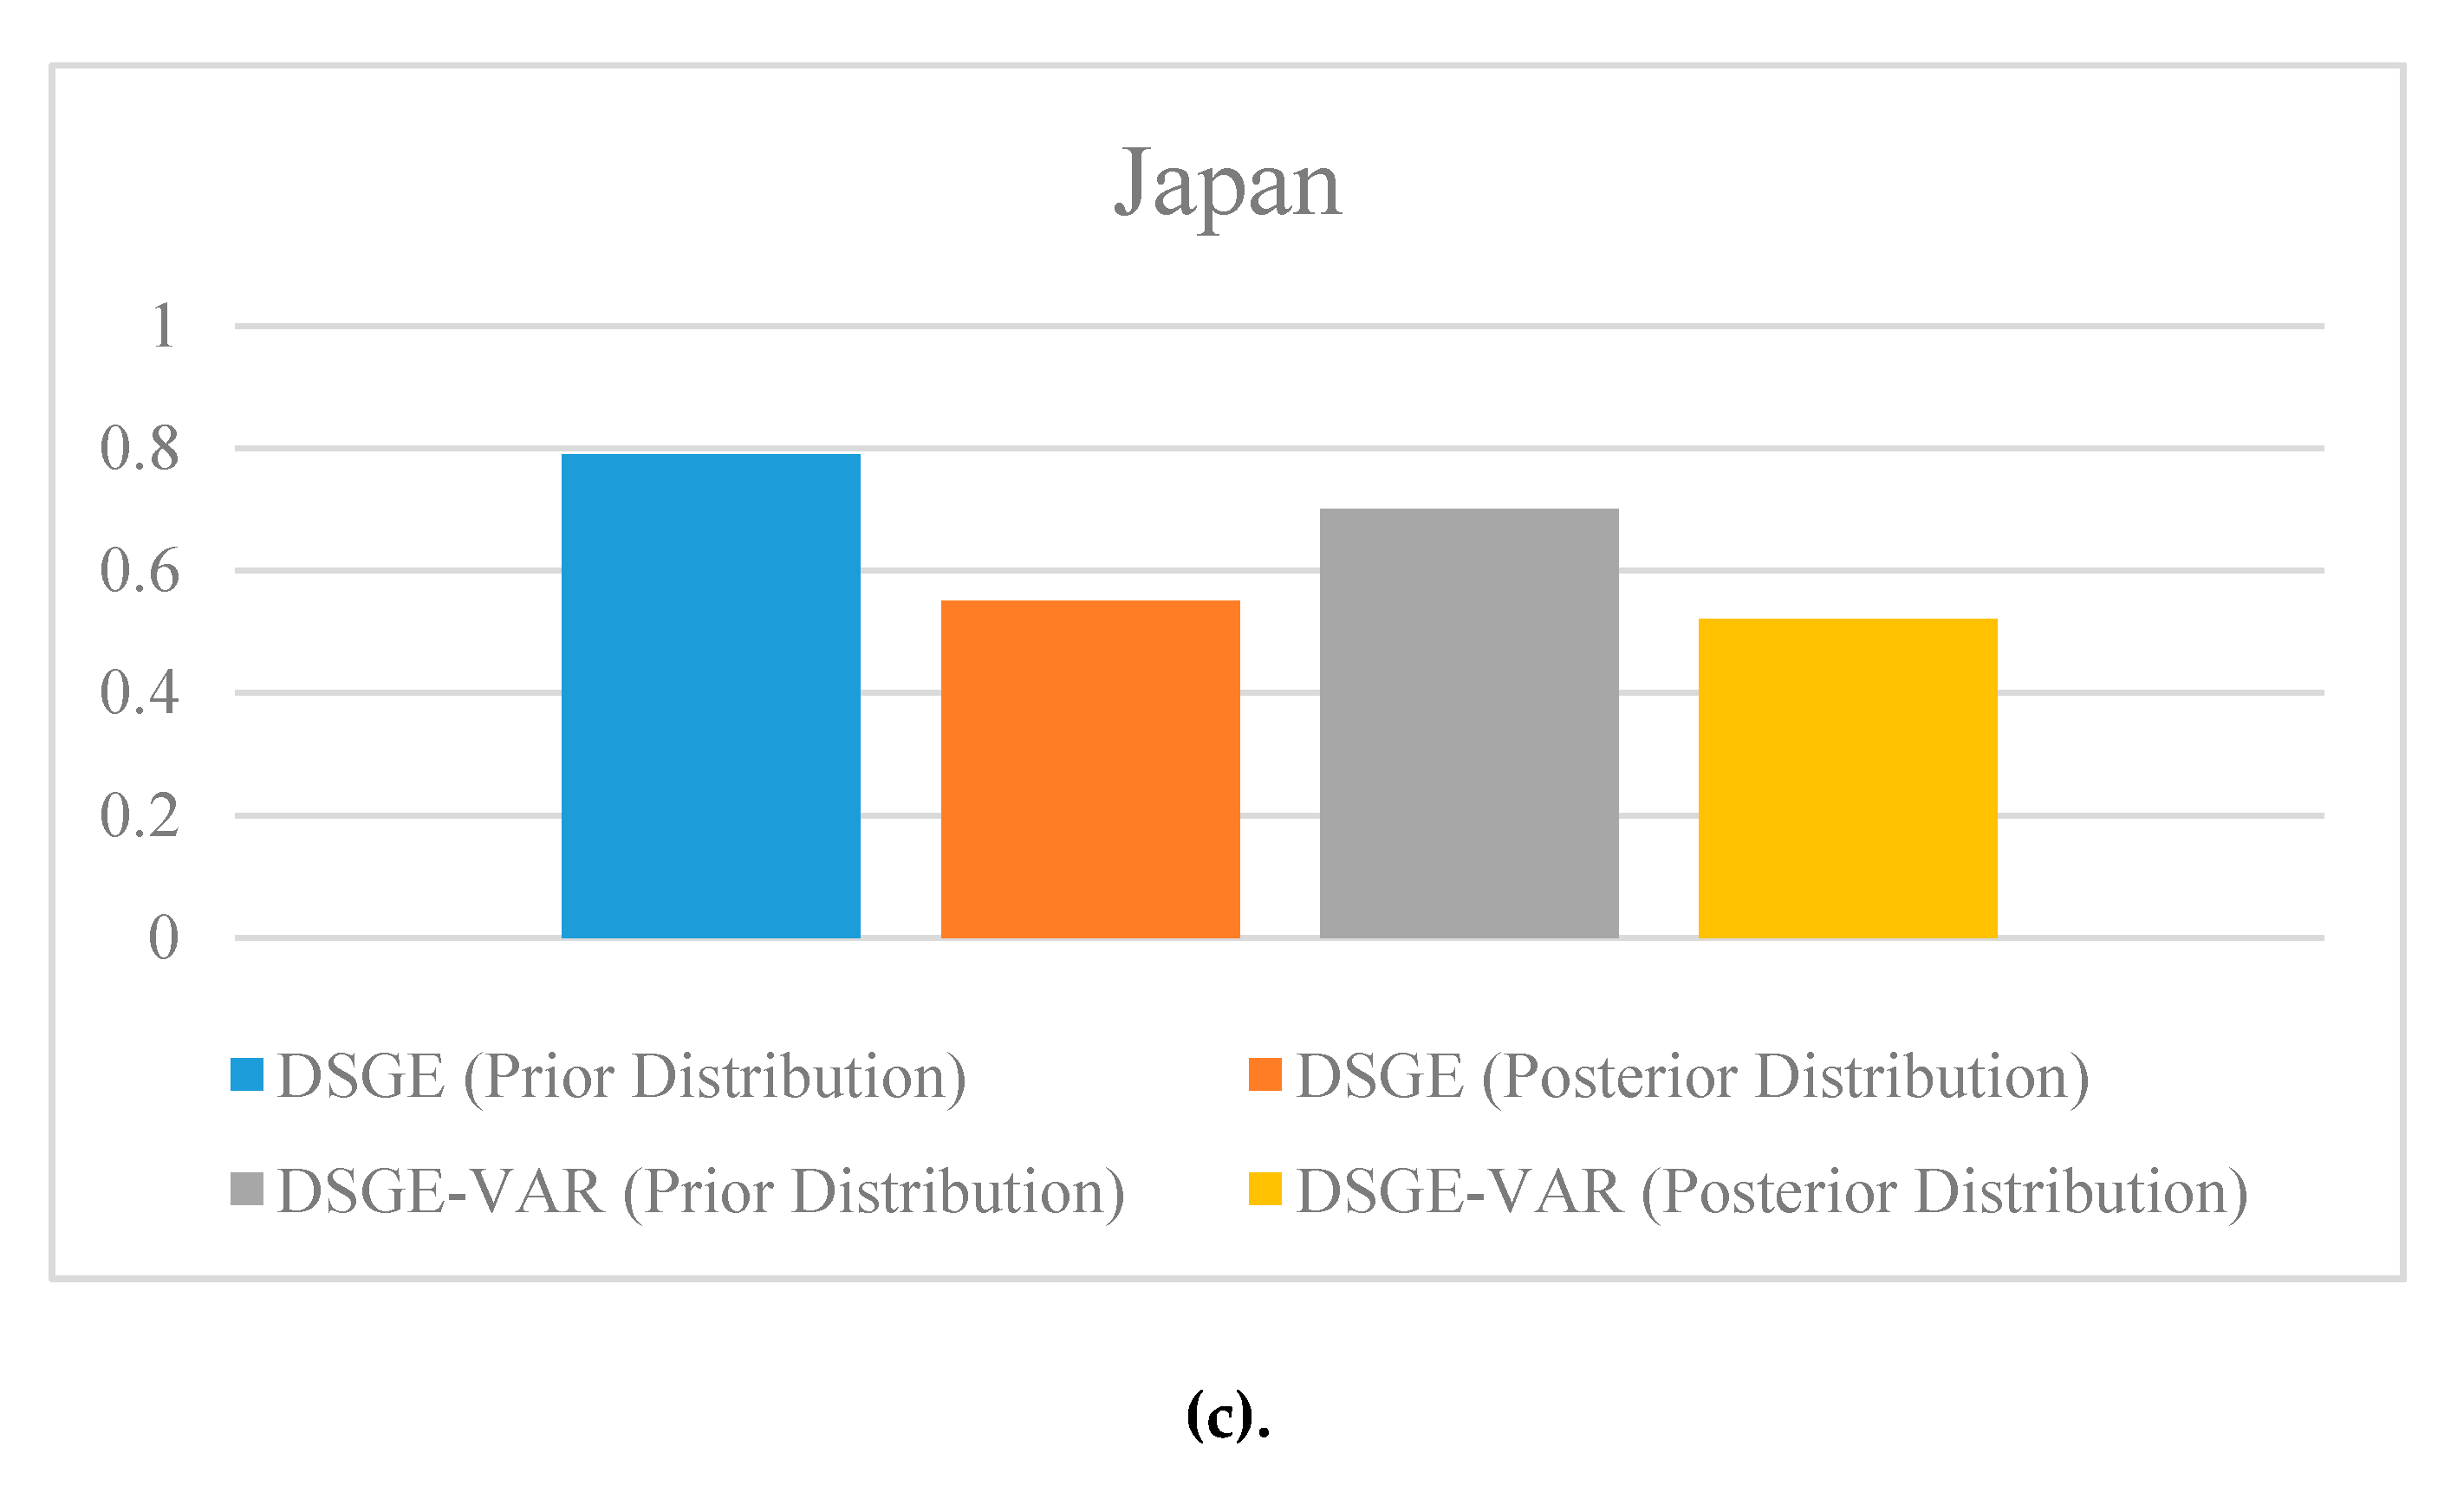
4.2. Post-estimations
5. Conclusion
Author Contributions
Funding
Acknowledgments
Conflicts of Interest
References
- UNWTO. World Tourism Barometer. In Proceedings of the Conference on Tourism and Accessibility, Madrid, Spain, 16–20 June 2019. [Google Scholar]
- World Economic Forum. The Travel & Tourism Competitiveness. In Travel and Tourism at a Tipping Point; World Economic Forum: Geneva, Switzerland, 2019. [Google Scholar]
- Notarstefano, C. European sustainable tourism: Context, concepts and guidelines for action. Int. J. Sustain. Econ. 2008, 1, 44. [Google Scholar] [CrossRef]
- Kruja, A. The Impact of Tourism Sector Development in the Albanian Economy. Econ. Seria Manag. 2012, 15, 204–218. [Google Scholar]
- Skerritt, D.; Huybers, T.; Lapatinas, A. The effect of the Internet on economic sophistication: An empirical analysis. Econ. Lett. 2019, 174, 35–38. [Google Scholar]
- Chatziantoniou, I.; Filis, G.; Eeckels, B.; Apostolakis, A. Oil prices, tourism income and economic growth: A structural VAR approach for European Mediterranean countries. Tour. Manag. 2013, 36, 331–341. [Google Scholar] [CrossRef]
- Van Der Marel, E. Economic effects of reform in professional services. Eur. Parliam. Int. Mark. Consum. Prot. 2017.
- Kumar, N.; Kumar, R.R.; Kumar, R.; Stauvermann, P.J. Is the tourism—Growth relationship asymmetric in the Cook Islands? Evidence from NARDL cointegration and causality tests. Tour. Econ 2019, 1–24. [Google Scholar] [CrossRef]
- Frechtling, D.C. Exploring the Full Economic Impact of Tourism for Policy Making: Extending the Use of the Tourism Satellite Account through Macroeconomic Analysis Tools. World Tour. Organ. 2011, 21. [Google Scholar]
- Dwyer, L.; Forsyth, P.; Spurr, R. Contrasting the Uses of TSAs and CGE Models: Measuring Tourism Yield and Productivity. Tour. Econ. 2007, 13, 537–551. [Google Scholar] [CrossRef]
- Song, H.; Dwyer, L.; Li, G.; Cao, Z. Tourism economics research: A review and assessment. Ann. Tour. Res. 2012, 39, 1653–1682. [Google Scholar] [CrossRef]
- Zhang, H.; Yang, Y. Prescribing for the tourism-induced Dutch disease: A DSGE analysis of subsidy policies. Tour. Econ. 2019, 25, 942–963. [Google Scholar] [CrossRef]
- Liu, A.; Song, H.; Blake, A. Modelling productivity shocks and economic growth using the Bayesian dynamic stochastic general equilibrium approach. Int. J. Contemp. Hosp. Manag. 2018, 30, 3229–3249. [Google Scholar] [CrossRef]
- Liu, A.; Wu, D.C. Tourism productivity and economic growth. Ann. Tour. Res. 2019, 76, 253–265. [Google Scholar] [CrossRef]
- Nizar, M.H. Pengaruh Pariwisata Terhadap Pertumbuhan Ekonomi Di Indonesia Tourism Effect on Economic Growth In Indonesia; University Library of Munich: Munich, Germany, 2011. [Google Scholar]
- Sugiyarto, G.; Blake, A.; Sinclair, M.T. Tourism and globalization: Economic Impact in Indonesia. Ann. Tour. Res. 2003, 30, 683–701. [Google Scholar] [CrossRef]
- Chingarande, A.; Saayman, A. Critical success factors for tourism-led growth. Int. J. Tour. Res. 2018, 20, 800–818. [Google Scholar] [CrossRef]
- Nyasha, S.; Odhiambo, N.M. Financial development and economic growth nexus: A rejoinder to Tsionas. Econ. Notes. 2019, 48, e12136. [Google Scholar] [CrossRef]
- Balaguer, J.; Cantavella-Jordá, M. Tourism as a long-run economic growth factor: The Spanish case. Appl. Econ. 2002, 34, 877–884. [Google Scholar] [CrossRef]
- Marin, D. Is the tourism-led growth thesis valid? The case of the bahamas, barbados, and Jamaica. Tour. Anal. 1992, 74, 678–688. [Google Scholar]
- Brida, J.G.; Sanchez Carrera, E.J.; Risso, W.A. Tourism’s impact on long-run Mexican economic growth. Econ. Bull. 2008, 3, 1–8. [Google Scholar]
- Ashley, C.; Mitchell, J. Can Tourism Reduce Poverty in Africa? Overseas Development Institute: London, UK, 2006. [Google Scholar]
- Bhagwati, J. International Factor Movements and National Advantage. Indian Econ. Soc. Hist. Rev. 1979, 14, 73–100. [Google Scholar]
- Pablo-Romero, M.P.; Molina, J.A. Tourism and economic growth: A review of empirical literature. Tour. Manag. Perspect. 2013, 8, 28–41. [Google Scholar] [CrossRef]
- Tang, C.F.; Tan, E.C. Does tourism effectively stimulate Malaysia’s economic growth? Tour. Manag. 2015, 46, 158–163. [Google Scholar] [CrossRef]
- Kumar, R.R.; Stauvermann, P.J.; Kumar, N.N.; Shahzad, S.J.H. Revisiting the threshold effect of remittances on total factor productivity growth in South Asia: A study of Bangladesh and India. Appl. Econ. 2018, 50, 2860–2877. [Google Scholar] [CrossRef]
- Kumar, R.R. Exploring the nexus between tourism, remittances and growth in Kenya. Qual. Quant. 2014, 48, 1573–1588. [Google Scholar] [CrossRef]
- Kumar, R.R.; Kumar, R. Exploring the nexus between information and communications technology, tourism and growth in Fiji. Tour. Econ. 2012, 18, 359–371. [Google Scholar] [CrossRef]
- Khoshnevis, Y.S.; Salehi, H.K.; Soheilzad, M. The relationship between tourism, foreign direct investment and economic growth: Evidence from Iran. Curr. Issues Tour. 2017, 20, 15–26. [Google Scholar] [CrossRef]
- Lee, J.W.; Brahmasrene, T. Investigating the influence of tourism on economic growth and carbon emissions: Evidence from panel analysis of the European Union. Tour. Manag. 2013, 38, 69–76. [Google Scholar] [CrossRef]
- Shahbaz, M.; Kumar, R.R.; Ivanov, S.; Loganathan, N. The nexus between tourism demand and output per capita with the relative importance of trade openness and financial development: A study of Malaysia. Tour. Econ. 2017, 23, 168–186. [Google Scholar] [CrossRef]
- Isik, C.; Dogru, T.; Turk, E.S. A nexus of linear and non-linear relationships between tourism demand, renewable energy consumption, and economic growth: Theory and evidence. Int. J. Tour. Res. 2018, 20, 38–49. [Google Scholar] [CrossRef]
- Nowak, J.J.; Sahli, M.; Cortés-Jiménez, I. x Tourism, capital good imports and economic growth: Theory and evidence for Spain. Tour. Econ. 2007, 13, 515–536. [Google Scholar] [CrossRef]
- Chou, M.C. Does tourism development promote economic growth in transition countries? A panel data analysis. Econ. Model. 2013, 33, 226–232. [Google Scholar] [CrossRef]
- Inchausti-Sintes, F. Tourism: Economic growth, employment and Dutch Disease. Ann. Tour. Res. 2015, 54, 172–189. [Google Scholar] [CrossRef]
- Sihabutr, C. Technology and International Specialisation in Tourism. Ph.D. Thesis, Université Toulouse le Mirail, Toulouse, France, 2012. [Google Scholar]
- Brida, J.G.; Cortes-Jimenez, I.; Pulina, M. Has the tourism-led growth hypothesis been validated? A literature review. Curr. Issues Tour. 2016, 19, 394–430. [Google Scholar] [CrossRef]
- Chiu, Y.B.; Yeh, L.T. The Threshold Effects of the Tourism-Led Growth Hypothesis: Evidence from a Cross-sectional Model. J. Travel Res. 2017, 56, 625–637. [Google Scholar] [CrossRef]
- Belloumi, M. The relationship between tourism receipts, real effective exchange rate and economic growth in Tunisia. Int. J. Tour. Res. 2010, 12, 550–560. [Google Scholar] [CrossRef]
- Shahzad, S.J.H.; Shahbaz, M.; Ferrer, R.; Kumar, R.R. Tourism-led growth hypothesis in the top ten tourist destinations: New evidence using the quantile-on-quantile approach. Tour. Manag. 2017, 60, 223–232. [Google Scholar] [CrossRef]
- Bilen, M.; Yilanci, V.; Eryüzlü, H. Tourism development and economic growth: A panel Granger causality analysis in the frequency domain. Curr. Issues Tour. 2017, 20, 27–32. [Google Scholar] [CrossRef]
- Salifou, C.K.; ul Haq, I. Tourism, globalization and economic growth: A panel cointegration analysis for selected West African States. Curr. Issues Tour. 2017, 20, 664–667. [Google Scholar] [CrossRef]
- Wu, D.C.; Song, H.; Shen, S. New developments in tourism and hotel demand modeling and forecasting. Int. J. Contemp. Hosp. Manag. 2017, 29, 507–529. [Google Scholar] [CrossRef]
- Song, H.; Qiu, R.T.R.; Park, J. A review of research on tourism demand forecasting. Ann. Tour. Res. 2019, 75, 338–362. [Google Scholar] [CrossRef]
- Frenţ, C. Informing tourism policy with statistical data: The case of the Icelandic Tourism Satellite Account. Curr. Issues Tour. 2018, 21, 1033–1051. [Google Scholar] [CrossRef]
- Giannopoulos, K.; Boutsinas, B. Tourism Satellite Account Support Using Online Analytical Processing. J. Travel Res. 2016, 55, 95–112. [Google Scholar] [CrossRef]
- Wu, Y.H.; Ho, C.C.; Lin, E.S. Measuring the Impact of Military Spending: How Far Does a DSGE Model Deviate from Reality? Def. Peace Econ. 2017, 28, 585–608. [Google Scholar] [CrossRef]
- Blake, A.; Sinclair, M.T. La gestion de crise pour le tourisme: La réponse des Etats-Unis au 11 septembre. Ann. Tour. Res. 2003, 30, 813–832. [Google Scholar] [CrossRef]
- Smets, F.; Wouters, R. An estimated dynamic stochastic general equilibrium model of the euro area. J. Eur. Econ. Assoc. 2003, 1, 1123–1175. [Google Scholar] [CrossRef]
- Pagan, A. Report on modelling and forecasting at the Bank of England / Bank’s response to the Pagan report. Bank Engl. Q. Bull. 2003, 43, 60–91. [Google Scholar]
- Christiano, L.J.; Eichenbaum, M.; Evans, C.L. Nominal Rigidities and the Dynamic Effects of a Shock to Monetary Policy. J. Polit. Econ. 2005, 113, 1–45. [Google Scholar] [CrossRef]
- Smets, F.; Wouters, R. Forecasting with a Bayesian DSGE model: An application to the euro area. JCMS J. Common Mark. Stud. 2004, 42, 841–867. [Google Scholar] [CrossRef]
- Adolfson, M.; Lindé, J.; Villani, M. Forecasting Performance of an Open Economy DSGE Model. Economet. Rev. 2007, 26, 289–328. [Google Scholar] [CrossRef]
- Wannapan, S.; Chaiboonsri, C.; Sriboonchitta, S. Application of the Bayesian DSGE model to the international tourism sector: Evidence from Thailand’s economic cycle. Wit. Trans. Ecol. Envir. 2018, 227, 257–268. [Google Scholar]
- Rouwenhorst, K.G. Time to build and aggregate fluctuations. A reconsideration. J. Monet. Econ. 1991, 27, 241–254. [Google Scholar] [CrossRef]
- Hazari, B.R.; Sgro, P.M. Tourism and growth in a dynamic model of trade. J. Int. Trade Econ. Dev. 1995, 4, 243–252. [Google Scholar]
- Herbst, E.W.; Schorfheide, F. Bayesian Estimation of DSGE Models; Princeton University Press: Princeton, NJ, USA, 2015. [Google Scholar]
- Burriel, P.; Fernández-Villaverde, J.; Rubio-Ramírez, J.F. MEDEA: A DSGE model for the Spanish economy. SERIE 2010, 1, 175–243. [Google Scholar] [CrossRef]
- Zhang, J. Assessing the Economic Importance of Meetings Activities in Denmark. Scand. J. Hosp. Tour. 2014, 14, 192–210. [Google Scholar] [CrossRef]
- Zhang, W.B. Tourism, trade externalities and public goods in a three-sector growth model. UTMS J. Econ. 2015, 6, 1–19. [Google Scholar]
- Gertler, M.; Sala, L.; Trigari, A. An Estimated Monetary DSGE Model with Unemployment and Staggered Nominal Wage Bargaining. J. Money Credit Bank 2008, 40, 1713–1764. [Google Scholar] [CrossRef]
- Tsionas, E.G.; Assaf, A. Short-run and long-run performance of international tourism: Evidence from Bayesian dynamic models. Tour. Manag. 2014, 42, 22–36. [Google Scholar] [CrossRef]
- UNWTO. Report on Tourism and Culture Synergies. In Proceedings of the International Conference on Tourism and Accessibility, Madrid, Spain, 16–20 June 2018. [Google Scholar]
- Wu, D.C.; Liu, J.; Song, H.; Liu, A.; Fu, H. Developing a Web-based regional tourism satellite account (TSA) information system. Tour. Econ. 2019, 25, 67–84. [Google Scholar] [CrossRef]
- Mankiw, N.G.; Romer, D.; Weil, D.N. A Contribution to the Empirics of Economic Growth. Q. J. Econ. 1992, 107, 407–437. [Google Scholar] [CrossRef]


| Functions | Variables |
|---|---|
| The utility function of households | |
| E0: expected utility function β: discounted rate h: typifies the habit persistence of consumption Ct: (using a CES function) is composed by:
Lal,t: Private land supply shock Ϛla,t: This exogenous variable represents the result of private land inputs on the economy σ, ν1, and ν2: the parameters of the constant elasticity of substitution (CES) CM, t: is composed by:
| |
| The production functions of the tourism and non-tourism activities | |
| Yi,t (i = T, NT): The value-added of the given sector Ωi, t (i = T, NT): The productivity function connected to the effects of physical capital and public sector Ki,t (i = T, NT): The physical capital and is calculated by the process: Ki, t+1 = Ii, t + (1−δ)Ki, t (i= T, NT)
| |
| The productivity function connected to the effects of physical capital and public sector | |
| At: The auto-regression processes of the total productivity shocks Ai,t: The auto-regression processes of the sector that point out sector and total productivity shocks ζP, t: The exogenous shock to the spill-over effects of public sector YP,t the effect of public sector Ki,t: The effect of physical capital : The spillover effect of Kp,t φP,i: The effect of the public sector φc,i:The effect of the private sector (i = T, NT): The parameters | |
| The spill-over effects of capital and the accumulation of human capital | |
| EXT,t: The exports of tourism ζH,t: The shock to human capital accumulation EXNT,t: The non-tourism products and : The effect of the tourism product on human capital ai, bi and πi: The parameters δH: The depreciation rate of human capital : The externality of experience | |
| The exports | |
| The real exchange rate in USD RERt: The exchange rate YROW,t: The world income level | |
| Functions | Variables |
|---|---|
| The model VAR | |
| : represent an nH × 1 vector corresponding to endogenous variables for t = 1…, T c: Group of terms p: The VAR lag length [B1, …, Bp]: Parameter matrices ut: The vector of forecast errors defined by the multivariate normal distribution N (0; ∑u) | |
| Vector of VAR variables | |
| YT,t: The production in the tourist industry YNT,t: The production in the non- tourist industries Ct: Per capita real consumption GDPt: Per capita real GDP Pt: Applies the GDP deflator Rt: The federal funds rate adjusted at the annual rate EXt: The trade-weighted nominal exchange rate in the United | |
| The DSGE-VAR estimation | |
| be a T×nH matrix with each row consisting of Xv be a T×k matrix with the t-th row containing in where k ≡ 1 + p× nH. ϕ: The maximum-likelihood estimator is calculated according to DSGE parameters vector | |
| DSGE parameters vector | |
| θ: Vector consisting of the DSGE parameters EDh: The expectation operator conditional on the DSGE parameter vector θ | |
| Variables | Code | Value in Steady State | Time Period |
|---|---|---|---|
| GDP/GDP | Y | 1.00 | – |
| Tourism Value Added/GDP | YT | 0.11 | 2002–2017 |
| Non-tourism Value Added/GDP | YNT | 0.72 | 2002–2017 |
| Public Service Value Added/GDP | YP | 0.17 | 2002–2017 |
| Final Consumption/GDP | C | 0.58 | 2002–2017 |
| Total Investment/GDP | Ī | 0.21 | 2002–2017 |
| Imports/GDP | CM | 0.29 | 2002–2017 |
| Tourism Exports/GDP | EXNT | 0.05 | 2002–2017 |
| Non-tourism Exports/GDP | EXT | 0.23 | 2002–2017 |
| Tourism Imports/GDP | CMT | 0.01 | 2002–2017 |
| Non-tourism Imports/GDP | CMNT | 0.29 | 2002–2017 |
| Tourism Investment/GDP | IT | 0.01 | 2002–2017 |
| Non-tourism Investment/GDP | INT | 0.16 | 2002–2017 |
| Public Service Investment/GDP | IP | 0.04 | 2002–2017 |
| Tourism FDI/GDP | ĪT DF | 0.01 | 2002–2017 |
| Non-tourism FDI/GDP | ĪNTDF | 0.06 | 2002–2017 |
| Balance of Payments/GDP | BP | 0.04 | 2002–2017 |
| Unemployment | u | 0.15 | 2002–2017 |
| Tourism Consumption/(Final Consumption + Imports) | γ1 | 0.08 | 2002–2017 |
| Non-tourism Consumption/(Final Consumption + Imports) | γ2 | 0.50 | 2002–2017 |
| Public Service Consumption/(Final Consumption + Imports) | γ3 | 0.20 | 2002–2017 |
| Tourism Employment/Employment | nT | 0.11 | 2002–2016 |
| Non-tourism Employment/Employment | nNT | 0.59 | 2002–2017 |
| Public Service Employment/Employment | nP | 0.27 | 2002–2017 |
| CPI | P | 1.00 | – |
| Tourism Price | PT | 1.00 | – |
| Non-tourism Price | PNT | 1.00 | – |
| Public Good Price | PP | - | - |
| GDP Growth Rate | gy | Log (1.02) | 1992–2017 |
| Final Consumption Growth Rate | gC | Log (1.02) | 1992–2017 |
| Investment Growth Rate | gI | Log (1.02) | 1992–2017 |
| Government Consumption Growth Rate | gP | Log (1.02) | 1992–2017 |
| Exports Growth Rate | gEX | Log (1.03) | 1992–2017 |
| Production Tax Rate | τY | 0.12 | – |
| Prior Distribution | Posterior Distribution | 90% Interval | |||||
|---|---|---|---|---|---|---|---|
| Low | High | ||||||
| Structure Parameter | β | Beta (0.99,0.00) | 0.99 | 0.99 | 0.99 | ||
| Discount Rate | |||||||
| Physical Capital Depreciation Rate | δ | Beta (0.02,0.00) | 0.02 | 0.02 | 0.02 | ||
| Output Elasticity of Physical Capital in the Tourism Industry | α1 | Beta (0.37,0.10) | 0.53 | 0.51 | 0.60 | ||
| Output Elasticity of Human Capital in the Tourism Industry | α2 | Beta (0.44,0.10) | 0.07 | 0.03 | 0.11 | ||
| Output Elasticity of Physical Capital in the Non-tourism Industry | α3 | Beta (0.63,0.10) | 0.65 | 0.60 | 0.70 | ||
| Output Elasticity of Physical Capital in the Public Service Industry | α4 | Beta (0.63,0.10) | 0.69 | 0.65 | 0.73 | ||
| Habit Persistent | h | Beta (0.85,0.01) | 0.85 | 0.85 | 0.86 | ||
| Elasticity of Leisure | ν1 | Gamma (2.00,0.10) | 1.98 | 1.93 | 2.09 | ||
| Elasticity of Private Land | ν2 | Gamma (2.00,0.10) | 2.10 | 2.02 | 2.18 | ||
| Elasticity of Intertemporal Substitution | σ | Gamma (2.00,0.10) | 1.94 | 1.91 | 1.98 | ||
| Substitute Elasticity between Tourism, Non-tourism Goods and Public Services | θ1 | Gamma (0.40,0.10) | 0.38 | 0.37 | 0.40 | ||
| Substitute Elasticity between FDI and Domestic Investment | θ2 | Gamma (1.51,0.10) | 1.45 | 1.41 | 1.47 | ||
| Substitute Elasticity between Tourism and Non-tourism Imports | θ3 | Gamma (0.40,0.10) | 0.53 | 0.51 | 0.56 | ||
| Price Elasticity of Tourism Exports (Absolute) | θEX,T | Gamma (0.39,0.10) | 0.38 | 0.35 | 0.41 | ||
| Price Elasticity of Non-tourism Exports (Absolute) | θE, | NT | Gamma (0.19,0.10) | 0.32 | 0.28 | 0.35 | |
| Income Elasticity of Tourism Exports | ωT | Gamma (0.81,0.10) | 1.00 | 0.94 | 1.12 | ||
| Income Elasticity of Non-tourism Exports | ωNT | Gamma (0.27,0.10) | 0.05 | 0.03 | 0.07 | ||
| Autoregressive Coefficient of Return Rate | θtr | Beta (0.80,0.10) | 0.95 | 0.92 | 0.96 | ||
| Elasticity of Price in the Taylor Rule | θp | Gamma (1.70,0.10) | 1.73 | 1.69 | 1.76 | ||
| Elasticity of GDP in the Taylor Rule | θy | Gamma (0.12,0.05) | 0.13 | 0.13 | 0.14 | ||
| Elasticity of Tourism Exports in Human Capital Accumulation | aT | Gamma (0.30,0.10) | 0.48 | 0.43 | 0.51 | ||
| Elasticity of Non-exports of the Tourism Industry in Human Capital Accumulation | bT | Gamma (0.05,0.01) | 0.04 | 0.04 | 0.05 | ||
| Scale Effect of Human Capital Accumulated by the Tourism Industry | πT | Gamma (0.30,0.10) | 0.31 | 0.28 | 0.33 | ||
| Elasticity of Non-tourism Exports in Human Capital Accumulation | a T | Gamma (0.30,0.10) | 0.43 | 0.39 | 0.46 | ||
| Elasticity of Non-exports in the Non-tourism industry of Human Capital Accumulation | B T | Gamma (0.06,0.01) | 0.06 | 0.05 | 0.06 | ||
| Scale Effect of Human Capital Accumulated by the Non-tourism Industry | Π T | Gamma (0.30,0.10) | 0.38 | 0.34 | 0.41 | ||
| Depreciation Rate of Human Capital | δH | Gamma (0.04,0.01) | 0.05 | 0.04 | 0.05 | ||
| Spill-over Effect of Public Service on Tourism Productivity | φP, | T | Gamma (0.10,0.01) | 0.10 | 0.10 | 0.11 | |
| Spill-over Effect of Tourism Physical Capital on its Productivity | φT | Gamma (0.05,0.01) | 0.05 | 0.05 | 0.06 | ||
| Congestion Effect of Physical Capital on Tourism Productivity | φC, | T | Gamma (0.04,0.01) | 0.04 | 0.04 | 0.05 | |
| Spill-over Effect of Public Service on Non-tourism Productivity | φP, | NT | Gamma (0.10,0.01) | 0.11 | 0.11 | 0.11 | |
| Spill-over Effect of Non-tourism Physical Capital on its Productivity | φ T | Gamma (0.05,0.01) | 0.04 | 0.04 | 0.05 | ||
| Congestion Effect of Physical Capital on Non-tourism Productivity | φC, | NT | Gamma (0.05,0.01) | 0.04 | 0.04 | 0.05 | |
| Autoregressive Parameter | |||||||
| Productivity of the Tourism Industry | Ρ T | Beta (0.50,0.20) | 0.53 | 0.47 | 0.68 | ||
| Productivity of the Non-Tourism Industry | ρZNNT | Beta (0.50,0.20) | 0.99 | 0.99 | 0.10 | ||
| Productivity of the Public Service Industry | ρZ P | Beta (0.50,0.20) | 0.03 | 0.02 | 0.04 | ||
| Total Productivity of all Industries | ρZ | Beta (0.51,0.20) | 0.91 | 0.90 | 0.93 | ||
| World Output | ρYrow | Beta (0.50,0.20) | 0.92 | 0.91 | 0.94 | ||
| Real Exchange Rate | ρRER | Beta (0.78,0.20) | 0.84 | 0.83 | 0.84 | ||
| Land Supply Shock | ρLa | Beta (0.50,0.20) | 0.30 | 0.16 | 0.38 | ||
| Tourism Imports Price | ρC, | T | Beta (0.51,0.20) | 0.85 | 0.78 | 0.90 | |
| Non-tourism Imports | ρC, | NT | Beta (0.50,0.20) | 0.86 | 0.84 | 0.86 | |
| Human Capital Accumulation Shock | ρH | Beta (0.50,0.20) | 0.82 | 0.74 | 0.94 | ||
| Public Service Production Shock | ρP | Beta (0.50,0.20) | 0.10 | 0.99 | 1.00 | ||
| Standard Deviation | εZT | IGamma (0.15, 0.25) | 0.13 | 0.11 | 0.15 | ||
| Productivity of the Tourism Industry | |||||||
| Productivity of the Non-Tourism Industry | εZNT | IGamma (0.15, 0.25) | 0.13 | 0.12 | 0.14 | ||
| Productivity of the Public Service Industry | εZP | IGamma (0.15, 0.25) | 0.14 | 0.11 | 0.16 | ||
| Total Productivity of all Industries | εZ | IGamma (0.15, 0.25) | 0.10 | 0.10 | 0.10 | ||
| World Output | εYrow | IGamma (0.15, 0.25) | 0.11 | 0.10 | 0.12 | ||
| Real Exchange Rate | εRER | IGamma (0.15, 0.25) | 0.11 | 0.10 | 0.11 | ||
| Land Supply Shock | εLa | IGamma (0.15, 0.25) | 0.36 | 0.31 | 0.42 | ||
| Tourism Imports Price | εCM, | T | IGamma (0.15, 0.25) | 0.20 | 0.14 | 0.29 | |
| Non-tourism Imports | εCM, | NT | IGamma (0.15, 0.25) | 0.50 | 0.45 | 0.52 | |
| Human Capital Accumulation Shock | εH | IGamma (0.15, 0.25) | 0.13 | 0.11 | 0.14 | ||
| Public Service Production Shock | εP | IGamma (0.15, 0.25) | 0.25 | 0.22 | 0.27 | ||
| Prior Distribution | Posterior Distribution | 90% Interval | |||||
|---|---|---|---|---|---|---|---|
| Low | High | ||||||
| Structure Parameter Discount Rate | β | Beta (0.95, 0.00) | 0.95 | 0.95 | 0.95 | ||
| Physical Capital Depreciation Rate | δ | Beta (0.02,0.00) | 0.02 | 0.02 | 0.03 | ||
| Output Elasticity of Physical Capital in the Tourism Industry | α1 | Beta (0.37,0.10) | 0.52 | 0.50 | 0.58 | ||
| Output Elasticity of Human Capital in the Tourism Industry | α2 | Beta (0.42,0.10) | 0.06 | 0.03 | 0.09 | ||
| Output Elasticity of Physical Capital in the Non-tourism Industry | α3 | Beta (0.63,0.10) | 0.60 | 0.57 | 0.66 | ||
| Output Elasticity of Physical Capital in the Public Service Industry | α4 | Beta (0.63,0.10) | 0.65 | 0.62 | 0.71 | ||
| Habit Persistent | h | Beta (0.85,0.01) | 0.88 | 0.87 | 0.88 | ||
| Elasticity of Leisure | ν1 | Gamma (2.00,0.10) | 1.93 | 1.90 | 1.97 | ||
| Elasticity of Private Land | ν2 | Gamma (2.00,0.10) | 2.15 | 2.13 | 2.19 | ||
| Elasticity of Intertemporal Substitution | σ | Gamma (2.00,0.10) | 1.99 | 1.94 | 2.12 | ||
| Substitute Elasticity between Tourism, Non-tourism Goods and Public Services | θ1 | Gamma (0.40,0.10) | 0.40 | 0.38 | 0.41 | ||
| Substitute Elasticity between FDI and Domestic Investment | θ2 | Gamma (1.51,0.10) | 1.41 | 1.38 | 1.45 | ||
| Substitute Elasticity between Tourism and Non-tourism Imports | θ3 | Gamma (0.40,0.10) | 0.57 | 0.52 | 0.59 | ||
| Price Elasticity of Tourism Exports (Absolute) | θEX,T | Gamma (0.39,0.10) | 0.34 | 0.32 | 0.41 | ||
| Price Elasticity of Non-tourism Exports (Absolute) | θE, | NT | Gamma (0.20,0.10) | 0.30 | 0.28 | 0.33 | |
| Income Elasticity of Tourism Exports | ωT | Gamma (0.82,0.10) | 1.05 | 0.97 | 1.11 | ||
| Income Elasticity of Non-tourism Exports | ωNT | Gamma (0.27,0.10) | 0.06 | 0.05 | 0.08 | ||
| Autoregressive Coefficient of Return Rate | θtr | Beta (0.80,0.10) | 0.93 | 0.90 | 0.95 | ||
| Elasticity of Price in the Taylor Rule | θp | Gamma (1.71,0.10) | 1.70 | 1.68 | 1.74 | ||
| Elasticity of GDP in the Taylor Rule | θy | Gamma (0.13,0.05) | 0.13 | 0.12 | 0.13 | ||
| Elasticity of Tourism Exports in Human Capital Accumulation | aT | Gamma (0.30,0.10) | 0.49 | 0.44 | 0.52 | ||
| Elasticity of Non-exports of the Tourism Industry in Human Capital Accumulation | bT | Gamma (0.06,0.01) | 0.06 | 0.06 | 0.07 | ||
| Scale Effect of Human Capital Accumulated by the Tourism Industry | πT | Gamma (0.30,0.10) | 0.36 | 0.33 | 0.38 | ||
| Elasticity of Non-tourism Exports in Human Capital Accumulation | a T | Gamma (0.30,0.10) | 0.47 | 0.43 | 0.48 | ||
| Elasticity of Non-exports in the Non-tourism industry of Human Capital Accumulation | b T | Gamma (0.05,0.01) | 0.08 | 0.07 | 0.08 | ||
| Scale Effect of Human Capital Accumulated by the Non-tourism Industry | Π T | Gamma (0.30,0.10) | 0.40 | 0.36 | 0.42 | ||
| Depreciation Rate of Human Capital | δH | Gamma (0.05,0.01) | 0.07 | 0.06 | 0.07 | ||
| Spill-over Effect of Public Service on Tourism Productivity | φP, | T | Gamma (0.10,0.01) | 0.13 | 0.12 | 0.13 | |
| Spill-over Effect of Tourism Physical Capital on its Productivity | φT | Gamma (0.05,0.01) | 0.07 | 0.06 | 0.09 | ||
| Congestion Effect of Physical Capital on Tourism Productivity | φC, | T | Gamma (0.04,0.01) | 0.06 | 0.05 | 0.06 | |
| Spill-over Effect of Public Service on Non-tourism Productivity | φP, | NT | Gamma (0.10,0.01) | 0.13 | 0.13 | 0.15 | |
| Spill-over Effect of Non-tourism Physical Capital on its Productivity | Φ T | Gamma (0.05,0.01) | 0.03 | 0.03 | 0.04 | ||
| Congestion Effect of Physical Capital on Non-tourism Productivity | φC, | NT | Gamma (0.05,0.01) | 0.05 | 0.05 | 0.06 | |
| Autoregressive Parameter | |||||||
| Productivity of the Tourism Industry | Ρ T | Beta (0.50,0.20) | 0.55 | 0.48 | 0.70 | ||
| Productivity of the Non-Tourism Industry | ρZ T | Beta (0.50,0.20) | 0.93 | 0.92 | 0.93 | ||
| Productivity of the Public Service Industry | ρ P | Beta (0.52,0.20) | 0.05 | 0.04 | 0.07 | ||
| Total Productivity of all Industries | ρZ | Beta (0.51,0.20) | 0.97 | 0.93 | 0.90 | ||
| World Output | ρYrow | Beta (0.53,0.20) | 0.98 | 0.94 | 0.99 | ||
| Real Exchange Rate | ρRER | Beta (0.78,0.20) | 0.84 | 0.83 | 0.84 | ||
| Land Supply Shock | ρLa | Beta (0.52,0.20) | 0.31 | 0.21 | 0.37 | ||
| Tourism Imports Price | ρCM, | T | Beta (0.51,0.20) | 0.87 | 0.82 | 0.90 | |
| Non-tourism Imports | ρCM, | NT | Beta (0.50,0.20) | 0.82 | 0.80 | 0.85 | |
| Human Capital Accumulation Shock | ρH | Beta (0.53,0.20) | 0.87 | 0.79 | 0.93 | ||
| Public Service Production Shock | ρP | Beta (0.50,0.20) | 0.99 | 0.98 | 1.00 | ||
| Standard Deviation | εZT | IGamma (0.15, 0.25) | 0.12 | 0.10 | 0.14 | ||
| Productivity of the Tourism Industry | |||||||
| Productivity of the Non-Tourism Industry | εZNT | IGamma (0.15, 0.25) | 0.15 | 0.14 | 0.16 | ||
| Productivity of the Public Service Industry | εZP | IGamma (0.15, 0.25) | 0.14 | 0.13 | 0.16 | ||
| Total Productivity of all Industries | εZ | IGamma (0.15, 0.25) | 0.13 | 0.12 | 0.15 | ||
| World Output | εYrow | IGamma (0.15, 0.25) | 0.13 | 0.11 | 0.16 | ||
| Real Exchange Rate | εRER | IGamma (0.15, 0.25) | 0.12 | 0.11 | 0.12 | ||
| Land Supply Shock | εLa | IGamma (0.15, 0.25) | 0.34 | 0.31 | 0.40 | ||
| Tourism Imports Price | εCM, | T | IGamma (0.15, 0.25) | 0.18 | 0.14 | 0.28 | |
| Non-tourism Imports | εCM, | NT | IGamma (0.15, 0.25) | 0.48 | 0.45 | 0.51 | |
| Human Capital Accumulation Shock | εH | IGamma (0.15, 0.25) | 0.14 | 0.13 | 0.15 | ||
| Public Service Production Shock | εP | IGamma (0.15, 0.25) | 0.24 | 0.21 | 0.27 | ||
| Low | High | ||||||
|---|---|---|---|---|---|---|---|
| Structure Parameter Discount Rate | β | Beta (0.95, 0.00) | 0.95 | 0.95 | 0.95 | ||
| Physical Capital Depreciation Rate | δ | Beta (0.02,0.00) | 0.02 | 0.02 | 0.03 | ||
| Output Elasticity of Physical Capital in the Tourism Industry | α1 | Beta (0.37,0.10) | 0.52 | 0.50 | 0.58 | ||
| Output Elasticity of Human Capital in the Tourism Industry | α2 | Beta (0.42,0.10) | 0.06 | 0.03 | 0.09 | ||
| Output Elasticity of Physical Capital in the Non-tourism Industry | α3 | Beta (0.63,0.10) | 0.60 | 0.57 | 0.66 | ||
| Output Elasticity of Physical Capital in the Public Service Industry | α4 | Beta (0.63,0.10) | 0.65 | 0.62 | 0.71 | ||
| Habit Persistent | h | Beta (0.85,0.01) | 0.88 | 0.87 | 0.88 | ||
| Elasticity of Leisure | ν1 | Gamma (2.00,0.10) | 1.93 | 1.90 | 1.97 | ||
| Elasticity of Private Land | ν2 | Gamma (2.00,0.10) | 2.15 | 2.13 | 2.19 | ||
| Elasticity of Intertemporal Substitution | σ | Gamma (2.00,0.10) | 1.99 | 1.94 | 2.12 | ||
| Substitute Elasticity between Tourism, Non-tourism Goods and Public Services | θ1 | Gamma (0.40,0.10) | 0.40 | 0.38 | 0.41 | ||
| Substitute Elasticity between FDI and Domestic Investment | θ2 | Gamma (1.51,0.10) | 1.41 | 1.38 | 1.45 | ||
| Substitute Elasticity between Tourism and Non-tourism Imports | θ3 | Gamma (0.40,0.10) | 0.57 | 0.52 | 0.59 | ||
| Price Elasticity of Tourism Exports (Absolute) | θEX,T | Gamma (0.39,0.10) | 0.34 | 0.32 | 0.41 | ||
| Price Elasticity of Non-tourism Exports (Absolute) | θE, | NT | Gamma (0.20,0.10) | 0.30 | 0.28 | 0.33 | |
| Income Elasticity of Tourism Exports | ωT | Gamma (0.82,0.10) | 1.05 | 0.97 | 1.11 | ||
| Income Elasticity of Non-tourism Exports | ωNT | Gamma (0.27,0.10) | 0.06 | 0.05 | 0.08 | ||
| Autoregressive Coefficient of Return Rate | θtr | Beta (0.80,0.10) | 0.93 | 0.90 | 0.95 | ||
| Elasticity of Price in the Taylor Rule | θp | Gamma (1.71,0.10) | 1.70 | 1.68 | 1.74 | ||
| Elasticity of GDP in the Taylor Rule | θy | Gamma (0.13,0.05) | 0.13 | 0.12 | 0.13 | ||
| Elasticity of Tourism Exports in Human Capital Accumulation | aT | Gamma (0.30,0.10) | 0.49 | 0.44 | 0.52 | ||
| Elasticity of Non-exports of the Tourism Industry in Human Capital Accumulation | bT | Gamma (0.06,0.01) | 0.06 | 0.06 | 0.07 | ||
| Scale Effect of Human Capital Accumulated by the Tourism Industry | πT | Gamma (0.30,0.10) | 0.36 | 0.33 | 0.38 | ||
| Elasticity of Non-tourism Exports in Human Capital Accumulation | a T | Gamma (0.30,0.10) | 0.47 | 0.43 | 0.48 | ||
| Elasticity of Non-exports in the Non-tourism industry of Human Capital Accumulation | b T | Gamma (0.05,0.01) | 0.08 | 0.07 | 0.08 | ||
| Scale Effect of Human Capital Accumulated by the Non-tourism Industry | Π T | Gamma (0.30,0.10) | 0.40 | 0.36 | 0.42 | ||
| Depreciation Rate of Human Capital | δH | Gamma (0.05,0.01) | 0.07 | 0.06 | 0.07 | ||
| Spill-over Effect of Public Service on Tourism Productivity | φP, | T | Gamma (0.10,0.01) | 0.13 | 0.12 | 0.13 | |
| Spill-over Effect of Tourism Physical Capital on its Productivity | φT | Gamma (0.05,0.01) | 0.07 | 0.06 | 0.09 | ||
| Congestion Effect of Physical Capital on Tourism Productivity | φC, | T | Gamma (0.04,0.01) | 0.06 | 0.05 | 0.06 | |
| Spill-over Effect of Public Service on Non-tourism Productivity | φP, | NT | Gamma (0.10,0.01) | 0.13 | 0.13 | 0.15 | |
| Spill-over Effect of Non-tourism Physical Capital on its Productivity | Φ T | Gamma (0.05,0.01) | 0.03 | 0.03 | 0.04 | ||
| Congestion Effect of Physical Capital on Non-tourism Productivity | φC, | NT | Gamma (0.05,0.01) | 0.05 | 0.05 | 0.06 | |
| Autoregressive Parameter | |||||||
| Productivity of the Tourism Industry | Ρ T | Beta (0.50,0.20) | 0.55 | 0.48 | 0.70 | ||
| Productivity of the Non-Tourism Industry | ρZ T | Beta (0.50,0.20) | 0.93 | 0.92 | 0.93 | ||
| Productivity of the Public Service Industry | ρ P | Beta (0.52,0.20) | 0.05 | 0.04 | 0.07 | ||
| Total Productivity of all Industries | ρZ | Beta (0.51,0.20) | 0.97 | 0.93 | 0.90 | ||
| World Output | ρYrow | Beta (0.53,0.20) | 0.98 | 0.94 | 0.99 | ||
| Real Exchange Rate | ρRER | Beta (0.78,0.20) | 0.84 | 0.83 | 0.84 | ||
| Land Supply Shock | ρLa | Beta (0.52,0.20) | 0.31 | 0.21 | 0.37 | ||
| Tourism Imports Price | ρCM, | T | Beta (0.51,0.20) | 0.87 | 0.82 | 0.90 | |
| Non-tourism Imports | ρCM, | NT | Beta (0.50,0.20) | 0.82 | 0.80 | 0.85 | |
| Human Capital Accumulation Shock | ρH | Beta (0.53,0.20) | 0.87 | 0.79 | 0.93 | ||
| Public Service Production Shock | ρP | Beta (0.50,0.20) | 0.99 | 0.98 | 1.00 | ||
| Standard Deviation | εZT | IGamma (0.15, 0.25) | 0.12 | 0.10 | 0.14 | ||
| Productivity of the Tourism Industry | |||||||
| Productivity of the Non-Tourism Industry | εZNT | IGamma (0.15, 0.25) | 0.15 | 0.14 | 0.16 | ||
| Productivity of the Public Service Industry | εZP | IGamma (0.15, 0.25) | 0.14 | 0.13 | 0.16 | ||
| Total Productivity of all Industries | εZ | IGamma (0.15, 0.25) | 0.13 | 0.12 | 0.15 | ||
| World Output | εYrow | IGamma (0.15, 0.25) | 0.13 | 0.11 | 0.16 | ||
| Real Exchange Rate | εRER | IGamma (0.15, 0.25) | 0.12 | 0.11 | 0.12 | ||
| Land Supply Shock | εLa | IGamma (0.15, 0.25) | 0.34 | 0.31 | 0.40 | ||
| Tourism Imports Price | εCM, | T | IGamma (0.15, 0.25) | 0.18 | 0.14 | 0.28 | |
| Non-tourism Imports | εCM, | NT | IGamma (0.15, 0.25) | 0.48 | 0.45 | 0.51 | |
| Human Capital Accumulation Shock | εH | IGamma (0.15, 0.25) | 0.14 | 0.13 | 0.15 | ||
| Public Service Production Shock | εP | IGamma (0.15, 0.25) | 0.24 | 0.21 | 0.27 | ||
| France | Germany | Japan | |||||
|---|---|---|---|---|---|---|---|
| Variables | Period | Shock | 90% C. I. | Shock | 90% C. I. | Shock | 90% C. I. |
| Tourism Productivity | 1 | 10.00 | [9.37, 10.00] | 10.00 | [9.30, 10.00] | 10.00 | [8.85, 10.00] |
| 5 | 2.62 | [1.75, 3.26] | 2.55 | [1.67, 3.14] | 2.32 | [1.59, 3.04] | |
| 10 | 0.58 | [0.11, 0.85] | 0.43 | [0.08, 0.74] | 0.40 | [0.08, 0.68] | |
| Tourism Price | 1 | −14.34 | [−12.65, −16.07] | −14.18 | [−12.25, −15.73] | −15.94 | [−12.79, −16.37] |
| 5 | −2.44 | [−1.58, −3.62] | −2.17 | [−1.33, −3.16] | −2.28 | [−1.41, −3.37] | |
| 10 | −0.67 | [0.00, −1,45] | −0.51 | [0.00, −1,23] | −0.53 | [0.01, −1,36] | |
| Tourism Exports | 1 | 6.93 | [6.15, 7.67] | 6.05 | [5.63, 6.86] | 6.47 | [5.881 7.56] |
| 5 | 1.57 | [0.79, 2.82] | 1.36 | [0.64, 2.48] | 1.48 | [0.73, 2.55] | |
| 10 | 0.48 | [0.06, 0.75] | 0.38 | [0.03, 0.72] | 0.34 | [0.02, 0.67] | |
| Tourism Consumption | 1 | 6.66 | [5.86, 7.25] | 6.23 | [5.53, 7.04] | 6.59 | [5.87, 7.23] |
| 5 | 1.42 | [0.63, 2.57] | 1.55 | [0.70, 2.63] | 1.72 | [0.83, 2.82] | |
| 10 | 0.52 | [0.14, 0.86] | 0.62 | [0.17, 0.91] | 0.75 | [0.23, 0.99] | |
| Tourism Investments | 1 | −13.33 | [−15.47, −12.35] | −12.63 | [−14.89, −11.33] | −11.86 | [−13.68, −11.42] |
| 5 | 2.84 | [−1.35, 4.63] | 2.45 | [−1.78, 4.51] | 2.17 | [−2.57, 4.02] | |
| 10 | 0.35 | [−2.04, 2.47] | 0.51 | [−2.38, 2.83] | 0.41 | [−2.15, 2.17] | |
| Tourism Value Added | 1 | 4.74 | [3.76, 6.15] | 4.04 | [3.23, 5.75] | 4.84 | [3.67, 6.43] |
| 5 | 0.55 | [0.23, 1.52] | 0.37 | [0.10, 1.12] | 0.58 | [0.31, 1.32] | |
| 10 | 0.36 | [−0.18, 0.82] | 0.29 | [−0.21, 0.78] | 0.49 | [−0.12, 0.95] | |
| Human Capital | 1 | 0.05 | [0.04, 0.07] | 0.06 | [0.05, 0.07] | 0.05 | [0.04, 0.07] |
| 5 | 0.02 | [0.01, 0.04] | 0.03 | [0.02, 0.05] | 0.03 | [0.02, 0.04] | |
| 10 | 0.01 | [−0.02, 0.02] | 0.02 | [−0.01, 0.03] | 0.02 | [−0.01, 0.04] | |
| Tourism Capital Spill-over | 1 | 10.88 | [8.53, 11.95] | 10.46 | [8.42, 11.43] | 10.16 | [8.24, 11.28] |
| 5 | 2.33 | [1.36, 3.28] | 2.18 | [1.24, 3.18] | 2.18 | [1.17, 3.24] | |
| 10 | 0.65 | [0.03, 1.06] | 0.54 | [−0.16, 0.82] | 0.58 | [−0.12, 0.85] | |
| Non-tourism Price | 1 | −0.96 | [−1.38, −0.46] | −0.99 | [−1.40, −0.49] | −0.91 | [−1.31, −0.46] |
| 5 | −0.15 | [−0.52, 0.33] | −0.16 | [−0.52, 0.38] | −0.13 | [−0.51, 0.43] | |
| 10 | −0.04 | [−0.24, 0.47] | −0.03 | [−0.21, 0.49] | −0.07 | [−0.21, 0.49] | |
| Non-tourism Exports | 1 | 0.34 | [0.20, 0.48] | 0.32 | [0.17, 0.44] | 0.36 | [0.23, 0.49] |
| 5 | 0.06 | [−0.13, 0.25] | 0.04 | [−0.15, 0.23] | 0.08 | [0.20, 0.48] | |
| 10 | 0.02 | [−0.17, 0.18] | 0.01 | [−0.17, 0.18] | 0.02 | [−0.15, 0.19] | |
| Non-tourism Consumption | 1 | −0.47 | [−0.67, −0.23] | −0.52 | [−0.61, −0.28] | −0.49 | [−0.59, −0.24] |
| 5 | −0.15 | [−0.33, −0.02] | −0.13 | [−0.30, −0.04] | −0.18 | [−0.39, −0.05] | |
| 10 | −0.07 | [−0.20, 0.15] | −0.06 | [−0.16, 0.18] | −0.08 | [−0.17, 0.19] | |
| Non-tourism Investments | 1 | −0.69 | [−0.93, −0.49] | −0.77 | [−0.97, −0.51] | −0.61 | [−0.96, −0.51] |
| 5 | −0.16 | [−0.35, −0.13] | −0.08 | [−0.32, −0.10] | −0.10 | [−0.35, −0.13] | |
| 10 | 0.03 | [−0.15, 0.18] | 0.01 | [−0.17, 0.16] | −0.02 | [−0.18, 0.12] | |
| Non-tourism Value Added | 1 | 0.25 | [0.43, 0.13] | 0.29 | [0.47, 0.14] | 0.29 | [0.48, 0.16] |
| 5 | 0.05 | [−0.18, 0.18] | 0.05 | [−0.20, 0.21] | 0.05 | [−0.19, 0.22] | |
| 10 | 0.08 | [−0.21, 0.23] | 0.06 | [−0.17, 0.24] | 0.07 | [−0.16, 0.26] | |
| Non-tourism Capital Spill-over | 1 | 0.58 | [0.27, 0.72] | 0.53 | [0.24, 0.68] | 0.58 | [0.24, 0.70] |
| 5 | 0.13 | [−0.05, 0.28] | 0.09 | [−0.14, 0.19] | 0.12 | [−0.11, 0.21] | |
| 10 | 0.04 | [−0.17, 0.20] | 0.03 | [−0.14, 0.16] | 0.04 | [−0.14, 0.18] | |
| Public Goods Sector Value Added | 1 | 0.16 | [0.04, 0.33] | 0.12 | [−0.04, 0.32] | 0.13 | [−0.02, 0.34] |
| 5 | −0.17 | [−0.33, 0.08] | −0.09 | [−0.26, 0.12] | −0.14 | [−0.31, 0.09] | |
| 10 | −0.07 | [−0.17, 0.15] | −0.04 | [−0.15, 0.19] | −0.05 | [−0.15, 0.19] | |
| GDP | 1 | 0.54 | [0.47, 0,68] | 0.56 | [0.52, 0,61] | 0.49 | [0.40, 0,52] |
| 5 | 0.28 | [−0.13, 0.34] | 0.23 | [−0.15, 0.32] | 0.30 | [−0.09, 0.34] | |
| 10 | 0.07 | [−0.17, 0.18] | 0.05 | [−0.18, 0.16] | 0.04 | [−0.19, 0.16] | |
| Tourism Employment | 1 | 1.73 | [2.00, 1.53] | 1.85 | [2.13, 1.58] | 1.63 | [1.88, 1.52] |
| 5 | 0.62 | [0.44, 0.78] | 0.67 | [0.46, 0.80] | 0.43 | [0.46, 0.80] | |
| 10 | 0.05 | [−0.11, 0.16] | 0.06 | [−0.11, 0.16] | 0.04 | [−0.11, 0.16] | |
| Non-tourism Employment | 1 | 0.65 | [0.57, 0.82] | 0.73 | [0.58, 0.89] | 0.70 | [0.59, 0.87] |
| 5 | 0.14 | [−0.09, 0.26] | 0.17 | [−0.07, 0.28] | 0.15 | [−0.06, 0.25] | |
| 10 | 0.03 | [−0.13, 0.18] | 0.02 | [−0.13, 0.13] | 0.03 | [−0.10, 0.13] | |
| Public Goods Sector Employment | 1 | 0.68 | [0.58, 0.79] | 0.57 | [0.47, 0.66] | 0.59 | [0.48, 0.68] |
| 5 | 0.06 | [−0.11, 0.14] | 0.04 | [−0.09, 0.14] | 0.04 | [−0.07, 0.12] | |
| 10 | 0.03 | [−0.08, 0.15] | −0.01 | [−0.10, 0.10] | 0.02 | [−0.05, 0.11] | |
| Unemployment | 1 | −4.76 | [−5.05, −4.33] | −4.82 | [−5.22, −4.40] | −4.53 | [−4.79, −4.38] |
| 5 | −1.05 | [−1.43, −0.77] | −0.93 | [−1.32, −0.70] | −0.90 | [−1.22, −0.71] | |
| 10 | −0.02 | [−0.13, 0.14] | −0.03 | [−0.11, 0.10] | −0.02 | [−0.10, 0.09] | |
© 2020 by the authors. Licensee MDPI, Basel, Switzerland. This article is an open access article distributed under the terms and conditions of the Creative Commons Attribution (CC BY) license (http://creativecommons.org/licenses/by/4.0/).
Share and Cite
Alaminos, D.; León-Gómez, A.; Sánchez-Serrano, J.R. A DSGE-VAR Analysis for Tourism Development and Sustainable Economic Growth. Sustainability 2020, 12, 3635. https://doi.org/10.3390/su12093635
Alaminos D, León-Gómez A, Sánchez-Serrano JR. A DSGE-VAR Analysis for Tourism Development and Sustainable Economic Growth. Sustainability. 2020; 12(9):3635. https://doi.org/10.3390/su12093635
Chicago/Turabian StyleAlaminos, David, Ana León-Gómez, and José Ramón Sánchez-Serrano. 2020. "A DSGE-VAR Analysis for Tourism Development and Sustainable Economic Growth" Sustainability 12, no. 9: 3635. https://doi.org/10.3390/su12093635
APA StyleAlaminos, D., León-Gómez, A., & Sánchez-Serrano, J. R. (2020). A DSGE-VAR Analysis for Tourism Development and Sustainable Economic Growth. Sustainability, 12(9), 3635. https://doi.org/10.3390/su12093635