Computational Hybrid Machine Learning Based Prediction of Shear Capacity for Steel Fiber Reinforced Concrete Beams

 ,
,  ,
,  ,
, 
Abstract
1. Introduction
2. Significance of the Subject
3. Materials and Methods
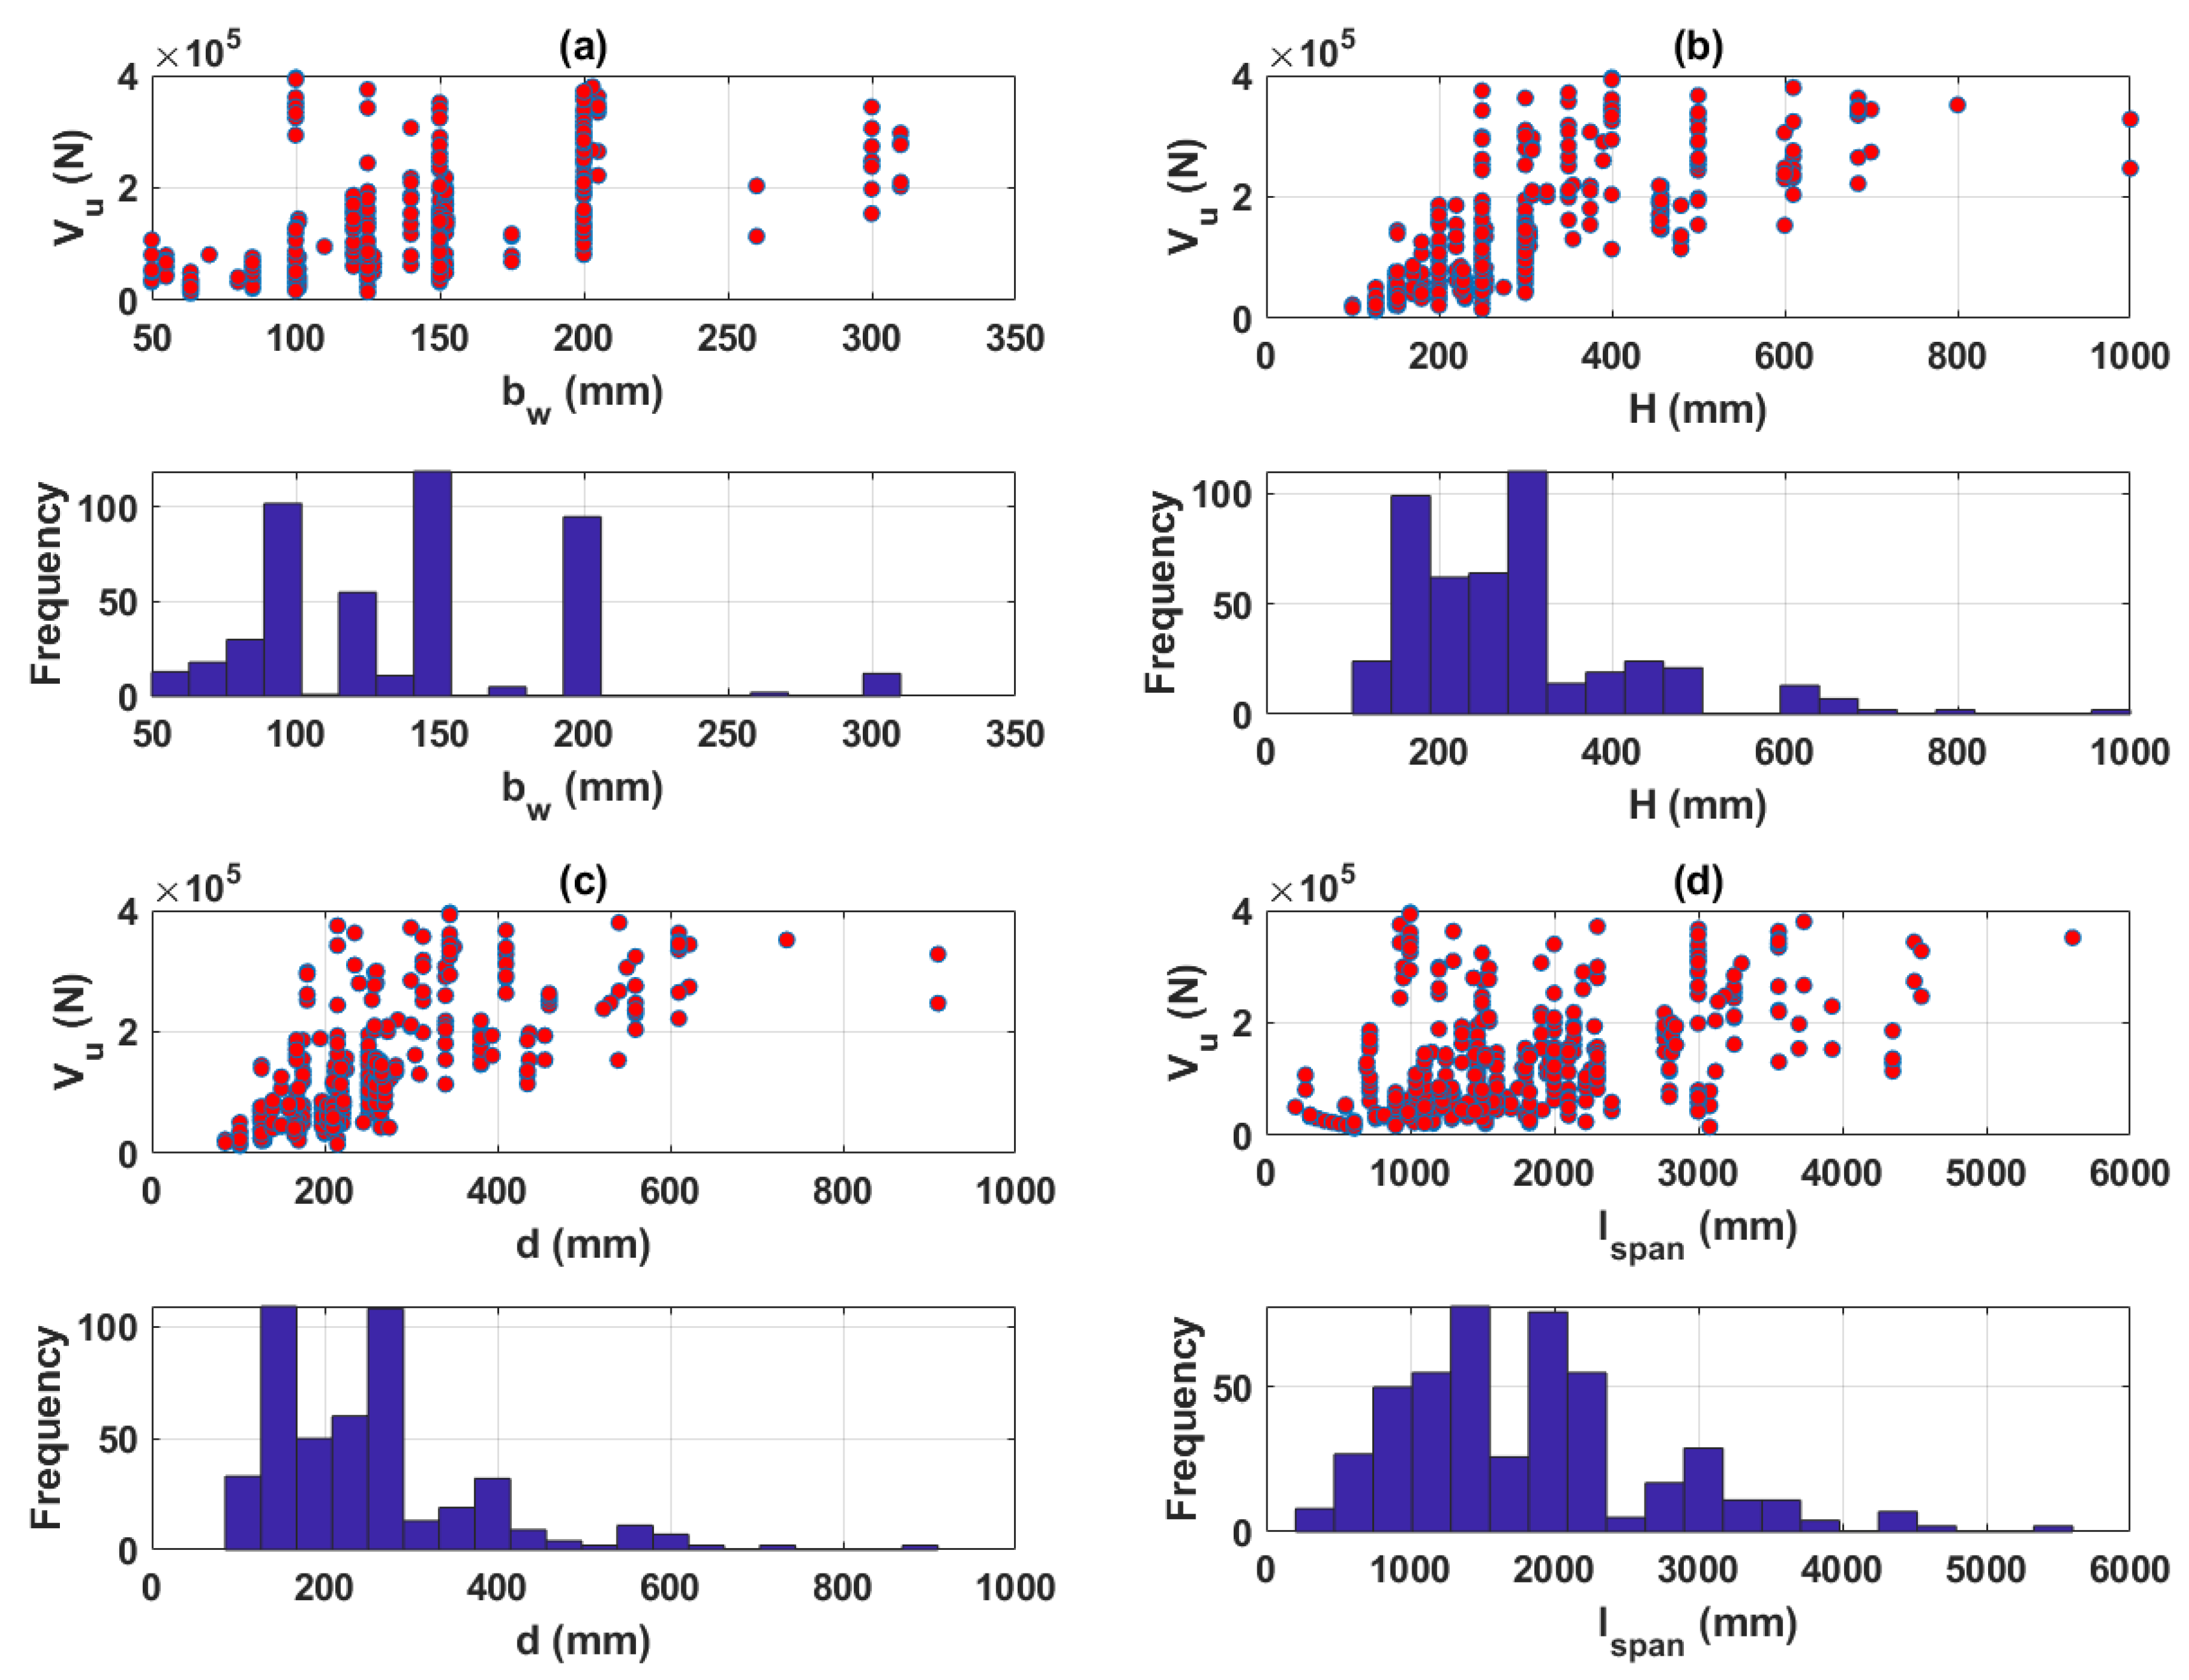
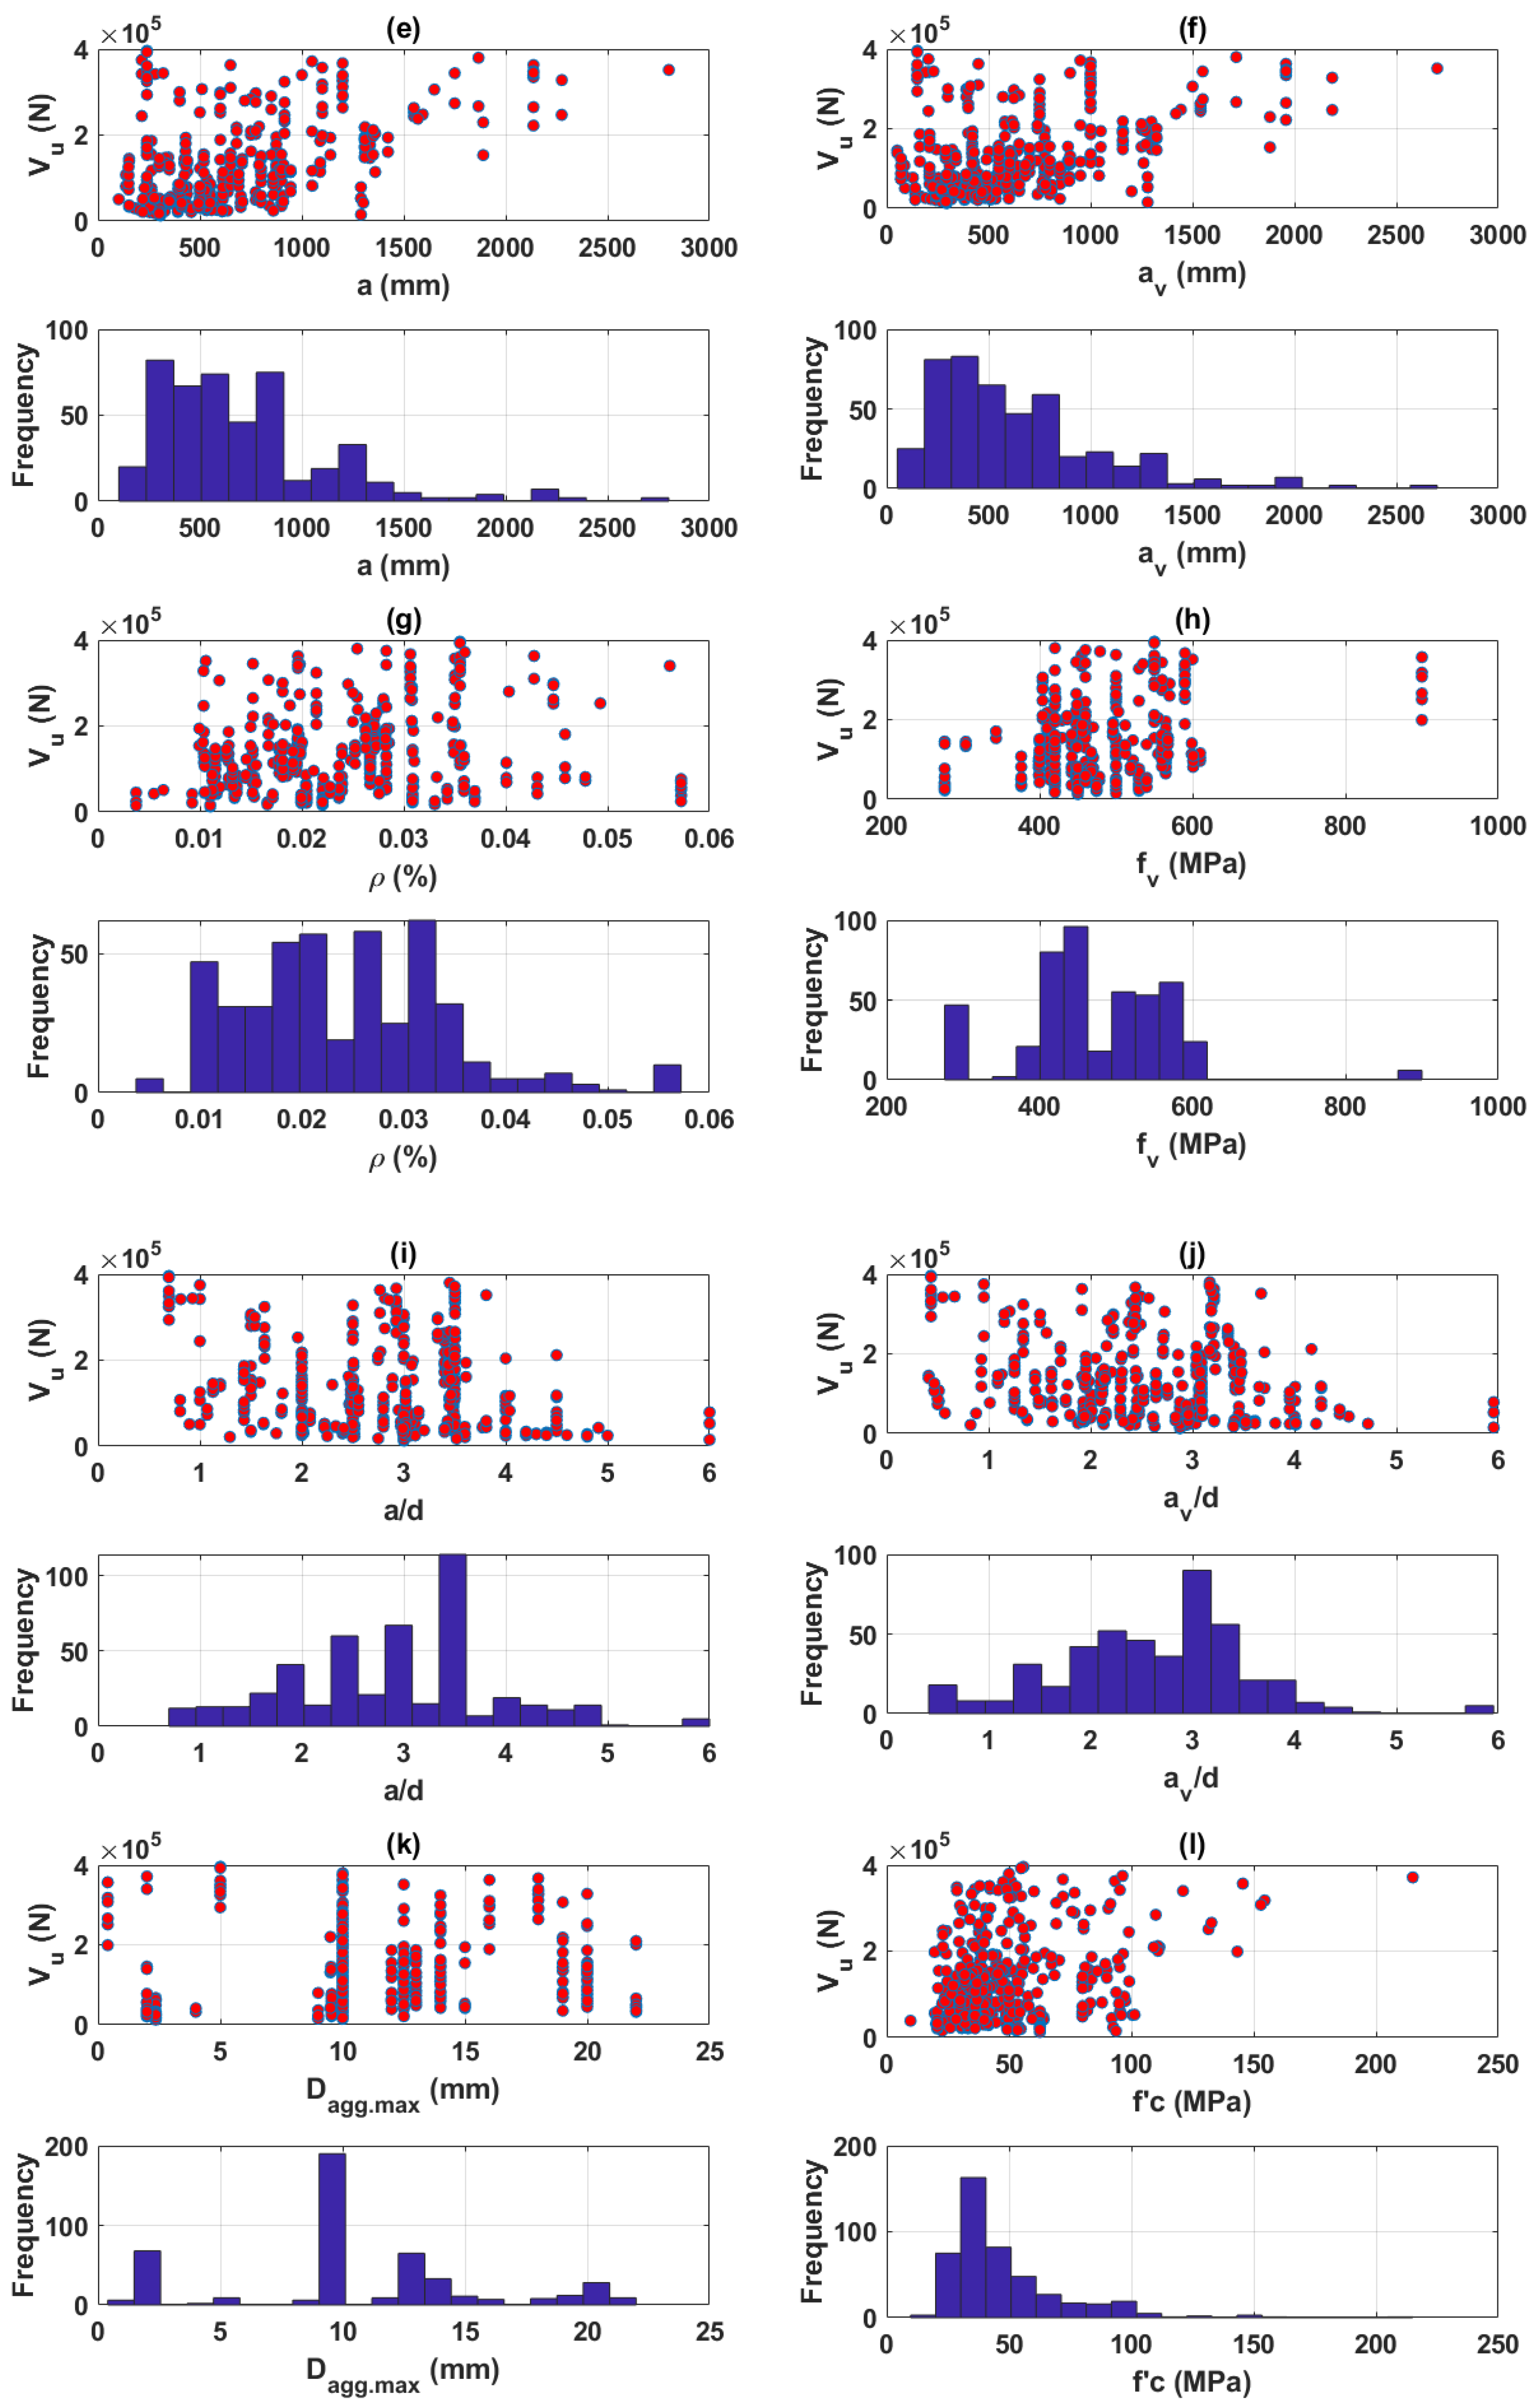
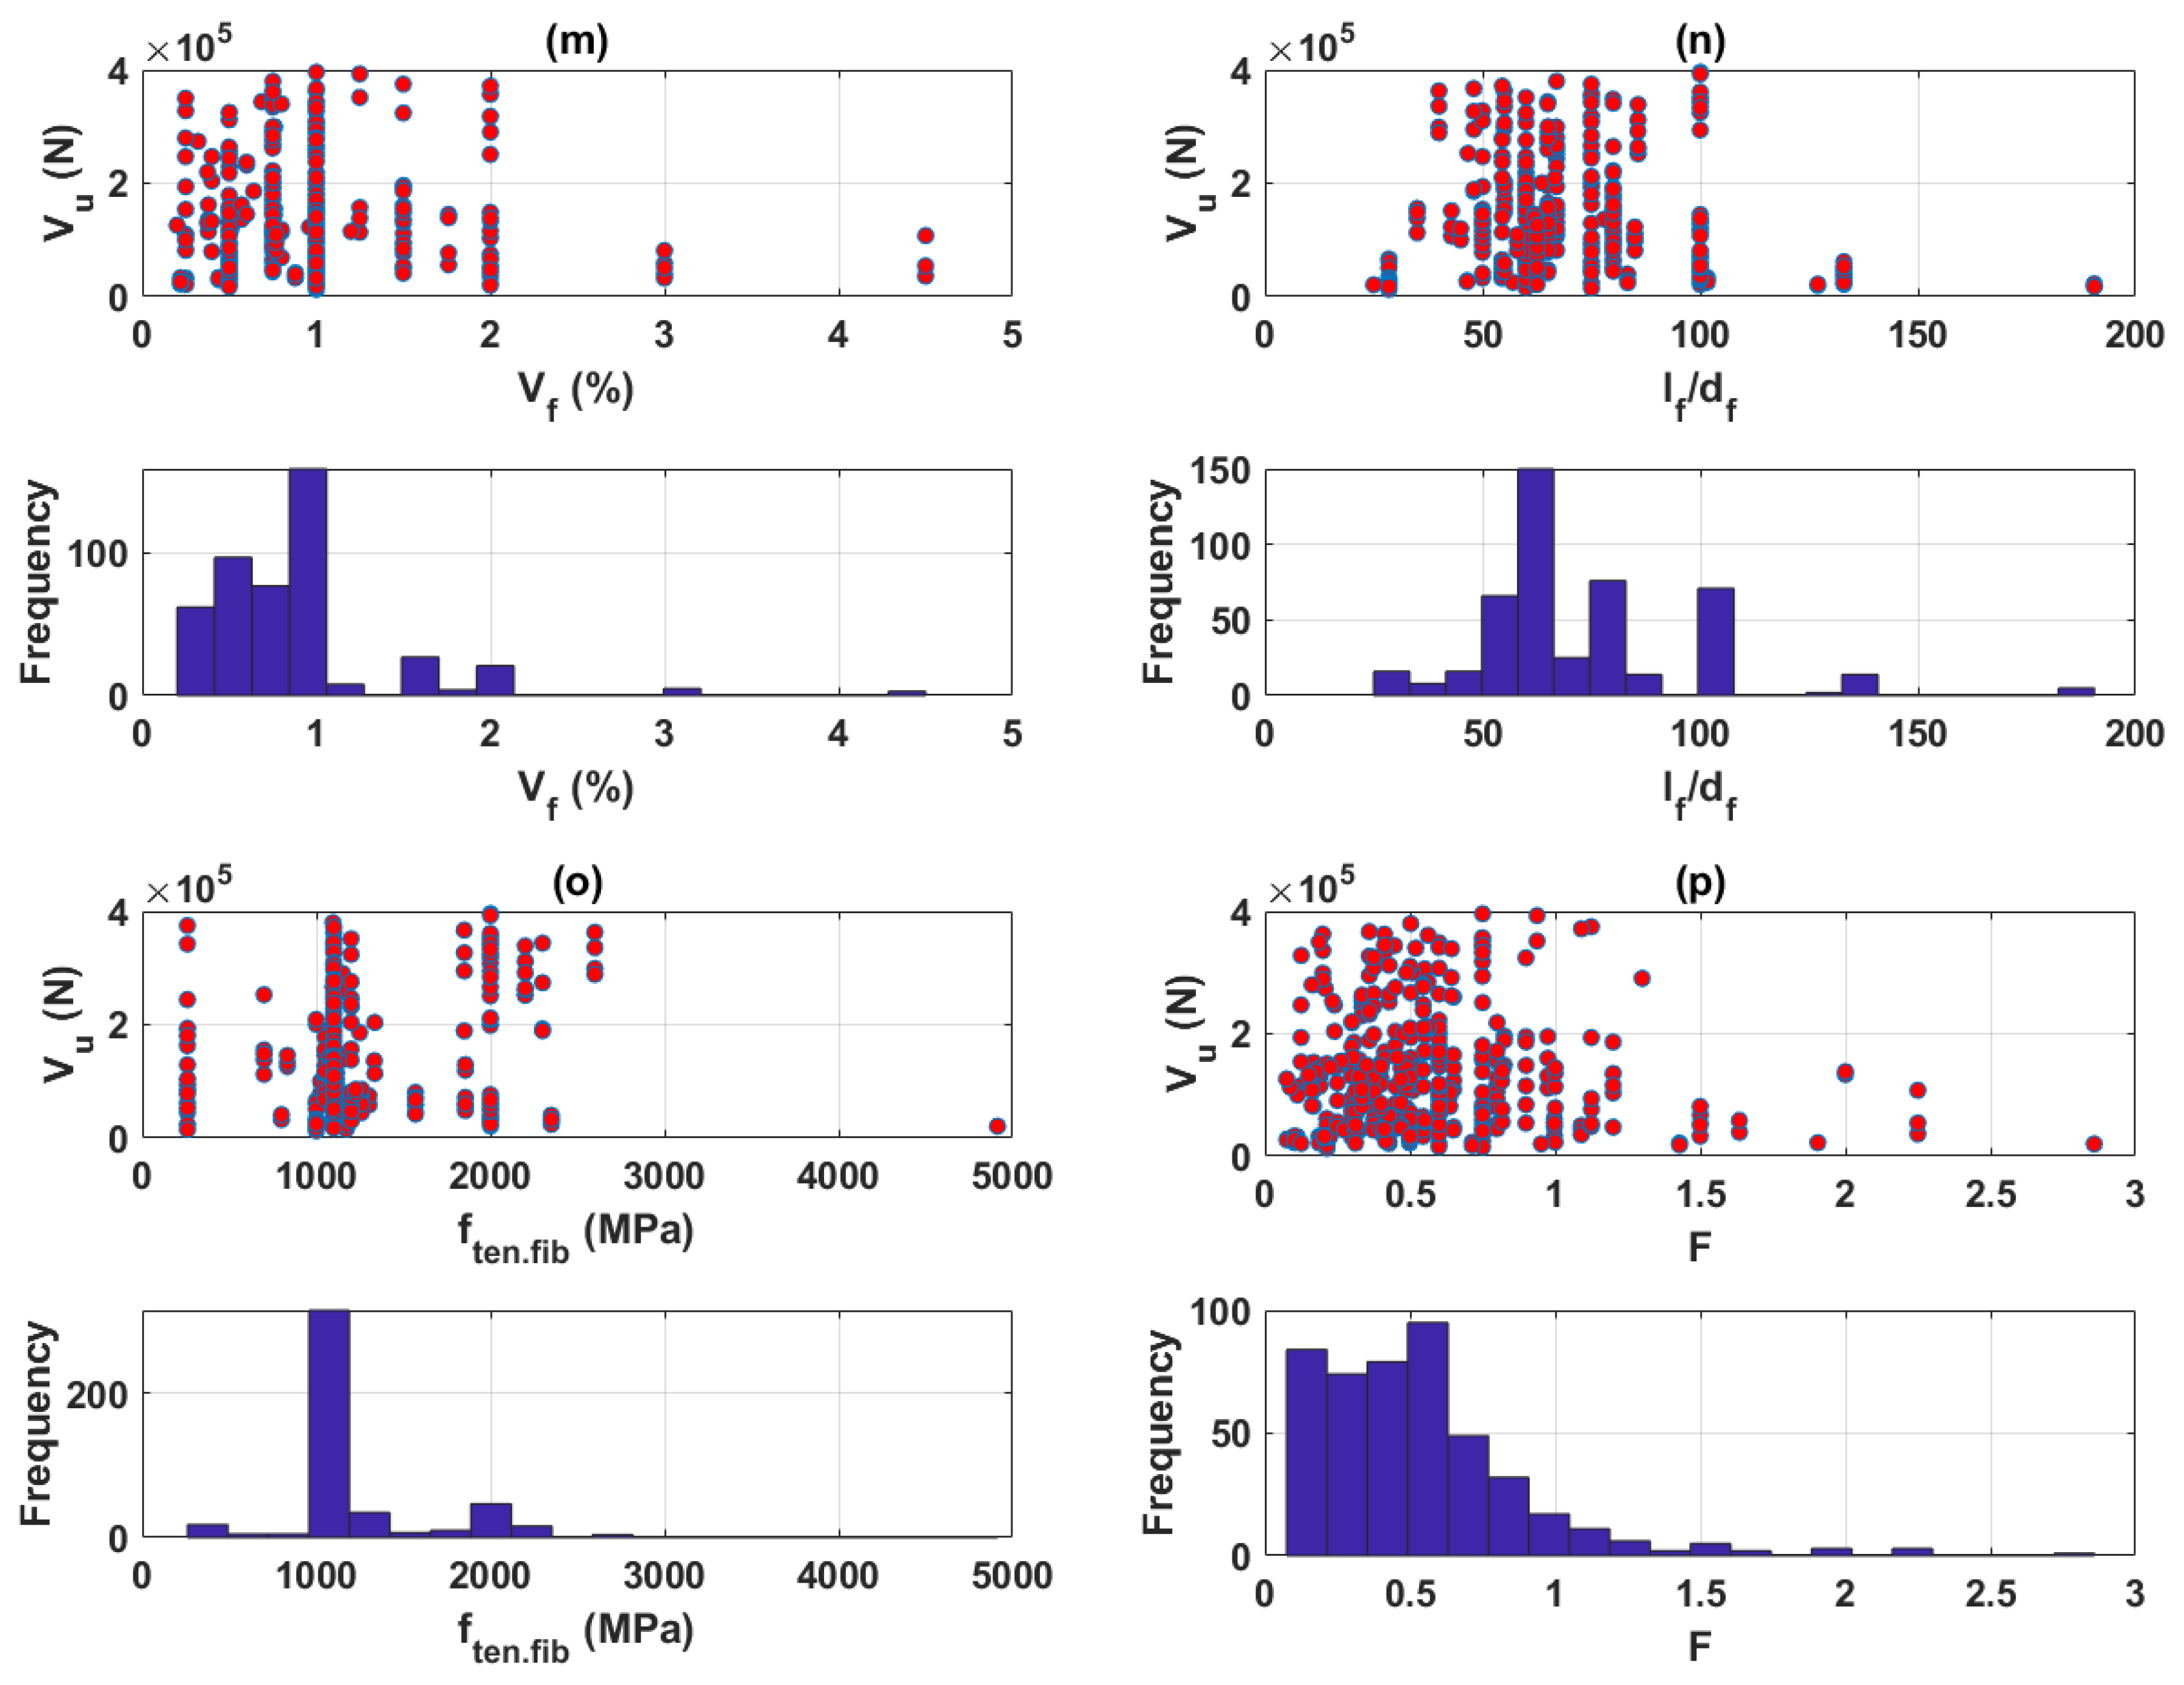
3.1. Dataset Preparation
3.2. Neural Network (NN)
3.3. Selection of Global Optimization Techniques
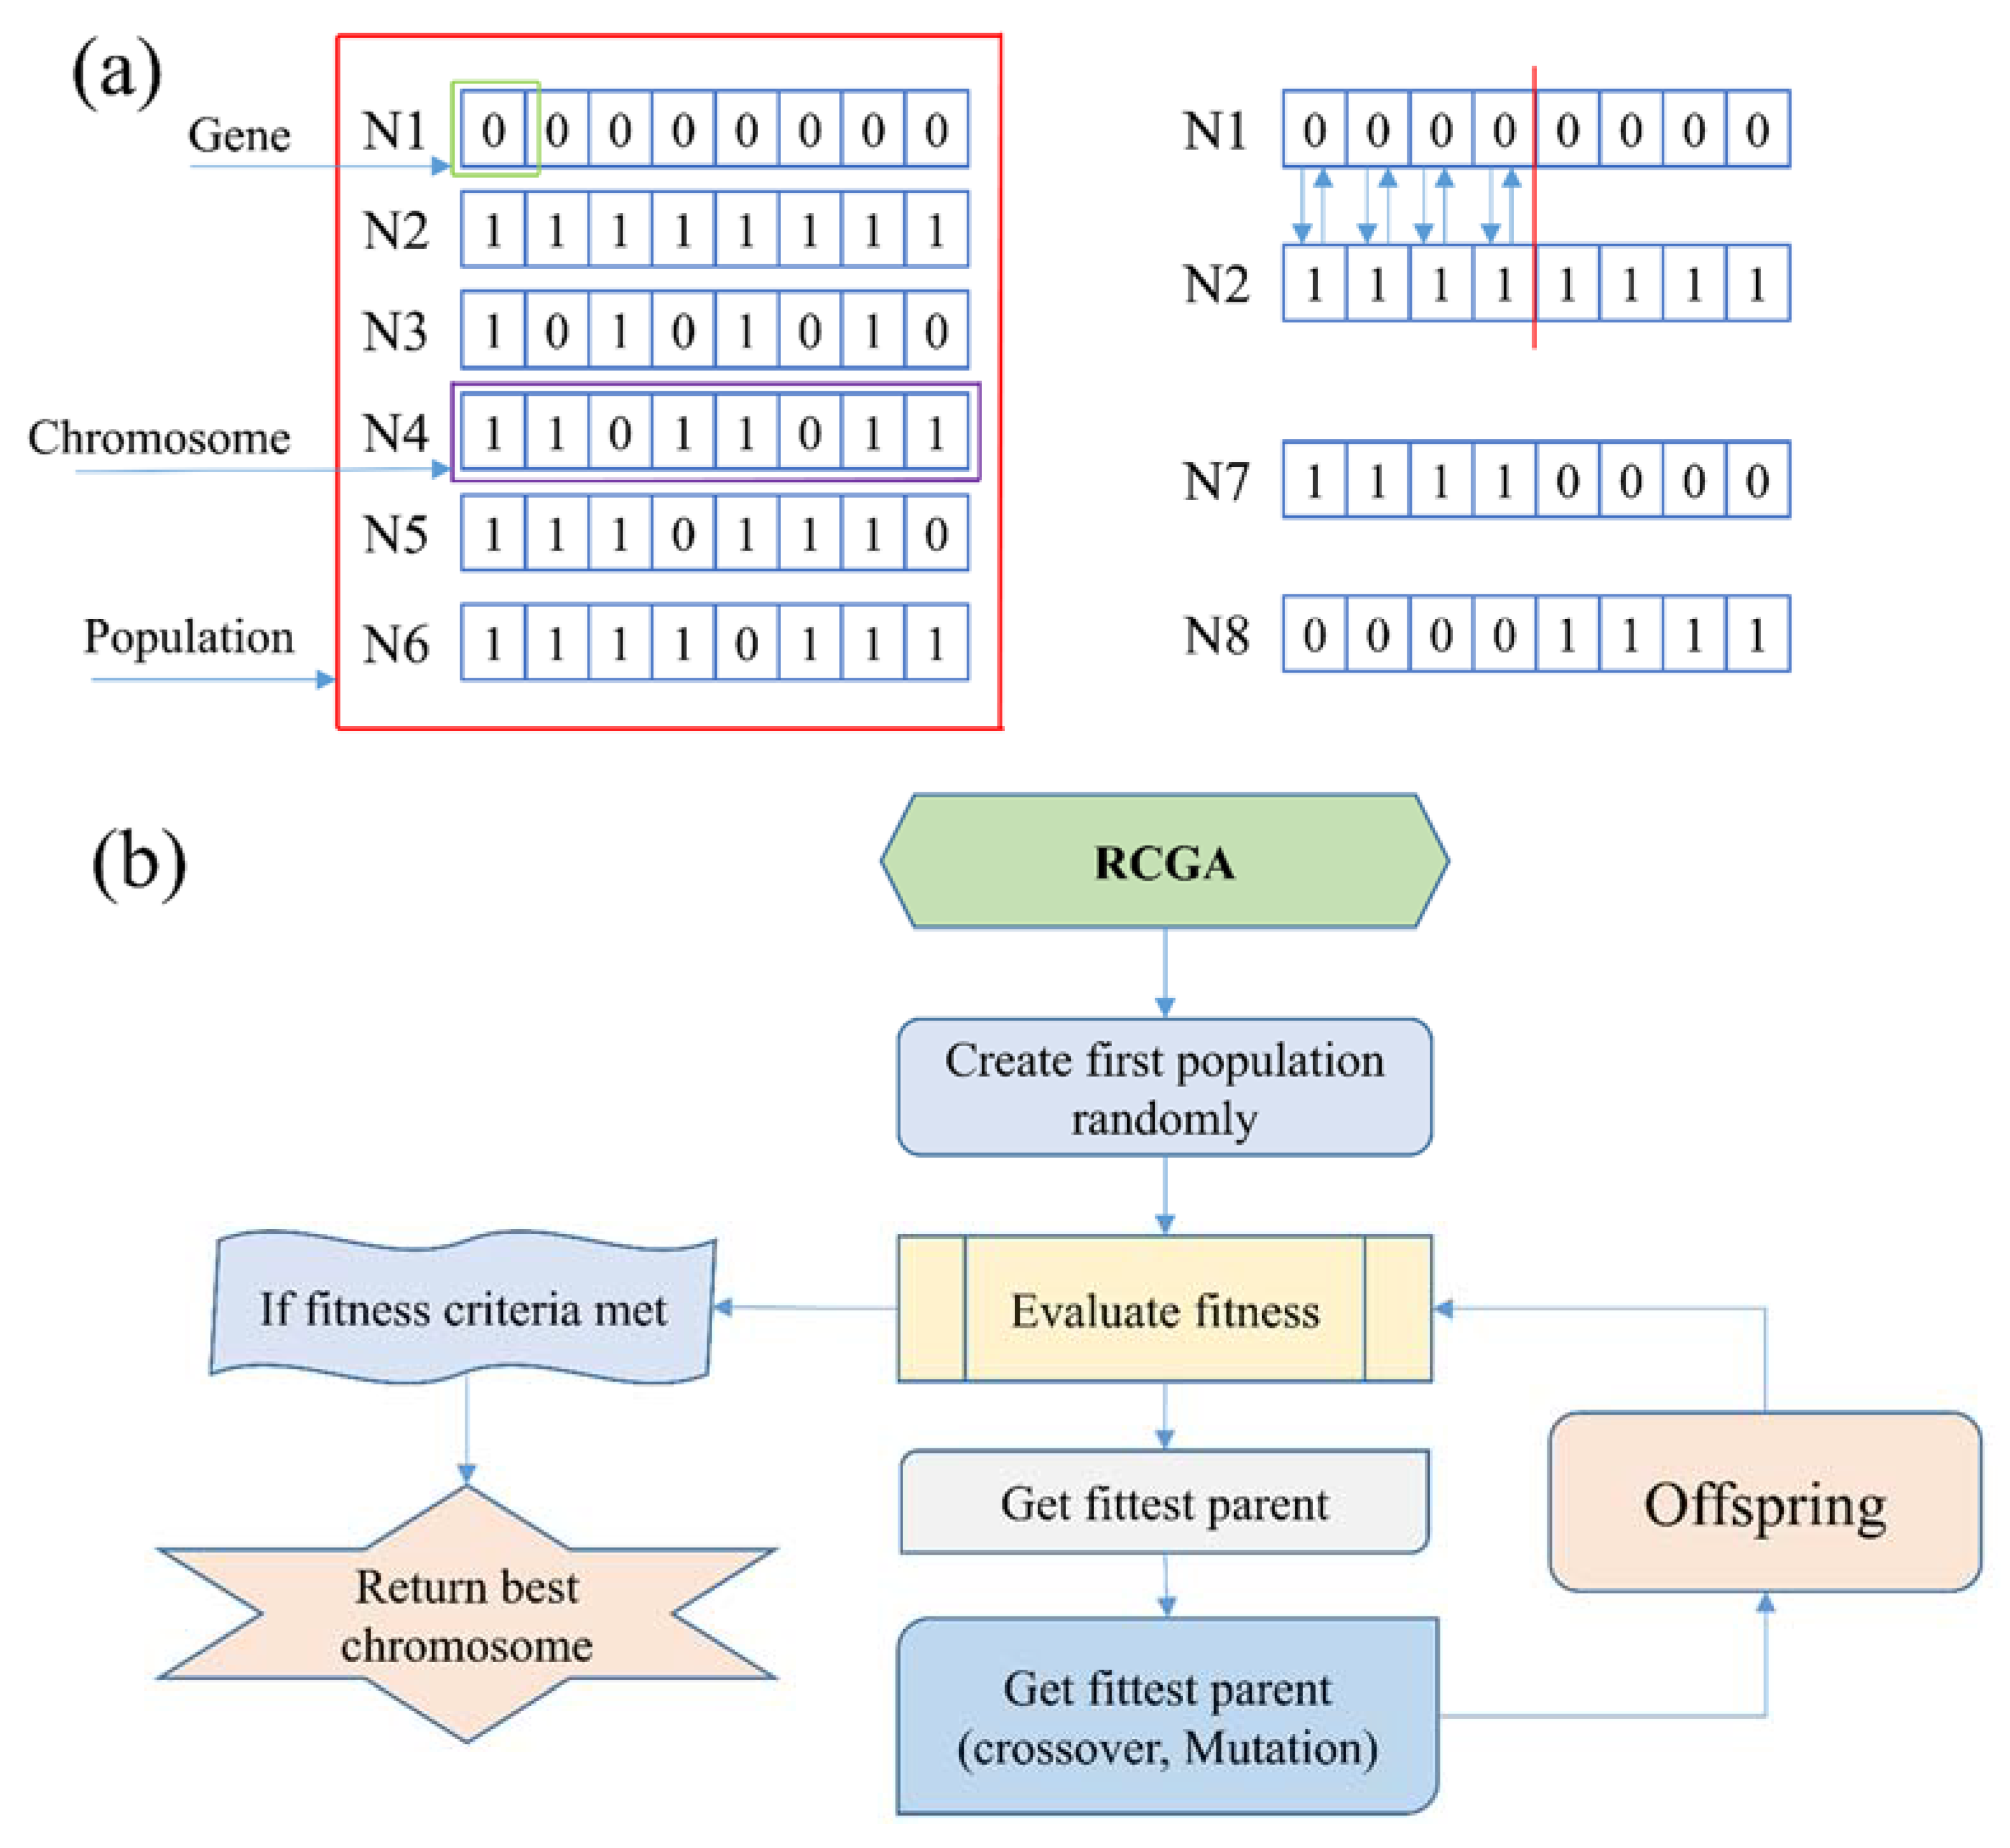
3.4. Real-Coded Genetic Algorithm (RCGA)
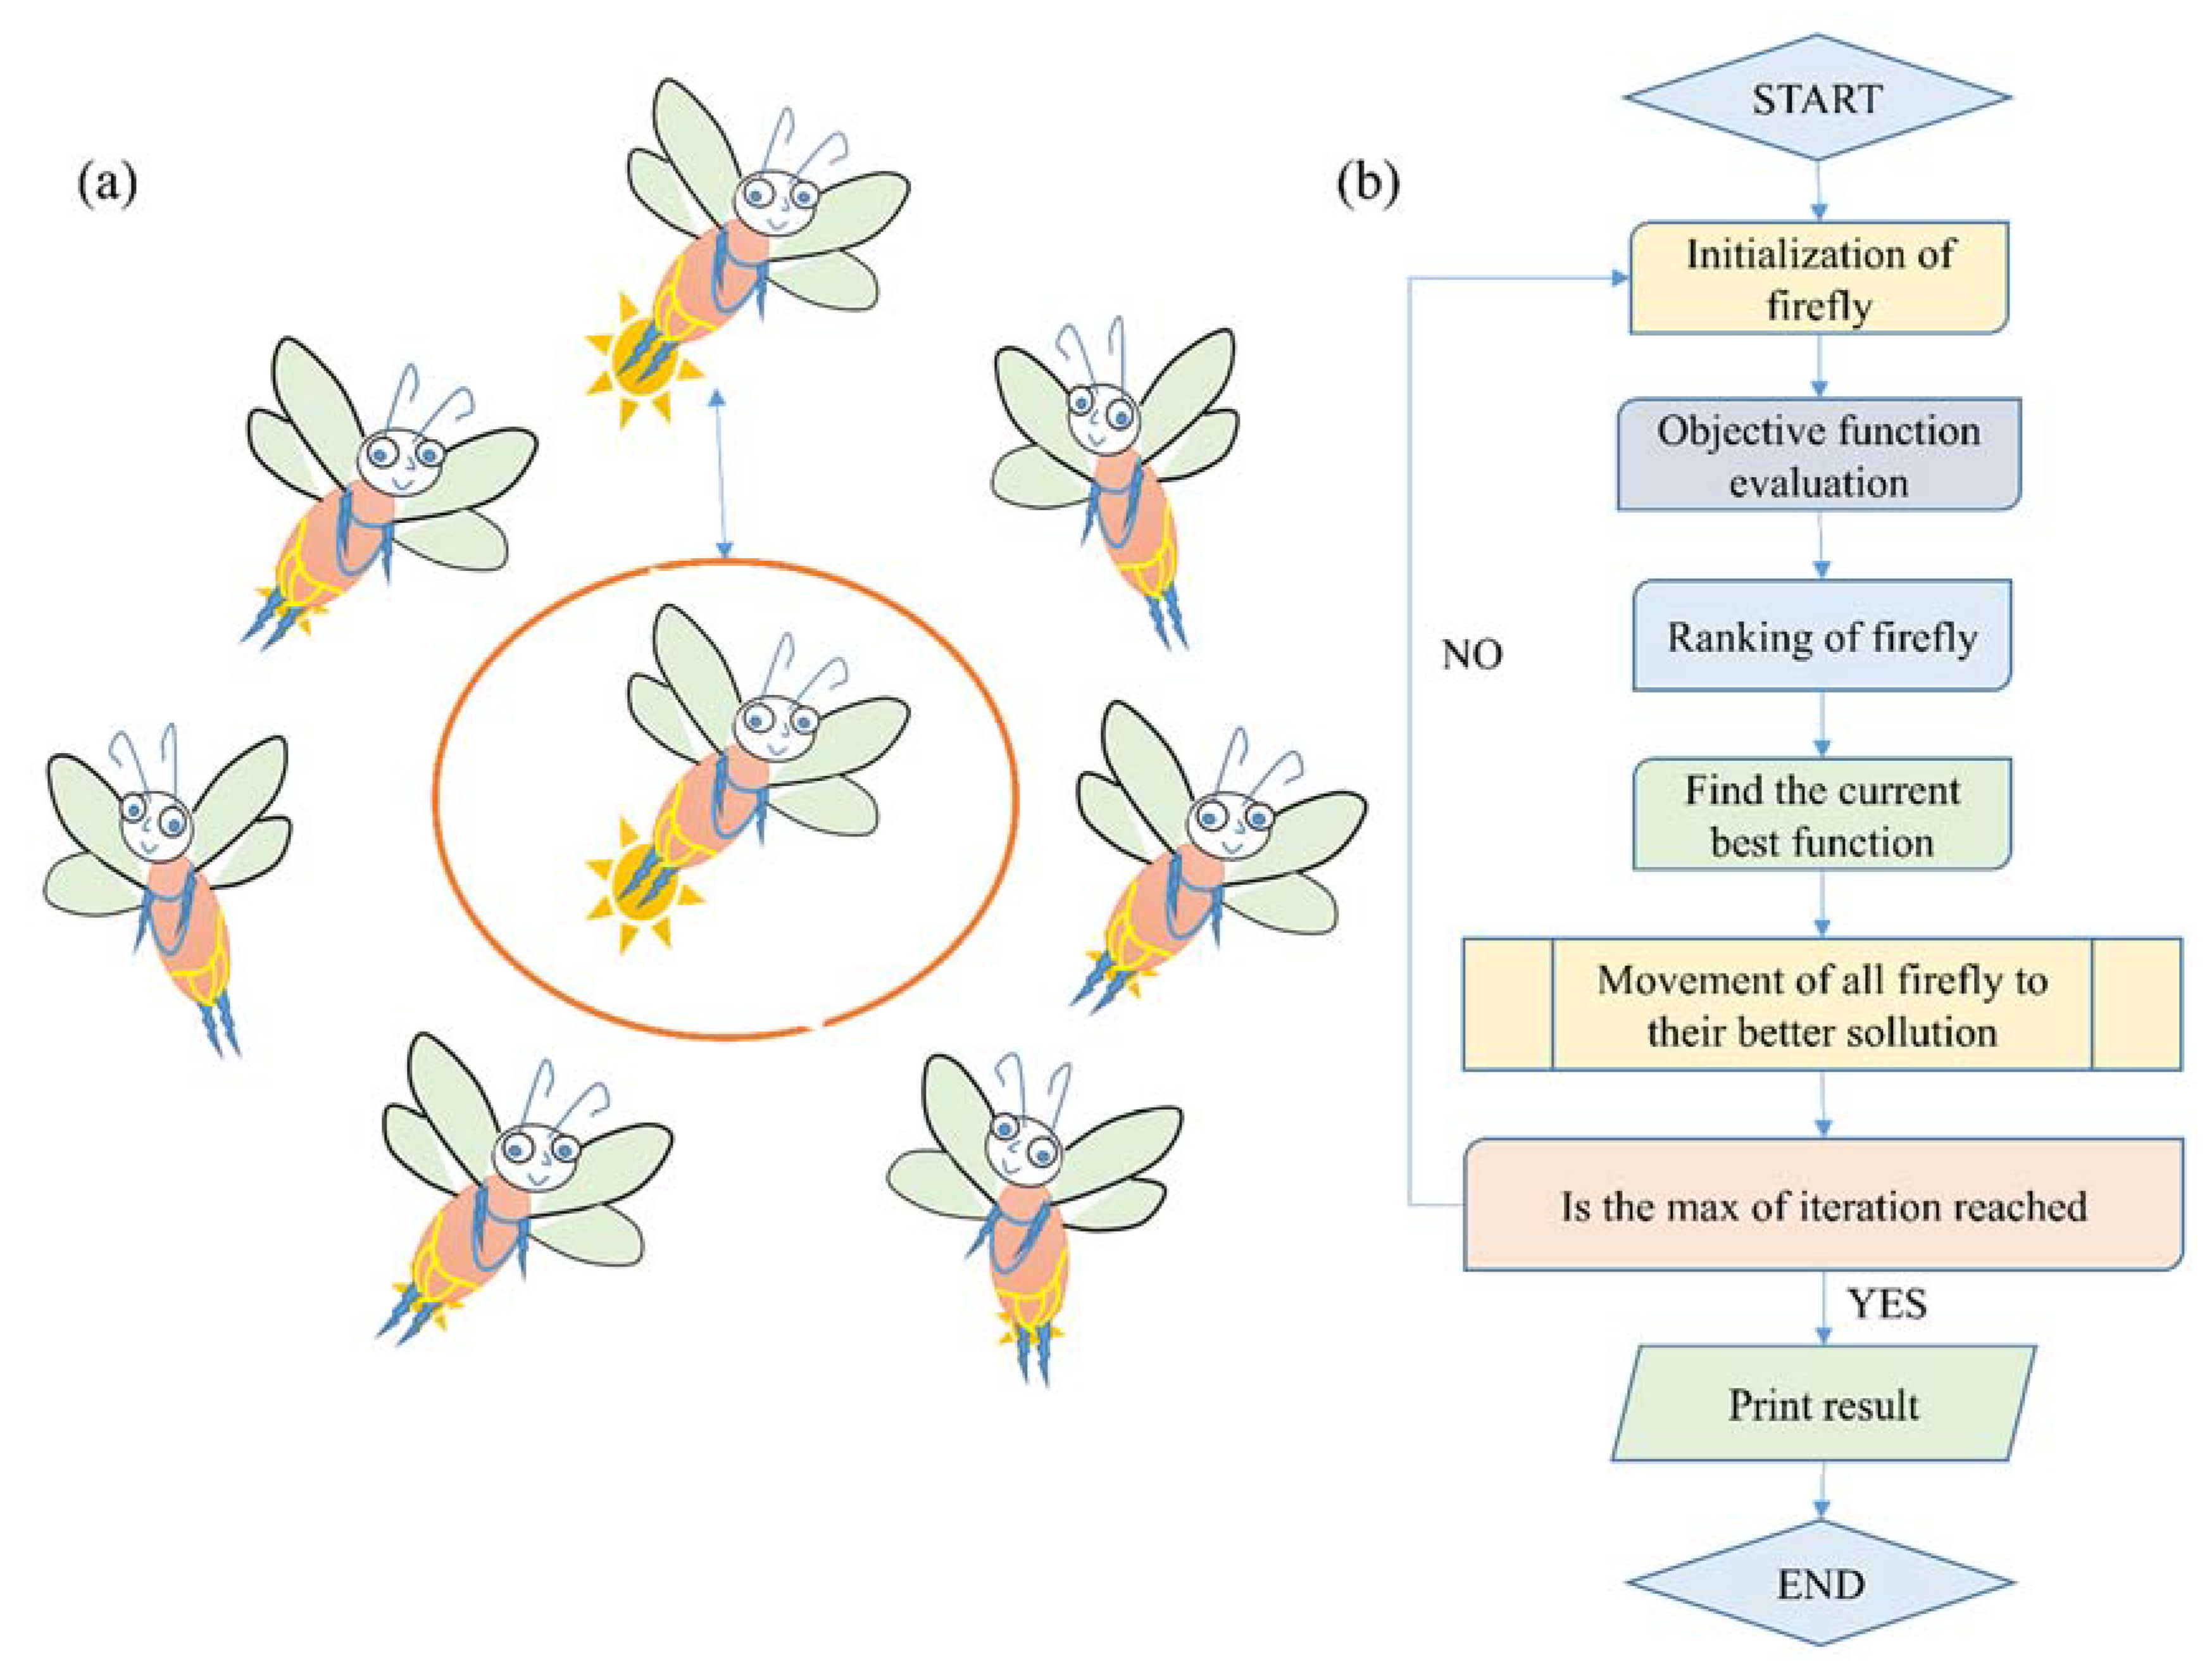
3.5. Firefly Algorithm (FFA)
3.6. Machine Learning Evaluation Criteria
4. Results and Analysis
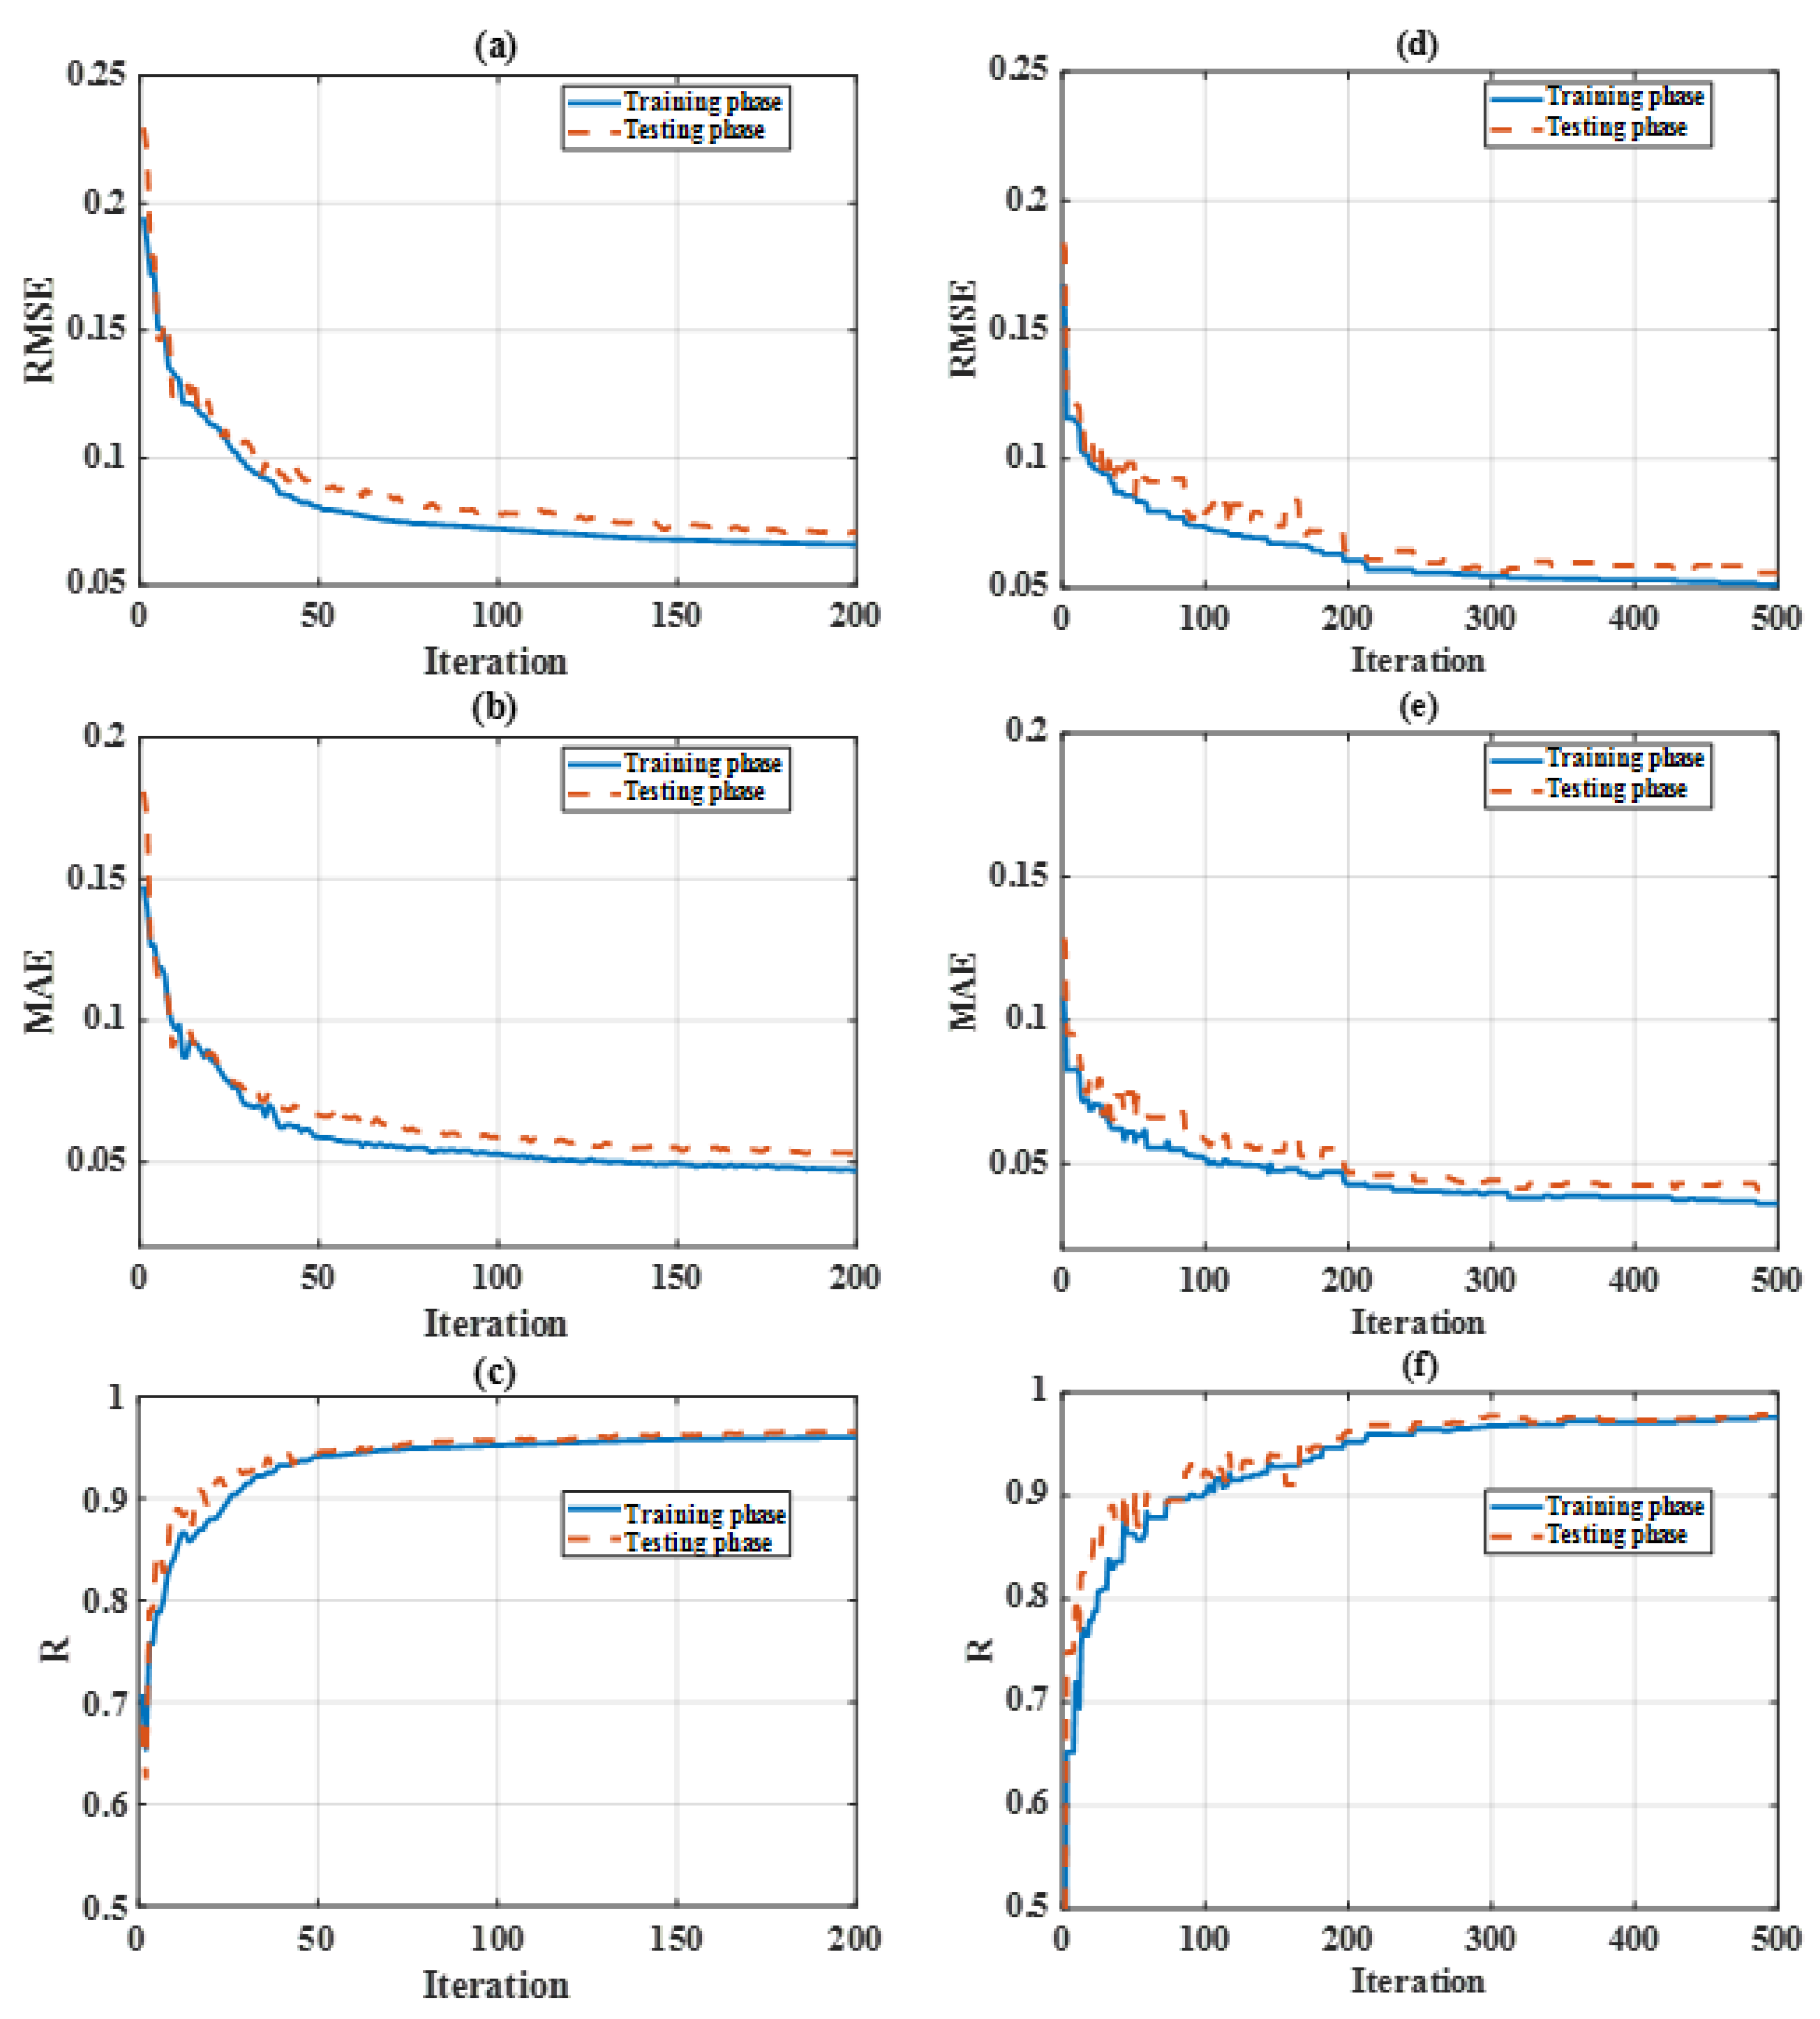
4.1. Construction of the Hybrid Models (NN-RCGA and NN-FFA)
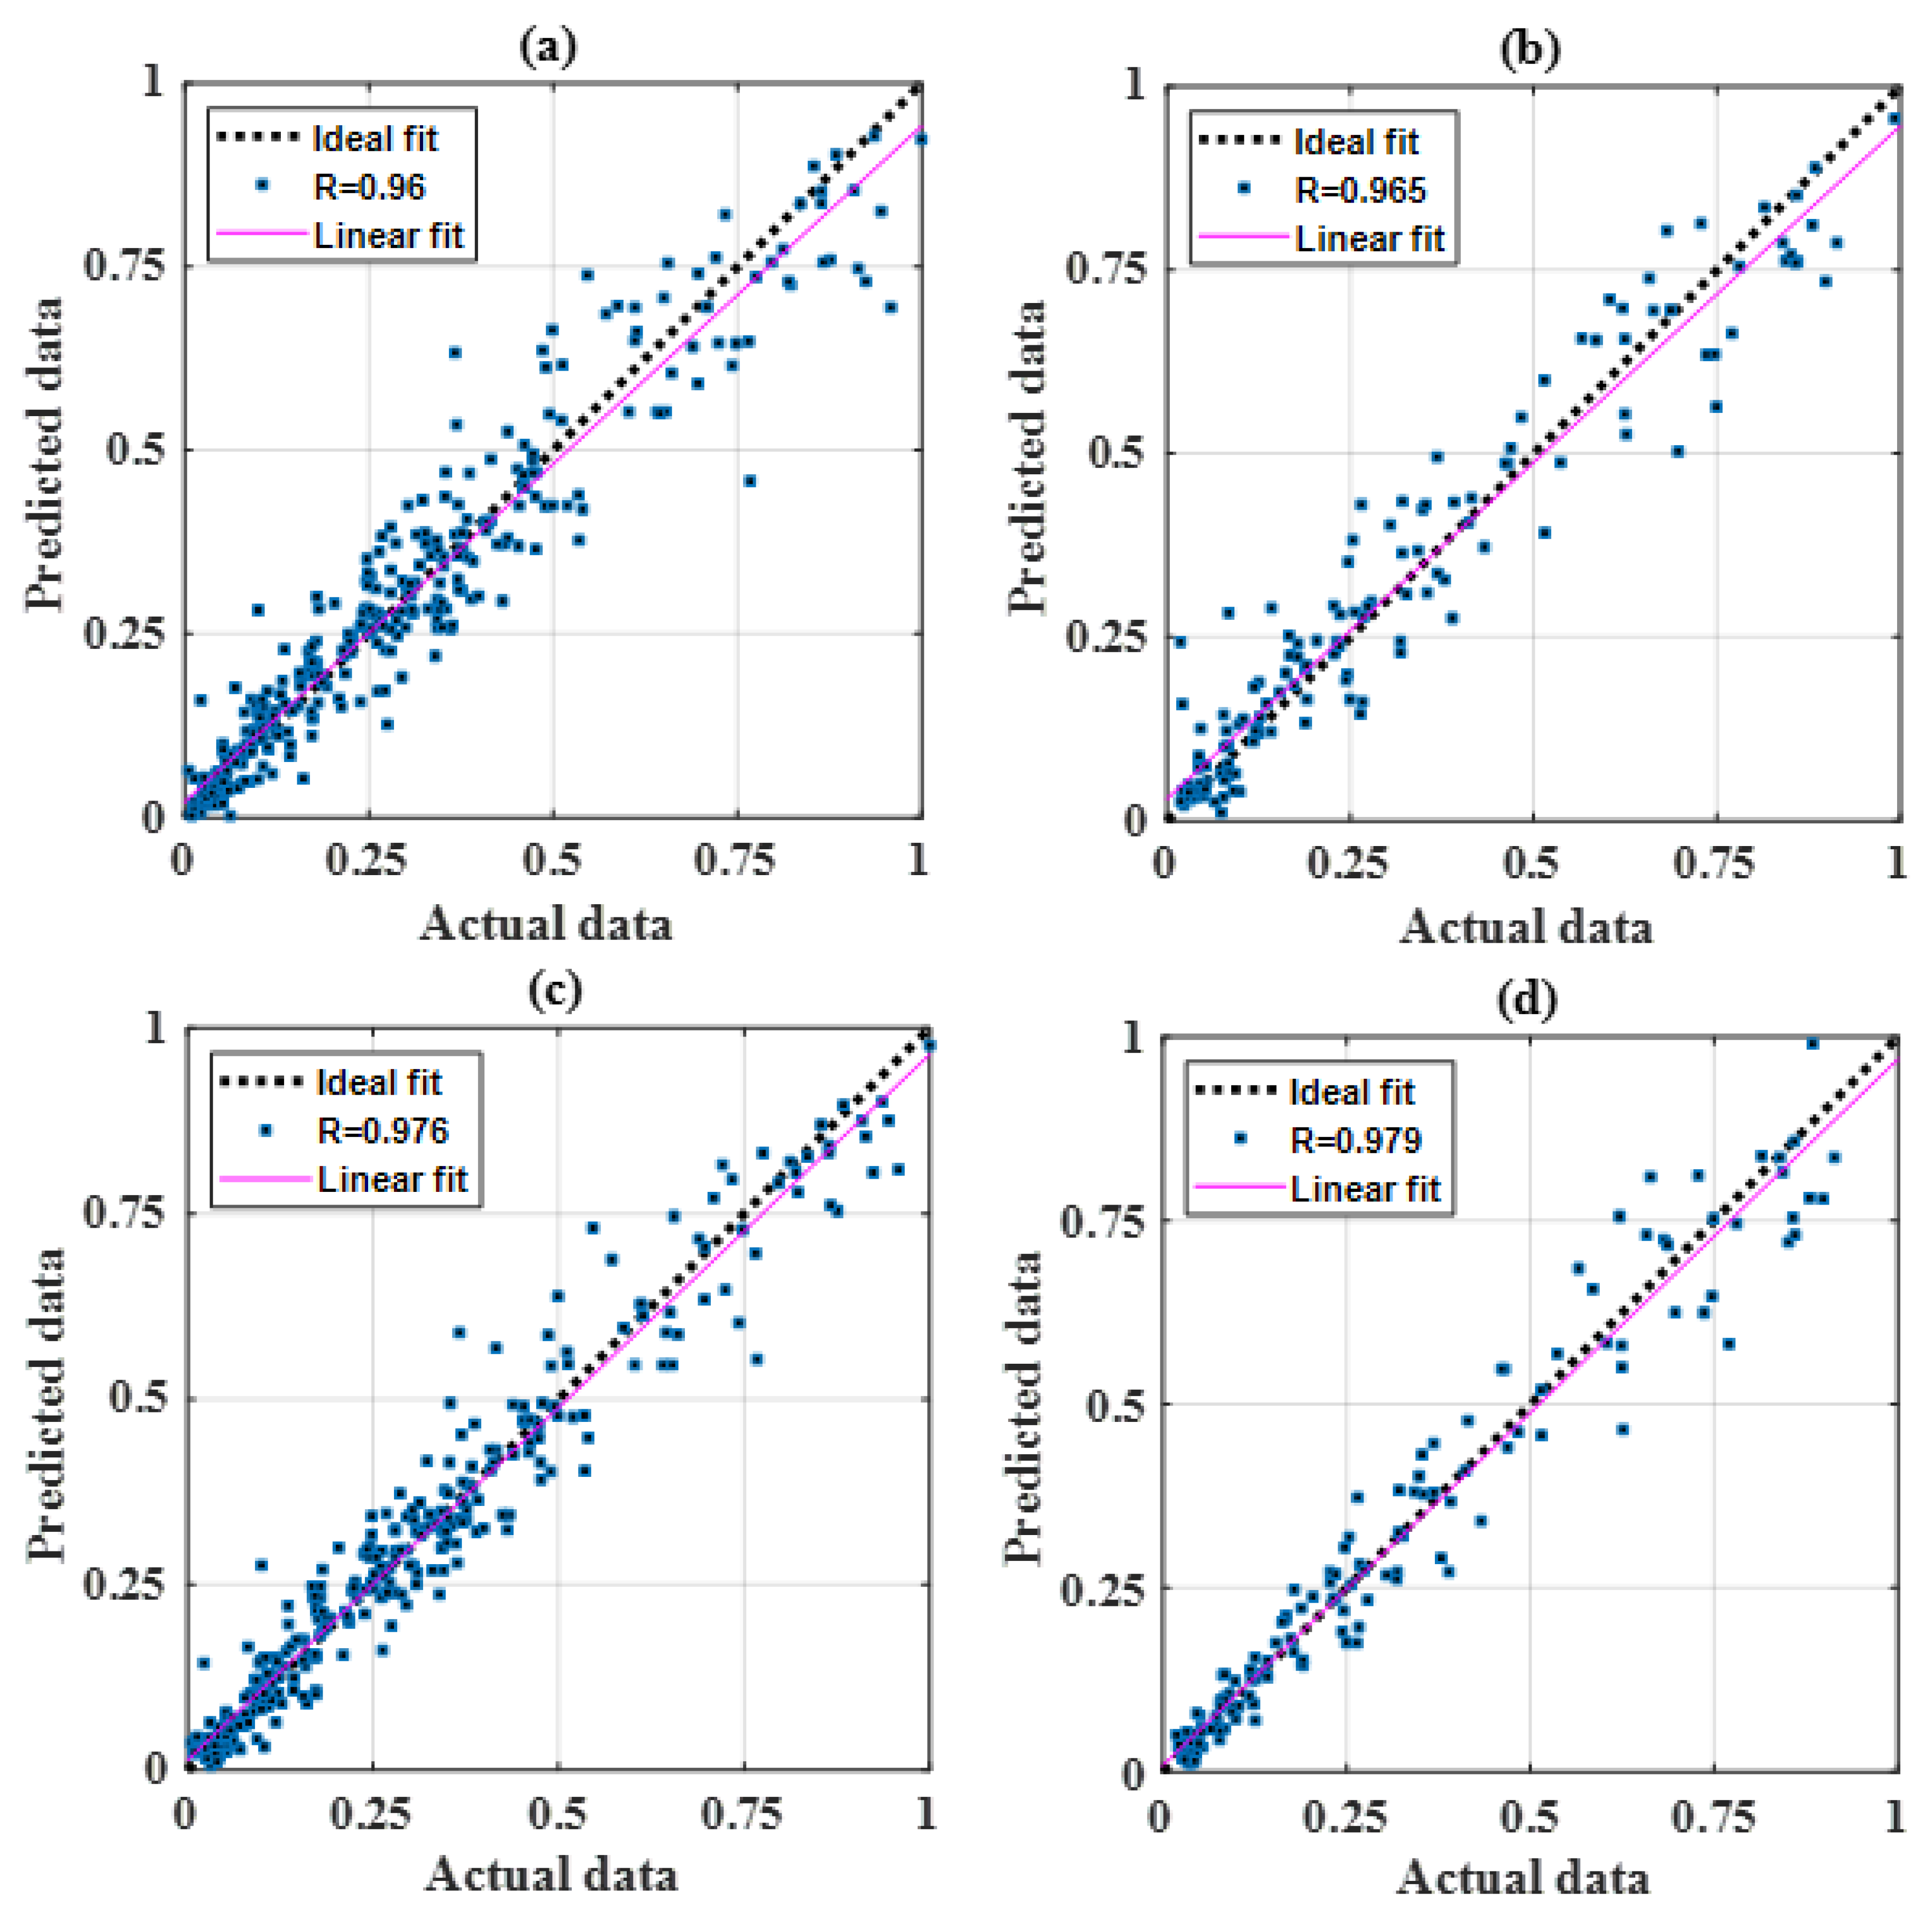
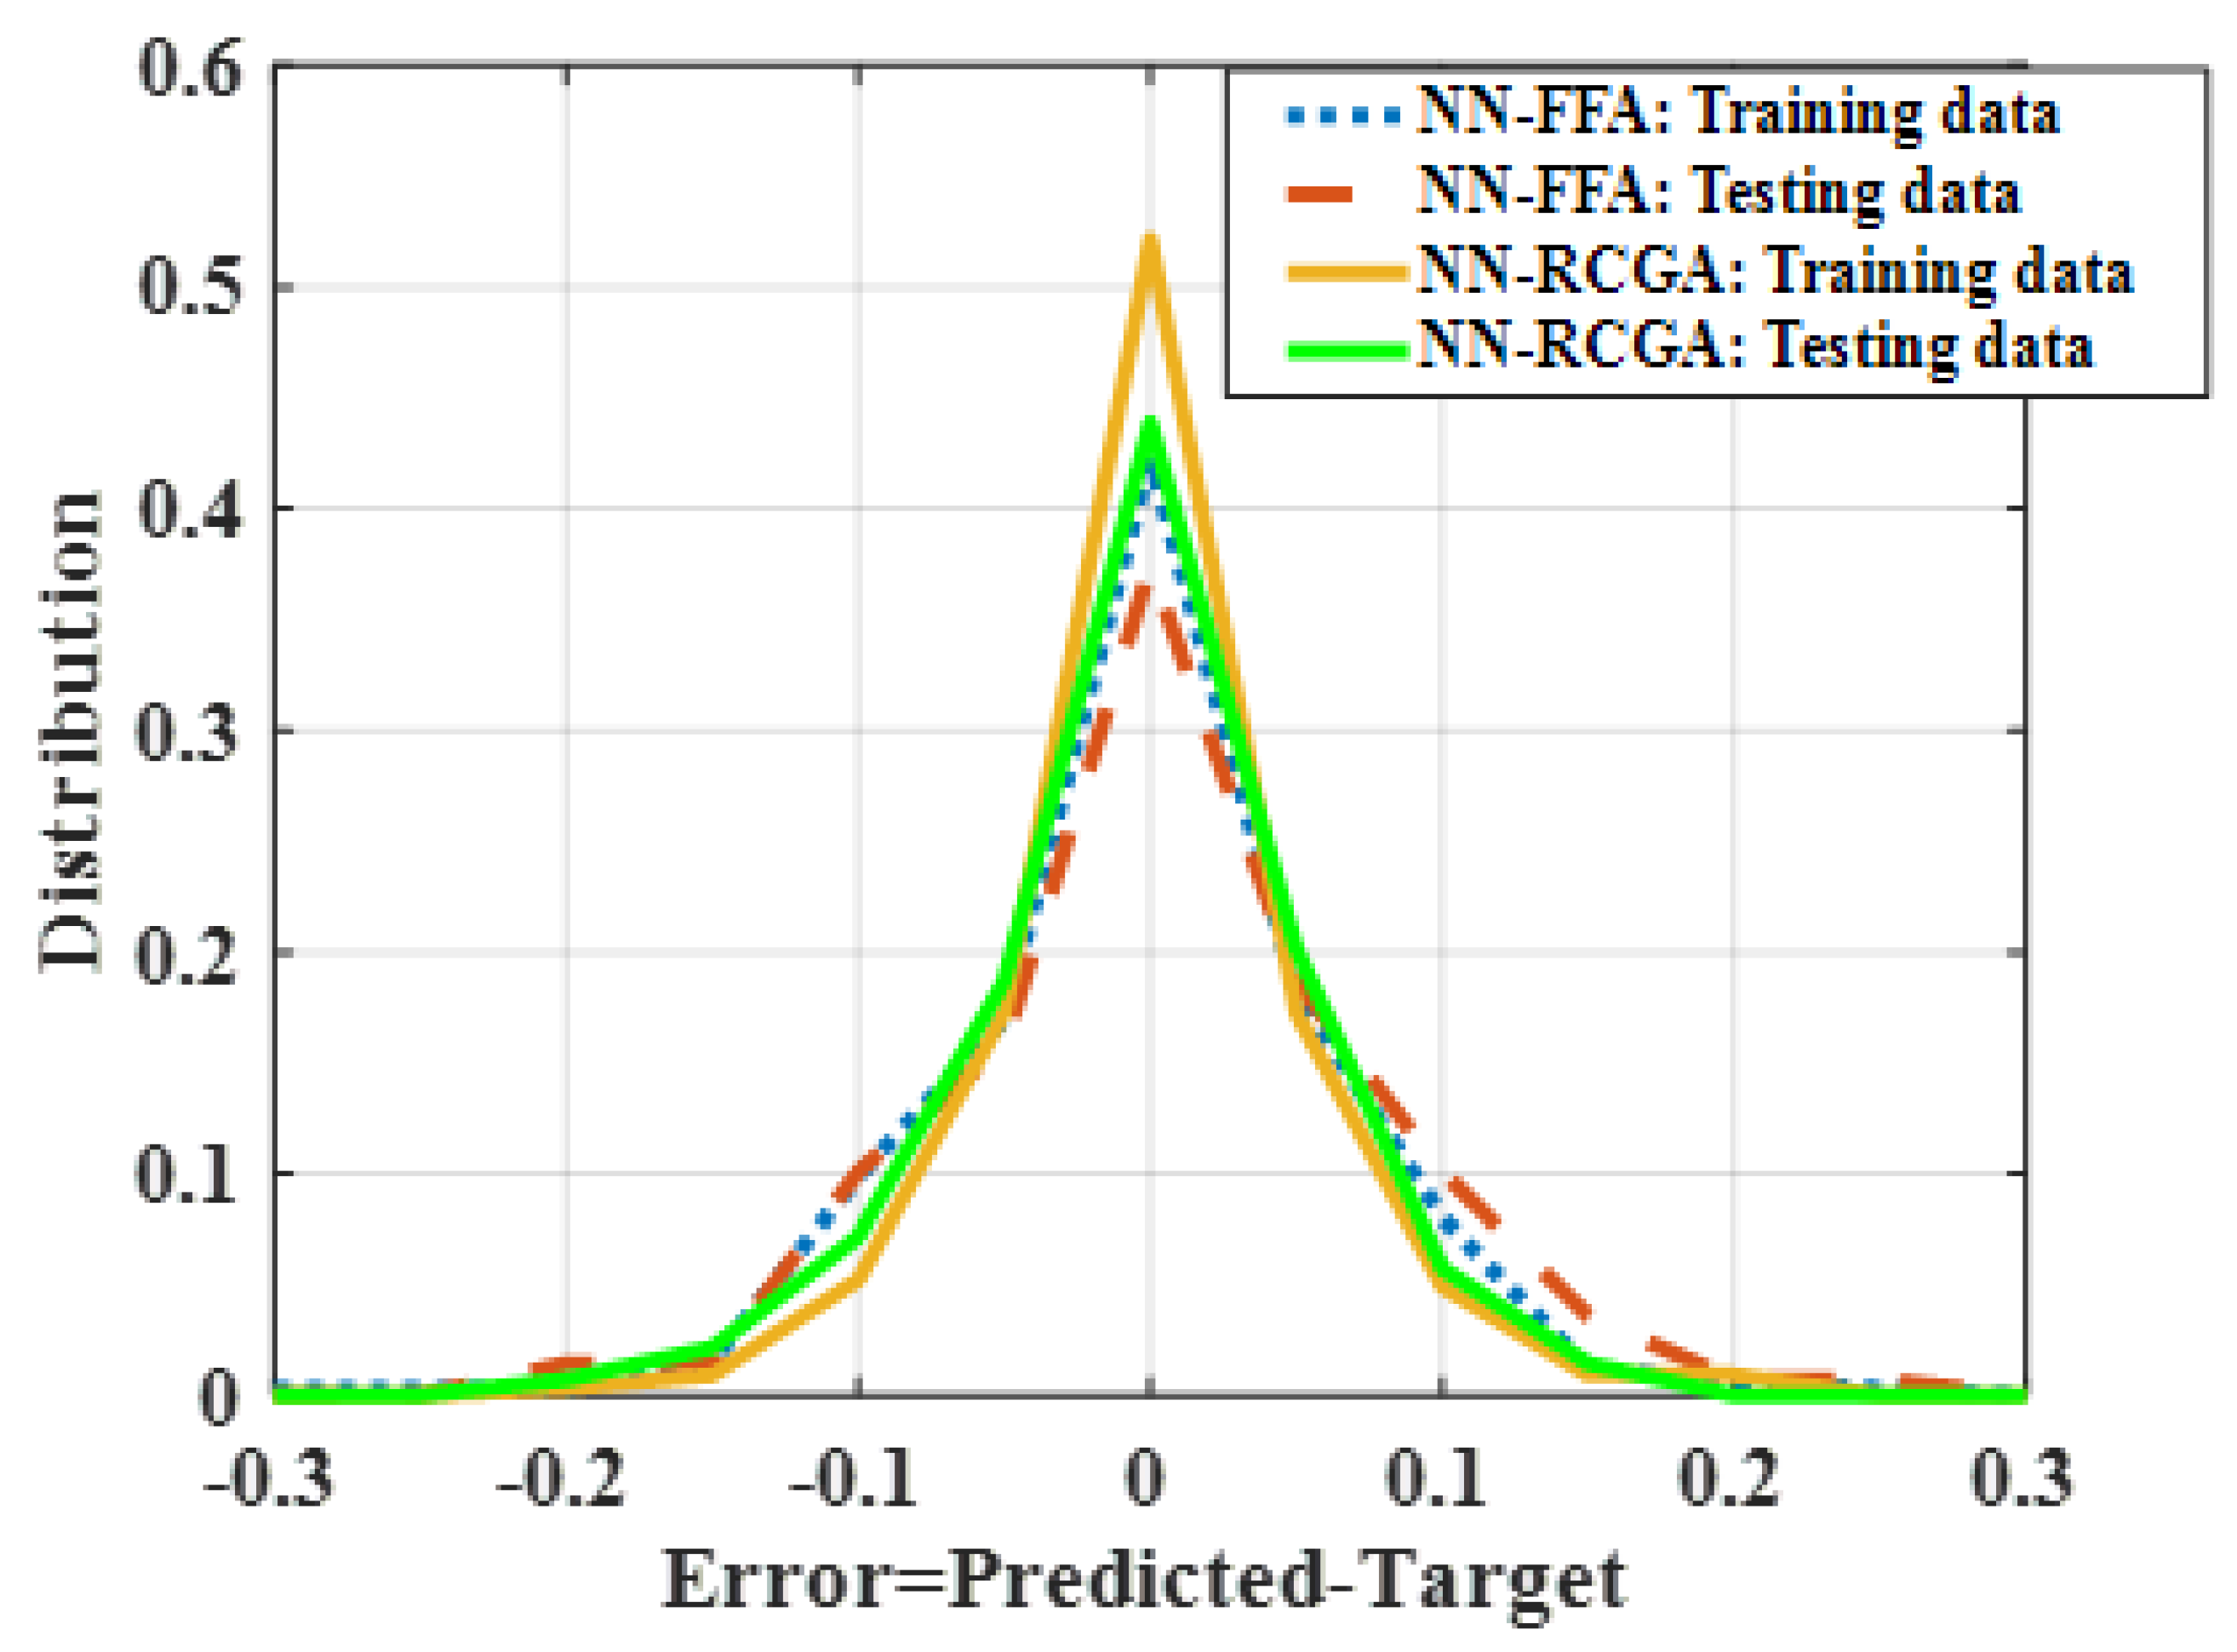
4.2. Validation and Comparison of the Hybrid Models
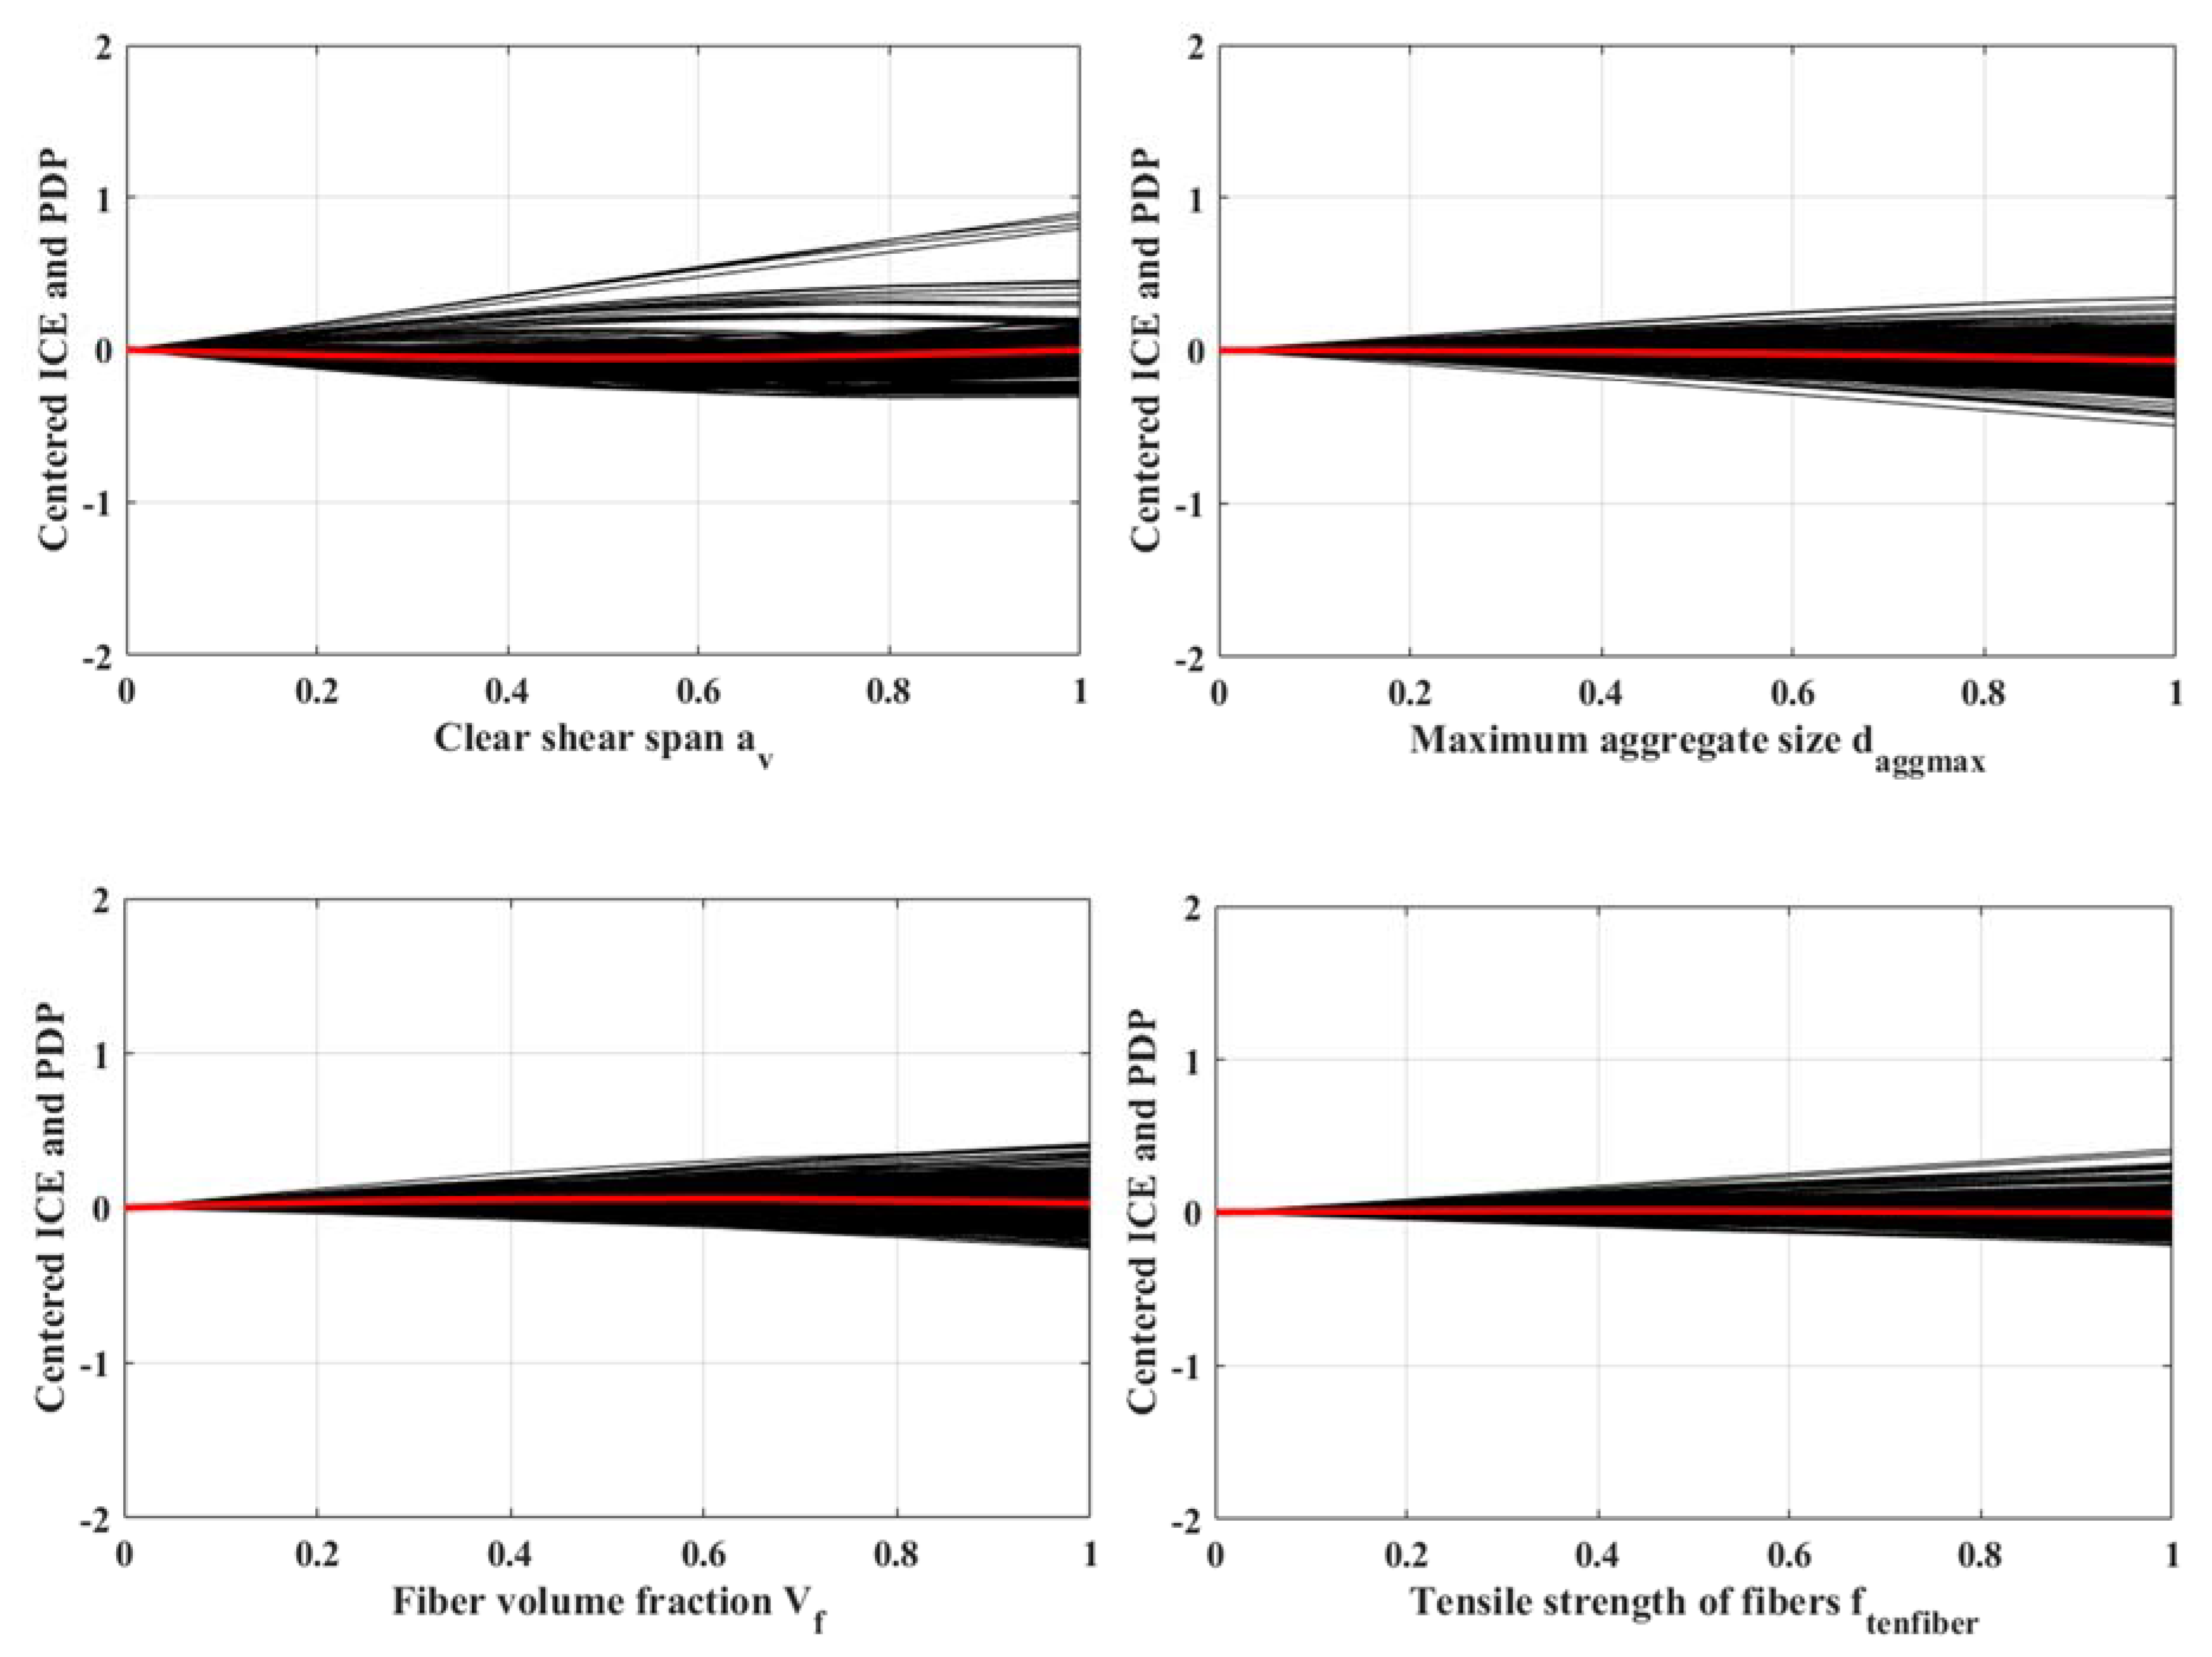
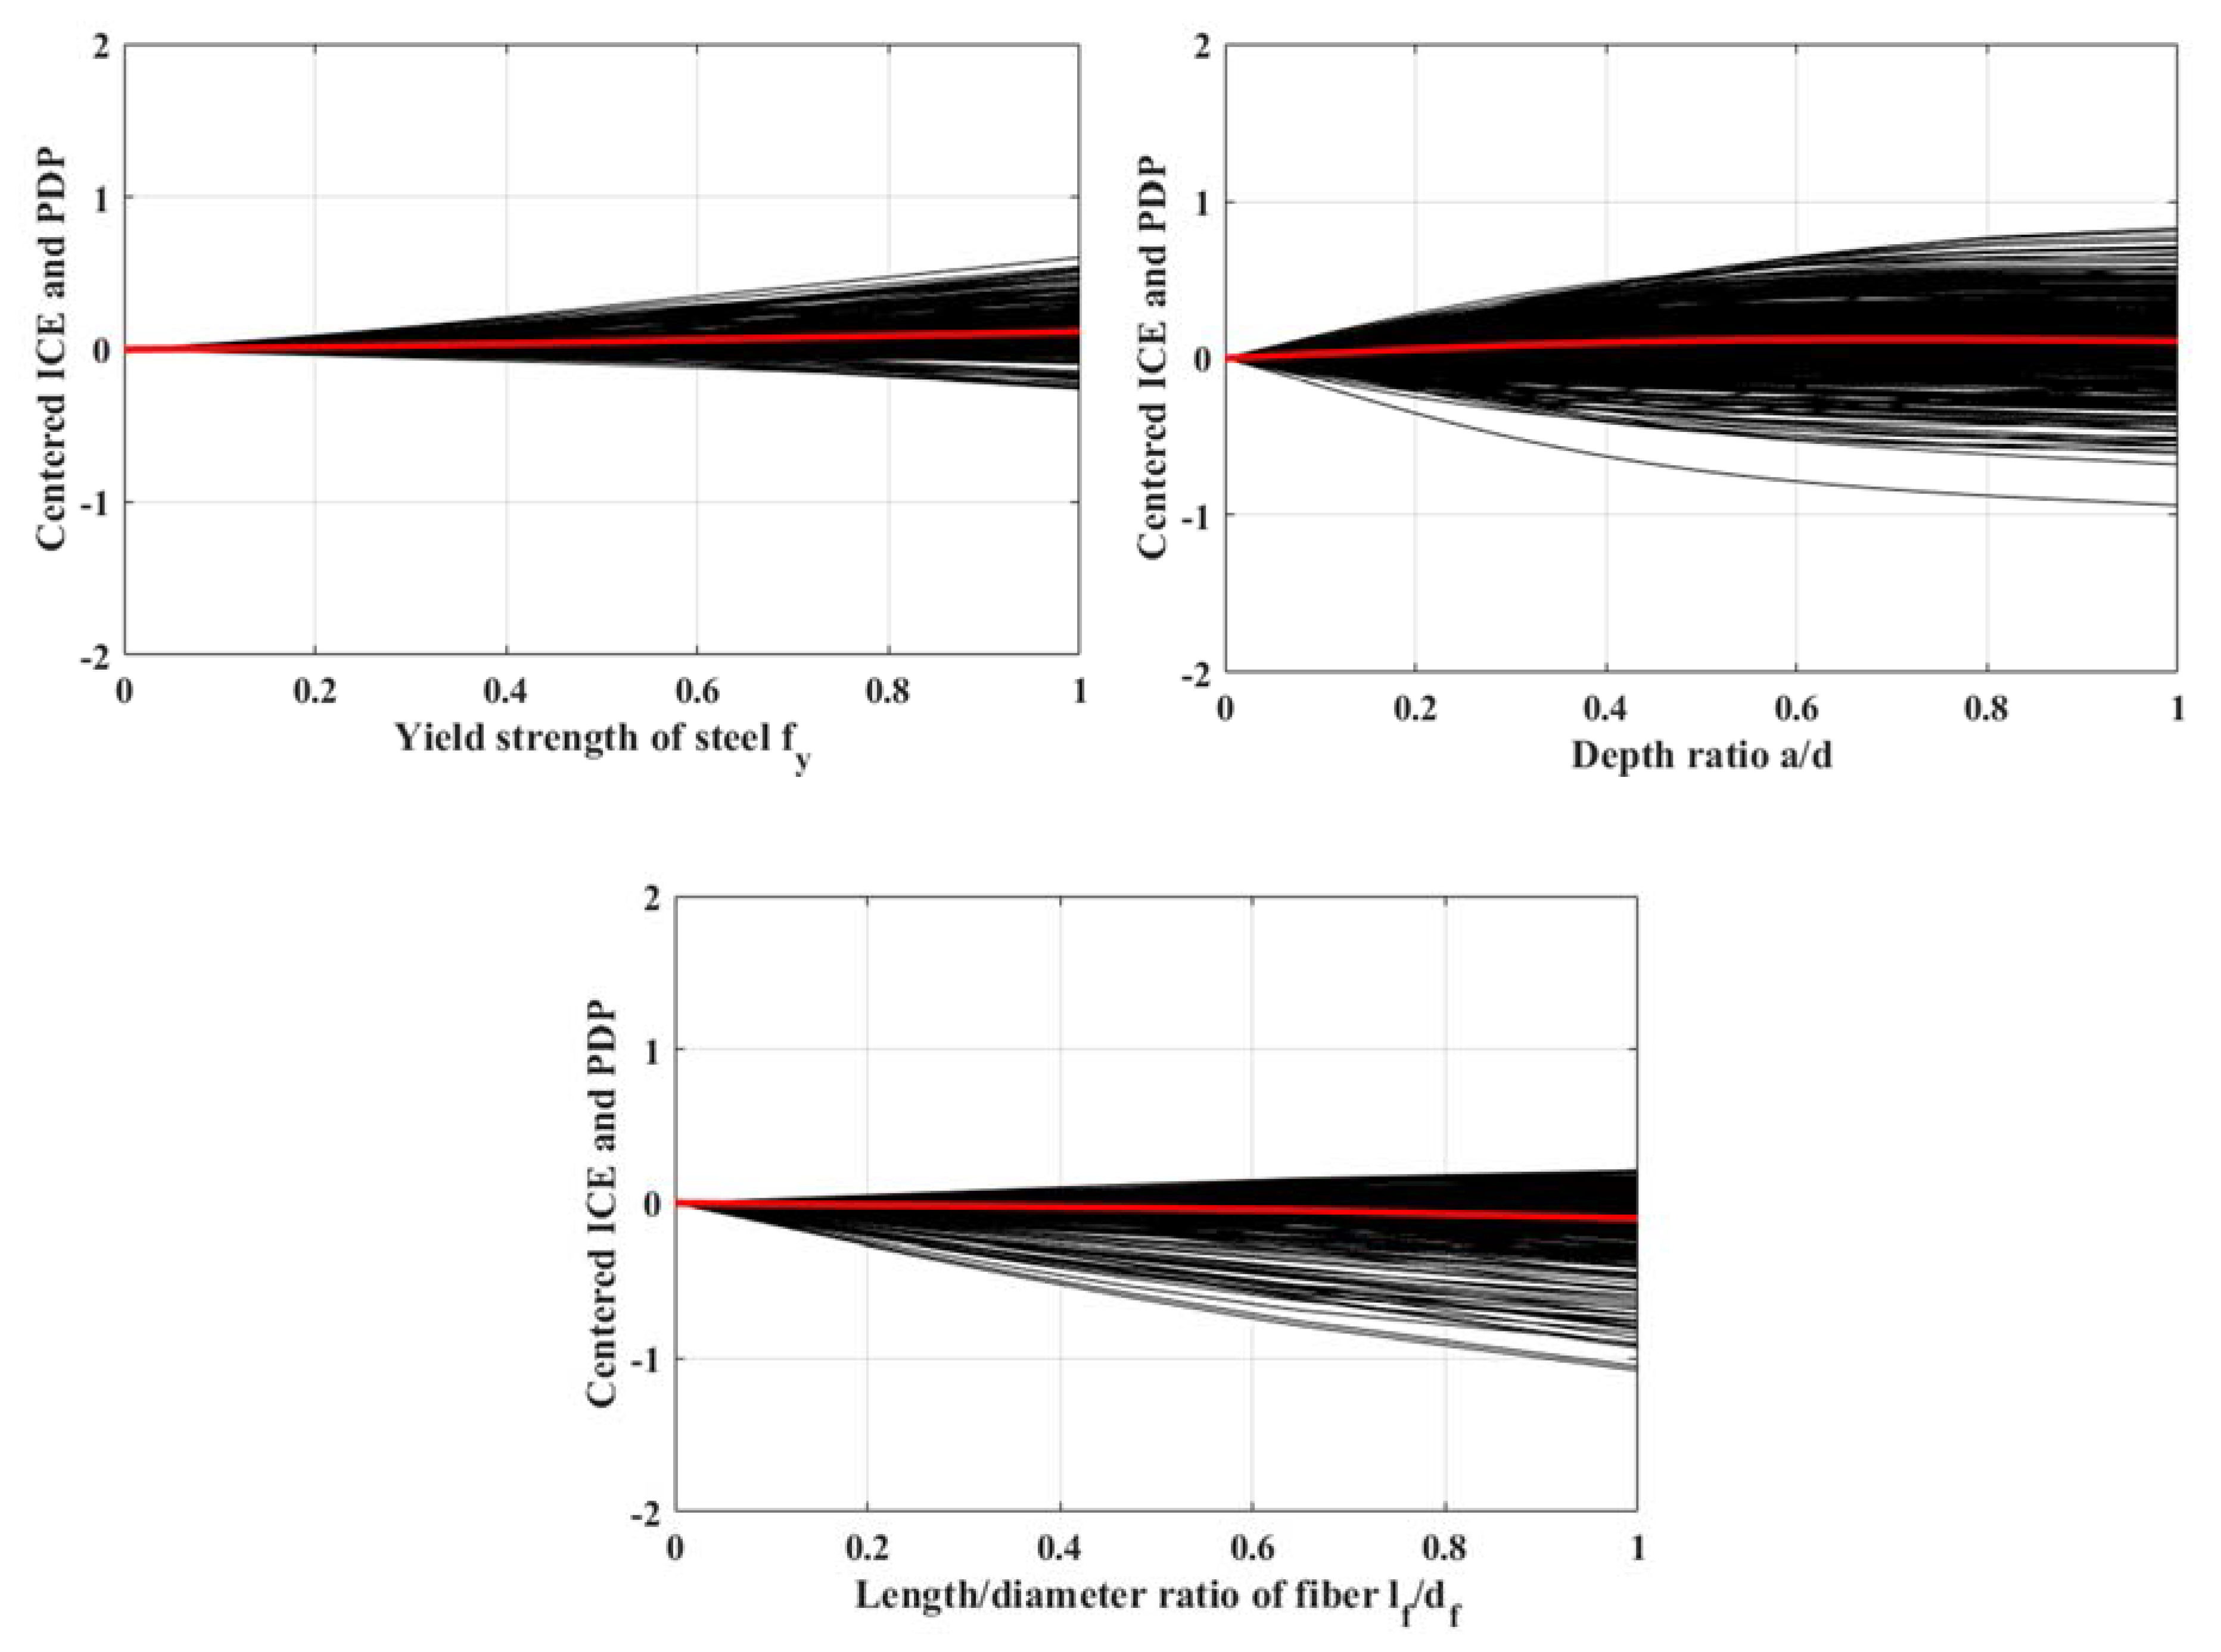
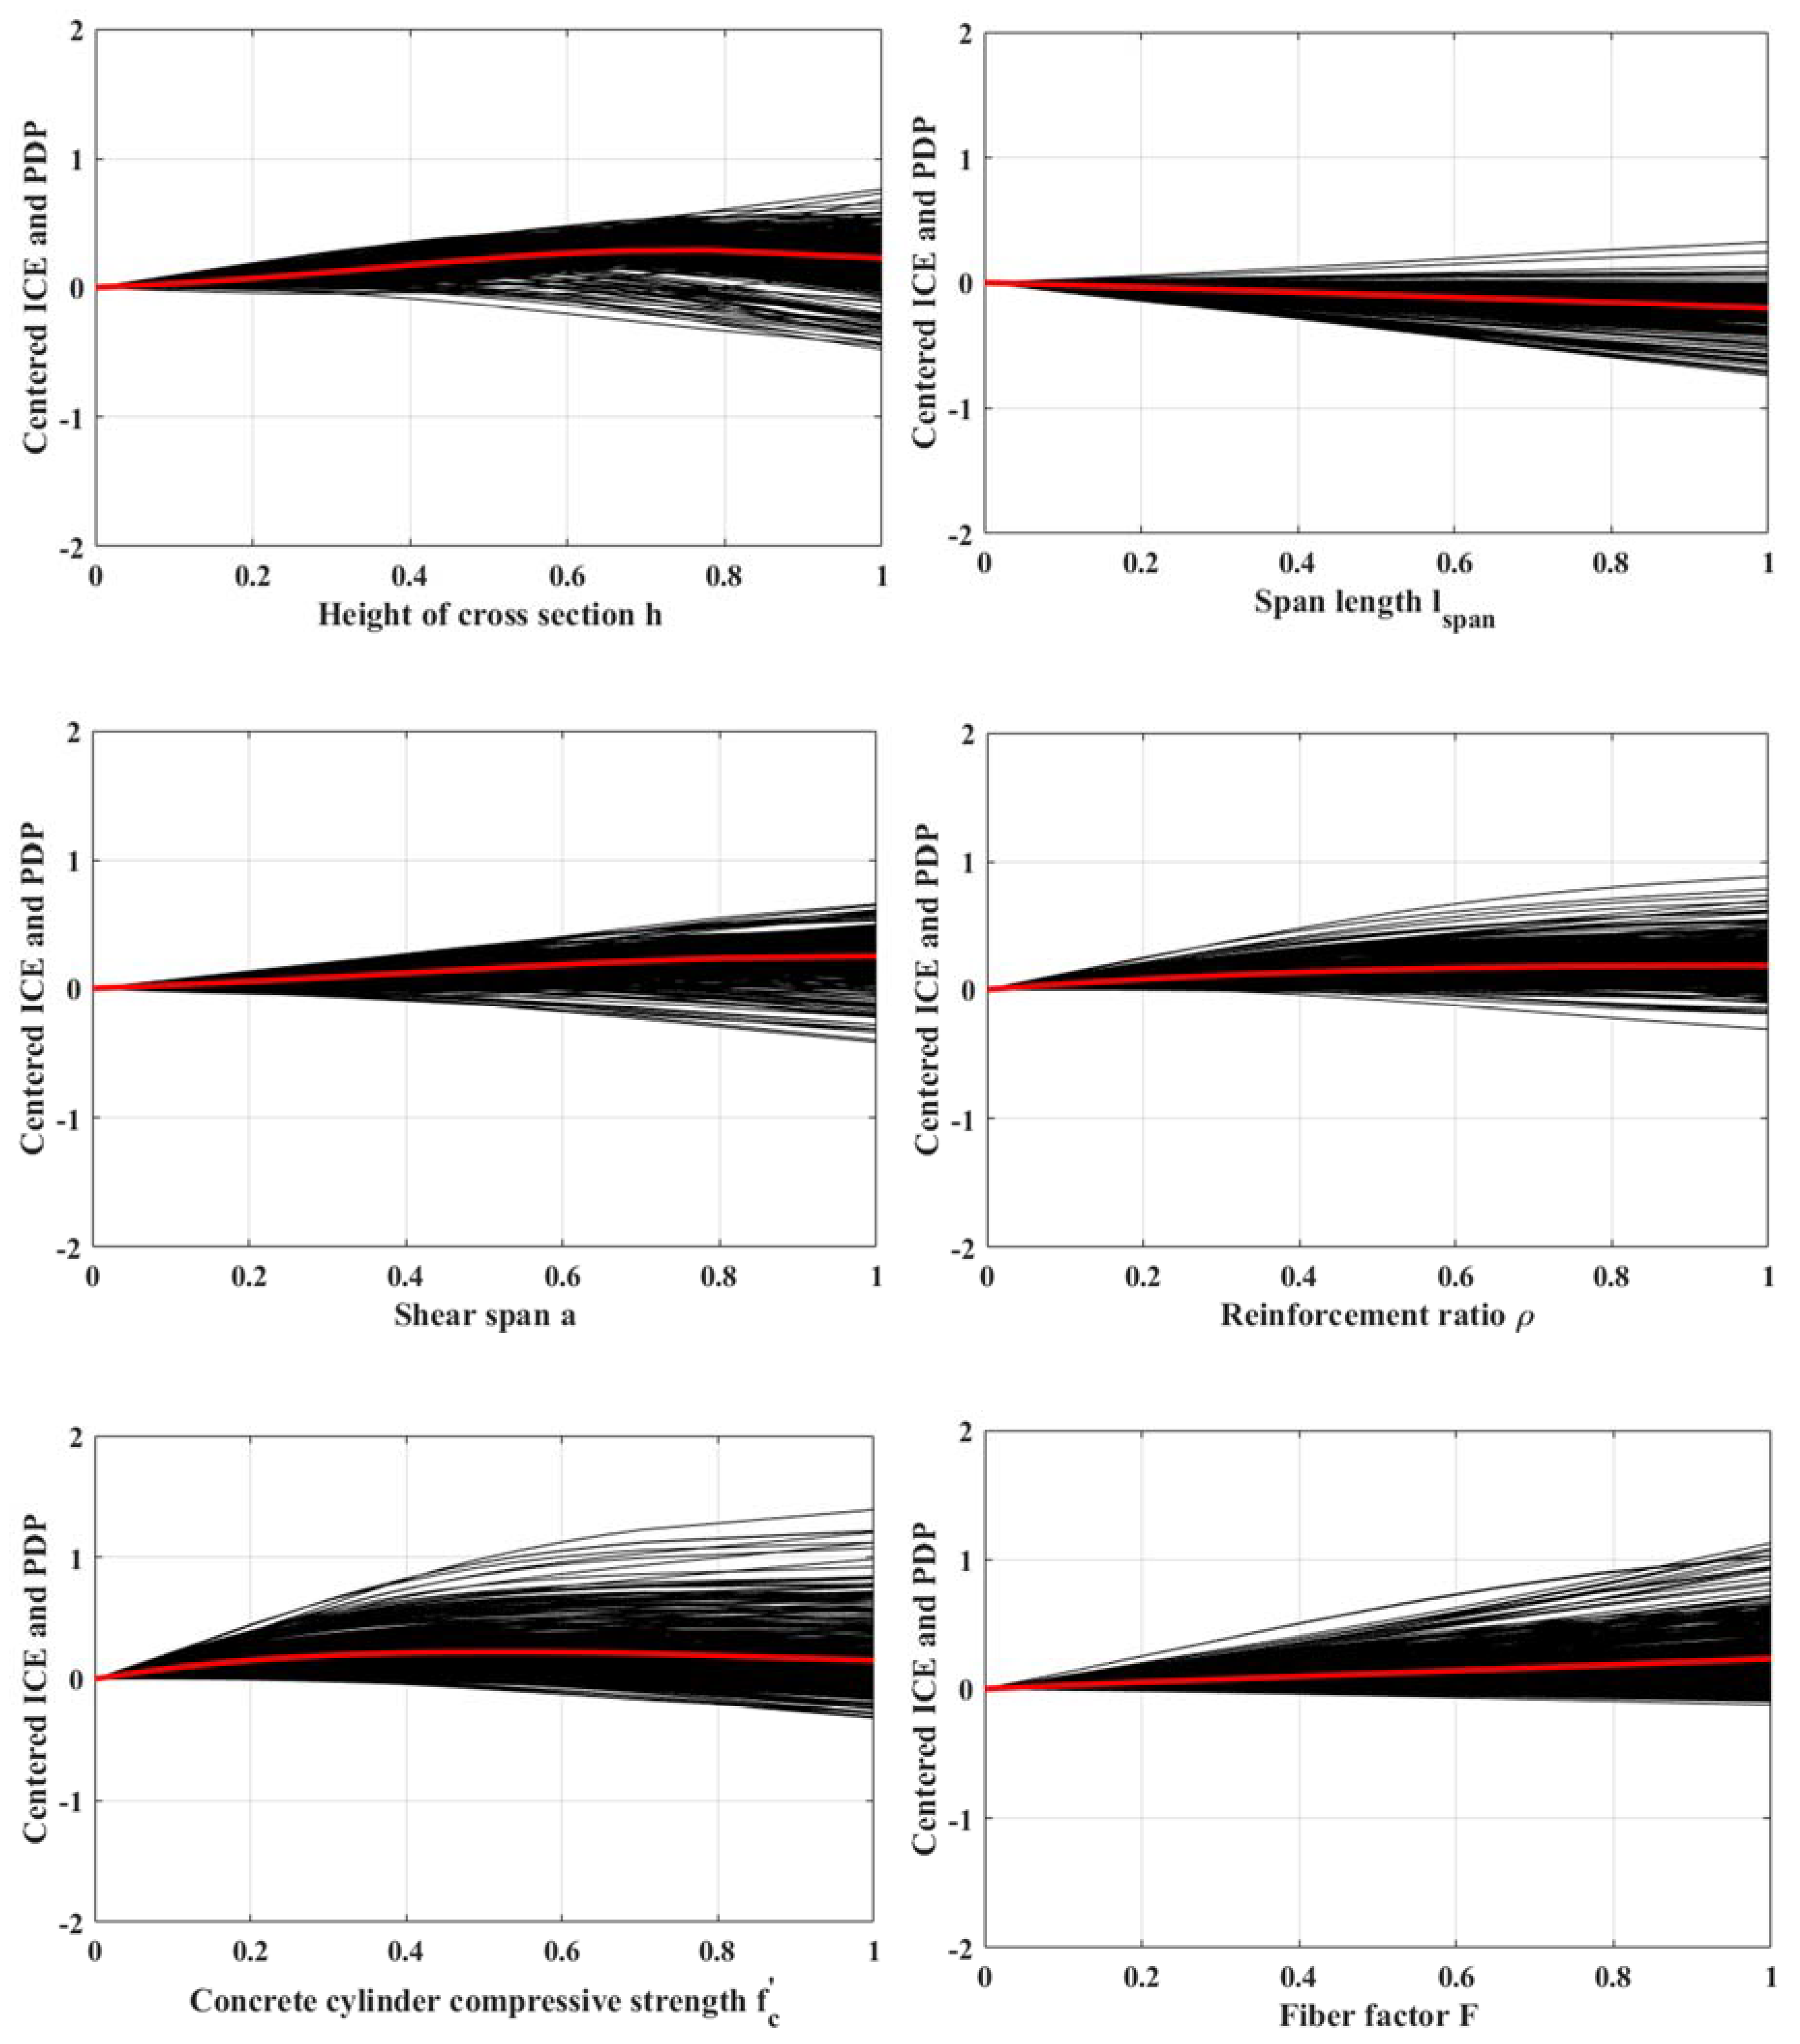
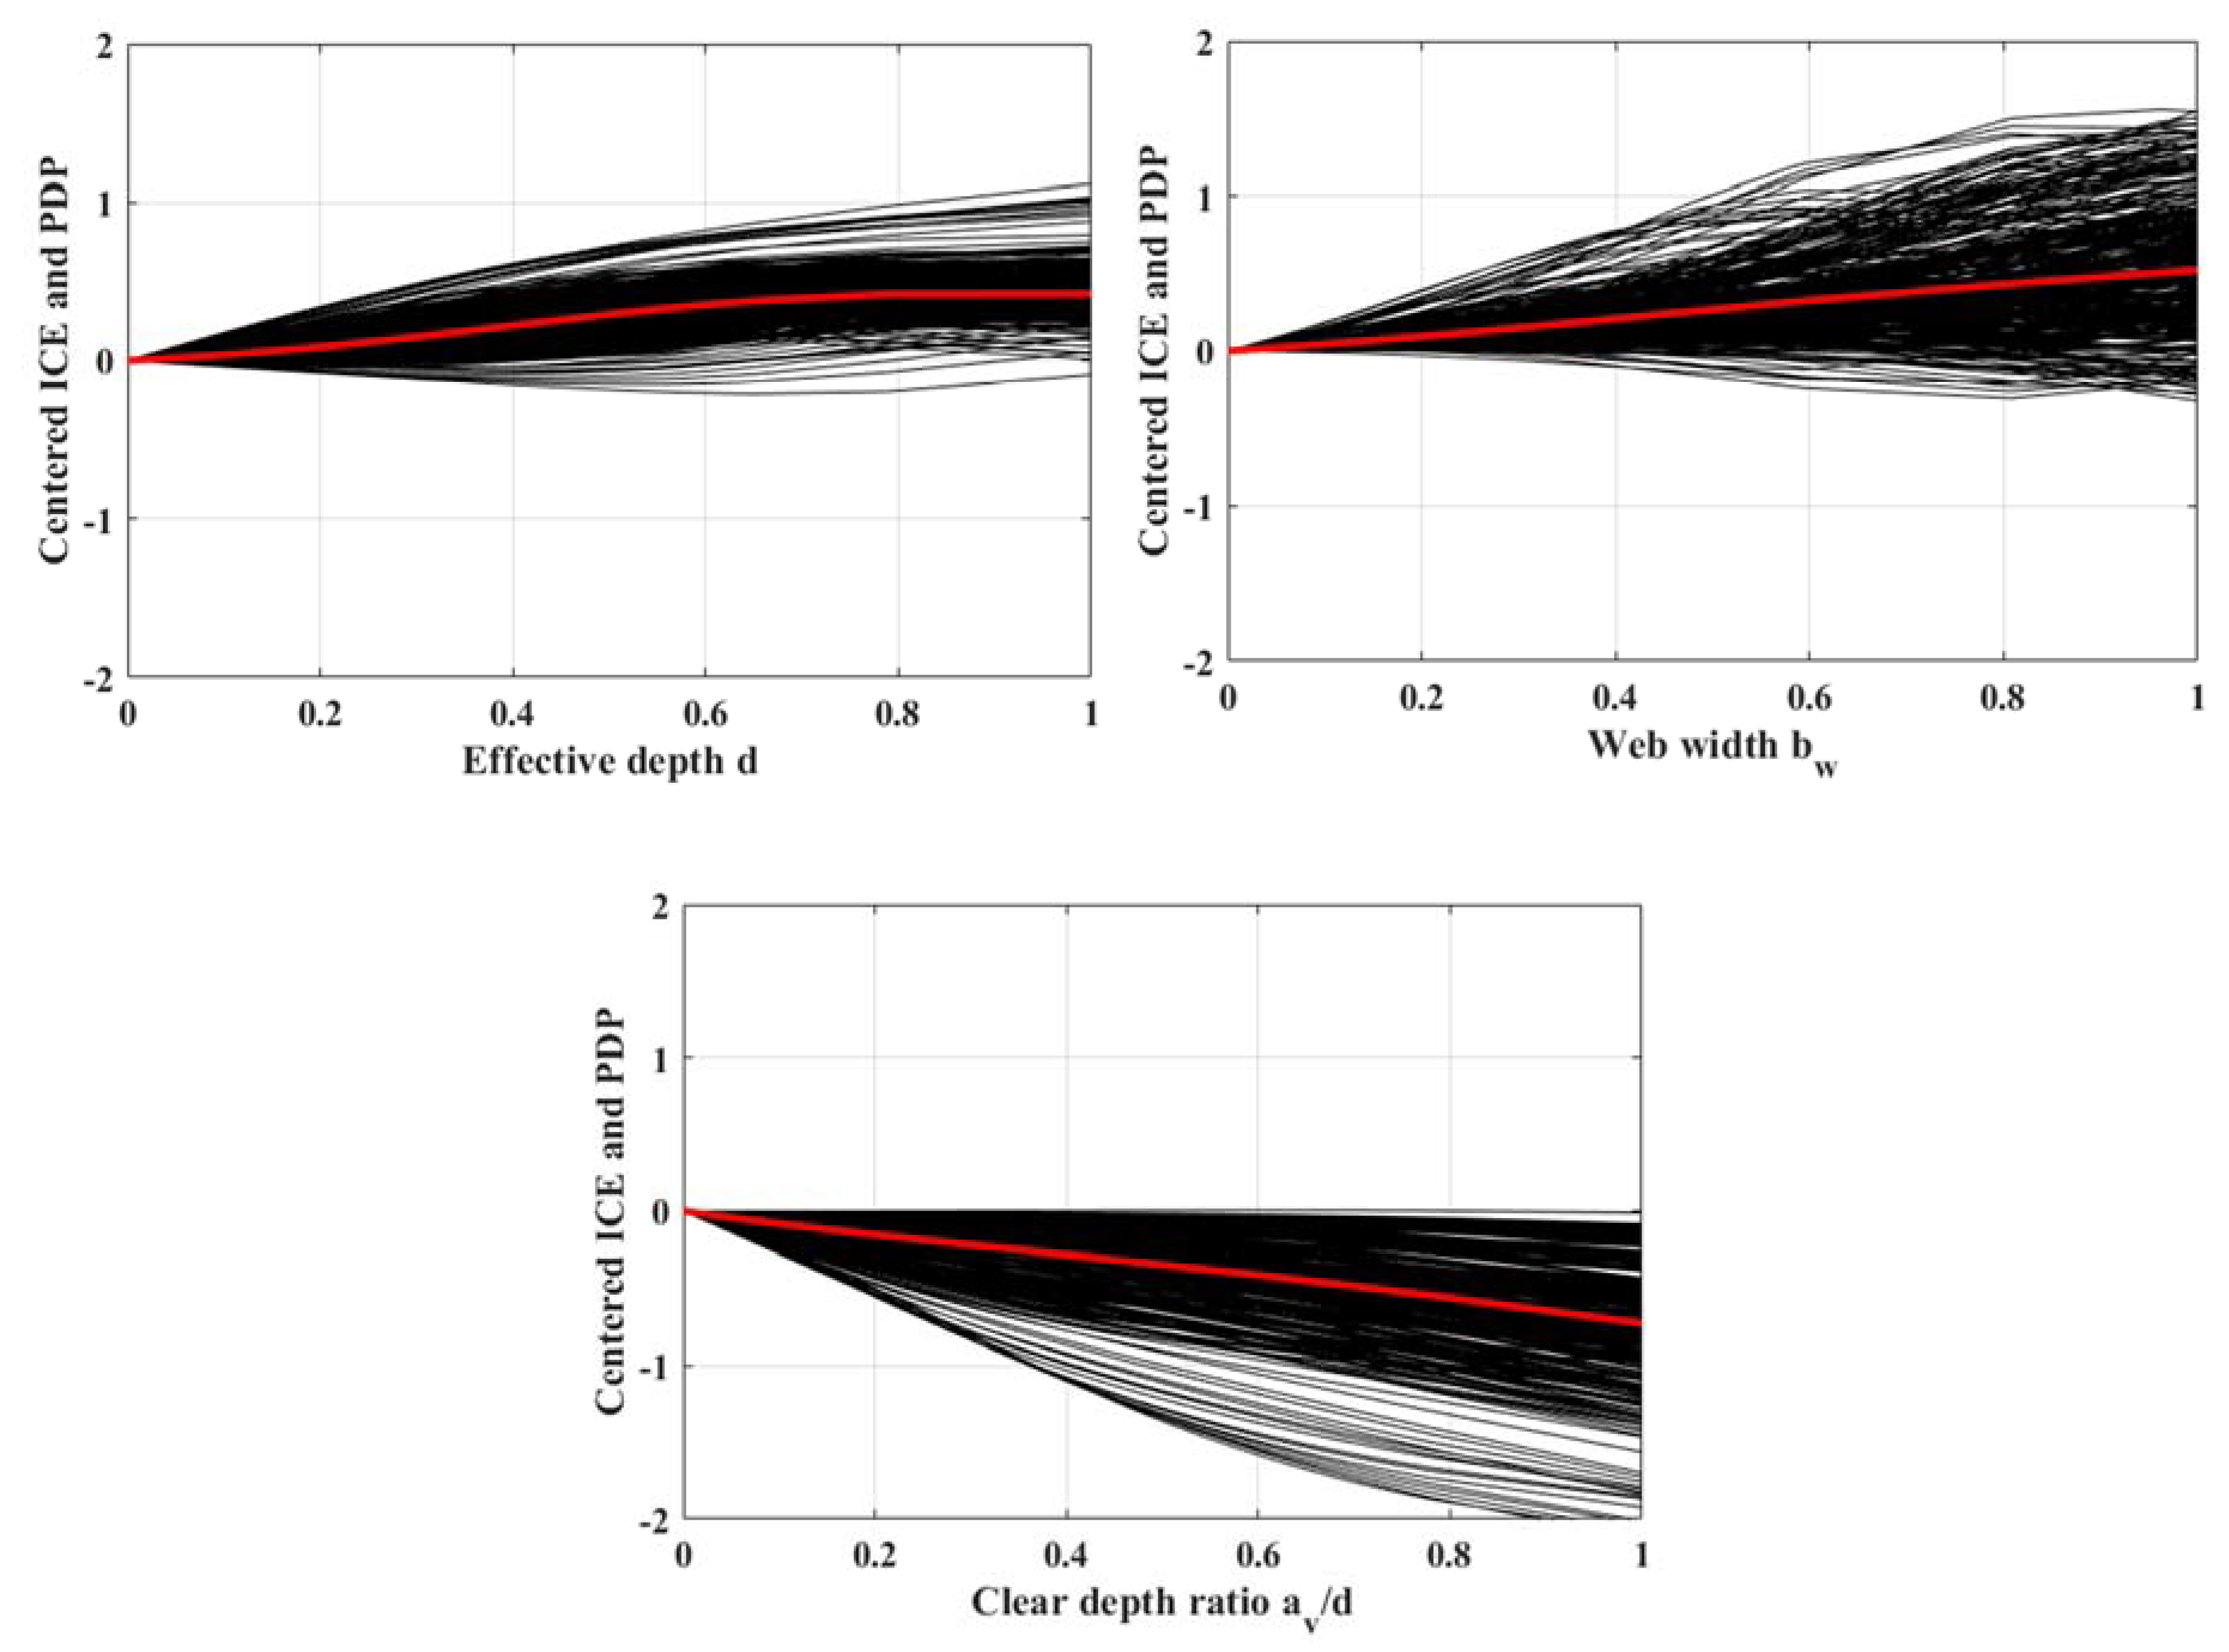
4.3. Sensitivity Analysis Using ICE and PDP Concepts
4.3.1. Not Important Factors
4.3.2. Slightly Important Factors
4.3.3. Important Factors
4.3.4. Very Important Factors
5. Discussions
5.1. Dataset Used for ML Modeling
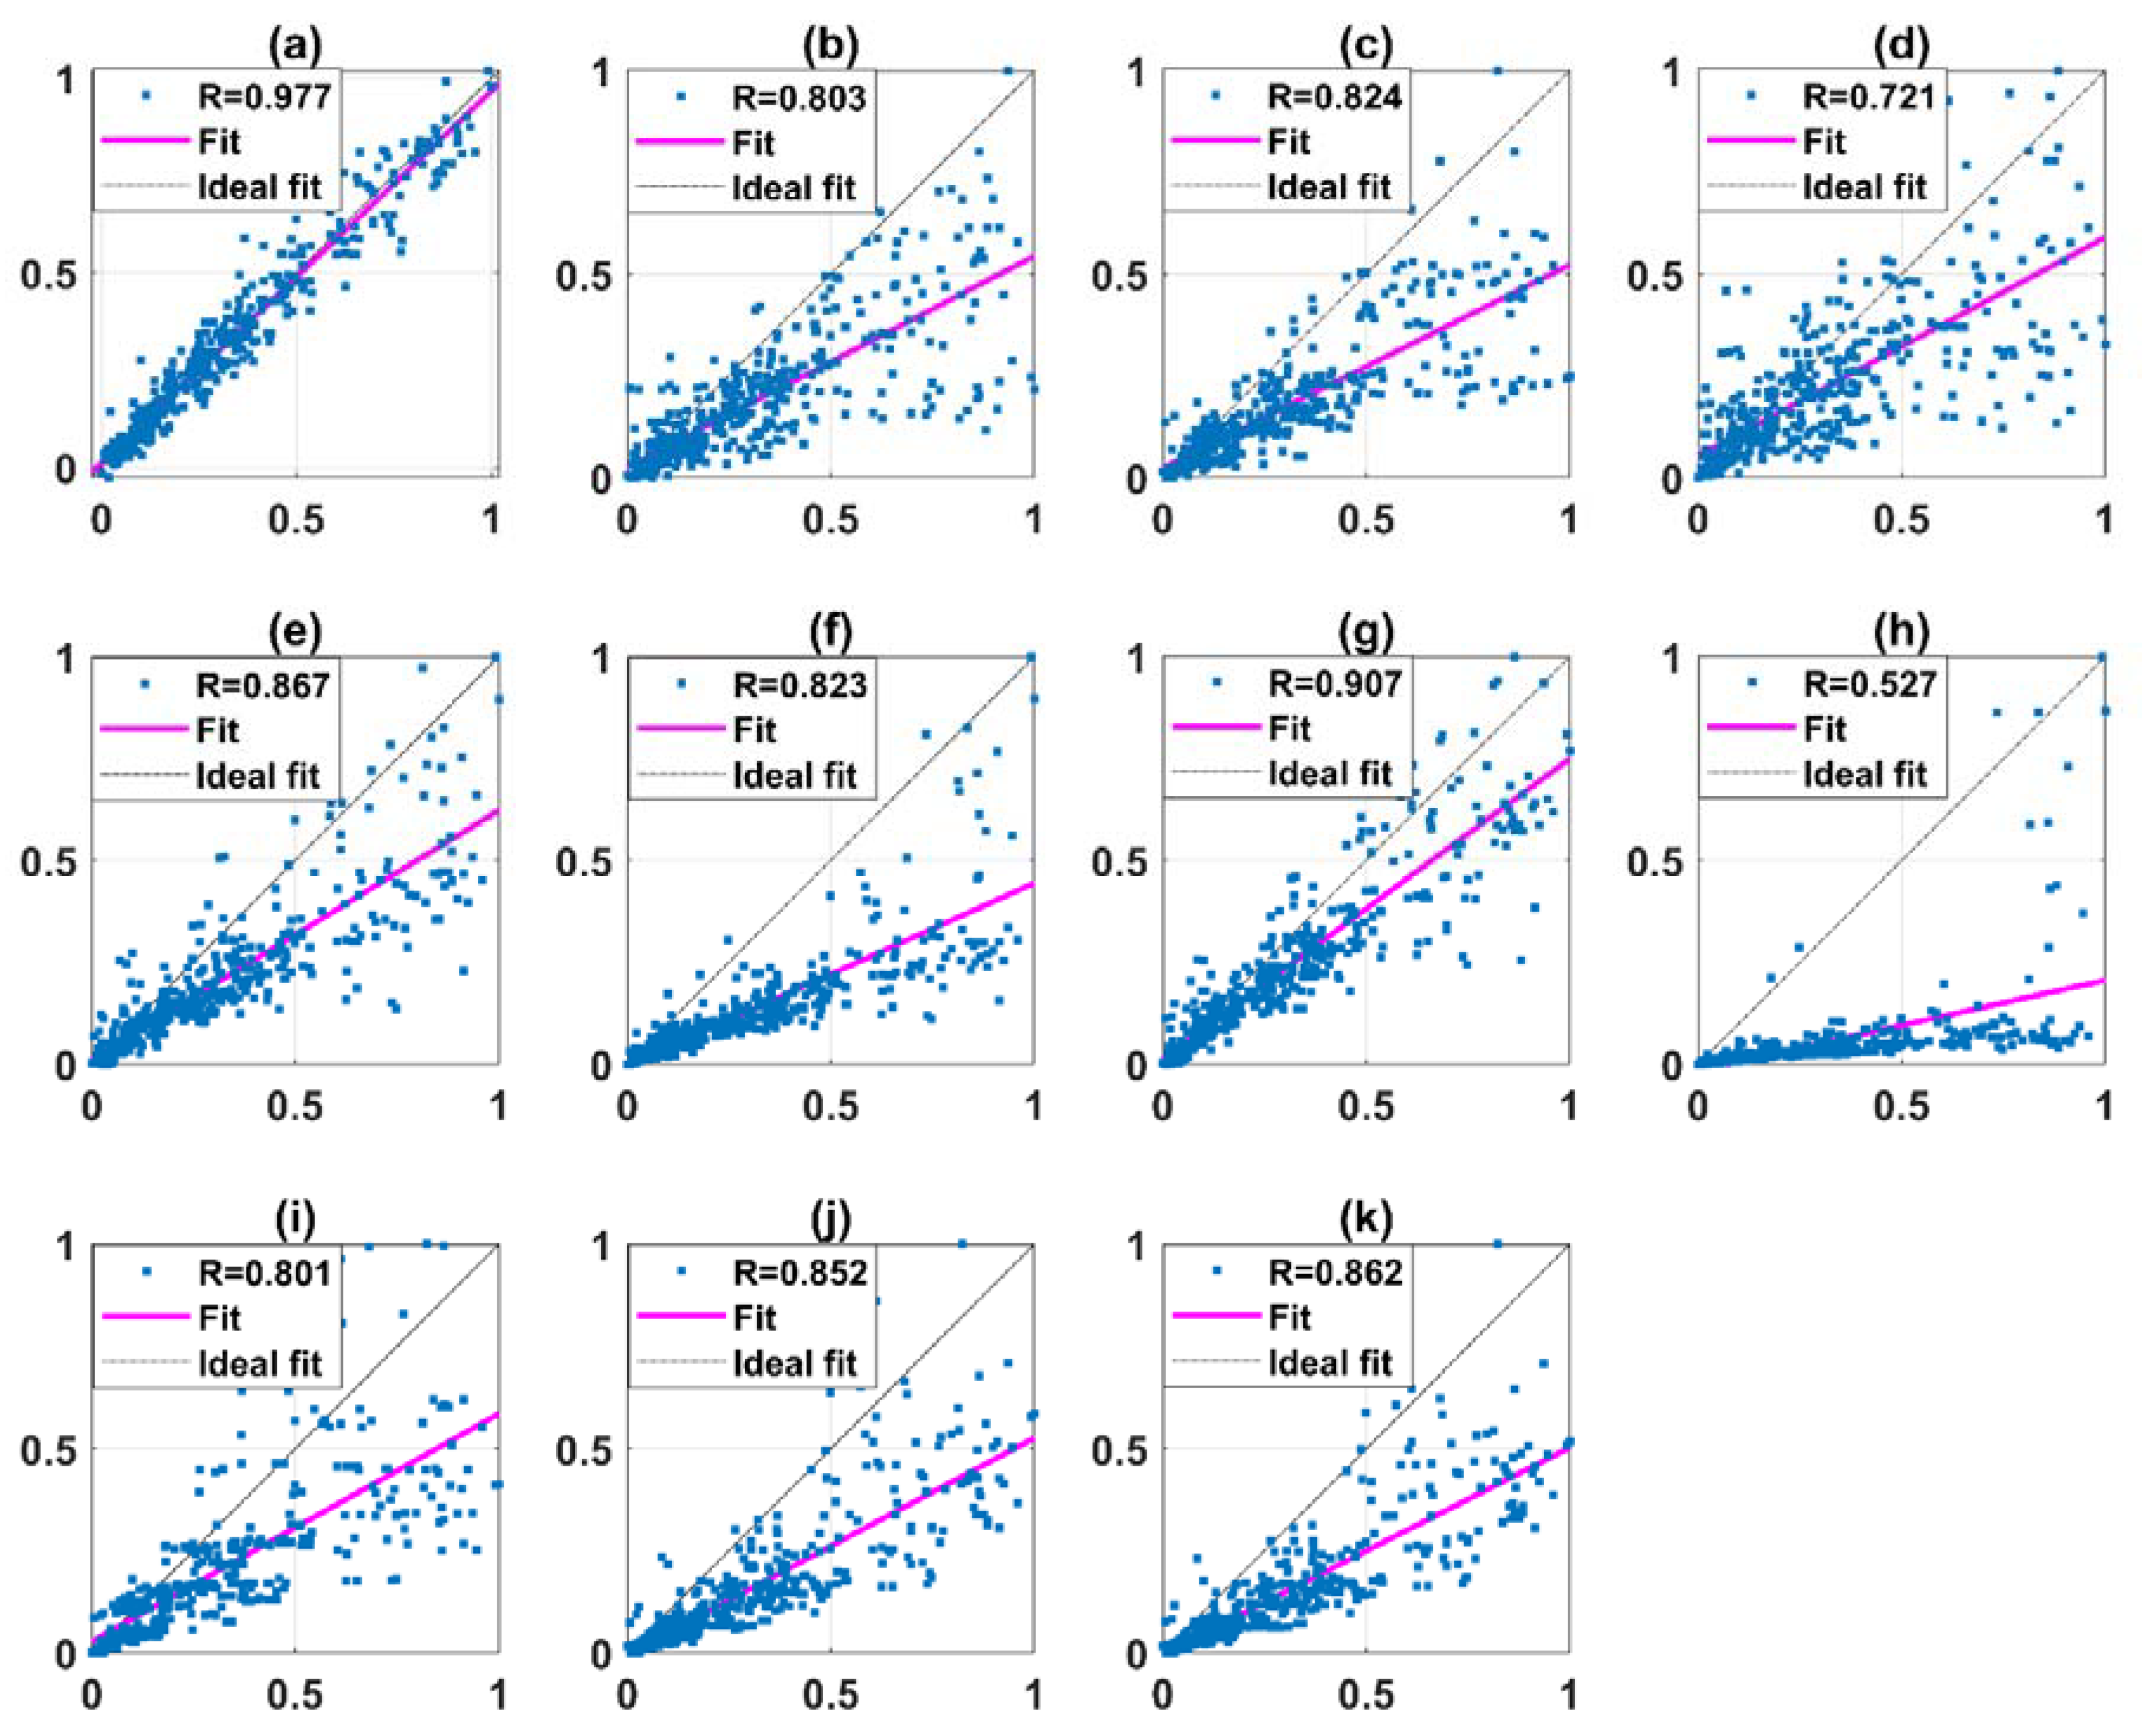
5.2. Validation and Comparison of the Hybrid Models
5.3. Importance of Selection of the Input Factors
6. Conclusions
Supplementary Materials
Author Contributions
Funding
Conflicts of Interest
References
- Dao, D.V.; Ly, H.-B.; Trinh, S.H.; Le, T.-T.; Pham, B.T. Artificial Intelligence Approaches for Prediction of Compressive Strength of Geopolymer Concrete. Materials (Basel) 2019, 12, 983. [Google Scholar] [CrossRef] [PubMed]
- Tran, V.Q.; Nguyen, H.L.; Dao, V.D.; Hilloulin, B.; Nguyen, L.K.; Nguyen, Q.H.; Le, T.-T.; Ly, H.-B. Temperature effects on chloride binding capacity of cementitious materials. Mag. Concr. Res. 2019, 1–39. [Google Scholar] [CrossRef]
- Dao, D.V.; Adeli, H.; Ly, H.-B.; Le, L.M.; Le, V.M.; Le, T.-T.; Pham, B.T. A Sensitivity and Robustness Analysis of GPR and ANN for High-Performance Concrete Compressive Strength Prediction Using a Monte Carlo Simulation. Sustainability 2020, 12, 830. [Google Scholar] [CrossRef]
- Lantsoght, E.O.L. How do steel fibers improve the shear capacity of reinforced concrete beams without stirrups? Compos. Part B Eng. 2019, 175, 107079. [Google Scholar] [CrossRef]
- Mashhadban, H.; Kutanaei, S.S.; Sayarinejad, M.A. Prediction and modeling of mechanical properties in fiber reinforced self-compacting concrete using particle swarm optimization algorithm and artificial neural network. Constr. Build. Mater. 2016, 119, 277–287. [Google Scholar] [CrossRef]
- Yazıcı, Ş.; İnan, G.; Tabak, V. Effect of aspect ratio and volume fraction of steel fiber on the mechanical properties of SFRC. Constr. Build. Mater. 2007, 21, 1250–1253. [Google Scholar] [CrossRef]
- Ferrara, L.; Meda, A. Relationships between fibre distribution, workability and the mechanical properties of SFRC applied to precast roof elements. Mater. Struct. 2006, 39, 411–420. [Google Scholar] [CrossRef]
- Özcan, D.M.; Bayraktar, A.; Şahin, A.; Haktanir, T.; Türker, T. Experimental and finite element analysis on the steel fiber-reinforced concrete (SFRC) beams ultimate behavior. Constr. Build. Mater. 2009, 23, 1064–1077. [Google Scholar] [CrossRef]
- Higashiyama, H.; Ota, A.; Mizukoshi, M. Design Equation for Punching Shear Capacity of SFRC Slabs. Int. J. Concr. Struct. Mater. 2011, 5, 35–42. [Google Scholar] [CrossRef]
- Gandomi, A.; Alavi, A.; Yun, G. Nonlinear modeling of shear strength of SFRC beams using linear genetic programming. Struct. Eng. Mech. 2011, 38, 1–25. [Google Scholar] [CrossRef]
- Pansuk, W.; Nguyen, T.N.; Sato, Y.; Den Uijl, J.A.; Walraven, J.C. Shear capacity of high performance fiber reinforced concrete I-beams. Constr. Build. Mater. 2017, 157, 182–193. [Google Scholar] [CrossRef]
- Bae, B.-I.; Choi, H.-K.; Choi, C.-S. Flexural and shear capacity evaluation of reinforced ultra-high strength concrete members with steel rebars. Key Eng. Mater. 2014, 577–578, 17–20. [Google Scholar]
- Ahmadi, M.; Kheyroddin, A.; Dalvand, A.; Kioumarsi, M. New empirical approach for determining nominal shear capacity of steel fiber reinforced concrete beams. Constr. Build. Mater. 2020, 234, 117293. [Google Scholar] [CrossRef]
- Nino, S.; Piero, C.; Antonino, R. Simple Plastic Model for Shear Critical SFRC Beams. J. Struct. Eng. 2010, 136, 390–400. [Google Scholar]
- Arslan, G. Shear strength of Steel Fiber Reinforced Concrete (SFRC) slender beams. KSCE J. Civ. Eng. 2014, 18, 587–594. [Google Scholar] [CrossRef]
- Hanai, J.B.D.; Holanda, K.M.A. Similarities between punching and shear strength of steel fiber reinforced concrete (SFRC) slabs and beams. Revista IBRACON de Estruturas e Materiais 2008, 1, 1–16. [Google Scholar] [CrossRef]
- Ly, H.-B.; Desceliers, C.; Le, L.M.; Le, T.-T.; Pham, B.T.; Nguyen-Ngoc, L.; Doan, V.T.; Le, M. Quantification of Uncertainties on the Critical Buckling Load of Columns under Axial Compression with Uncertain Random Materials. Materials 2019, 12, 1828. [Google Scholar] [CrossRef]
- Ly, H.-B.; Le, T.-T.; Le, L.M.; Tran, V.Q.; Le, V.M.; Vu, H.-L.T.; Nguyen, Q.H.; Pham, B.T. Development of Hybrid Machine Learning Models for Predicting the Critical Buckling Load of I-Shaped Cellular Beams. Appl. Sci. 2019, 9, 5458. [Google Scholar] [CrossRef]
- Ly, H.-B.; Monteiro, E.; Le, T.-T.; Le, V.M.; Dal, M.; Regnier, G.; Pham, B.T. Prediction and Sensitivity Analysis of Bubble Dissolution Time in 3D Selective Laser Sintering Using Ensemble Decision Trees. Materials 2019, 12, 1544. [Google Scholar] [CrossRef]
- Ly, H.-B.; Pham, B.T.; Dao, D.V.; Le, V.M.; Le, L.M.; Le, T.-T. Improvement of ANFIS Model for Prediction of Compressive Strength of Manufactured Sand Concrete. Appl. Sci. 2019, 9, 3841. [Google Scholar] [CrossRef]
- Ly, H.-B.; Le, L.M.; Phi, L.V.; Phan, V.-H.; Tran, V.Q.; Pham, B.T.; Le, T.-T.; Derrible, S. Development of an AI Model to Measure Traffic Air Pollution from Multisensor and Weather Data. Sensors 2019, 19, 4941. [Google Scholar] [CrossRef] [PubMed]
- Nguyen, H.-L.; Pham, B.T.; Son, L.H.; Thang, N.T.; Ly, H.-B.; Le, T.-T.; Ho, L.S.; Le, T.-H.; Tien Bui, D. Adaptive Network Based Fuzzy Inference System with Meta-Heuristic Optimizations for International Roughness Index Prediction. Appl. Sci. 2019, 9, 4715. [Google Scholar] [CrossRef]
- Nguyen, H.-L.; Le, T.-H.; Pham, C.-T.; Le, T.-T.; Ho, L.S.; Le, V.M.; Pham, B.T.; Ly, H.-B. Development of Hybrid Artificial Intelligence Approaches and a Support Vector Machine Algorithm for Predicting the Marshall Parameters of Stone Matrix Asphalt. Appl. Sci. 2019, 9, 3172. [Google Scholar] [CrossRef]
- Pham, B.T.; Nguyen, M.D.; Dao, D.V.; Prakash, I.; Ly, H.-B.; Le, T.-T.; Ho, L.S.; Nguyen, K.T.; Ngo, T.Q.; Hoang, V.; et al. Development of artificial intelligence models for the prediction of Compression Coefficient of soil: An application of Monte Carlo sensitivity analysis. Sci. Total Environ. 2019, 679, 172–184. [Google Scholar] [CrossRef]
- Qi, C.; Ly, H.-B.; Chen, Q.; Le, T.-T.; Le, V.M.; Pham, B.T. Flocculation-dewatering prediction of fine mineral tailings using a hybrid machine learning approach. Chemosphere 2019, 125450. [Google Scholar] [CrossRef]
- Asteris, P.G.; Armaghani, D.J.; Hatzigeorgiou, G.D.; Karayannis, C.G.; Pilakoutas, K. Predicting the shear strength of reinforced concrete beams using Artificial Neural Networks. Comput. Concr. 2019, 24, 469–488. [Google Scholar]
- Armaghani, D.J.; Hatzigeorgiou, G.D.; Karamani, C.; Skentou, A.; Zoumpoulaki, I.; Asteris, P.G. Soft computing-based techniques for concrete beams shear strength. Procedia Struct. Integr. 2019, 17, 924–933. [Google Scholar] [CrossRef]
- Sun, D.; Lonbani, M.; Askarian, B.; Jahed Armaghani, D.; Tarinejad, R.; Thai Pham, B.; Huynh, V.V. Investigating the Applications of Machine Learning Techniques to Predict the Rock Brittleness Index. Appl. Sci. 2020, 10, 1691. [Google Scholar] [CrossRef]
- Huang, L.; Asteris, P.G.; Koopialipoor, M.; Armaghani, D.J.; Tahir, M.M. Invasive Weed Optimization Technique-Based ANN to the Prediction of Rock Tensile Strength. Appl. Sci. 2019, 9, 5372. [Google Scholar] [CrossRef]
- Hajihassani, M.; Abdullah, S.S.; Asteris, P.G.; Armaghani, D.J. A gene expression programming model for predicting tunnel convergence. Appl. Sci. 2019, 9, 4650. [Google Scholar] [CrossRef]
- Xu, H.; Zhou, J.; G. Asteris, P.; Jahed Armaghani, D.; Tahir, M.M. Supervised Machine Learning Techniques to the Prediction of Tunnel Boring Machine Penetration Rate. Appl. Sci. 2019, 9, 3715. [Google Scholar] [CrossRef]
- Kiani, J.; Camp, C.; Pezeshk, S. On the application of machine learning techniques to derive seismic fragility curves. Comput. Struct. 2019, 218, 108–122. [Google Scholar] [CrossRef]
- Mangalathu, S.; Hwang, S.-H.; Choi, E.; Jeon, J.-S. Rapid seismic damage evaluation of bridge portfolios using machine learning techniques. Eng. Struct. 2019, 201, 109785. [Google Scholar] [CrossRef]
- Mangalathu, S.; Heo, G.; Jeon, J.-S. Artificial neural network based multi-dimensional fragility development of skewed concrete bridge classes. Eng. Struct. 2018, 162, 166–176. [Google Scholar] [CrossRef]
- Mangalathu, S.; Jeon, J.-S. Machine Learning–Based Failure Mode Recognition of Circular Reinforced Concrete Bridge Columns: Comparative Study. J. Struct. Eng. 2019, 145, 04019104. [Google Scholar] [CrossRef]
- Mangalathu, S.; Jeon, J.-S. Classification of failure mode and prediction of shear strength for reinforced concrete beam-column joints using machine learning techniques. Eng. Struct. 2018, 160, 85–94. [Google Scholar] [CrossRef]
- Pedroni, N.; Zio, E.; Apostolakis, G.E. Comparison of bootstrapped artificial neural networks and quadratic response surfaces for the estimation of the functional failure probability of a thermal–hydraulic passive system. Reliab. Eng. Syst. Saf. 2010, 95, 386–395. [Google Scholar] [CrossRef]
- Ricotti, M.E.; Zio, E. Neural network approach to sensitivity and uncertainty analysis. Reliab. Eng. Syst. Saf. 1999, 64, 59–71. [Google Scholar] [CrossRef]
- Ak, R.; Li, Y.; Vitelli, V.; Zio, E.; López Droguett, E.; Magno Couto Jacinto, C. NSGA-II-trained neural network approach to the estimation of prediction intervals of scale deposition rate in oil & gas equipment. Expert Syst. Appl. 2013, 40, 1205–1212. [Google Scholar]
- Ly, H.-B.; Le, L.M.; Duong, H.T.; Nguyen, T.C.; Pham, T.A.; Le, T.-T.; Le, V.M.; Nguyen-Ngoc, L.; Pham, B.T. Hybrid Artificial Intelligence Approaches for Predicting Critical Buckling Load of Structural Members under Compression Considering the Influence of Initial Geometric Imperfections. Appl. Sci. 2019, 9, 2258. [Google Scholar] [CrossRef]
- Le, L.M.; Ly, H.-B.; Pham, B.T.; Le, V.M.; Pham, T.A.; Nguyen, D.-H.; Tran, X.-T.; Le, T.-T. Hybrid Artificial Intelligence Approaches for Predicting Buckling Damage of Steel Columns Under Axial Compression. Materials 2019, 12, 1670. [Google Scholar] [CrossRef] [PubMed]
- Dao, D.V.; Trinh, S.H.; Ly, H.-B.; Pham, B.T. Prediction of Compressive Strength of Geopolymer Concrete Using Entirely Steel Slag Aggregates: Novel Hybrid Artificial Intelligence Approaches. Appl. Sci. 2019, 9, 1113. [Google Scholar] [CrossRef]
- Adhikary, B.B.; Mutsuyoshi, H. Prediction of shear strength of steel fiber RC beams using neural networks. Constr. Build. Mater. 2006, 20, 801–811. [Google Scholar] [CrossRef]
- Angeline, P.J. Genetic Programming: On the Programming of Computers by Means of Natural Selection; Koza, J.R., Ed.; A Bradford Book, MIT Press: Cambridge, MA, USA, 1992; ISBN 0-262-11170-5. xiv + 819pp. [Google Scholar]
- Yaseen, Z.M.; Tran, M.T.; Kim, S.; Bakhshpoori, T.; Deo, R.C. Shear strength prediction of steel fiber reinforced concrete beam using hybrid intelligence models: A new approach. Eng. Struct. 2018, 177, 244–255. [Google Scholar] [CrossRef]
- Abdul-Zaher, A.S.; Abdul-Hafez, L.M.; Tawfic, Y.R.; Hammed, O. Shear behavior of fiber reinforced concrete beams. J. Eng. Sci. Assiut Univ. 2016, 44, 132–144. [Google Scholar]
- Li, V.C.; Ward, R.; Hamza, A.M. Steel and synthetic fibers as shear reinforcement. ACI Mater. J. 1992, 89, 499–508. [Google Scholar]
- Adebar, P.; Mindess, S.; St.-Pierre, D.; Olund, B. Shear tests of fiber concrete beams without stirrups. ACI Struct. J. 1997, 94, 68–76. [Google Scholar]
- Lim, D.H.; Oh, B.H. Experimental and theoretical investigation on the shear of steel fibre reinforced concrete beams. Eng. Struct. 1999, 21, 937–944. [Google Scholar] [CrossRef]
- Amin, A.; Foster, S.J. Shear strength of steel fibre reinforced concrete beams with stirrups. Eng. Struct. 2016, 111, 323–332. [Google Scholar] [CrossRef]
- Lim, T.Y.; Paramasivam, P.; Lee, S.L. Analytical Model for Tensile Behavior of Steel-Fiber Concrete. ACI Mater. J. 1987, 84, 286–298. [Google Scholar]
- Aoude, H.; Cohen, M. Shear response of SFRC beams constructed with SCC and steel fibers. Electron. J. Struct. Eng. 2014, 14, 71–83. [Google Scholar]
- Araújo, D.L.; Nunes, F.G.T.; Toledo Filho, R.D.; de Andrade, M.A.S. Shear strength of steel fiber-reinforced concrete beams [Resistência ao cisalhamento de vigas de concreto reforçado com fibras de aço]. Acta Sci. Technol. 2014, 36, 389–397. [Google Scholar] [CrossRef]
- Aoude, H.; Belghiti, M.; Cook, W.D.; Mitchell, D. Response of steel fiber-reinforced concrete beams with and without stirrups. ACI Struct. J. 2012, 109, 359–367. [Google Scholar]
- Manju, R.; Sathya, S.; Sylviya, B. Shear strength of high – Strength steel fibre reinforced concrete rectangular beams. Int. J. Civ. Eng. Technol. 2017, 8, 1716–1729. [Google Scholar]
- Mansur, M.A.; Ong, K.C.G.; Paramasivam, P. Shear strength of fibrous concrete beams without stirrups. J. Struct. Eng. 1986, 112, 2066–2079. [Google Scholar] [CrossRef]
- Ashour, S.A.; Hasanain, G.S.; Wafa, F.F. Shear behavior of high-strength fiber reinforced concrete beams. ACI Struct. J. 1992, 89, 176–184. [Google Scholar]
- Minelli, F.; Plizzari, G.A. On the effectiveness of steel fibers as shear reinforcement. ACI Struct. J. 2013, 110, 379–389. [Google Scholar]
- Narayanan, R.; Darwish, I.Y.S. Use of Steel Fibers as Shear Reinforcement. ACI Struct. J. 1987, 84, 216–227. [Google Scholar]
- Batson, G.; Jenkins, E.; Spatney, R. Steel fibers as shear reinforcement in beams. ACI J. 1972, 69, 640–644. [Google Scholar]
- Noghabai, K. Beams of fibrous concrete in shear and bending: Experiment and model. J. Struct. Eng. N. Y. 2000, 126, 243–251. [Google Scholar] [CrossRef]
- Casanova, P.; Rossi, P. Shear Strength of Fiber Reinforced Concrete Beams without Stirrups. In Structural Applications of Fiber Reinforced Concrete, SP-182; American Concrete Institute: Farmington Hills, MI, USA, 1999; pp. 53–67. [Google Scholar]
- Casanova, P.; Rossi, P.; Schaller, I. Can steel fibers replace transverse reinforcements in reinforced concrete beams? ACI Mater. J. 1997, 94, 341–354. [Google Scholar]
- Para-Montesinos, G.; Wight, J.K.; Dinh, H.; Libbrecht, A.; Padilla, C. Shear Strength of Fiber Reinforced Concrete Beams without Stirrups; University of Michigan: Ann Arbor, MI, USA, 2006; p. 39. [Google Scholar]
- Chalioris, C.E.; Sfiri, E. Shear performance of steel fibrous concrete beams. Procedia Eng. 2011, 14, 2064–2068. [Google Scholar] [CrossRef]
- Qissab, M.A.; Salman, M.M. Shear strength of non-prismatic steel fiber reinforced concrete beams without stirrups. Struct. Eng. Mech. 2018, 67, 347–358. [Google Scholar] [CrossRef]
- Cho, S.-H.; Kim, Y.-I. Effects of steel fibers on short beams loaded in shear. ACI Struct. J. 2003, 100, 765–774. [Google Scholar]
- Randl, N.; Mészöly, T.; Harsányi, P. Shear behaviour of UHPC beams with varying degrees of fibre and shear reinforcement. In Proceedings of the Fib Symposium 2017, Maastricht, The Netherlands, 12–14 June 2017; pp. 500–507. [Google Scholar]
- Mohammed-Saeed, M.; Aoude, H. Shear behavior of SFRC and SCFRC beams. In Proceedings of the Proceedings, Annual Conference - Canadian Society for Civil Engineering, University of Ottawa, Ottawa, ON, Canada, 6–9 June 2012; Volume 3, pp. 2557–2566. [Google Scholar]
- Roberts, T.; Ho, N. Shear failure of deep fibre reinforced concrete beams. Int. J. Cem. Compos. Light. Concr. 1982, 4, 145–152. [Google Scholar] [CrossRef]
- Cucchiara, C.; La Mendola, L.; Papia, M. Effectiveness of stirrups and steel fibres as shear reinforcement. Cem. Concr. Compos. 2004, 26, 777–786. [Google Scholar] [CrossRef]
- Rosenbusch, J.; Teutsch, M. Trial Beams in Shear Brite/Euram Project 97-4163 Final Report Sub Task 4.2; Technical University of Braunschweig: Braunschweig, Germany, 2003; pp. 105–117. [Google Scholar]
- Dancygier, A.N.; Savir, Z. Effects of steel fibers on shear behavior of high-strength reinforced concrete beams. Adv. Struct. Eng. 2011, 14, 745–761. [Google Scholar] [CrossRef]
- Sahoo, D.R.; Sharma, A. Effect of steel fiber content on behavior of concrete beams with and without stirrups. ACI Struct. J. 2014, 111, 1157–1166. [Google Scholar] [CrossRef]
- Dinh, H.H.; Parra-Montesinos, G.J.; Wight, J.K. Shear behavior of steel fiber-reinforced concrete beams without stirrup reinforcement. ACI Struct. J. 2010, 107, 597–606. [Google Scholar]
- Sahoo, D.R.; Bhagat, S.; Reddy, T.C.V. Experimental study on shear-span to effective-depth ratio of steel fiber reinforced concrete T-beams. Mater. Struct. 2015, 49, 3815–3830. [Google Scholar] [CrossRef]
- Dupont, D.; Vandewalle, L. Shear capacity of concrete beams containing longitudinal reinforcement and steel fibers. ACI Spec. Publ. 2003, 216, 79–94. [Google Scholar]
- Shoaib, A. Shear in steel fiber reinforced concrete members without stirrups. Ph.D. Thesis, Department of Civil and Environmental Engineering, University of Alberta, Alberta, Canada, 2012. [Google Scholar]
- Furlan, S., Jr.; De Hanai, J.B. Shear behaviour of fiber reinforced concrete beams. Cem. Concr. Composites 1997, 19, 359–366. [Google Scholar] [CrossRef]
- Shoaib, A.; Lubell, A.S.; Bindiganavile, V.S. Shear response of lightweight steel fiber reinforced concrete members without stirrups. Mater. Struct. Mater. Constr. 2015, 48, 3141–3157. [Google Scholar] [CrossRef]
- Gali, S.; Subramaniam, K.V.L. Shear behavior of steel fiber reinforced concrete using full-field displacements from digital image correlation. In Proceedings of the MATEC Web of Conferences, University of Sharjah, Sharjah, United Arab Emirates, 18–20 April 2017; Volume 120. [Google Scholar]
- Singh, B.; Jain, K. An appraisal of steel fibers as minimum shear reinforcement in concrete beams. ACI Struct. J. 2014, 111, 1191–1202. [Google Scholar] [CrossRef]
- Greenough, T.; Nehdi, M. Shear behavior of fiber-reinforced self-consolidating concrete slender beams. ACI Mater. J. 2008, 105, 468–477. [Google Scholar]
- Spinella, N. Shear strength of full-scale steel fibre-reinforced concrete beams without stirrups. Comput. Concr. 2013, 11, 365–382. [Google Scholar] [CrossRef]
- Huang, C.-K.; Zhang, H.Z.; Guan, Z.G. Experimental study on shear resistance of steel fiber reinforced high-strength concrete beam. ACI Spec. Publ. 2005, 228, 687–704. [Google Scholar]
- Swamy, R.N.; Bahia, H.M. Effectiveness of steel fibers as shear reinforcement. Concr. Int. 1985, 7, 35–40. [Google Scholar]
- Hwang, J.-H.; Lee, D.H.; Kim, K.S.; Ju, H.; Seo, S.-Y. Evaluation of shear performance of steel fibre reinforced concrete beams using a modified smeared-truss model. Mag. Concr. Res. 2013, 65, 283–296. [Google Scholar] [CrossRef]
- Swamy, R.N.; Jones, R.; Chiam, A.T.P. Influence of steel fibers on the shear resistance of lightweight concrete I- beams. ACI Struct. J. 1993, 90, 103–114. [Google Scholar]
- Imam, M.; Vandewalle, L.; Mortelmans, F. Shear capacity of steel fiber high-strength concrete beams. ACI Spec. Pub. 1994, 149, 227–242. [Google Scholar]
- Tahenni, T.; Chemrouk, M.; Lecompte, T. Effect of steel fibers on the shear behavior of high strength concrete beams. Constr. Build. Mater. 2016, 105, 14–28. [Google Scholar] [CrossRef]
- Jindal, R.L. Shear and Moment Capacities of Steel Fiber Reinforced Concrete Beams; American Concrete Institute, Publication SP: Farmington Hills, MI, USA, 1984; pp. 1–16. [Google Scholar]
- Tan, K.H.; Murugappan, K.; Paramasivam, P. Shear behavior of steel fiber reinforced concrete beams. ACI Struct. J. 1993, 90, 3–11. [Google Scholar]
- Kang, T.H.-K.; Kim, W.; Kwak, Y.-K.; Hong, S.-G. Shear testing of steel fiber-reinforced lightweight concrete beams without web reinforcement. ACI Struct. J. 2011, 108, 553–561. [Google Scholar]
- Zamanzadeh, Z.; Lourenço, L.; Barros, J. Recycled steel fibre reinforced concrete failing in bending and in shear. Constr. Build. Mater. 2015, 85, 195–207. [Google Scholar] [CrossRef]
- Kang, T.H.-K.; Kim, W.; Massone, L.M.; Galleguillos, T.A. Shear-flexure coupling behavior of steel fiber-reinforced concrete beams. ACI Struct. J. 2012, 109, 435–444. [Google Scholar]
- Zarrinpour, M.R.; Chao, S.-H. Shear strength enhancement mechanisms of steel fiber-reinforced concrete slender beams. ACI Struct. J. 2017, 114, 729–742. [Google Scholar] [CrossRef]
- Kim, C.-G.; Lee, H.; Park, H.-G.; Hong, G.-H.; Kang, S.-M. Effect of steel fibers on minimum shear reinforcement of high-strength concrete beams. ACI Struct. J. 2017, 114, 1109–1119. [Google Scholar] [CrossRef]
- Sharma, A.K. Shear strength of steel fiber reinforced concrete beams. J. Am. Concr. Inst. 1986, 83, 624–628. [Google Scholar]
- Krassowska, J.; Kosior-Kazberuk, M. Failure mode in shear of steel fiber reinforced concrete beams. In Proceedings of the MATEC Web Conference, Cape Town, South Africa, 24–26 September 2018; Volume 163. [Google Scholar] [CrossRef]
- Shin, S.W.; Oh, J.; Ghosh, S.K. Shear behavior of laboratory-sized high-strength concrete beams reinforced with bars and steel fibers. Fiber Reinf. Concr. Dev. Innov. 1994, 142, 181–200. [Google Scholar]
- Kwak, Y.-K.; Eberhard, M.O.; Kim, W.-S.; Kim, J. Shear strength of steel fiber-reinforced concrete beams without stirrups. ACI Struct. J. 2002, 99, 530–538. [Google Scholar]
- Zhao, J.; Liang, J.; Chu, L.; Shen, F. Experimental study on shear behavior of steel fiber reinforced concrete beams with high-strength reinforcement. Materials 2018, 11, 1682. [Google Scholar] [CrossRef] [PubMed]
- Kwak, K.-H.; Suh, J.; Hsu, C.-T.T. Shear-fatigue behaviour of steel fiber reinforced concrete beams. ACI Struct. J. 1991, 88, 155–160. [Google Scholar]
- Adeli, H. Neural networks in civil engineering: 1989–2000. Comput. Civ. Infrastruct. Eng. 2001, 16, 126–142. [Google Scholar] [CrossRef]
- Tu, J. Advantages and disadvantages of using artificial neural networks versus logistic regression for predicting medical outcomes. J. Clin. Epidemiol. 1996, 49, 1225–1231. [Google Scholar] [CrossRef]
- Bayat, M.; Ghorbanpour, M.; Zare, R.; Jaafari, A.; Thai Pham, B. Application of artificial neural networks for predicting tree survival and mortality in the Hyrcanian forest of Iran. Comput. Electron. Agric. 2019, 164, 104929. [Google Scholar] [CrossRef]
- Pham, B.T.; Nguyen, M.D.; Ly, H.-B.; Pham, T.A.; Hoang, V.; Van Le, H.; Le, T.-T.; Nguyen, H.Q.; Bui, G.L. Development of artificial neural networks for prediction of compression coefficient of soft soil. In CIGOS 2019, Innovation for Sustainable Infrastructure; Ha-Minh, C., Dao, D.V., Benboudjema, F., Derrible, S., Huynh, D.V.K., Tang, A.M., Eds.; Springer: Singapore, 2020; pp. 1167–1172. [Google Scholar]
- Le, T.-T.; Pham, B.T.; Ly, H.-B.; Shirzadi, A.; Le, L.M. Development of 48-hour precipitation forecasting model using nonlinear autoregressive neural network. In CIGOS 2019, Innovation for Sustainable Infrastructure; Ha-Minh, C., Dao, D.V., Benboudjema, F., Derrible, S., Huynh, D.V.K., Tang, A.M., Eds.; Springer: Singapore, 2020; pp. 1191–1196. [Google Scholar]
- Szkuta, B.R.; Sanabria, L.A.; Dillon, T.S. Electricity price short-term forecasting using artificial neural networks. IEEE Trans. Power Syst. 1999, 14, 851–857. [Google Scholar] [CrossRef]
- Kumar, S.; Barai, S.V. Neural networks modeling of shear strength of SFRC corbels without stirrups. Appl. Soft Comput. 2010, 10, 135–148. [Google Scholar] [CrossRef]
- Darji, M.P.; Dabhi, V.K.; Prajapati, H.B. Rainfall forecasting using neural network: A survey. In Proceedings of the 2015 International Conference on Advances in Computer Engineering and Applications, Ghaziabad, UP, India, 19–20 March 2015; pp. 706–713. [Google Scholar]
- Chang, K.-T.; Merghadi, A.; Yunus, A.P.; Pham, B.T.; Dou, J. Evaluating scale effects of topographic variables in landslide susceptibility models using GIS-based machine learning techniques. Sci. Rep. 2019, 9, 1–21. [Google Scholar] [CrossRef]
- Pham, B.T.; Nguyen-Thoi, T.; Ly, H.-B.; Nguyen, M.D.; Al-Ansari, N.; Tran, V.-Q.; Le, T.-T. Extreme Learning Machine Based Prediction of Soil Shear Strength: A Sensitivity Analysis Using Monte Carlo Simulations and Feature Backward Elimination. Sustainability 2020, 12, 2339. [Google Scholar] [CrossRef]
- Witten, I.H.; Frank, E.; Hall, M.A.; Pal, C.J. Data Mining: Practical Machine Learning Tools and Techniques; Morgan Kaufmann: Burlington, MA, USA, 2016; ISBN 978-0-12-804357-8. [Google Scholar]
- Phong, T.V.; Phan, T.T.; Prakash, I.; Singh, S.K.; Shirzadi, A.; Chapi, K.; Ly, H.-B.; Ho, L.S.; Quoc, N.K.; Pham, B.T. Landslide susceptibility modeling using different artificial intelligence methods: A case study at Muong Lay district, Vietnam. Geocarto Int. 2019, 0, 1–24. [Google Scholar] [CrossRef]
- Cavaleri, L.; Asteris, P.G.; Psyllaki, P.P.; Douvika, M.G.; Skentou, A.D.; Vaxevanidis, N.M. Prediction of Surface Treatment Effects on the Tribological Performance of Tool Steels Using Artificial Neural Networks. Appl. Sci. 2019, 9, 2788. [Google Scholar] [CrossRef]
- Asteris, P.G.; Moropoulou, A.; Skentou, A.D.; Apostolopoulou, M.; Mohebkhah, A.; Cavaleri, L.; Rodrigues, H.; Varum, H. Stochastic Vulnerability Assessment of Masonry Structures: Concepts, Modeling and Restoration Aspects. Appl. Sci. 2019, 9, 243. [Google Scholar] [CrossRef]
- Dou, J.; Yunus, A.P.; Merghadi, A.; Shirzadi, A.; Nguyen, H.; Hussain, Y.; Avtar, R.; Chen, Y.; Pham, B.T.; Yamagishi, H. Different sampling strategies for predicting landslide susceptibilities are deemed less consequential with deep learning. Sci. Total Environ. 2020, 720, 137320. [Google Scholar] [CrossRef]
- Dodangeh, E.; Shahedi, K.; Pham, B.T.; Solaimani, K. Joint frequency analysis and uncertainty estimation of coupled rainfall–runoff series relying on historical and simulated data. Hydrol. Sci. J. 2020, 65, 455–469. [Google Scholar] [CrossRef]
- Asteris, P.G.; Roussis, P.C.; Douvika, M.G. Feed-Forward Neural Network Prediction of the Mechanical Properties of Sandcrete Materials. Sensors 2017, 17, 1344. [Google Scholar] [CrossRef]
- Cavaleri, L.; Chatzarakis, G.E.; Trapani, F.D.; Douvika, M.G.; Roinos, K.; Vaxevanidis, N.M.; Asteris, P.G. Modeling of surface roughness in electro-discharge machining using artificial neural networks. Adv. Mater. Res. 2017, 6, 169–184. [Google Scholar]
- Plevris, V.; Asteris, P.G. Modeling of masonry failure surface under biaxial compressive stress using Neural Networks. Constr. Build. Mater. 2014, 55, 447–461. [Google Scholar] [CrossRef]
- Lourakis, M.I.A. A Brief Description of the Levenberg-Marquardt Algorithm Implemented by levmar. Found. Res. Technol. 2005, 4, 1–6. [Google Scholar]
- Asteris, P.G.; Nikoo, M. Artificial bee colony-based neural network for the prediction of the fundamental period of infilled frame structures. Neural Comput. Applic. 2019, 31, 4837–4847. [Google Scholar] [CrossRef]
- Donate, J.P.; Li, X.; Sánchez, G.G.; De Miguel, A.S. Time series forecasting by evolving artificial neural networks with genetic algorithms, differential evolution and estimation of distribution algorithm. Neural Comput. Appl. 2011, 22, 11–20. [Google Scholar] [CrossRef]
- Mousavi, S.M.; Mostafavi, E.S.; Jiao, P. Next generation prediction model for daily solar radiation on horizontal surface using a hybrid neural network and simulated annealing method. Energy Convers. Manag. 2017, 153, 671–682. [Google Scholar] [CrossRef]
- Nguyen, H.; Drebenstedt, C.; Bui, X.-N.; Bui, D.T. Prediction of blast-induced ground vibration in an open-pit mine by a novel hybrid model based on clustering and artificial neural network. Nat. Resour. Res. 2019, 29, 691–709. [Google Scholar] [CrossRef]
- Blanco, A.; Delgado, M.; Pegalajar, M.C. A real-coded genetic algorithm for training recurrent neural networks. Neural Netw. 2001, 14, 93–105. [Google Scholar] [CrossRef]
- Irani, R.; Nasimi, R. Evolving neural network using real coded genetic algorithm for permeability estimation of the reservoir. Expert Syst. Appl. 2011, 38, 9862–9866. [Google Scholar] [CrossRef]
- Hamacher, K. On stochastic global optimization of one-dimensional functions. Phys. A Stat. Mech. Appl. 2005, 354, 547–557. [Google Scholar] [CrossRef]
- Huang, H.; An, H.; Ma, H.; Chen, S. An engineering method for complex structural optimization involving both size and topology design variables. Int. J. Numer. Methods Eng. 2019, 117, 291–315. [Google Scholar] [CrossRef]
- Lass, O.; Posch, C.; Scharrer, G.; Volkwein, S. Space mapping techniques for a structural optimization problem governed by the p -Laplace equation. Optim. Methods Softw. 2011, 26, 617–642. [Google Scholar] [CrossRef]
- Guilleminot, J.; Le, T.T.; Soize, C. Stochastic framework for modeling the linear apparent behavior of complex materials: Application to random porous materials with interphases. Acta Mech. Sin. 2013, 29, 773–782. [Google Scholar] [CrossRef]
- Le, T.T.; Guilleminot, J.; Soize, C. Stochastic continuum modeling of random interphases from atomistic simulations. Application to a polymer nanocomposite. Comput. Methods Appl. Mech. Eng. 2016, 303, 430–449. [Google Scholar] [CrossRef]
- Sergeyev, Y.D.; Kvasov, D.E.; Mukhametzhanov, M.S. On the efficiency of nature-inspired metaheuristics in expensive global optimization with limited budget. Sci. Rep. 2018, 8, 1–9. [Google Scholar] [CrossRef] [PubMed]
- Arani, K.S.; Zandi, Y.; Pham, B.T.; Mu’azu, M.A.; Katebi, J.; Mohammadhassani, M.; Khalafi, S.; Mohamad, E.T.; Wakil, K.; Khorami, M. Computational optimized finite element modeling of mechanical interaction of concrete with fiber reinforced polymer. Comput. Concr. 2019, 23, 061. [Google Scholar]
- Holland, J.H. Adaptation in Natural and Artificial Systems: An Introductory Analysis with Applications to Biology, Control, and Artificial Intelligence, Reprint ed.; A Bradford Book: Cambridge, MA, USA, 1992; ISBN 978-0-262-58111-0. [Google Scholar]
- Chang, W.-D. Nonlinear system identification and control using a real-coded genetic algorithm. Appl. Math. Model. 2007, 31, 541–550. [Google Scholar] [CrossRef]
- Maulik, U.; Bandyopadhyay, S. Genetic algorithm-based clustering technique. Pattern Recognit. 2000, 33, 1455–1465. [Google Scholar] [CrossRef]
- Jahed Armaghani, D.; Asteris, P.G.; Askarian, B.; Hasanipanah, M.; Tarinejad, R.; Huynh, V.V. Examining Hybrid and Single SVM Models with Different Kernels to Predict Rock Brittleness. Sustainability 2020, 12, 2229. [Google Scholar] [CrossRef]
- Sedki, A.; Ouazar, D.; El Mazoudi, E. Evolving neural network using real coded genetic algorithm for daily rainfall–runoff forecasting. Expert Syst. Appl. 2009, 36, 4523–4527. [Google Scholar] [CrossRef]
- Mohamad, E.T.; Faradonbeh, R.S.; Armaghani, D.J.; Monjezi, M.; Majid, M.Z.A. An optimized ANN model based on genetic algorithm for predicting ripping production. Neural Comput. Appl. 2017, 28, 393–406. [Google Scholar] [CrossRef]
- Gandomi, A.H.; Yang, X.-S.; Alavi, A.H. Mixed variable structural optimization using Firefly Algorithm. Comput. Struct. 2011, 89, 2325–2336. [Google Scholar] [CrossRef]
- Srivatsava, P.R.; Mallikarjun, B.; Yang, X.-S. Optimal test sequence generation using firefly algorithm. Swarm Evol. Comput. 2013, 8, 44–53. [Google Scholar] [CrossRef]
- Senthilnath, J.; Omkar, S.N.; Mani, V. Clustering using firefly algorithm: Performance study. Swarm Evol. Comput. 2011, 1, 164–171. [Google Scholar] [CrossRef]
- Zaman, M.A.; Abdul Matin, M. Nonuniformly Spaced Linear Antenna Array Design Using Firefly Algorithm. Available online: https://www.hindawi.com/journals/ijmst/2012/256759/abs/ (accessed on 15 November 2019).
- Dao, D.V.; Jaafari, A.; Bayat, M.; Mafi-Gholami, D.; Qi, C.; Moayedi, H.; Phong, T.V.; Ly, H.-B.; Le, T.-T.; Trinh, P.T.; et al. A spatially explicit deep learning neural network model for the prediction of landslide susceptibility. Catena 2020, 188, 104451. [Google Scholar] [CrossRef]
- Pham, B.T.; Le, L.M.; Le, T.-T.; Bui, K.-T.T.; Le, V.M.; Ly, H.-B.; Prakash, I. Development of advanced artificial intelligence models for daily rainfall prediction. Atmos. Res. 2020, 237, 104845. [Google Scholar] [CrossRef]
- Pham, B.T.; Van Phong, T.V.; Nguyen-Thoi, T.; Parial, K.; K. Singh, S.; Ly, H.-B.; Nguyen, K.T.; Ho, L.S.; Le, H.V.; Prakash, I. Ensemble modeling of landslide susceptibility using random subspace learner and different decision tree classifiers. Geocarto Int. 2020, 2020, 1–23. [Google Scholar] [CrossRef]
- Pham, B.T.; Qi, C.; Ho, L.S.; Nguyen-Thoi, T.; Al-Ansari, N.; Nguyen, M.D.; Nguyen, H.D.; Ly, H.-B.; Le, H.V.; Prakash, I. A Novel Hybrid Soft Computing Model Using Random Forest and Particle Swarm Optimization for Estimation of Undrained Shear Strength of Soil. Sustainability 2020, 12, 2218. [Google Scholar] [CrossRef]
- Nguyen, H.Q.; Ly, H.-B.; Tran, V.Q.; Nguyen, T.-A.; Le, T.-T.; Pham, B.T. Optimization of Artificial Intelligence System by Evolutionary Algorithm for Prediction of Axial Capacity of Rectangular Concrete Filled Steel Tubes under Compression. Materials 2020, 13, 1205. [Google Scholar] [CrossRef]
- Dao, D.V.; Ly, H.-B.; Vu, H.-L.T.; Le, T.-T.; Pham, B.T. Investigation and Optimization of the C-ANN Structure in Predicting the Compressive Strength of Foamed Concrete. Materials 2020, 13, 1072. [Google Scholar] [CrossRef]
- Pham, B.T.; Nguyen, M.D.; Bui, K.-T.T.; Prakash, I.; Chapi, K.; Bui, D.T. A novel artificial intelligence approach based on Multi-layer Perceptron Neural Network and Biogeography-based Optimization for predicting coefficient of consolidation of soil. Catena 2019, 173, 302–311. [Google Scholar] [CrossRef]
- Nguyen, V.V.; Pham, B.T.; Vu, B.T.; Prakash, I.; Jha, S.; Shahabi, H.; Shirzadi, A.; Ba, D.N.; Kumar, R.; Chatterjee, J.M. Hybrid machine learning approaches for landslide susceptibility modeling. Forests 2019, 10, 157. [Google Scholar] [CrossRef]
- Asteris, P.G.; Kolovos, K.G.; Douvika, M.G.; Roinos, K. Prediction of self-compacting concrete strength using artificial neural networks. Eur. J. Environ. Civil Eng. 2016, 20, s102–s122. [Google Scholar] [CrossRef]
- Asteris, P.G.; Kolovos, K.G. Self-compacting concrete strength prediction using surrogate models. Neural Comput. Appl. 2019, 31, 409–424. [Google Scholar] [CrossRef]
- Asteris, P.G.; Plevris, V. Anisotropic masonry failure criterion using artificial neural networks. Neural Comput. Appl. 2017, 28, 2207–2229. [Google Scholar] [CrossRef]
- Roshni, T.; Jha, M.K.; Deo, R.C.; Vandana, A. Development and Evaluation of Hybrid Artificial Neural Network Architectures for Modeling Spatio-Temporal Groundwater Fluctuations in a Complex Aquifer System. Water Resour. Manag. 2019, 33, 2381–2397. [Google Scholar] [CrossRef]
- Armaghani, D.J.; Hajihassani, M.; Sohaei, H.; Mohamad, E.T.; Marto, A.; Motaghedi, H.; Moghaddam, M.R. Neuro-fuzzy technique to predict air-overpressure induced by blasting. Arab. J. Geosci. 2015, 8, 10937–10950. [Google Scholar] [CrossRef]
- Sonmez, H.; Gokceoglu, C.; Nefeslioglu, H.A.; Kayabasi, A. Estimation of rock modulus: For intact rocks with an artificial neural network and for rock masses with a new empirical equation. Int. J. Rock Mech. Min. Sci. 2006, 43, 224–235. [Google Scholar] [CrossRef]
- Bui, D.-K.; Nguyen, T.; Chou, J.-S.; Nguyen-Xuan, H.; Ngo, T.D. A modified firefly algorithm-artificial neural network expert system for predicting compressive and tensile strength of high-performance concrete. Constr. Build. Mater. 2018, 180, 320–333. [Google Scholar] [CrossRef]
- Sulaiman, S.I.; Othman, Z.; Musirin, I.; Abidin, N.S.M.Z. Optimization of an Artificial Neural Network using Firefly Algorithm for modeling AC power from a photovoltaic system. In Proceedings of the 2015 SAI Intelligent Systems Conference (IntelliSys), London, UK, 10–11 November 2015; pp. 591–594. [Google Scholar]
- Qi, C.; Tang, X.; Dong, X.; Chen, Q.; Fourie, A.; Liu, E. Towards Intelligent Mining for Backfill: A genetic programming-based method for strength forecasting of cemented paste backfill. Miner. Eng. 2019, 133, 69–79. [Google Scholar] [CrossRef]
- Slater, E.; Moni, M.; Alam, M.S. Predicting the shear strength of steel fiber reinforced concrete beams. Constr. Build. Mater. 2012, 26, 423–436. [Google Scholar] [CrossRef]
- Kara, I.F. Empirical modeling of shear strength of steel fiber reinforced concrete beams by gene expression programming. Neural Comput. Appl. 2013, 23, 823–834. [Google Scholar] [CrossRef]
- Tian, J.; Qi, C.; Sun, Y.; Yaseen, Z.M.; Pham, B.T. Permeability prediction of porous media using a combination of computational fluid dynamics and hybrid machine learning methods. Eng. Comput. 2020, 1–17. [Google Scholar] [CrossRef]
- Rahmani, A.; MirHassani, S.A. A hybrid Firefly-Genetic Algorithm for the capacitated facility location problem. Inf. Sci. 2014, 283, 70–78. [Google Scholar] [CrossRef]
- Thakur, M.; Kumar, A. Optimal coordination of directional over current relays using a modified real coded genetic algorithm: A comparative study. Int. J. Electr. Power Energy Syst. 2016, 82, 484–495. [Google Scholar] [CrossRef]
- Haghrah, A.; Nazari-Heris, M.; Mohammadi-Ivatloo, B. Solving combined heat and power economic dispatch problem using real coded genetic algorithm with improved Mühlenbein mutation. Appl. Therm. Eng. 2016, 99, 465–475. [Google Scholar] [CrossRef]
- Khuntia, M.; Stojadinovic, B.; Goel, S.C. Shear strength of normal and high-strength fiber reinforced concrete beams without stirrups. ACI Struct. J. 1999, 96, 282–289. [Google Scholar]
- Sarveghadi, M.; Gandomi, A.H.; Bolandi, H.; Alavi, A.H. Development of prediction models for shear strength of SFRCB using a machine learning approach. Neural Comput. Appl. 2015, 31, 2085–2094. [Google Scholar] [CrossRef]
- Yakoub, H.E. Shear stress prediction: Steel fiber-reinforced concrete beams without stirrups. ACI Struct. J. 2011, 108, 304–314. [Google Scholar]
- Lantsoght, E.O.L. Database of Shear Experiments on Steel Fiber Reinforced Concrete Beams without Stirrups. Materials 2019, 12, 917. [Google Scholar] [CrossRef]


| No | Reference | Number of Data | Proportion of Data (%) | No | Reference | Number of Data | Proportion of Data (%) |
|---|---|---|---|---|---|---|---|
| 1 | Abdul-Zaher et al. [46] | 3 | 0.65 | 32 | Li and Ward [47] | 22 | 4.75 |
| 2 | Adebar et al. [48] | 6 | 1.30 | 33 | Lim and Oh [49] | 2 | 0.43 |
| 3 | Amin and Foster [50] | 2 | 0.43 | 34 | Lim et al. [51] | 7 | 1.51 |
| 4 | Aoude and Cohen 2014 [52] | 4 | 0.86 | 35 | Lima-Araujo et al. [53] | 2 | 0.43 |
| 5 | Aoude et al. [54] | 4 | 0.86 | 36 | Manju et al. [55] | 6 | 1.30 |
| 6 | Arslan et al. [15] | 9 | 1.94 | 37 | Mansur et al. [56] | 9 | 1.94 |
| 7 | Ashour et al. [57] | 18 | 3.89 | 38 | Minelli and Plizzari [58] | 9 | 1.94 |
| 8 | Bae et al. [12] | 1 | 0.22 | 39 | Narayanan and Darwish [59] | 37 | 7.99 |
| 9 | Batson et al. [60] | 43 | 9.29 | 40 | Noghabai [61] | 15 | 3.24 |
| 10 | Casanova and Rossi [62] | 2 | 0.43 | 41 | Pansuk et al. [11] | 2 | 0.43 |
| 11 | Casanova et al. [63] | 3 | 0.65 | 42 | Parra-Montesinos et al. [64] | 10 | 2.16 |
| 12 | Chalioris and Sfiri 2011 [65] | 1 | 0.22 | 43 | Qissab and Salman [66] | 11 | 2.38 |
| 13 | Cho and Kim [67] | 12 | 2.59 | 44 | Randl et al. [68] | 5 | 1.08 |
| 14 | Cohen and Aoude 2012 [69] | 1 | 0.22 | 45 | Roberts and Ho [70] | 6 | 1.30 |
| 15 | Cucchiara et al. [71] | 4 | 0.86 | 46 | Rosenbusch and Teutsch [72] | 19 | 4.10 |
| 16 | Danygier and Savir [73] | 2 | 0.43 | 47 | Sahoo and Sharma [74] | 7 | 1.51 |
| 17 | Dinh et al. [75] | 19 | 4.10 | 48 | Sahoo et al. [76] | 3 | 0.65 |
| 18 | Dupont and Vandewalle [77] | 20 | 4.32 | 49 | Shoaib [78] (REF prob) | 3 | 0.65 |
| 19 | Furlan and de Hanai [79] | 7 | 1.51 | 50 | Shoaib and Lubell [80] | 2 | 0.43 |
| 20 | Gali and Subramaniam [81] | 2 | 0.43 | 51 | Singh and Jain [82] | 32 | 6.91 |
| 21 | Greenough and Nehdi [83] | 9 | 1.94 | 52 | Spinella et al. [84] | 2 | 0.43 |
| 22 | Huang et al. 2005 [85] | 1 | 0.22 | 53 | Swamy and Bahia [86] | 5 | 1.08 |
| 23 | Hwang et al. [87] | 7 | 1.51 | 54 | Swamy et al. [88] | 7 | 1.51 |
| 24 | Imam et al. [89] | 3 | 0.65 | 55 | Tahenni et al. [90] | 9 | 1.94 |
| 25 | Jindal [91] | 7 | 1.51 | 56 | Tan et al. [92] | 5 | 1.08 |
| 26 | Kang et al. [93] | 5 | 1.08 | 57 | Zamanzadeh et al. [94] | 3 | 0.65 |
| 27 | Kang et al. [95] | 2 | 0.43 | 58 | Zarrinpour and Chao [96] | 5 | 1.08 |
| 28 | Kim et al. [97] | 2 | 0.43 | 59 | Sharma [98] | 1 | 0.22 |
| 29 | Krassowska et al. [99] | 2 | 0.43 | 60 | Shin et al. [100] | 6 | 1.30 |
| 30 | Kwak et al. [101] | 4 | 0.86 | 61 | Zhao et al. [102] | 4 | 0.86 |
| 31 | Kwak and Suh [103] | 4 | 0.86 | Total | 463 | 100.00 |
| Cross-Section | Number of Data | Proportion (%) | Fiber Type | Number of Data | Proportion (%) | Failure Mode | Number of Data | Proportion (%) |
|---|---|---|---|---|---|---|---|---|
| Rectangular | 427 | 92.22 | Hooked | 282 | 60.91 | Diagonal tension | 16 | 4.06 |
| T-type | 18 | 3.89 | Crimped | 109 | 23.54 | Diagonal tension + shear tension | 9 | 2.28 |
| I-type | 7 | 1.51 | Straight smooth | 19 | 4.10 | Diagonal tension + shear tension + shear compression | 23 | 5.84 |
| Non-prismatic | 11 | 2.38 | Hooked + straight | 7 | 1.51 | Shear | 258 | 65.48 |
| Brass-coated high strength steel | 12 | 2.59 | Shear compression + shear tension | 2 | 0.51 | |||
| Chopped with butt ends | 1 | 0.22 | Shear compression + shear tension + yielding of steel | 3 | 0.76 | |||
| Corrugated | 3 | 0.65 | Shear tension + diagonal tension | 4 | 1.02 | |||
| Flat | 3 | 0.65 | Shear tension + diagonal tension + bond degradation near support | 3 | 0.76 | |||
| Flat end | 6 | 1.30 | Shear tension + diagonal tension + tension steel yielding | 6 | 1.52 | |||
| Mill-cut | 4 | 0.86 | Shear, shear-compression | 15 | 3.81 | |||
| Recycled | 3 | 0.65 | Shear-compression, flexure | 1 | 0.25 | |||
| Round | 13 | 2.81 | Shear-flexure | 48 | 12.18 | |||
| Straight mild steel | 1 | 0.22 | Shear-tension | 6 | 1.52 |
| Data Type | Variable | Notation | Unit | Role | Min | Q25 | Average | Q75 | Max | StD | CV (%) |
|---|---|---|---|---|---|---|---|---|---|---|---|
| Geometry | Web width | bw | mm | Input | 50.00 | 100.00 | 140.58 | 152.40 | 310.00 | 50.75 | 36.10 |
| Height of cross-section | H | mm | Input | 100.00 | 180.00 | 284.75 | 303.60 | 1000.00 | 140.19 | 49.23 | |
| Effective depth | d | mm | Input | 85.25 | 140.00 | 245.37 | 266.00 | 910.00 | 126.79 | 51.67 | |
| Span length | lspan | mm | Input | 204.00 | 1160.00 | 1816.70 | 2220.00 | 5600.00 | 888.97 | 48.93 | |
| Shear span | a | mm | Input | 102.00 | 392.50 | 713.64 | 875.00 | 2800.00 | 438.39 | 61.43 | |
| Clear shear span | av | mm | Input | 52.40 | 337.50 | 639.20 | 775.00 | 2700.00 | 418.44 | 65.46 | |
| Reinforcement ratio | ρ | % | Input | 0.37 | 1.72 | 2.43 | 3.09 | 5.72 | 0.01 | 41.39 | |
| Yield strength of reinforcement steel | fy | MPa | Input | 275.86 | 420.00 | 469.96 | 530.00 | 900.00 | 98.59 | 20.98 | |
| Depth ratio | a/d | - | Input | 0.70 | 2.31 | 2.93 | 3.50 | 6.00 | 0.98 | 33.66 | |
| Clear depth ratio | av/d | - | Input | 0.41 | 2.00 | 2.60 | 3.17 | 5.95 | 0.95 | 36.56 | |
| Concrete mix | Maximum aggregate size | daggmax | mm | Input | 0.40 | 9.55 | 10.66 | 13.00 | 22.00 | 5.11 | 47.93 |
| Average measured concrete cylinder compressive strength | fc′ | MPa | Input | 9.77 | 33.22 | 47.98 | 54.10 | 215.00 | 24.17 | 50.37 | |
| Fiber | Fiber volume fraction | Vf | % | Input | 0.20 | 0.50 | 0.88 | 1.00 | 4.50 | 0.56 | 63.30 |
| Length/diameter ratio of fibers | lf/df | - | Input | 25.00 | 60.00 | 71.87 | 80.00 | 190.50 | 24.72 | 34.40 | |
| Tensile strength of fibers | ftenfiber | MPa | Input | 260.00 | 1100.00 | 1241.73 | 1200.00 | 4913.00 | 457.82 | 36.87 | |
| Fiber factor | F | - | Input | 0.075 | 0.300 | 0.536 | 0.698 | 2.858 | 0.365 | 68.10 | |
| Capacity | Ultimate shear capacity | Vu | N | Output | 12,824.46 | 45,000.00 | 124,010.51 | 170,277.39 | 396,000.00 | 94,784.90 | 76.43 |
| Parameter | Value and Description |
|---|---|
| Neurons in the input layer | 16 |
| Hidden layers | 1 |
| Neurons in hidden layer | 10 |
| Neurons in the output layer | 1 |
| Hidden layer activation function | Sigmoid |
| Output layer activation function | Linear |
| Cost function | Mean square error |
| Size of weight of matrix of hidden layer | 10 × 16 |
| Size of bias vector of hidden layer | 1 × 10 |
| Size of weight of matrix of the output layer | 1 × 10 |
| Size of bias vector of output layer | 1 × 1 |
| Total number of parameters | 181 |
| Parameter | Value and Description |
|---|---|
| Number of fireflies | 30 |
| Maximum iteration number | 200 |
| Coefficient of light absorption | 1 |
| Coefficient of attraction | 2 |
| Mutation coefficient | 0.2 |
| Mutation coefficient damping ratio | 0.98 |
| Range of uniform mutation | 5% |
| Initial damp mutation coefficient | 0.196 |
| Parameter | Value and Description |
|---|---|
| Population size | 70 |
| Maximum number of iterations | 500 |
| Length of chromosome | 220 |
| Fitness function | linear ranking |
| Cross-over type | random pair |
| Cross-over probability | 0.4 |
| Number of off-springs | 10 |
| Mutation type | random |
| Mutation probability | 0.7 |
| Number of mutants | 18 |
| Selection function | roulette wheel selection |
| Method | Dataset | R | RMSE | MAE | Slope | Err.Mean | Err.Std |
|---|---|---|---|---|---|---|---|
| NN-FFA | Training | 0.960 | 0.066 | 0.047 | 0.921 | 0.001 | 0.066 |
| Testing | 0.965 | 0.071 | 0.053 | 0.917 | −0.004 | 0.071 | |
| NN-RCGA | Training | 0.976 | 0.051 | 0.036 | 0.950 | 0.000 | 0.051 |
| Testing | 0.979 | 0.056 | 0.041 | 0.961 | 0.003 | 0.056 |
| Group | Variable | Min | Max | End | Class |
|---|---|---|---|---|---|
| Geometry | Web width | 0 | 0.5243 | 0.5243 | 2 |
| Height of cross-section | 0 | 0.2911 | 0.2285 | 5 | |
| Effective depth | 0 | 0.4238 | 0.4238 | 3 | |
| Span length | −0.2028 | 0 | −0.2028 | 8 | |
| Shear span | 0 | 0.2520 | 0.2520 | 4 | |
| Clear shear span | −0.0551 | 0 | −0.0022 | 16 | |
| Reinforcement ratio | 0 | 0.1906 | 0.1906 | 9 | |
| Yield strength of reinforcement steel | 0 | 0.1175 | 0.1175 | 11 | |
| Depth ratio | 0 | 0.1225 | 0.1093 | 10 | |
| Clear depth ratio | −0.7246 | 0 | −0.7246 | 1 | |
| Concrete mix | Maximum aggregate size | −0.0678 | 0 | −0.0678 | 15 |
| Average measured concrete cylinder compressive strength | 0 | 0.2217 | 0.1523 | 7 | |
| Fiber | Fiber volume fraction | 0 | 0.0611 | 0.0303 | 14 |
| Length/diameter ratio of fibers | −0.1013 | 0 | −0.1013 | 12 | |
| Tensile strength of fibers | −0.0061 | 0.0118 | −0.0061 | 13 | |
| Fiber factor | 0 | 0.2342 | 0.2342 | 6 |
| Method | R | RMSE | MAE | % Gain: R | % Gain: RMSE | % Gain: MAE |
|---|---|---|---|---|---|---|
| NN-RCGA model | 0.9771 | 0.0526 | 0.0374 | - | - | - |
| Khuntia et al. [170] | 0.8025 | 0.1911 | 0.1252 | +17.5 | +72.5 | +70.1 |
| Sharma [98] | 0.8237 | 0.1936 | 0.1299 | +15.3 | +72.8 | +71.2 |
| Greenough and Nehdi [83] | 0.7205 | 0.1897 | 0.1228 | +25.7 | +72.3 | +69.5 |
| Ashour et al. [57] with a/d > 2.5 | 0.8672 | 0.1642 | 0.1134 | +11.0 | +68.0 | +67.0 |
| Ashour et al. [57] with a/d < 2.5 | 0.8234 | 0.2263 | 0.1653 | +15.4 | +76.8 | +77.4 |
| Sarveghadi et al. [171] | 0.9075 | 0.1238 | 0.0844 | +7.0 | +57.5 | +55.7 |
| Imam et al. [89] | 0.5274 | 0.3209 | 0.2423 | +45.0 | +83.6 | +84.6 |
| Ahmadi et al. [13] using Formulation 2 | 0.8015 | 0.1809 | 0.1208 | +17.6 | +70.9 | +69.0 |
| Ahmadi et al. [13] using Formulation 3 | 0.8517 | 0.1994 | 0.1461 | +12.5 | +73.6 | +74.4 |
| Ahmadi et al. [13] using Formulation 4 | 0.8617 | 0.2049 | 0.1509 | +11.5 | +74.3 | +75.2 |
| Sarveghadi et al. [171] | |
| Kwak et al. [101] | |
| Greenough and Nehdi [83] | |
| Khuntia et al. [170] | |
| Sharma [98] | |
| Mansur et al. [56] | |
| Ashour et al. [57] | |
| Arslan et al. [15] | |
| Imam et al. [89] | |
| Yakoub [172] | |
| Ahmadi et al. [13] |
© 2020 by the authors. Licensee MDPI, Basel, Switzerland. This article is an open access article distributed under the terms and conditions of the Creative Commons Attribution (CC BY) license (http://creativecommons.org/licenses/by/4.0/).
Share and Cite
Ly, H.-B.; Le, T.-T.; Vu, H.-L.T.; Tran, V.Q.; Le, L.M.; Pham, B.T. Computational Hybrid Machine Learning Based Prediction of Shear Capacity for Steel Fiber Reinforced Concrete Beams. Sustainability 2020, 12, 2709. https://doi.org/10.3390/su12072709
Ly H-B, Le T-T, Vu H-LT, Tran VQ, Le LM, Pham BT. Computational Hybrid Machine Learning Based Prediction of Shear Capacity for Steel Fiber Reinforced Concrete Beams. Sustainability. 2020; 12(7):2709. https://doi.org/10.3390/su12072709
Chicago/Turabian StyleLy, Hai-Bang, Tien-Thinh Le, Huong-Lan Thi Vu, Van Quan Tran, Lu Minh Le, and Binh Thai Pham. 2020. "Computational Hybrid Machine Learning Based Prediction of Shear Capacity for Steel Fiber Reinforced Concrete Beams" Sustainability 12, no. 7: 2709. https://doi.org/10.3390/su12072709
APA StyleLy, H.-B., Le, T.-T., Vu, H.-L. T., Tran, V. Q., Le, L. M., & Pham, B. T. (2020). Computational Hybrid Machine Learning Based Prediction of Shear Capacity for Steel Fiber Reinforced Concrete Beams. Sustainability, 12(7), 2709. https://doi.org/10.3390/su12072709