Diagnosing Subsidence Geohazard at Beijing Capital International Airport, from High-Resolution SAR Interferometry

 ,
, 

Abstract
1. Introduction
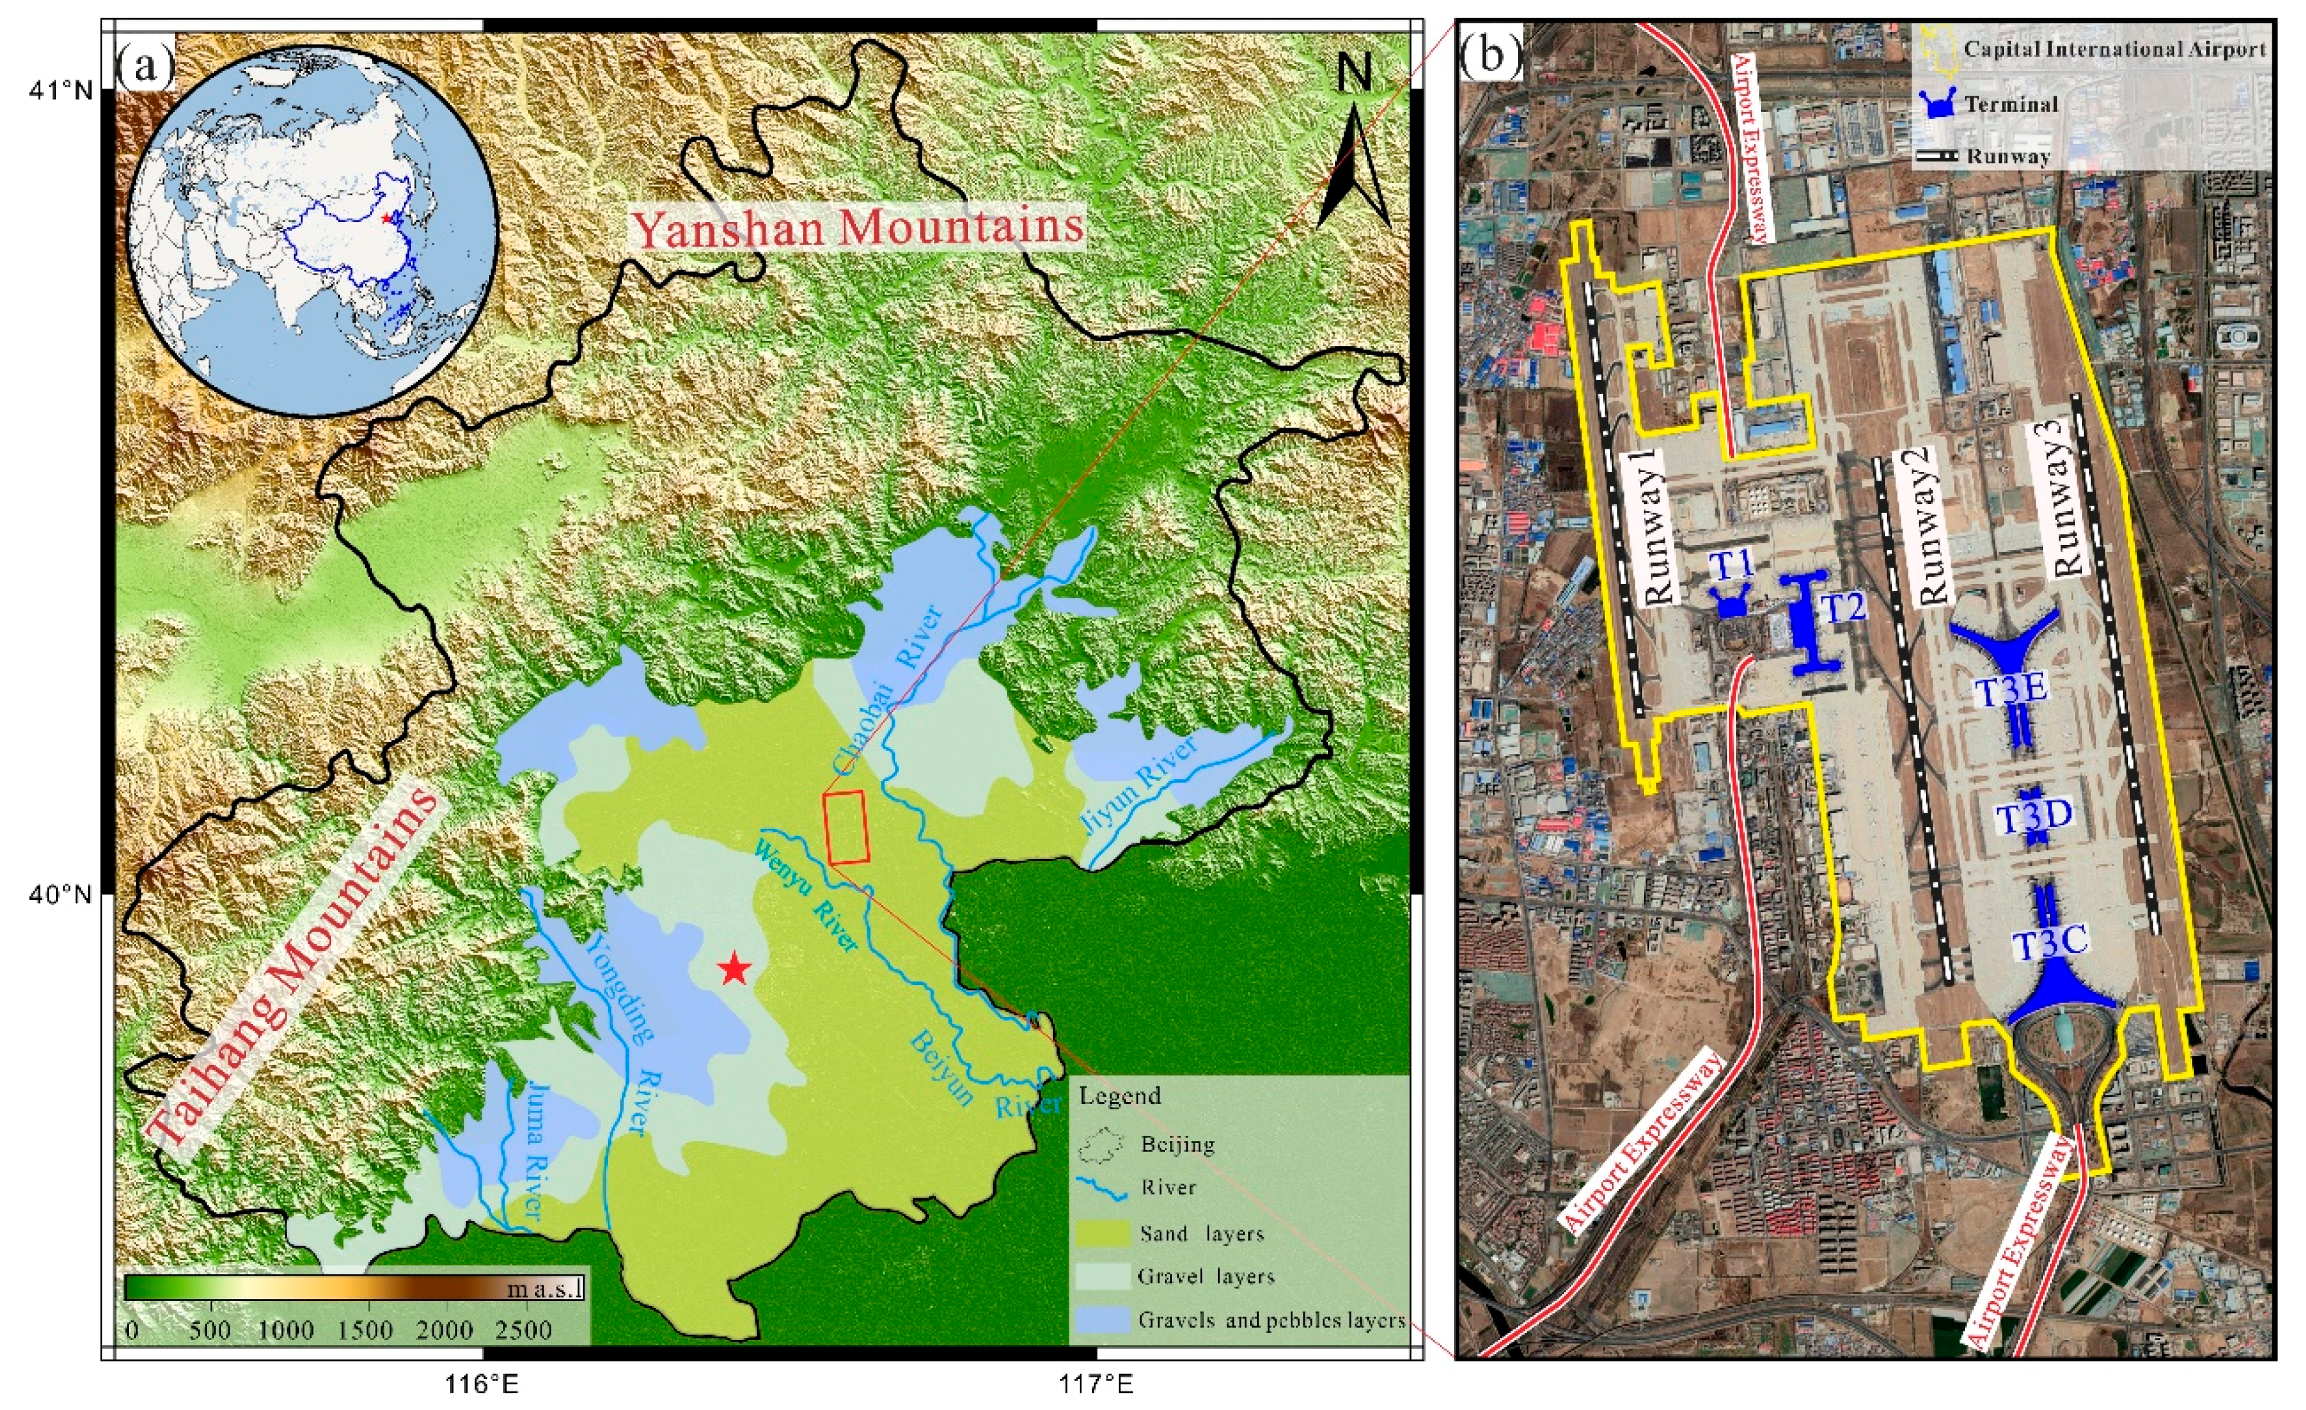
2. Study Area, Data Source
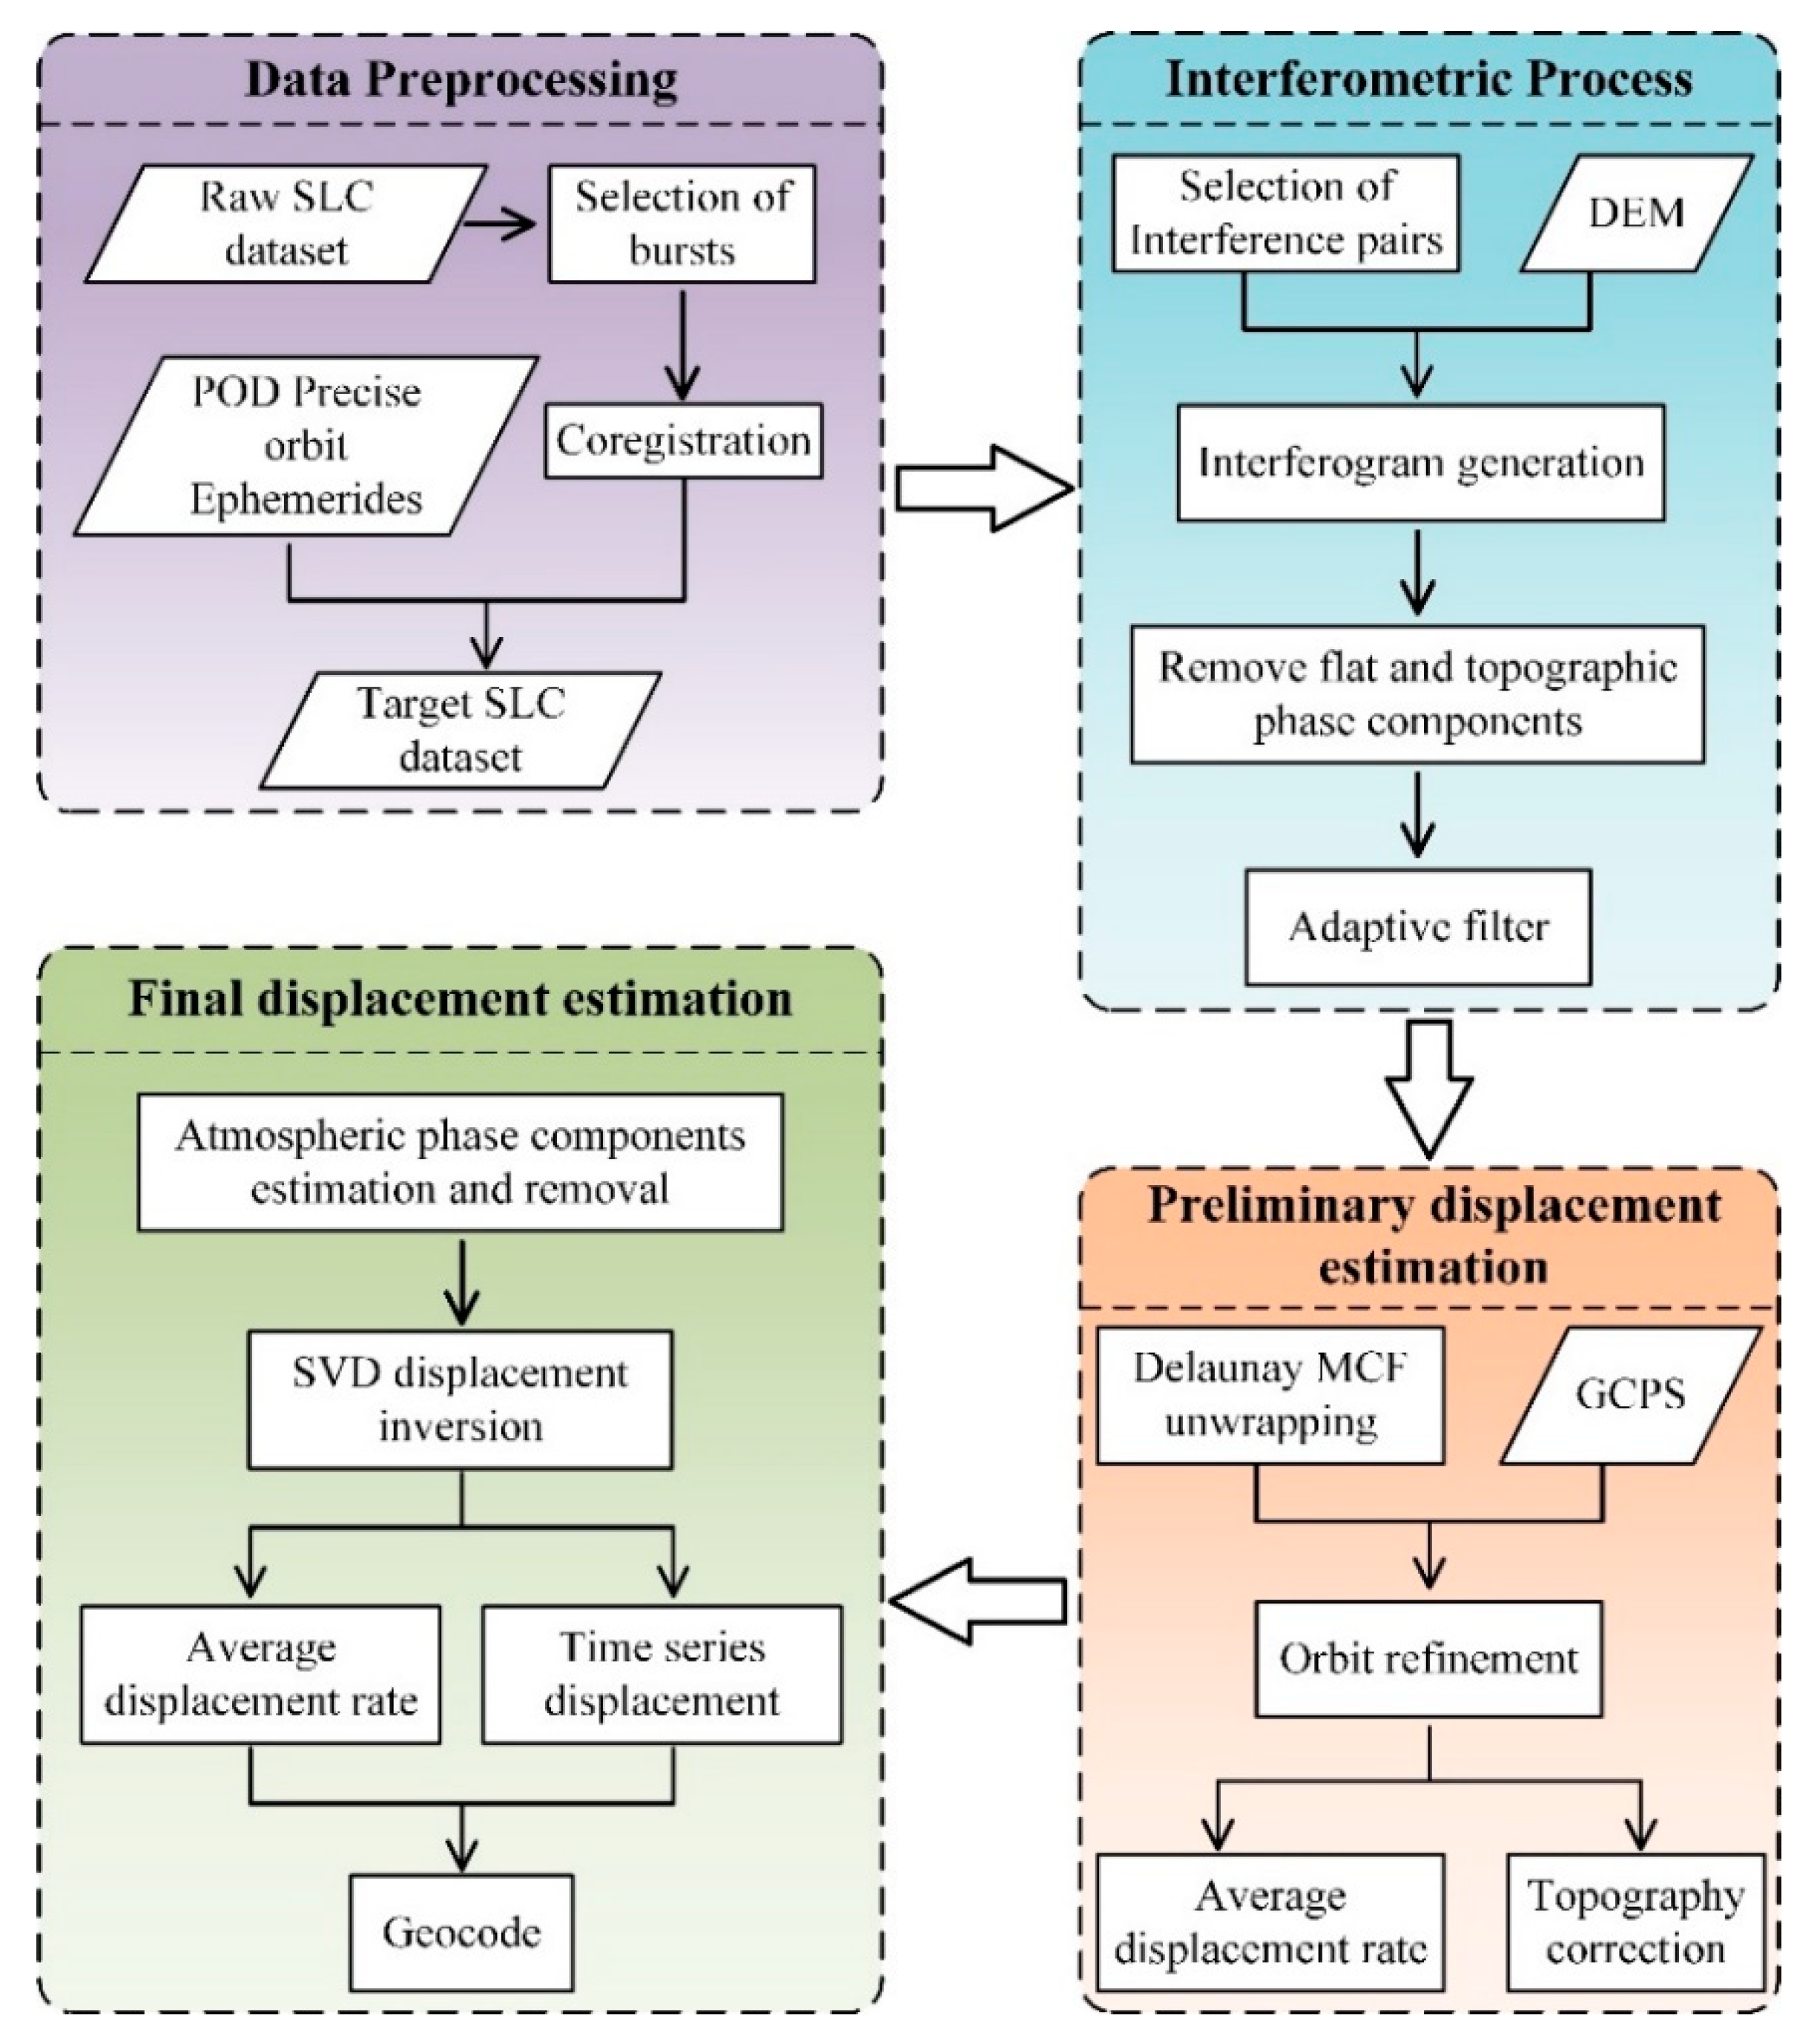
3. Methodology
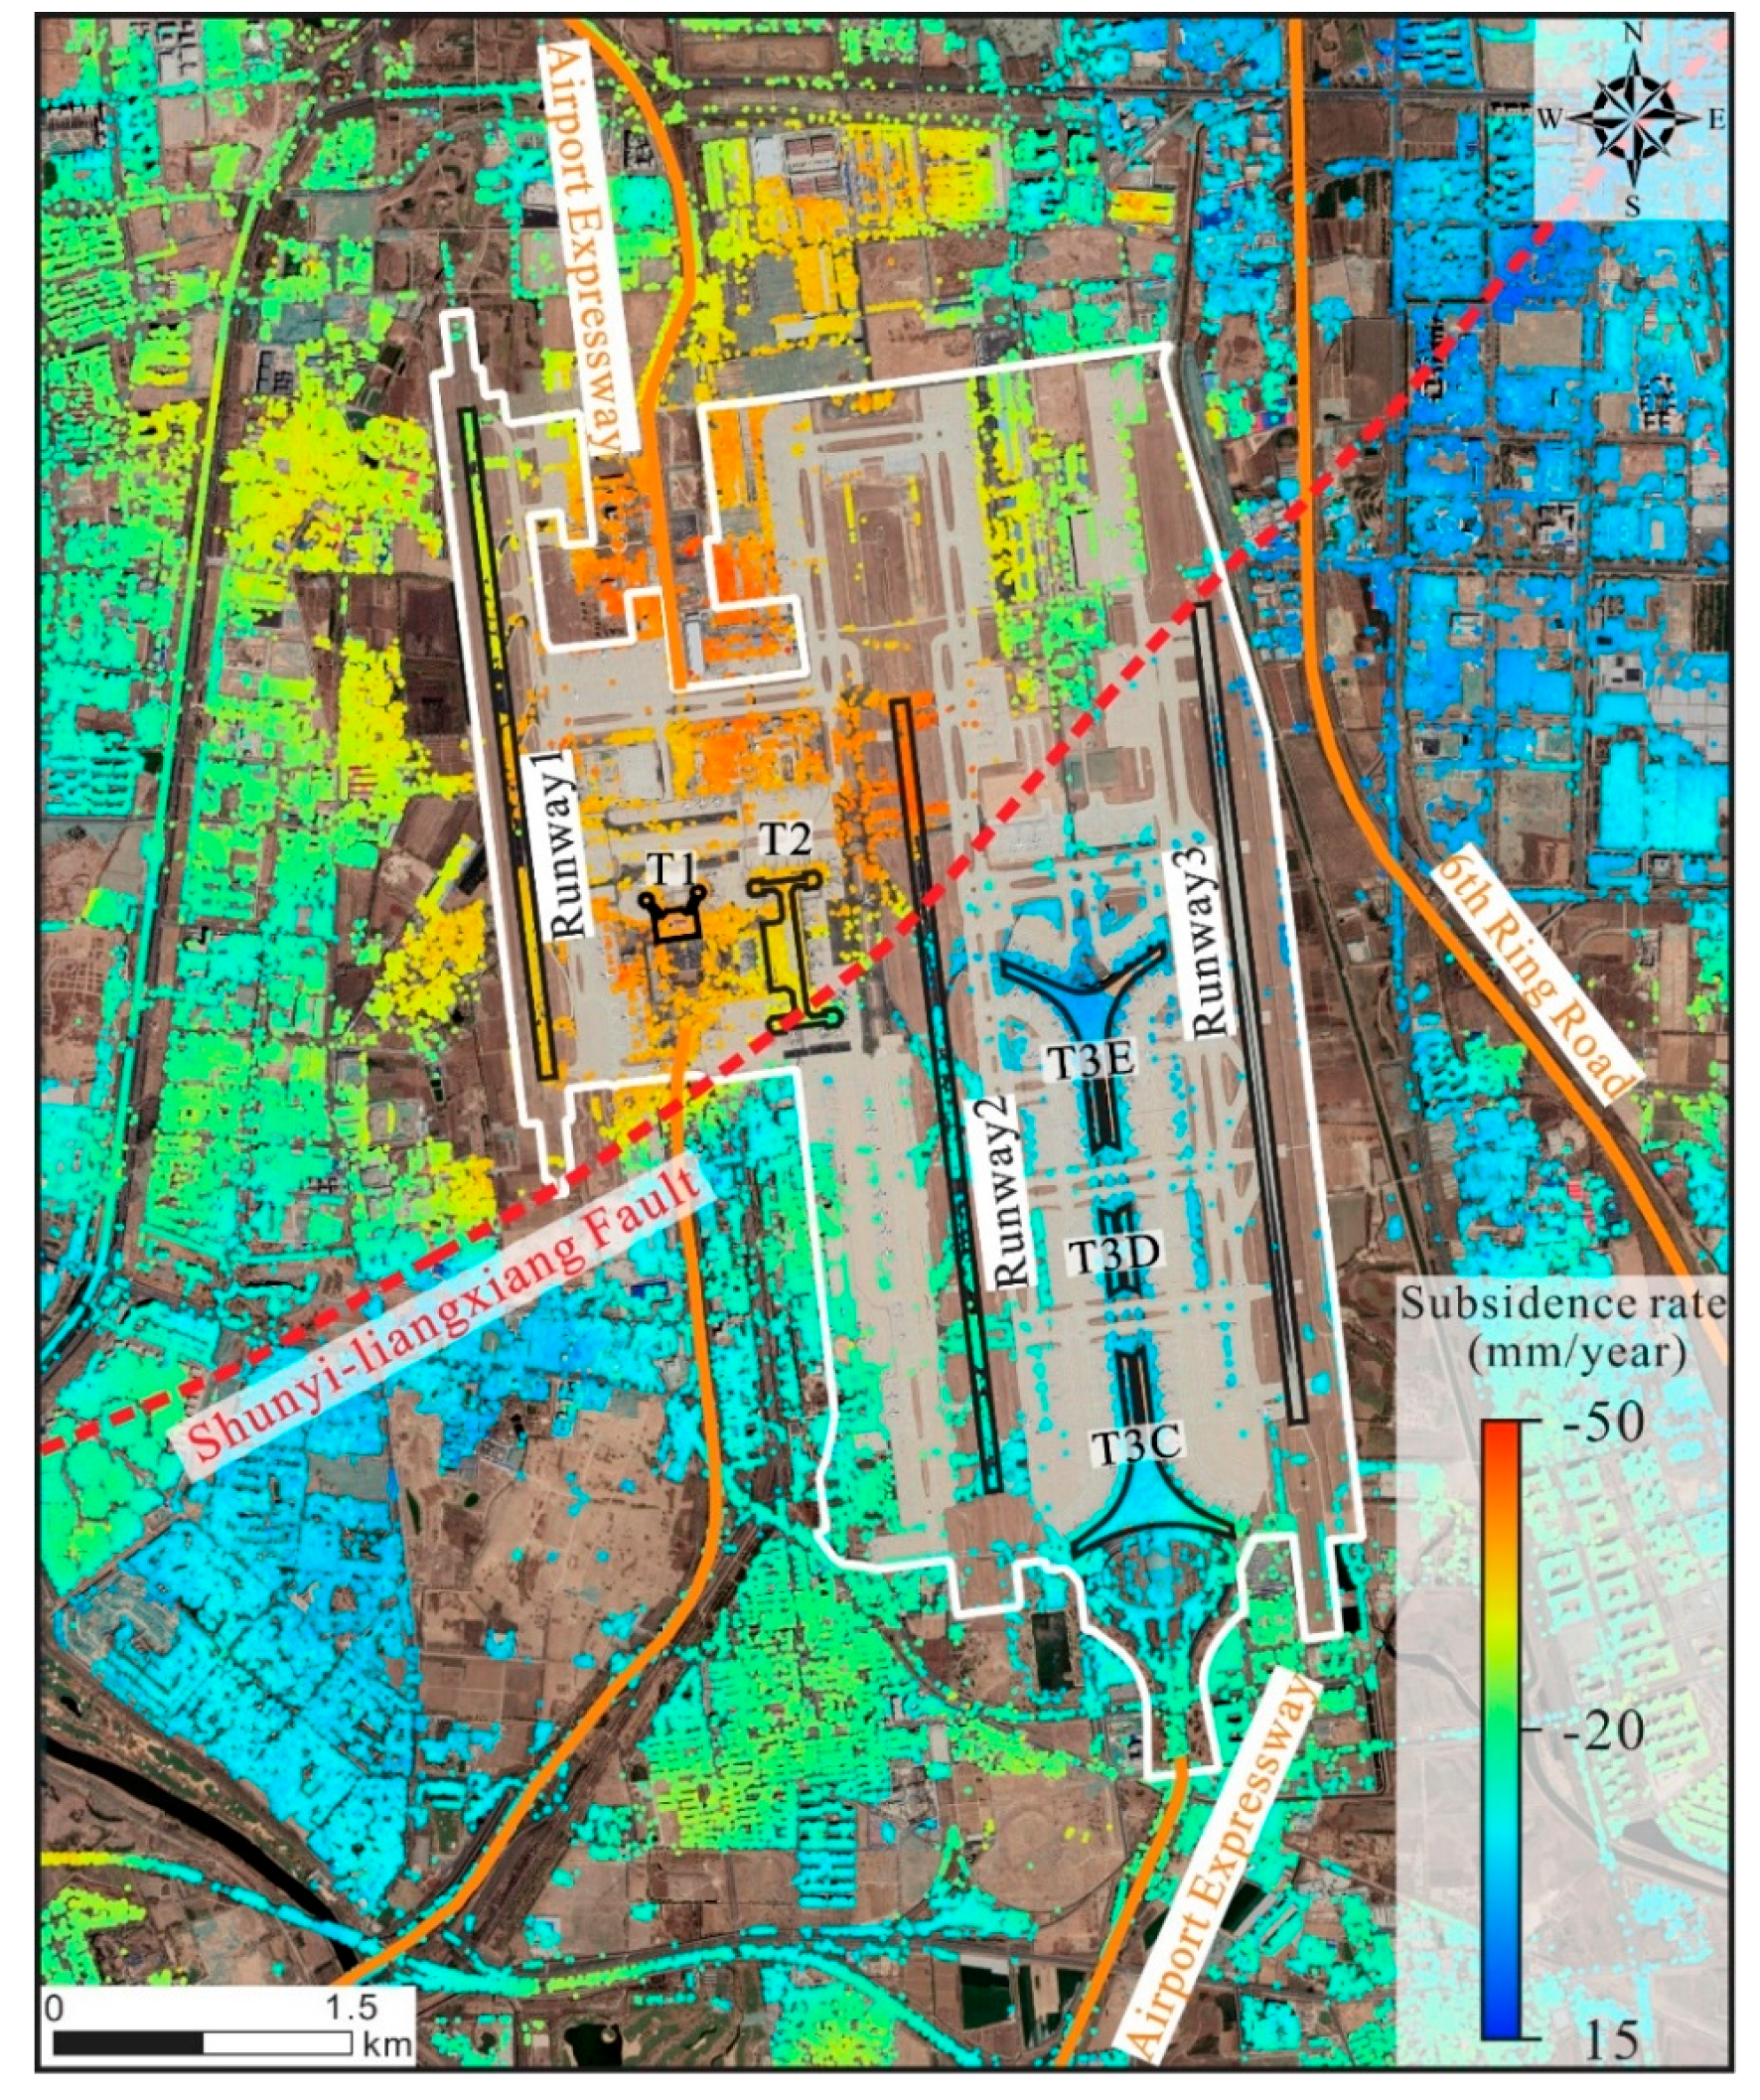
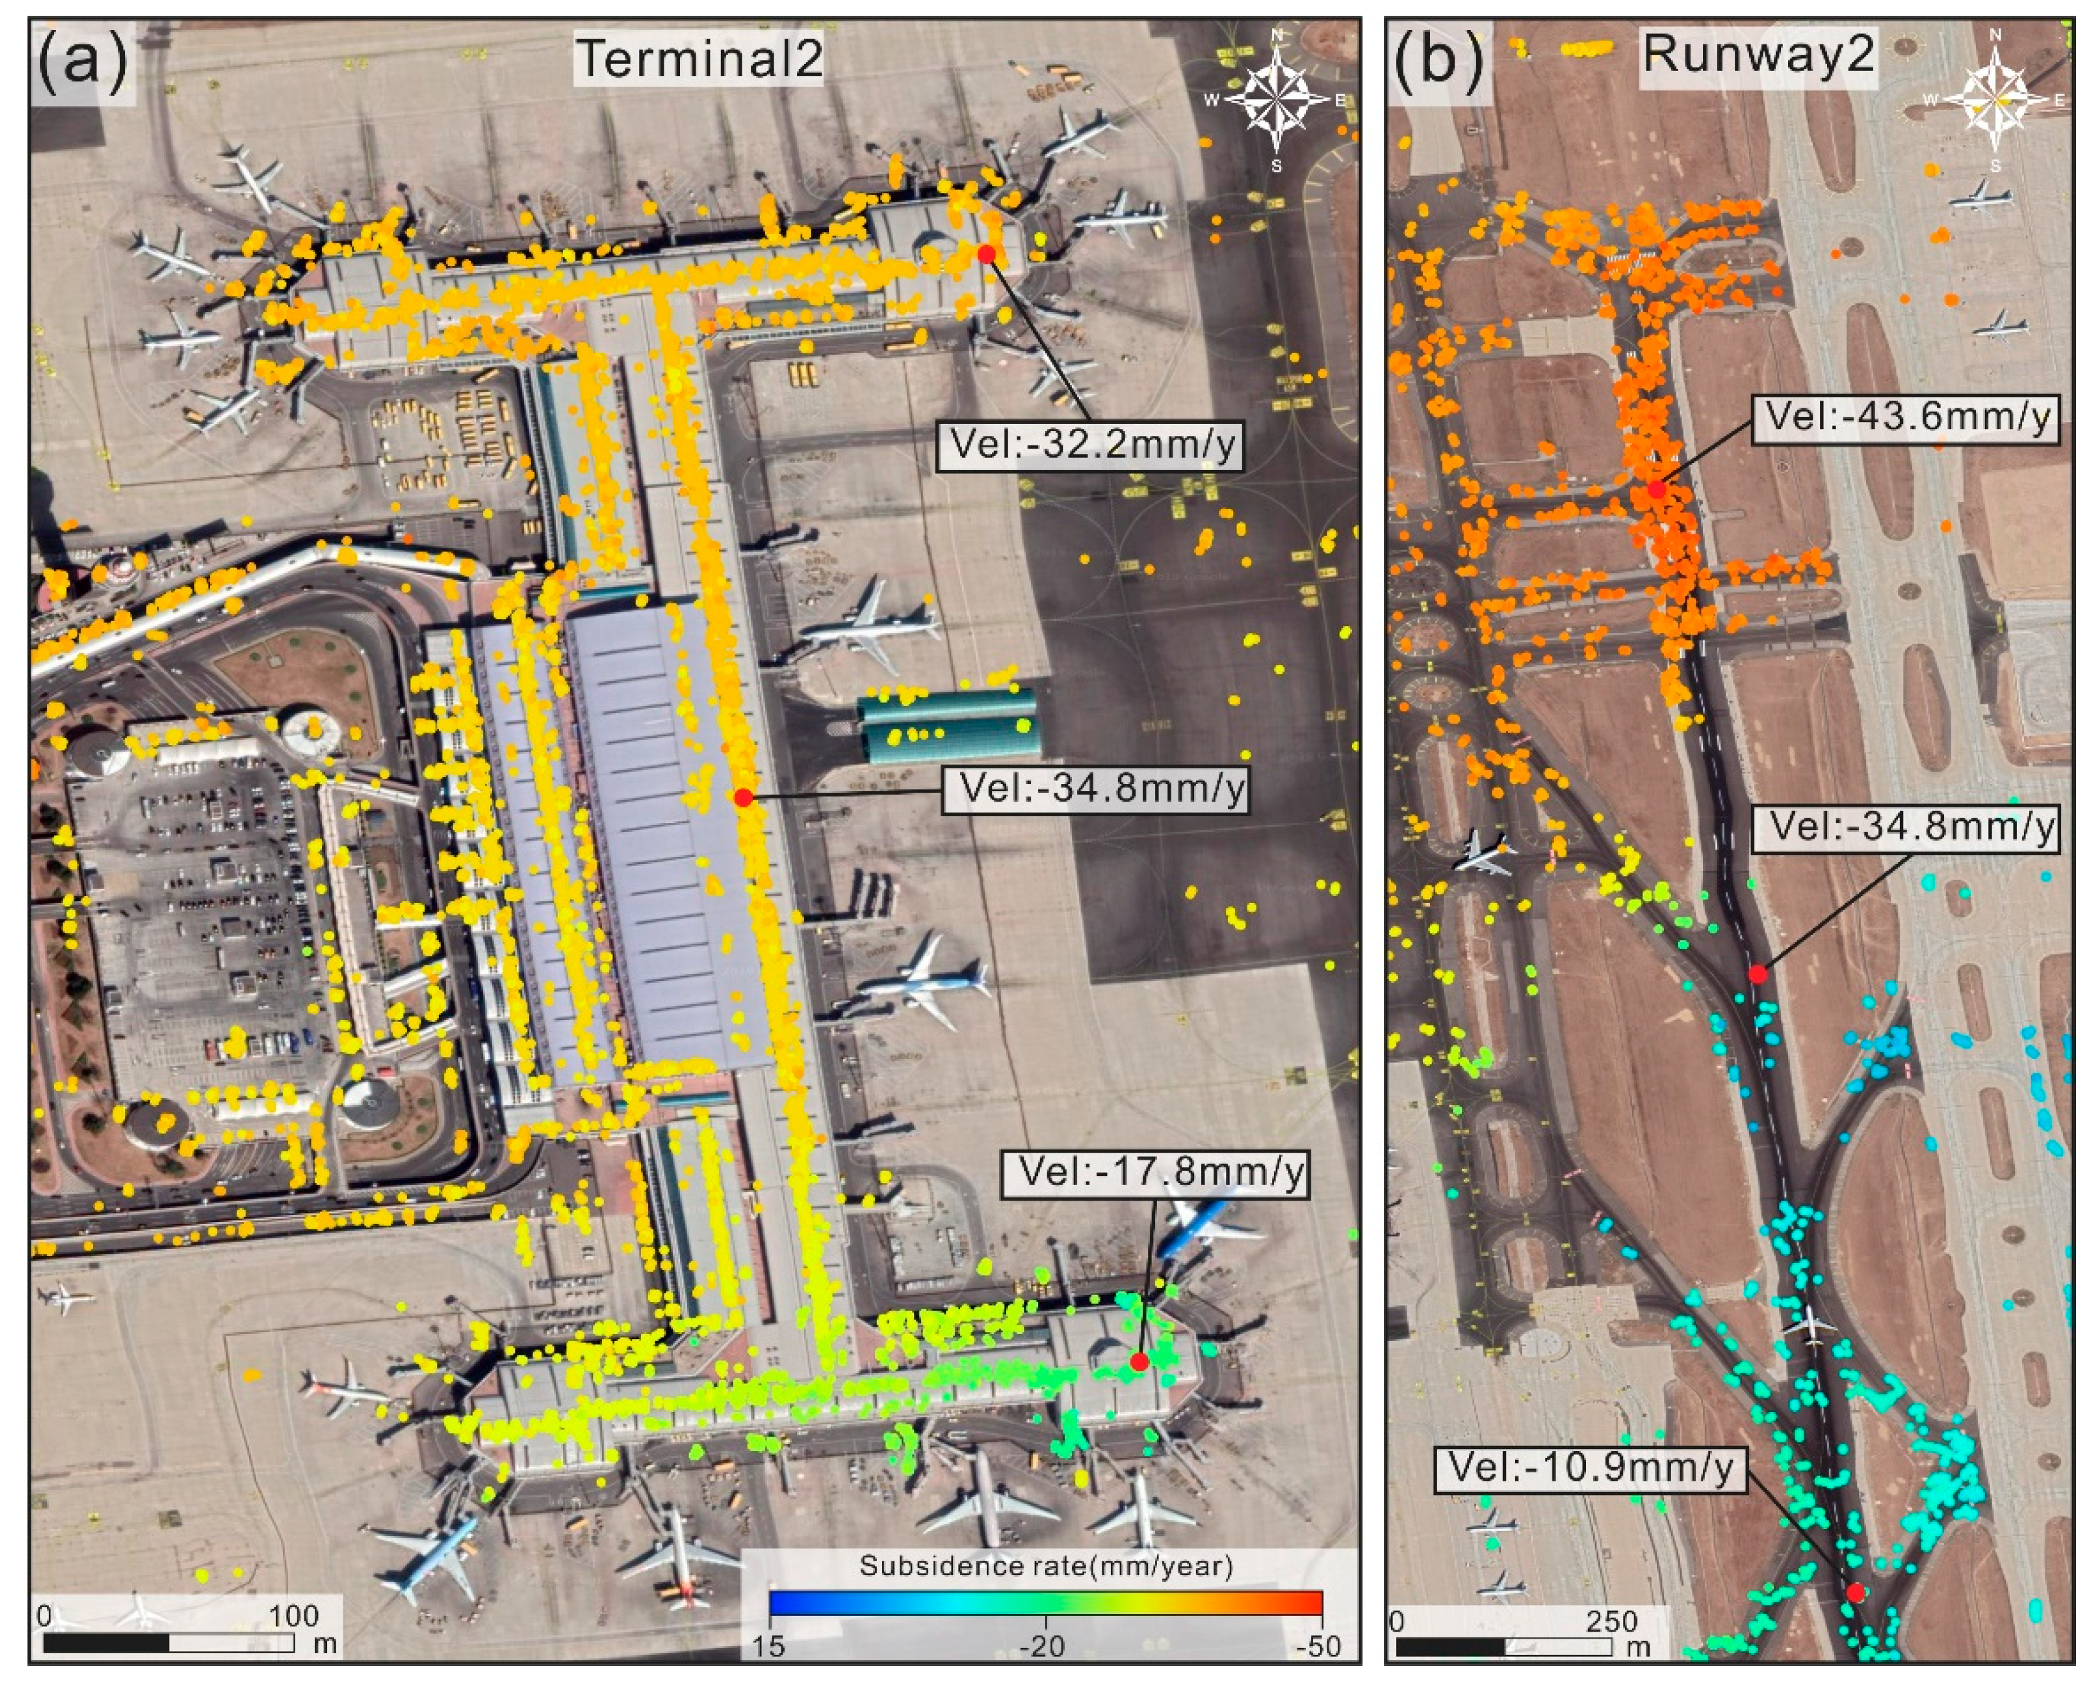
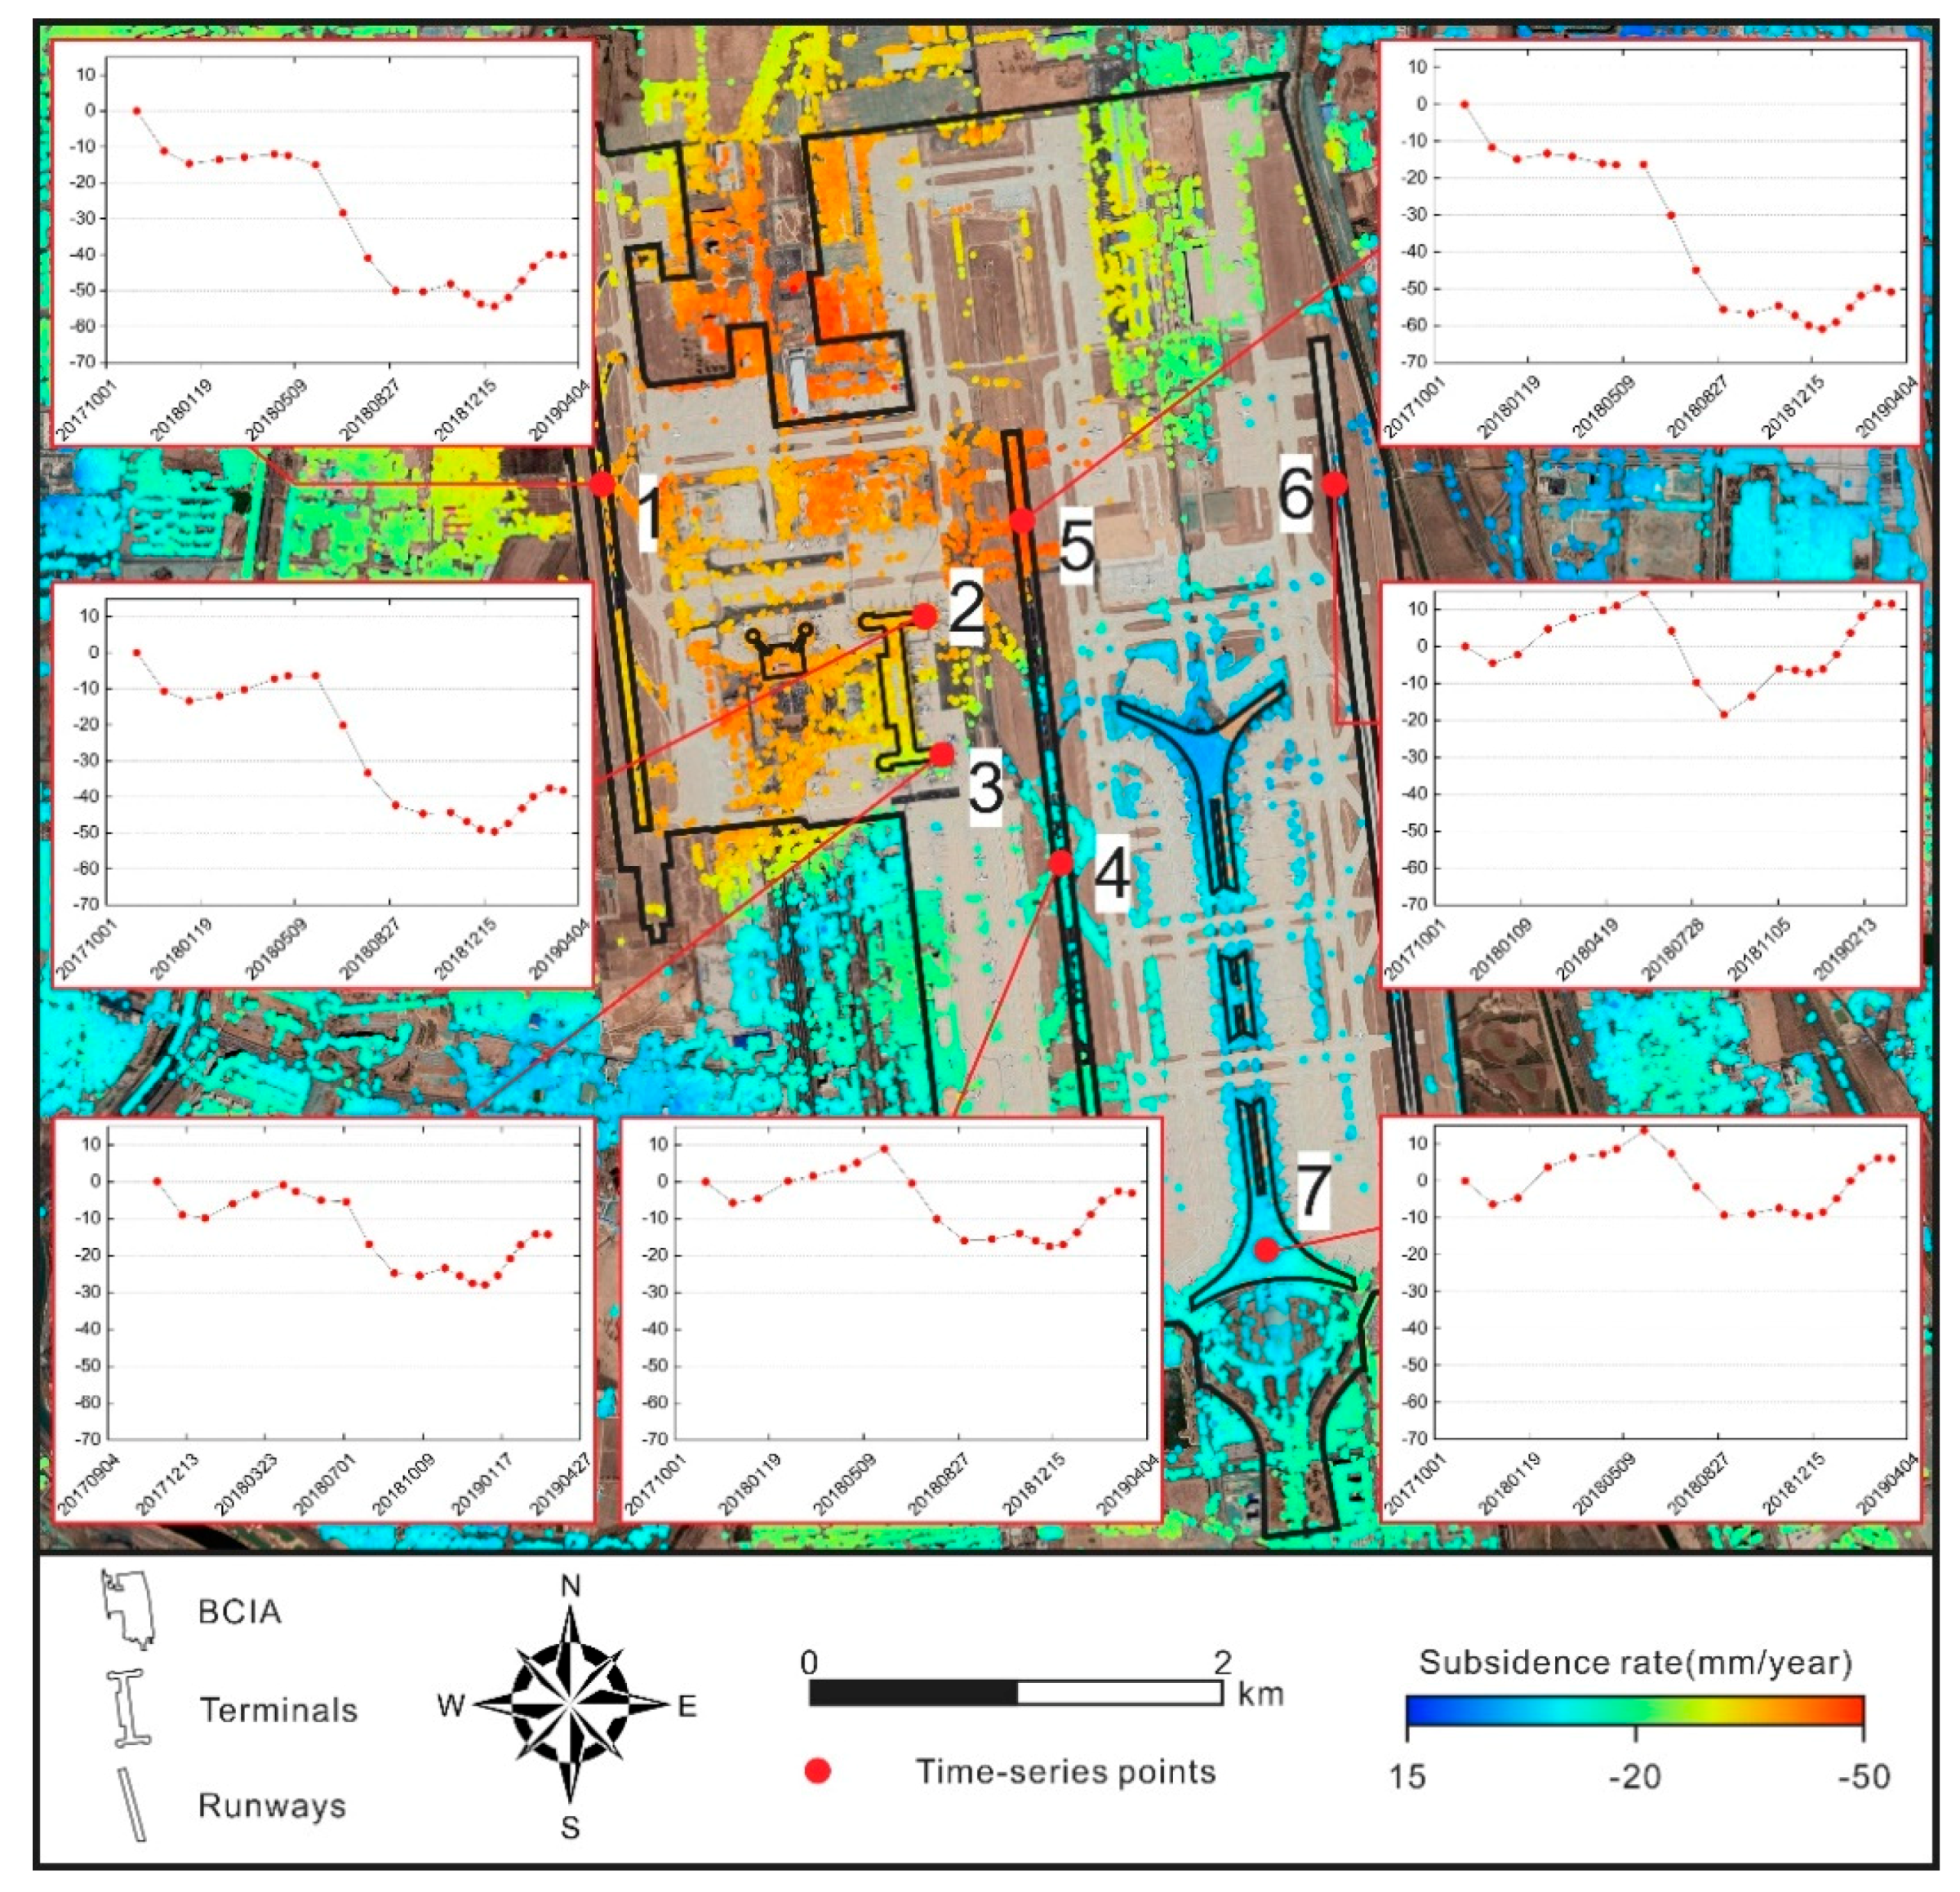
4. Results
5. Discussion
5.1. Driving Factors of Subsidence
5.1.1. Over-Exploitation of Groundwater
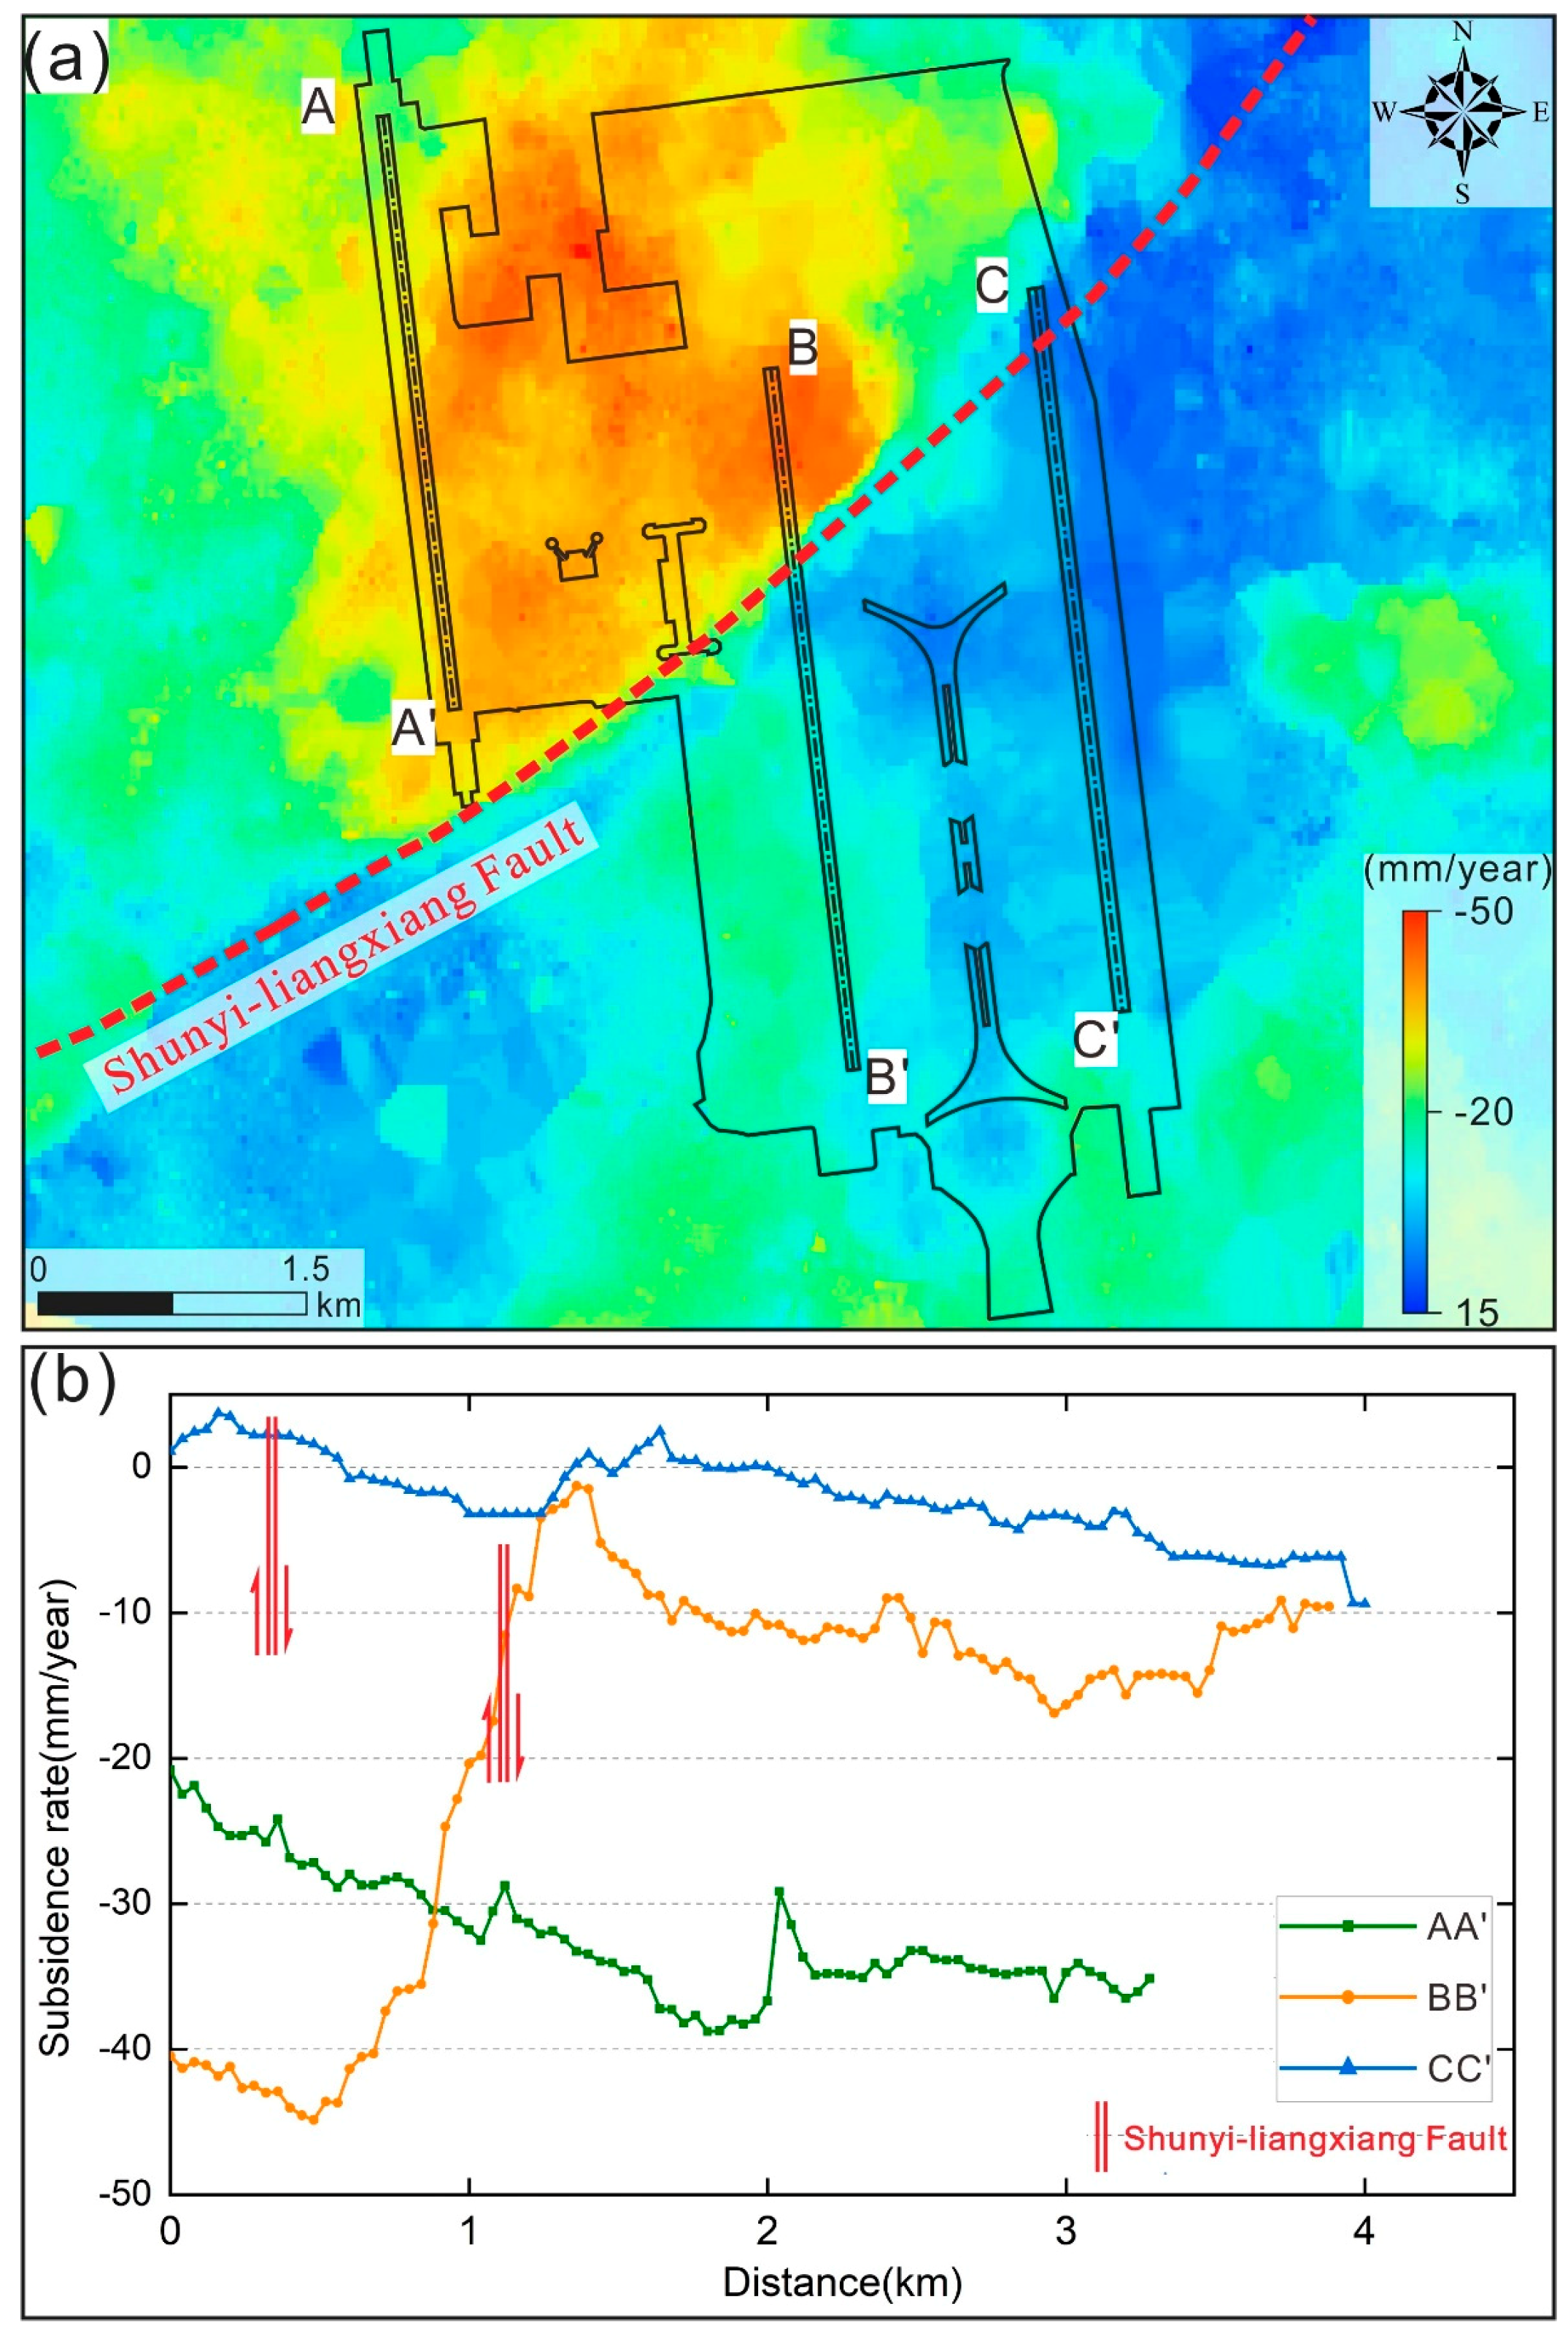
5.1.2. Active Faults
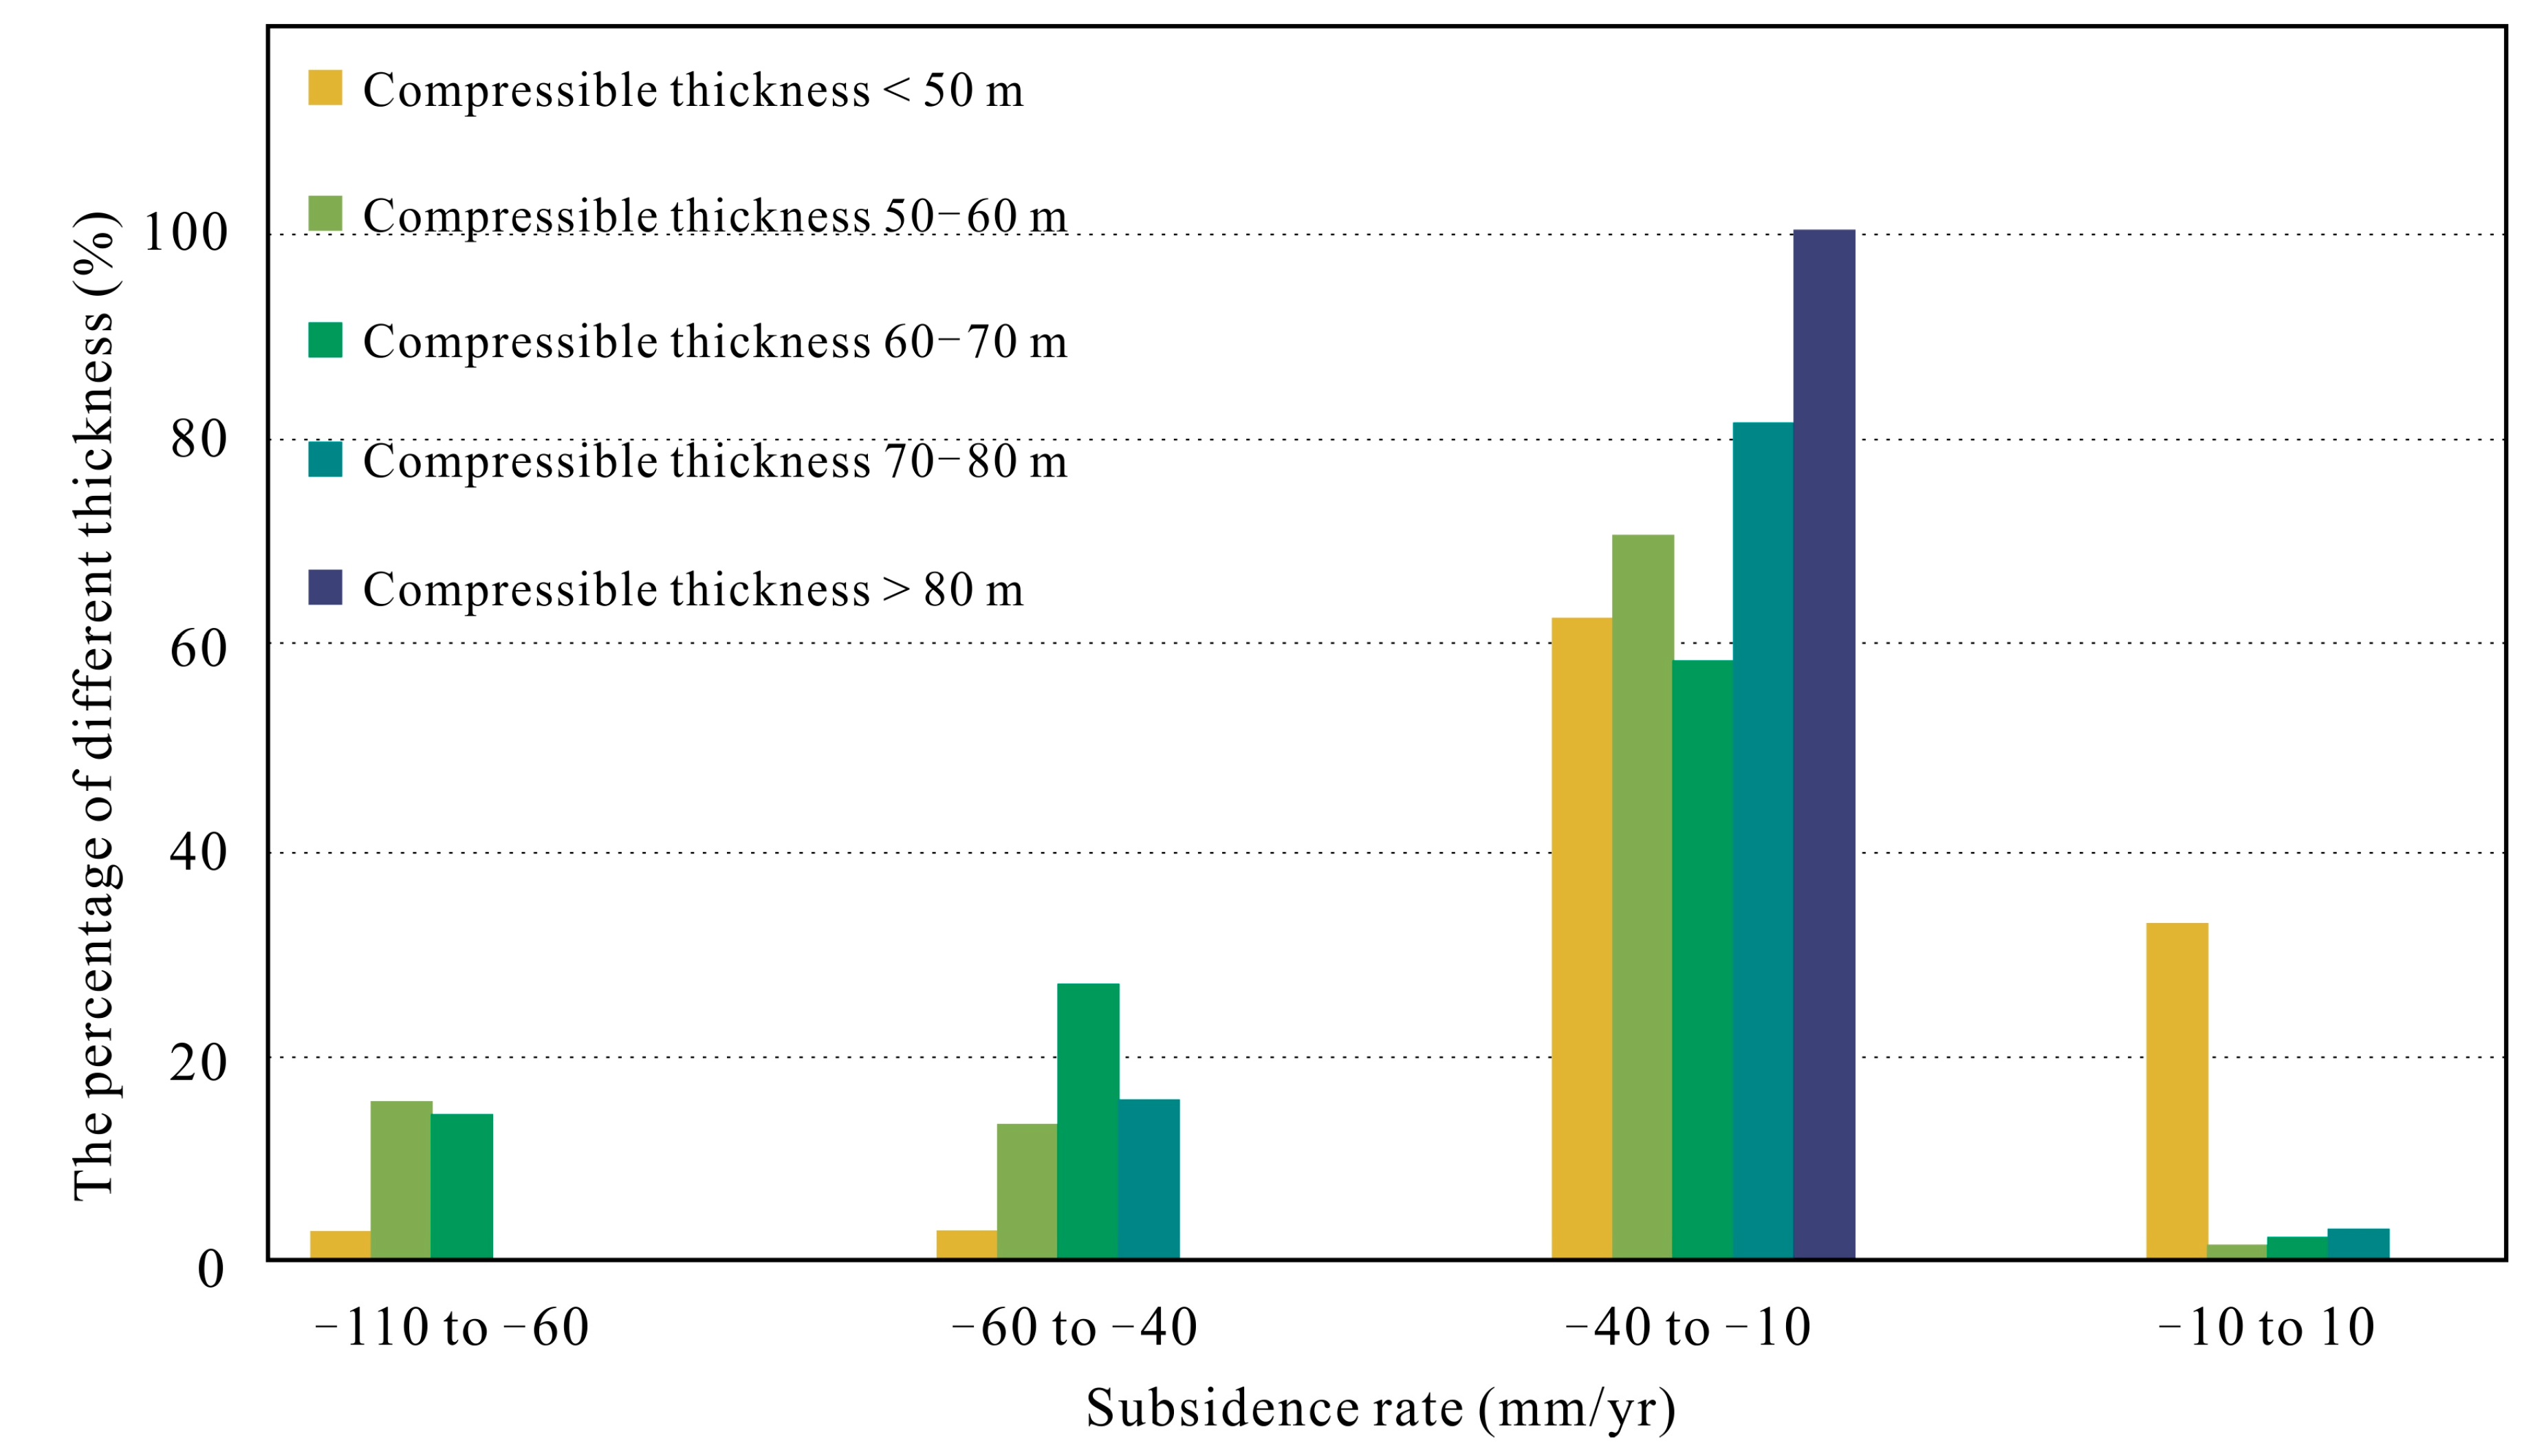
5.1.3. Compressible Soil Thickness
5.1.4. Aquifer Types
5.2. Future Sustainable Development
6. Conclusions
Author Contributions
Funding
Conflicts of Interest
References
- Xu, Y.; Shen, S.; Cai, Z.; Zhou, G. The state of land subsidence and prediction approaches due to groundwater withdrawal in China. Nat. Hazards 2008, 45, 123–135. [Google Scholar] [CrossRef]
- Hu, L.; Dai, K.; Xing, C.; Li, Z.; Tomás, R.; Clark, B.; Shi, X.; Chen, M.; Zhang, R.; Qiu, Q.; et al. Land subsidence in beijing and its relationship with geological faults revealed by sentinel-1 insar observations. Int. J. Appl. Earth Obs. Geoinf. 2019, 82, 101886. [Google Scholar] [CrossRef]
- Du, Z.; Ge, L.; Ng, A.H.-M.; Xiaojing, L.; Li, L. Mapping land subsidence over the eastern Beijing city using satellite radar interferometry. Int. J. Digit. Earth 2018, 11, 504–519. [Google Scholar] [CrossRef]
- Gao, M.; Gong, H.; Chen, B.; Li, X.; Zhou, C.; Shi, M.; Si, Y.; Chen, Z.; Duan, G. Regional land subsidence analysis in eastern Beijing plain by insar time series and wavelet transforms. Remote Sens. 2018, 10, 365. [Google Scholar] [CrossRef]
- Runway and Taxiway Stabilisation. Available online: https://www.geobear.co.uk/airports/ (accessed on 22 August 2019).
- Moreira, A.; Prats-iraola, P.; Younis, M.; Krieger, G.; Hajnsek, I.; Papathanassiou, K. A tutorial on synthetic aperture radar. IEEE Geosci. Remote Sens. Mag. 2013, 1, 6–43. [Google Scholar] [CrossRef]
- Dai, K.; Liu, G.; Li, Z.; Li, T.; Yu, B.; Wang, X.; Singleton, A. Extracting vertical displacement rates in shanghai (China) with multi-platform sar images. Remote Sens. 2015, 7, 9542–9562. [Google Scholar] [CrossRef]
- Chen, M.; Tomás, R.; Li, Z.; Motagh, M.; Li, T.; Hu, L.; Gong, H.; Li, X.; Yu, J.; Gong, X. Imaging land subsidence induced by groundwater extraction in Beijing (China) using satellite radar interferometry. Remote Sens. 2016, 8, 468. [Google Scholar] [CrossRef]
- Chaussard, E.; Wdowinski, S.; Cabral-Cano, E.; Amelung, F. Land subsidence in central Mexico detected by alos insar time-series. Remote Sens. Environ. 2014, 140, 94–106. [Google Scholar] [CrossRef]
- Delgado Blasco, J.M.; Foumelis, M.; Stewart, C.; Hooper, A. Measuring urban subsidence in the rome metropolitan area (italy) with sentinel-1 snap-stamps persistent scatterer interferometry. Remote Sens. 2019, 11, 129. [Google Scholar] [CrossRef]
- Blachowski, J.; Kopec, A.; Milczarek, W.; Owczarz, K. Evolution of secondary deformations captured by satellite radar interferometry: Case study of an abandoned coal basin in sw poland. Sustainability 2019, 11, 884. [Google Scholar] [CrossRef]
- Motagh, M.; Shamshiri, R.; Haghshenas Haghighi, M.; Wetzel, H.-U.; Akbari, B.; Nahavandchi, H.; Roessner, S.; Arabi, S. Quantifying groundwater exploitation induced subsidence in the rafsanjan plain, southeastern iran, using insar time-series and in situ measurements. Eng. Geol. 2017, 218, 134–151. [Google Scholar] [CrossRef]
- Luo, Q.; Zhou, G.; Perissin, D. Monitoring of subsidence along jingjin inter-city railway with high-resolution terrasar-x mt-insar analysis. Remote Sens. 2017, 9, 717. [Google Scholar] [CrossRef]
- Ge, L.; Li, X.; Chang, H.-C.; Ng, A.H.; Zhang, K.; Hu, Z. Impact of ground subsidence on the Beijing–Tianjin high-speed railway as mapped by radar interferometry. Ann. GIS 2010, 16, 91–102. [Google Scholar] [CrossRef]
- Dai, K.; Liu, G.; Li, Z.; Ma, D.; Wang, X.; Zhang, B.; Tang, J.; Li, G. Monitoring highway stability in permafrost regions with x-band temporary scatterers stacking insar. Sensors 2018, 18, 1876. [Google Scholar] [CrossRef] [PubMed]
- Huang, Q.; Monserrat, O.; Crosetto, M.; Crippa, B.; Wang, Y.; Jiang, J.; Ding, Y. Displacement monitoring and health evaluation of two bridges using sentinel-1 sar images. Remote Sens. 2018, 10, 1714. [Google Scholar] [CrossRef]
- Zhao, C.; Zhang, Q.; He, Y.; Peng, J.; Yang, C.; Kang, Y. Small-scale loess landslide monitoring with small baseline subsets interferometric synthetic aperture radar technique—Case study of xingyuan landslide, Shaanxi, China. J. Appl. Remote Sens. 2016, 10, 026030. [Google Scholar] [CrossRef]
- Dai, K.; Li, Z.; Xu, Q.; Burgmann, R.; Milledge, D.; Tomás, R.; Fan, X.; Zhao, C.; Liu, X.; Peng, J.; et al. Entering the era of Earth-Observation based landslide warning system. IEEE Geosci. Remote Sens. Mag. 2020, 8, 136–153. [Google Scholar] [CrossRef]
- Tomas, R.; Li, Z.; Liu, P.; Singleton, A.; Hoey, T.; Cheng, X. Spatiotemporal characteristics of the huangtupo landslide in the three gorges region (China) constrained by radar interferometry. Geophys. J. Int. 2014, 197, 213–232. [Google Scholar] [CrossRef]
- Tofani, V.; Raspini, F.; Catani, F.; Casagli, N. Persistent scatterer interferometry (psi) technique for landslide characterization and monitoring. Remote Sens. 2013, 5, 1045–1065. [Google Scholar] [CrossRef]
- Qu, T.; Lu, P.; Liu, C.; Wu, H.; Shao, X.; Wan, H.; Li, N.; Li, R. Hybrid-sar technique: Joint analysis using phase-based and amplitude-based methods for the xishancun giant landslide monitoring. Remote Sens. 2016, 8, 874. [Google Scholar] [CrossRef]
- Jiang, L.; Lin, H. Integrated analysis of sar interferometric and geological data for investigating long-term reclamation settlement of chek lap kok airport, Hong Kong. Eng. Geol. 2010, 110, 77–92. [Google Scholar] [CrossRef]
- Gao, M.; Gong, H.; Chen, B.; Zhou, C.; Chen, W.; Liang, Y.; Shi, M.; Si, Y. Insar time-series investigation of long-term ground displacement at beijing capital international airport, China. Tectonophysics 2016, 691, 271–281. [Google Scholar] [CrossRef]
- Gao, M.; Gong, H.; Li, X.; Chen, B.; Zhou, C.; Shi, M.; Guo, L.; Chen, Z.; Ni, Z.; Duan, G. Land subsidence and ground fissures in Beijing capital international airport (bcia): Evidence from quasi-ps insar analysis. Remote Sens. 2019, 11, 1466. [Google Scholar] [CrossRef]
- Beijing Capital International Airport. Available online: http://www.airports-china.com/beijing-zbaa-pek.htm (accessed on 22 August 2019).
- Wikipedia Cosmo-SkyMed. Available online: https://en.wikipedia.org/wiki/COSMO-SkyMed (accessed on 22 August 2019).
- Covello, F.; Battazza, F.; Coletta, A.; Lopinto, E.; Fiorentino, C.; Pietranera, L.; Valentini, G.; Zoffoli, S. Cosmo-skymed an existing opportunity for observing the earth. J. Geodyn. 2010, 49, 171–180. [Google Scholar] [CrossRef]
- Berardino, P.; Fornaro, G.; Lanari, R.; Sansosti, E. A new algorithm for surface deformation monitoring based on small baseline differential SAR interferograms. IEEE Trans. Geosci. Remote Sens. 2002, 40, 2375–2383. [Google Scholar] [CrossRef]
- Li, Z.; Fielding, E.J.; Cross, P. Integration of INSAR time-series analysis and watervapor correction for mapping postseismic motion after the 2003 Bam(Iran) earthquake. IEEE Trans. Geosci. Remote Sens. 2009, 47, 3220–3230. [Google Scholar]
- Dai, K.; Li, Z.; Tomás, R.; Liu, G.; Yu, B.; Wang, X.; Cheng, H.; Chen, J.; Stockamp, J. Monitoring activity at the daguangbao mega-landslide (China) using sentinel-1 tops time series interferometry. Remote Sens. Environ. 2016, 186, 501–513. [Google Scholar] [CrossRef]
- Casu, F.; Manconi, A.; Pepe, A.; Lanari, R. Deformation time-series generation in areas characterized by large displacement dynamics: The SAR amplitude pixel-offset SBAS technique. IEEE Trans. Geosci. Remote Sens. 2011, 49, 2752–2763. [Google Scholar] [CrossRef]
- Liu, G.; Ding, X.; Chen, Y.; Li, Z.; Li, Z. Ground settlement of chek lap kok airport, Hong Kong, detected by satellite synthetic aperture radar interferometry. Chin. Sci. Bull. 2001, 46, 1778–1782. [Google Scholar] [CrossRef]
- Puzrin, A.M.; Alonso, E.E.; Pinyol, N. Unexpected excessive settlements: Kansai international airport, japan. In Geomechanics of Failures; Springer: Berlin/Heidelberg, Germany, 2010; pp. 23–43. [Google Scholar]
- The Airport Is Sinking. Available online: https://www.airspacemag.com/flight-today/how-to-save-a-sinking-airport-180968985/ (accessed on 22 August 2019).
- Sea Level Rise in the SF Bay Area Just Got a Lot More Dire. Available online: https://www.wired.com/story/sea-level-rise-in-the-sf-bay-area/?verso=true (accessed on 22 August 2019).
- Zhang, Y.; Gong, H.; Gu, Z.; Wang, R.; Li, X.; Zhao, W. Characterization of land subsidence induced by groundwater withdrawals in the plain of Beijing city, China. Hydrogeol. J. 2014, 22, 397–409. [Google Scholar] [CrossRef]
- Chen, B.; Gong, H.; Li, X.; Lei, K.; Gao, M.; Zhou, C.; Ke, Y. Spatial–temporal evolution patterns of land subsidence with different situation of space utilization. Nat. Hazards 2015, 77, 1765–1783. [Google Scholar] [CrossRef]
- Galloway, D.L.; Jones, D.R.; Ingebritsen, S.E. Land Subsidence in the United States; US Geological Survey: Reston, VA, USA, 1999; Volume 1182.
- Deng, Q.; Zhang, P.; Ran, Y.; Yang, X.; Min, W.; Chu, Q. Basic characteristics of active tectonics of China. Sci. China 2003, 46, 356–372. [Google Scholar]
- Tomas, R.; Herrera, G.; Lopez-Sanchez, J.; Vicente, F.; Cuenca, A.; Mallorquí, J. Study of the land subsidence in orihuela city (SE Spain) using psi data: Distribution, evolution and correlation with conditioning and triggering factors. Eng. Geol. 2010, 115, 105–121. [Google Scholar] [CrossRef]
- Jia, S.; Wang, H.; Zhao, S.; Luo, Y. A tentative study of the mechanism of land subsidence in Beijing. City Geol. 2007, 2, 20–26. [Google Scholar]
- Airport Technology—Beijing Daxing International Airport. Available online: https://www.airport-technology.com/projects/beijing-daxing-international-airport-china/ (accessed on 4 September 2019).


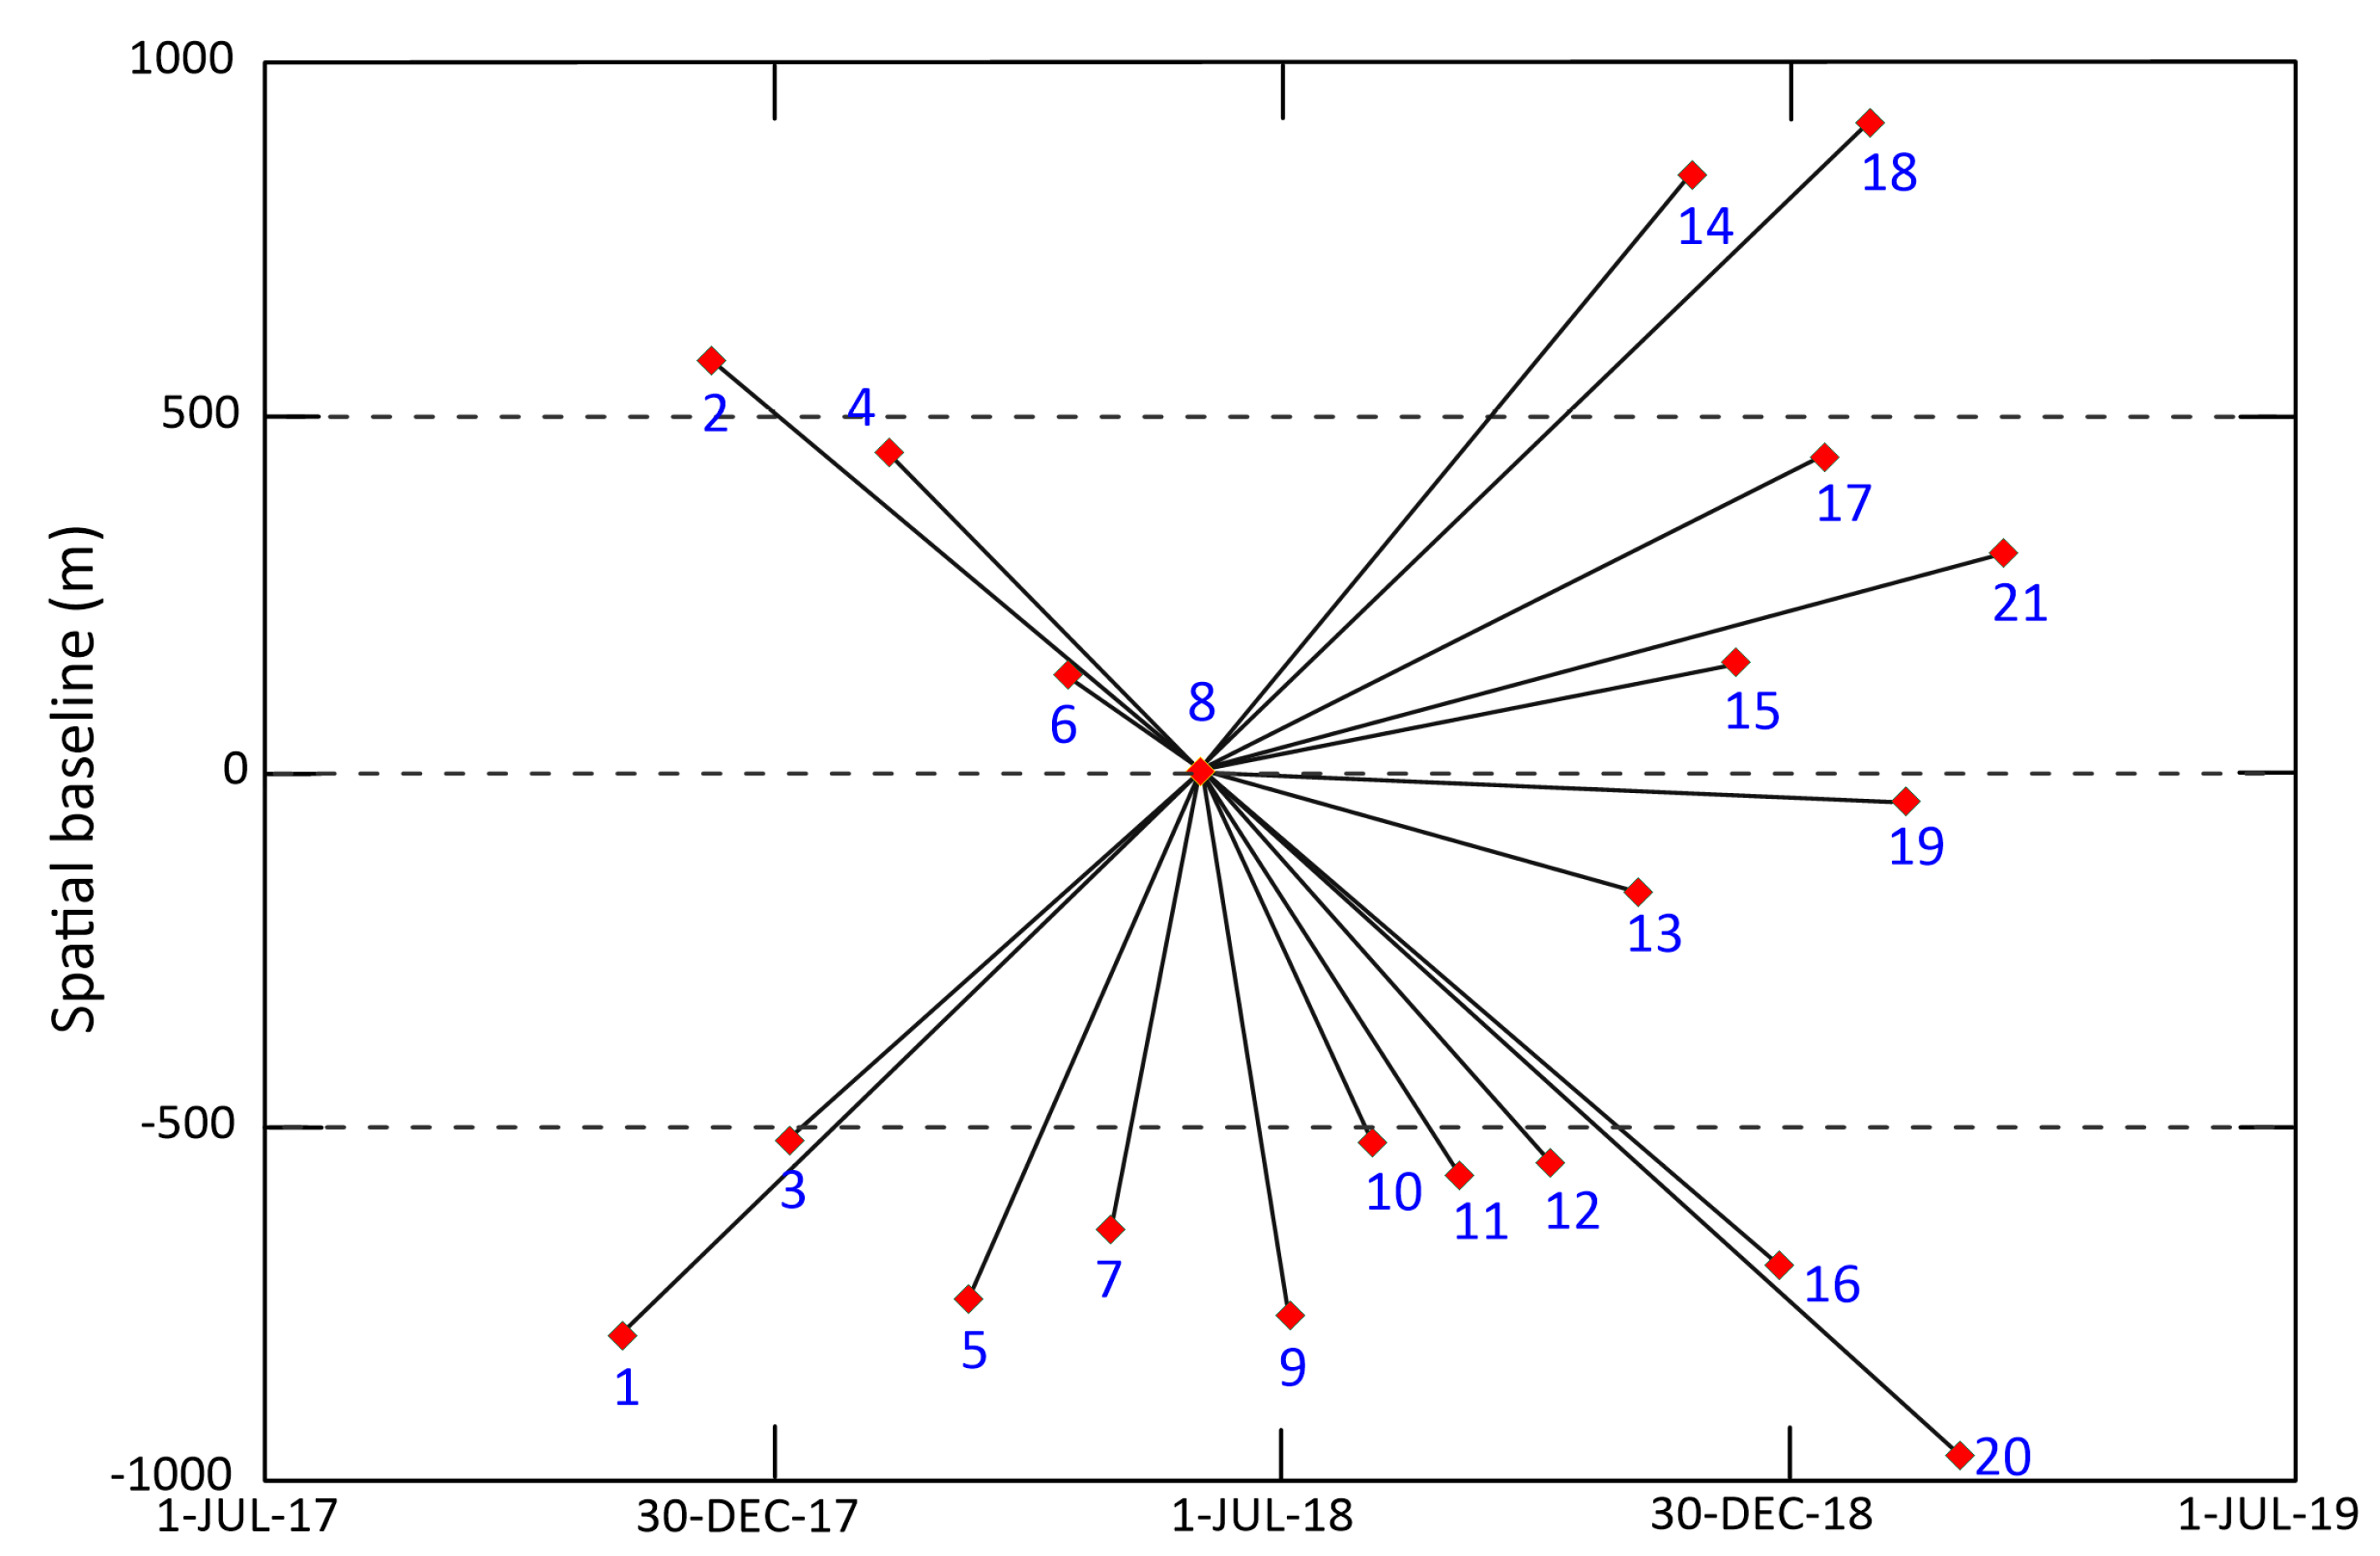
| ID | Date | Temporal Baseline/d | Polarization | ID | Date | Temporal Baseline/d | Polarization |
|---|---|---|---|---|---|---|---|
| 1 | 20171106 | −208 | HH | 12 | 20181005 | 125 | HH |
| 2 | 20171208 | −176 | HH | 13 | 20181106 | 157 | HH |
| 3 | 20180106 | −147 | HH | 14 | 20181125 | 176 | HH |
| 4 | 20180210 | −112 | HH | 15 | 20181211 | 192 | HH |
| 5 | 20180311 | −83 | HH | 16 | 20181227 | 208 | HH |
| 6 | 20180415 | −48 | HH | 17 | 20190112 | 224 | HH |
| 7 | 20180501 | −32 | HH | 18 | 20190128 | 240 | HH |
| 8 | 20180602 | 0 | HH | 19 | 20190210 | 253 | HH |
| 9 | 20180704 | 32 | HH | 20 | 20190301 | 272 | HH |
| 10 | 20180802 | 61 | HH | 21 | 20190317 | 288 | HH |
| 11 | 20180903 | 93 | HH |
© 2020 by the authors. Licensee MDPI, Basel, Switzerland. This article is an open access article distributed under the terms and conditions of the Creative Commons Attribution (CC BY) license (http://creativecommons.org/licenses/by/4.0/).
Share and Cite
Dai, K.; Shi, X.; Gou, J.; Hu, L.; Chen, M.; Zhao, L.; Dong, X.; Li, Z. Diagnosing Subsidence Geohazard at Beijing Capital International Airport, from High-Resolution SAR Interferometry. Sustainability 2020, 12, 2269. https://doi.org/10.3390/su12062269
Dai K, Shi X, Gou J, Hu L, Chen M, Zhao L, Dong X, Li Z. Diagnosing Subsidence Geohazard at Beijing Capital International Airport, from High-Resolution SAR Interferometry. Sustainability. 2020; 12(6):2269. https://doi.org/10.3390/su12062269
Chicago/Turabian StyleDai, Keren, Xianlin Shi, Jisong Gou, Leyin Hu, Mi Chen, Liang Zhao, Xiujun Dong, and Zhenhong Li. 2020. "Diagnosing Subsidence Geohazard at Beijing Capital International Airport, from High-Resolution SAR Interferometry" Sustainability 12, no. 6: 2269. https://doi.org/10.3390/su12062269
APA StyleDai, K., Shi, X., Gou, J., Hu, L., Chen, M., Zhao, L., Dong, X., & Li, Z. (2020). Diagnosing Subsidence Geohazard at Beijing Capital International Airport, from High-Resolution SAR Interferometry. Sustainability, 12(6), 2269. https://doi.org/10.3390/su12062269