Technical Note

Land Damage Mapping and Liquefaction Potential Analysis of Soils from the Epicentral Region of 2017 Pohang Mw 5.4 Earthquake, South Korea

1
Active Fault and Earthquake Hazard Mitigation Research Institute, Pukyong National University, Busan 48513, Korea
2
Geological Structure and Geohazard Research Lab, Department of Earth and Environmental Sciences, Pukyong National University, Busan 48513, Korea
*
Authors to whom correspondence should be addressed.
Sustainability 2020, 12(3), 1234; https://doi.org/10.3390/su12031234
Submission received: 26 December 2019 / Revised: 3 February 2020 / Accepted: 5 February 2020 / Published: 8 February 2020
(This article belongs to the Special Issue Geo-Hazards and Risk Reduction Approaches)

Abstract

:
Studies on earthquake-induced liquefaction and identification of source unit for causing liquefaction have been a major concern in sustainable land use development especially in low to moderate seismic areas. During the 2017 Mw 5.4 Pohang earthquake, widespread liquefaction was reported around the Heunghae basin, which was the first ever reported case of liquefaction in the modern seismic history of Korea. The epicentral area is one of the major industrial hubs along the SE Korean Peninsula with no detailed liquefaction hazard map. The purpose of this study was to determine the land damage classification on the basis of surface manifestation of liquefaction features and carry out detailed liquefaction potential analysis to delineate the depth of liquefiable soil. This will eventually support developing a liquefaction hazard zonation map and sustainable development of infrastructure to minimize earthquake damages. In this present study, the southern part of the Heunghae basin, which has more field evidences of liquefaction than the northern part, was taken for detailed liquefaction analysis. From the detailed analysis, it was observed that the soils from 1.5 to 15 m depth with the probability of liquefaction varying from 2 to 20 are prone to liquefaction. On the basis of land damage pattern, the epicentral area falls in orange to red zone, which means the necessity of further detailed liquefaction analysis. This study urges more detailed liquefaction zonation should be carried out for the epicentral area and liquefaction hazard should be included in the multi-hazard map in the future for the sustainable land use planning.

1. Introduction

During earthquake shaking or other rapid loadings, mostly saturated sandy/silty soil loses its strength and stiffness and behaves as a liquid which is known as liquefaction [1,2,3]. The repeated/cyclic loading under undrained conditions leads to a decrease in effective stress and a rise in pore water pressure of the soil [4,5]. Along with earthquake magnitude, several other factors affect the liquefaction susceptibility of the soil, such as the age of the soil, sedimentation process, the depth of the water table, density, burial depth, ground slope, grain size distribution, etc. [6,7]. The basic understanding of the relationship between cyclic loading during an earthquake and soil liquefaction has been largely derived from laboratory studies, such as cyclic triaxial tests, shake table tests, resonant column tests, centrifuge modeling, etc. [8,9,10,11,12,13,14].
Liquefaction and related phenomena have caused extensive damages during the historical and modern earthquakes around the world, such as damage occurred around San Francisco’s Marina District during the 1989 Loma Prieta earthquake [15,16], damage along the Kobe port during the 1995 Great Hanshin earthquake [17,18], damage around Christchurch township, New Zealand during the 2010 Canterbury earthquake [19,20], liquefaction induced damages during 2016 Kumamoto earthquake, Japan [21], liquefaction and lateral spreading related damages during the 2018 Sulawesi earthquake, Indonesia [22,23]. Despite decades of research towards understanding the liquefaction hazard and its mitigation criteria, the recent large magnitude earthquakes like the 2016 Kumamoto earthquake (Mw 7.0) and 2018 Sulawesi earthquake ((Mw 7.5) and moderate magnitude earthquakes like 2009 Olancha earthquake in the United States (Mw 5.2), 2017 Pohang earthquake in South Korea (Mw 5.5) indicate that, there is still ambiguity on reducing the liquefaction hazard during moderate to large magnitude earthquakes [24,25,26].
One of the most important factors that control the liquefaction-induced ground failure is controlled by the thickness of liquefied soil layers and non-liquefied soil layers [27]. The delineation of the liquefaction-prone area, the liquefaction potential evaluation and estimation of liquefiable soil depth variance for sedimentary basins covered by thick sediments play a crucial role in liquefaction hazard mitigation [28,29,30,31,32,33]. Proper land damage mapping along with a detailed post-earthquake survey for surface manifestations of liquefaction features will help in liquefaction mitigation, especially in minimization or avoidance of structural damage to the buildings [34]. Liquefaction-induced damage to the residential buildings due to soil subsidence, ground failure, and lateral spreading has been a major concern among geotechnical engineers for sustainable urban planning, especially for areas planned to be an urban center [19,34,35,36,37,38,39]. This was apparent during recent 2010 and 2011 Christchurch earthquakes and the 2012 Emilia earthquake in Italy [19,39]. For reducing the risk, detailed post-earthquake mapping of liquefaction features, making a digital database, land damage mapping, and delineation of liquefiable soil depth are important [27,40,41,42,43]. This will assist in the areas where liquefaction is a rare phenomenon or not mentioned in historical records, specifically for intraplate seismic regions [35,36]. The characterization of hazard-prone areas is often easier after the earthquake than before, especially in low seismic areas like the Korean Peninsula. The land damage during the 2011 Christchurch earthquake [19,34] along with detailed liquefaction analysis was helpful to the earthquake commission, New Zealand Government to determine the severity of damage, land remediation after the earthquake, and future hazard zonation with special emphasis on liquefaction.
A widely preferred methodology for the liquefaction hazard mapping is a Liquefaction Potential Index (IL) proposed by [38] and recently developed parameter Liquefaction Severity Number (LSN) after the Christchurch earthquakes [30,34,43,44,45,46]. For lower seismic areas like the Korean Peninsula, where the historical records of liquefaction are almost null, site-specific liquefaction hazard mapping is not an integral part of hazard mapping [47,48]. Lately, after the Christchurch earthquake, the earthquake commission of New Zealand and New Zealand Government have developed a land damage category chart to differentiate the land on the basis of surface manifestation of liquefaction and lateral spreading for the Canterbury basin to understand the controlling factors and guide future urban planning [19,34]. However, there are no specific land damage categories available for the Korean Peninsula. This may be due to very rare records of liquefaction and large recurrence intervals of seismic events.
The 2017 Pohang earthquake (MW 5.4) caused extensive liquefaction within the Heunghae basin along with structural damages to 2165 private houses, 227 school buildings, many roads, and 11 bridges. Several studies have been carried out immediately after the earthquake towards liquefaction zonation and reporting the surface manifestation of liquefaction [48,49,50,51]. However, no detailed work has been carried out to classify the land damage patterns and to obtain the depth of the source layer for the liquefaction.
In this paper, an effort has been made for preparing a land damage map for the epicentral region on the basis of reported liquefaction features [47,48,49,50] and detailed liquefaction potential mapping to define the subsurface liquefaction-prone soil depth. For this purpose, we have considered 600 cases of surface manifestation of liquefaction features to make the land damage map. Since there are no specific criteria available for land damage pattern categorization for the Korean Peninsula, we have adopted the methodology applied to the Canterbury basin. Moreover, we have considered a 10 km line along the southern part of the basin, where more localized liquefaction features were observed during the earthquake.

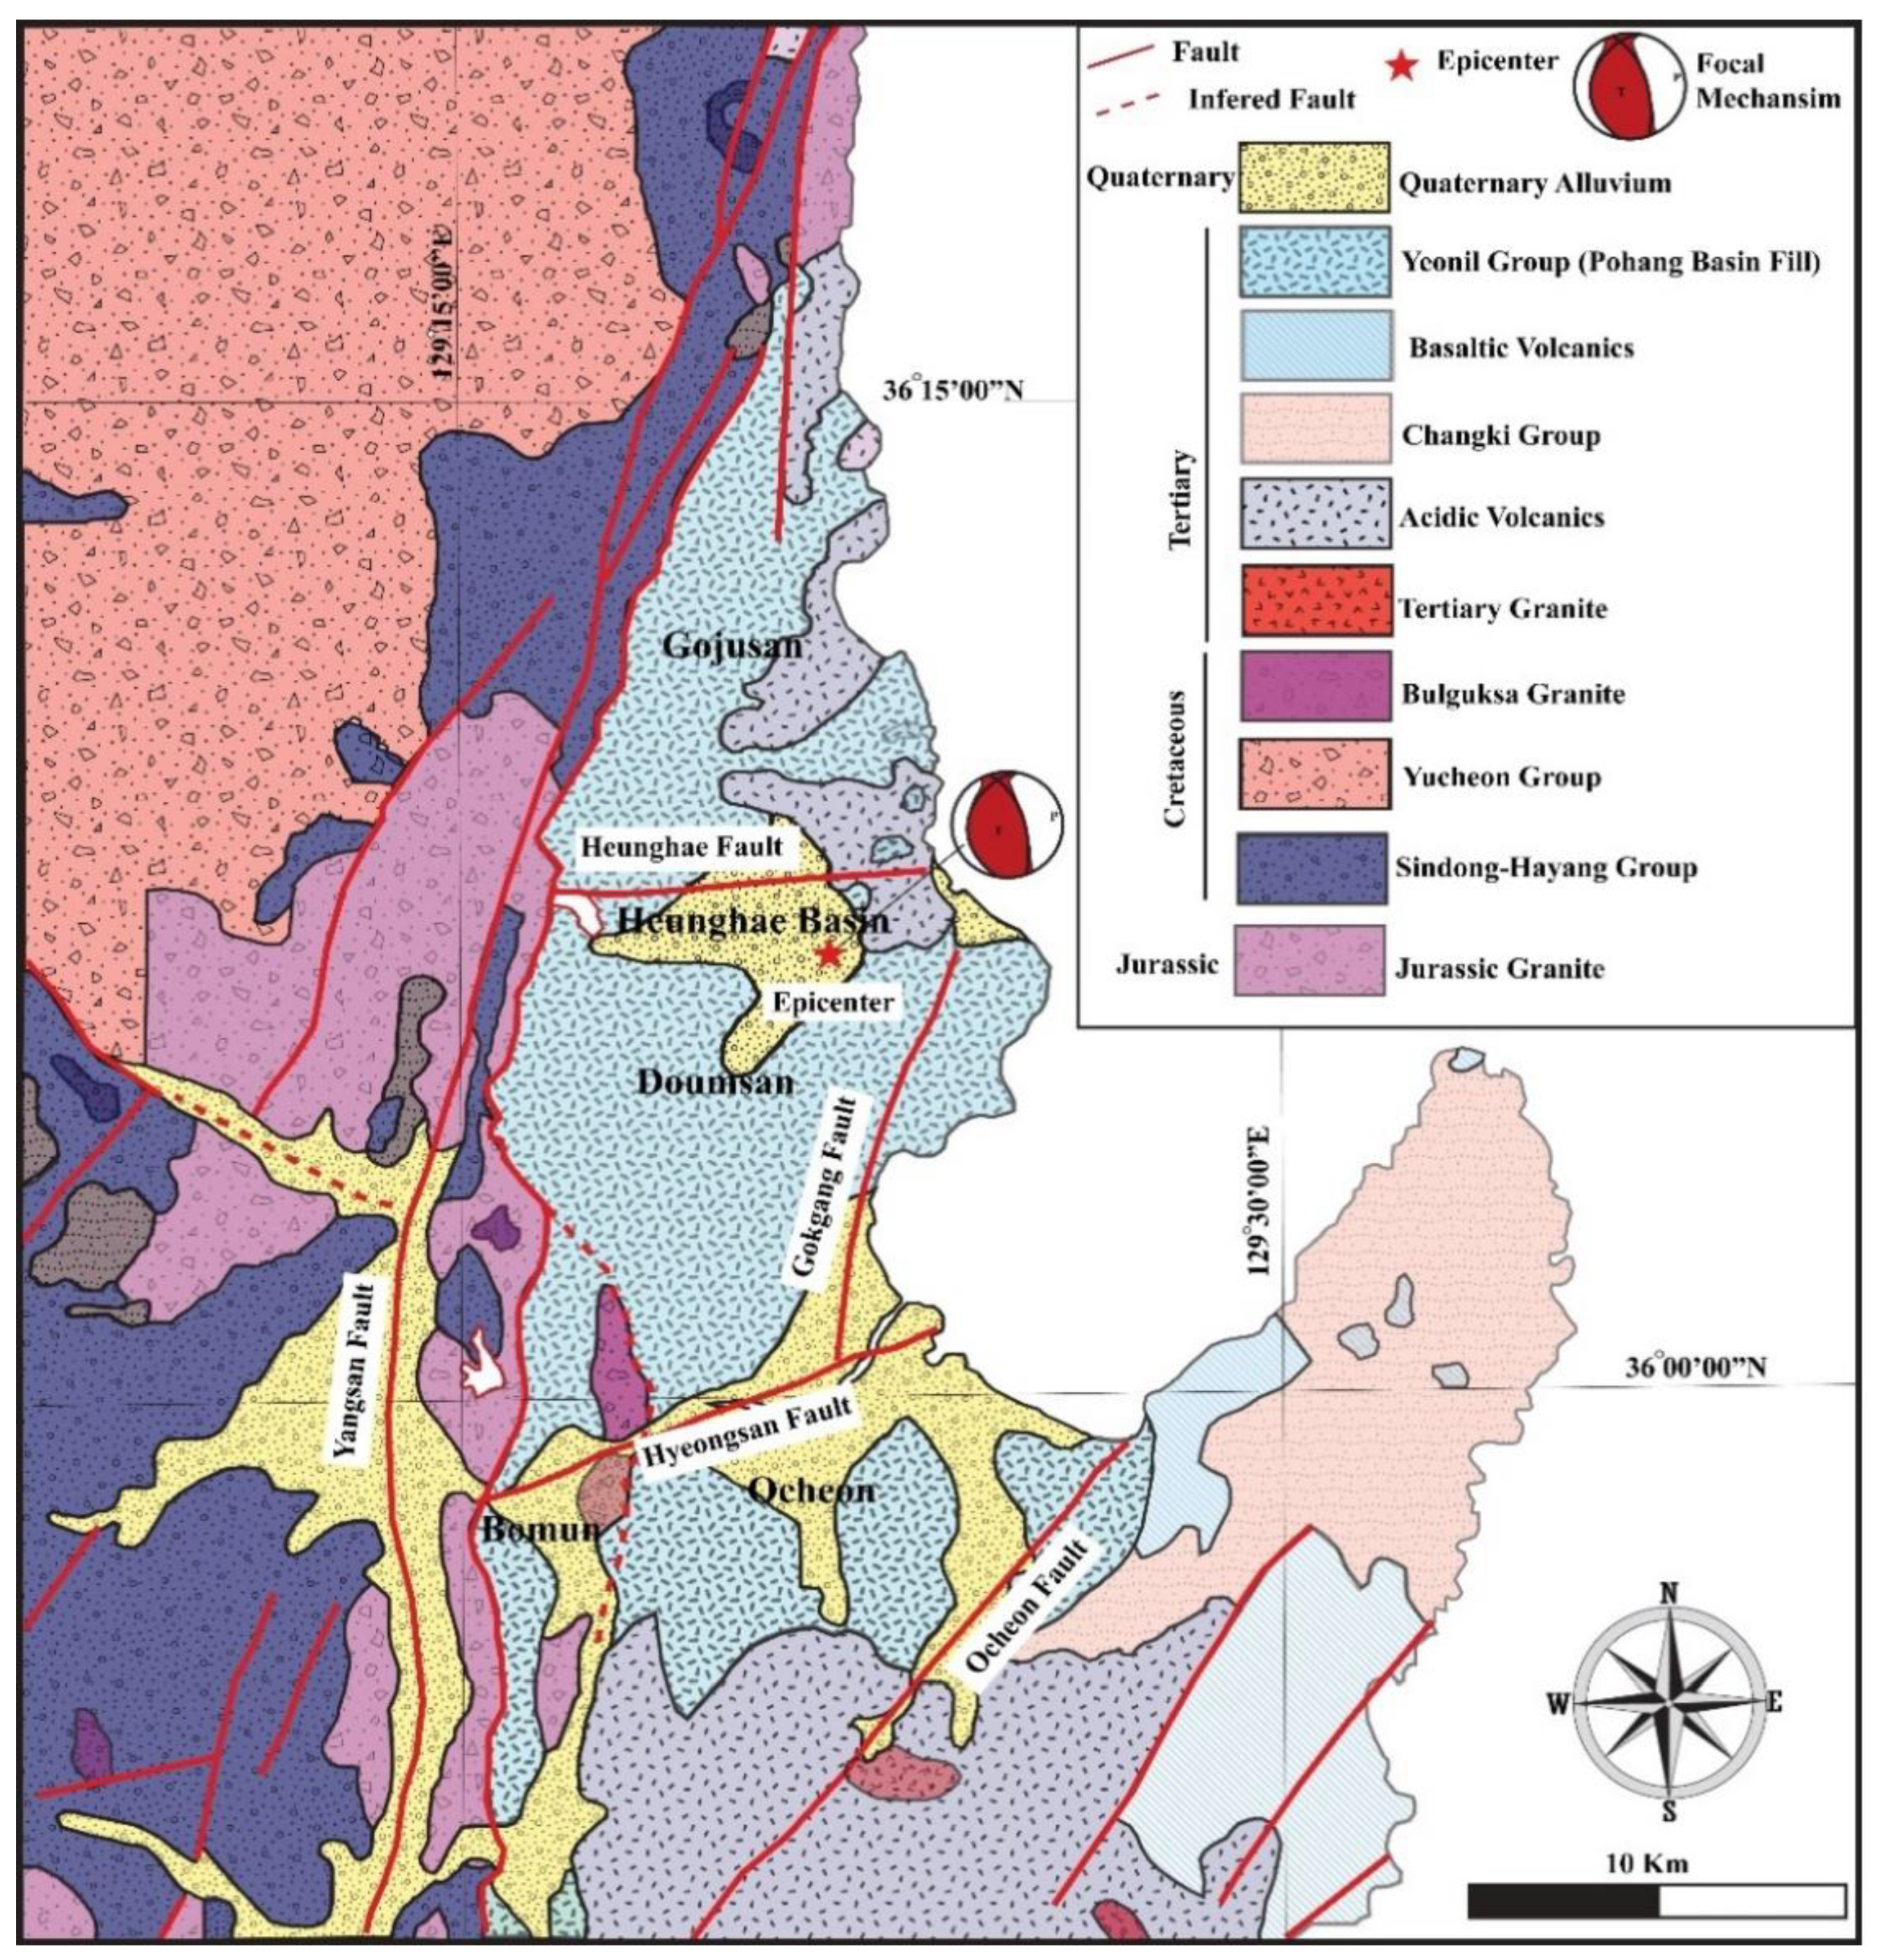
2. Geological Settings

The southern part of the Korean Peninsula is located on the Eurasian Plate and its tectonic activities are controlled by the ongoing subduction of the adjoining Pacific and Philippine Sea Plates. Moreover, the collision between the Indian Plate with Eurasian Plate controls the tectonism of the Korean Peninsula [47,48,49,50,51]. The Cenozoic deformation along the southeastern part of the Korean Peninsula is accommodated by the Yangsan-Ulsan Fault system. The Oligocene rifting of the Korean Peninsula in NE-SW direction has resulted in the development of several normal faults and extensional basins [52]. The major basin is known as Pohang basin, which is subdivided into several sub-basins. The Heunghae basin is one of the sub basins which was affected by the 2017 Pohang earthquake (Mw 5.4) (Figure 1). There have been several reports of Quaternary faulting with surface ruptures along the Yangsan-Ulsan Fault System [51,53]. The distribution of Quaternary faults and mechanisms involved are consistent with the maximum principal stress direction (E-W; ENE-WSW) during the Quaternary period [54,55,56]. The recorded seismic data along this area suggest that this area has experienced four moderate magnitude earthquakes (Mw 5–6) during the last 14 years, including the 2016 Gyeongju earthquake (Mw 5.5) and the 2017 Pohang earthquake (Mw 5.4) [47,48,49].

3. 2017 Pohang Earthquake and Observed Liquefaction Features

The Korean Meteorological Administration (KMA), United States Geological Survey (USGS), Korea Institute of Geosciences and Mineral Resources (KIGAM) reported the main shock (Mw 5.4) and four major aftershocks (˃Mw 3.5). The focal depth of the main shock was estimated to be 4.5 km with the depth of aftershock sequences varying from 3 to 7 km [47,49,57]. The focal mechanism solution of the earthquake indicates that the main shock was an obliqueslip fault (reverse and dextral strike-slip) with NE strike and dip of approximately 60°–70°. Post-earthquake InSAR data analysis suggests that the area underwent 15 cm of coseismic slip during the main shock [49]. The earthquake caused damages to more than 2,500 houses, 227 school buildings, 11 bridges, and many roads around the epicentral area. The estimated total cost of loss is about 52 million USD.
The post-earthquake reconnaissance surveys carried out by several authors reported more than 600 cases of liquefaction along with several examples of lateral spreading [47,48,49,50]. Field photos showing evidence of liquefaction and lateral spreading are shown in Figure 2.
In some places, the liquefaction features were even more than 2 m in diameter (Figure 2). The shaking was so intense that there was a report of liquefaction of gravelly soil along the dried river beds and rice farms [47]. Due to the presence of soft ground and shallow focal depth of the earthquake, there were several cases of ground settlements of up to 0.39 m. Some residential buildings were tilted by an angle of 1.6° with differential settlement of 0.15 m [47,50]. The grain size analysis was done as per the American Standard for Testing Materials (ASTM) D6913 [58] for the ejected soil from the sand boil, which is classified as mostly silty sand, silt, and sandy ground (Figure 2) and falls under liquefiable soil category [47,59,60]. Figure 3 depicts some of the typical damaged buildings during the earthquake. Considering the observed liquefaction, ground cracks, and lateral spreading around the epicentral area, we have proposed a local scale land damage zone as per the guideline for geotechnical engineering practice in New Zealand [19,61]. Table 1 shows the land damage categories in the epicentral area of the Pohang earthquake and Figure 4 shows the land damage distribution with locations of surface manifestations of liquefaction during the earthquake. On the basis of the land damage distribution, it was observed that most of the damaged lands are categorized as moderate to major land damage and are confined between the Gokgang and Chogok Rivers.
The land damage pattern suggests if a similar or higher magnitude earthquake occurs in the near future, a similar scale of land will undergo liquefaction. This kind of repeated liquefaction was observed during the Christchurch earthquake and Emilia earthquake. The recent paleo-liquefaction studies from the epicentral area of the Pohang earthquake [48] also suggested that the area have experienced liquefaction in the past. The site which shows liquefaction evidence during this earthquake has undergone similar liquefactions within 730 to 130 years BP [48]. Therefore, detailed liquefaction analysis, specifically the determination of liquefiable soil depth, will help in reducing liquefaction-related hazard for future construction projects on liquefiable soil around the epicenter.

4. Liquefaction Potential Analysis of Soils from the Epicentral Areas of the 2017 Pohang Earthquake

4.1. Ground Motion Data

The 2017 November Pohang earthquake data were taken for the liquefaction analysis. The ground motion parameters recorded at the closest seismic station PHA2 were taken for the analysis. The acceleration time history data for the Pohang earthquake used for the analysis are given in Figure 5. The acceleration values recorded at PHA2 seismic station (0.268 g) were taken for the liquefaction analysis. A detailed liquefaction analysis was carried out using the geotechnical borehole data (Figure 4) collected from the Integrated Data Base Center of National Geotechnical Information, Korea [62].

4.2. Site Investigation and Liquefaction Assessment

From the spatial distribution of the liquefaction features in the epicentral area, it can be inferred that the liquefaction features are mostly concentrated on the southern part of the Heunghae basin [47]. In order to analyze the subsurface soil properties of liquefied sites and determine the thickness of the liquefaction-prone soil around the Heunghae basin, we collected the geotechnical investigation reports from the Integrated Data Base Center of National Geotechnical Information, Korea [62]. The integrated database compiled all the soil classification data and Standard Penetration Test (SPT-N) data sets from the completed or ongoing road, railways, and residential construction projects. The standard penetration test is one of the most widely used in-situ tests carried out for major geotechnical projects due to its simple nature.
In this method, a 65 cm long thick-walled (5 cm) sampler was driven into the ground at the bottom of the borehole with a sliding hammer of 63.5 kg, falling from a distance of 76 cm [63,64]. The number of blows needed for each of the 15 cm sampling tube penetration is recorded. The sum of the number of blows required for the second and third 30 cm of penetration is known as standard penetration resistance (SPT-N) values. The SPT-N blow count can indicate the density of the soil [63,64]. Typical geotechnical data used for the liquefaction analysis is shown in Table 2. Figure 6 shows the grain size distribution graph for the ejected soil from the sand boils.
Considering the clustered liquefaction features and closest available geotechnical datasets, we took a 10.5 km transect to determine the liquefaction potential in terms of thefactor of safety against liquefaction (FSL) of the soil. The variation of the depth of liquefiable soil, estimation of post liquefaction settlement and liquefaction potential index (IL) along the southern part of the Heunghae basin experienced more severe liquefaction than the northern part of the basin. Since there was no detailed analysis of liquefaction potential of soils from the epicentral area, this study will help in determining the liquefiable soil depth and the possible post liquefaction settlement in the area, which is one of the most important factors in seismic-resistant building design.

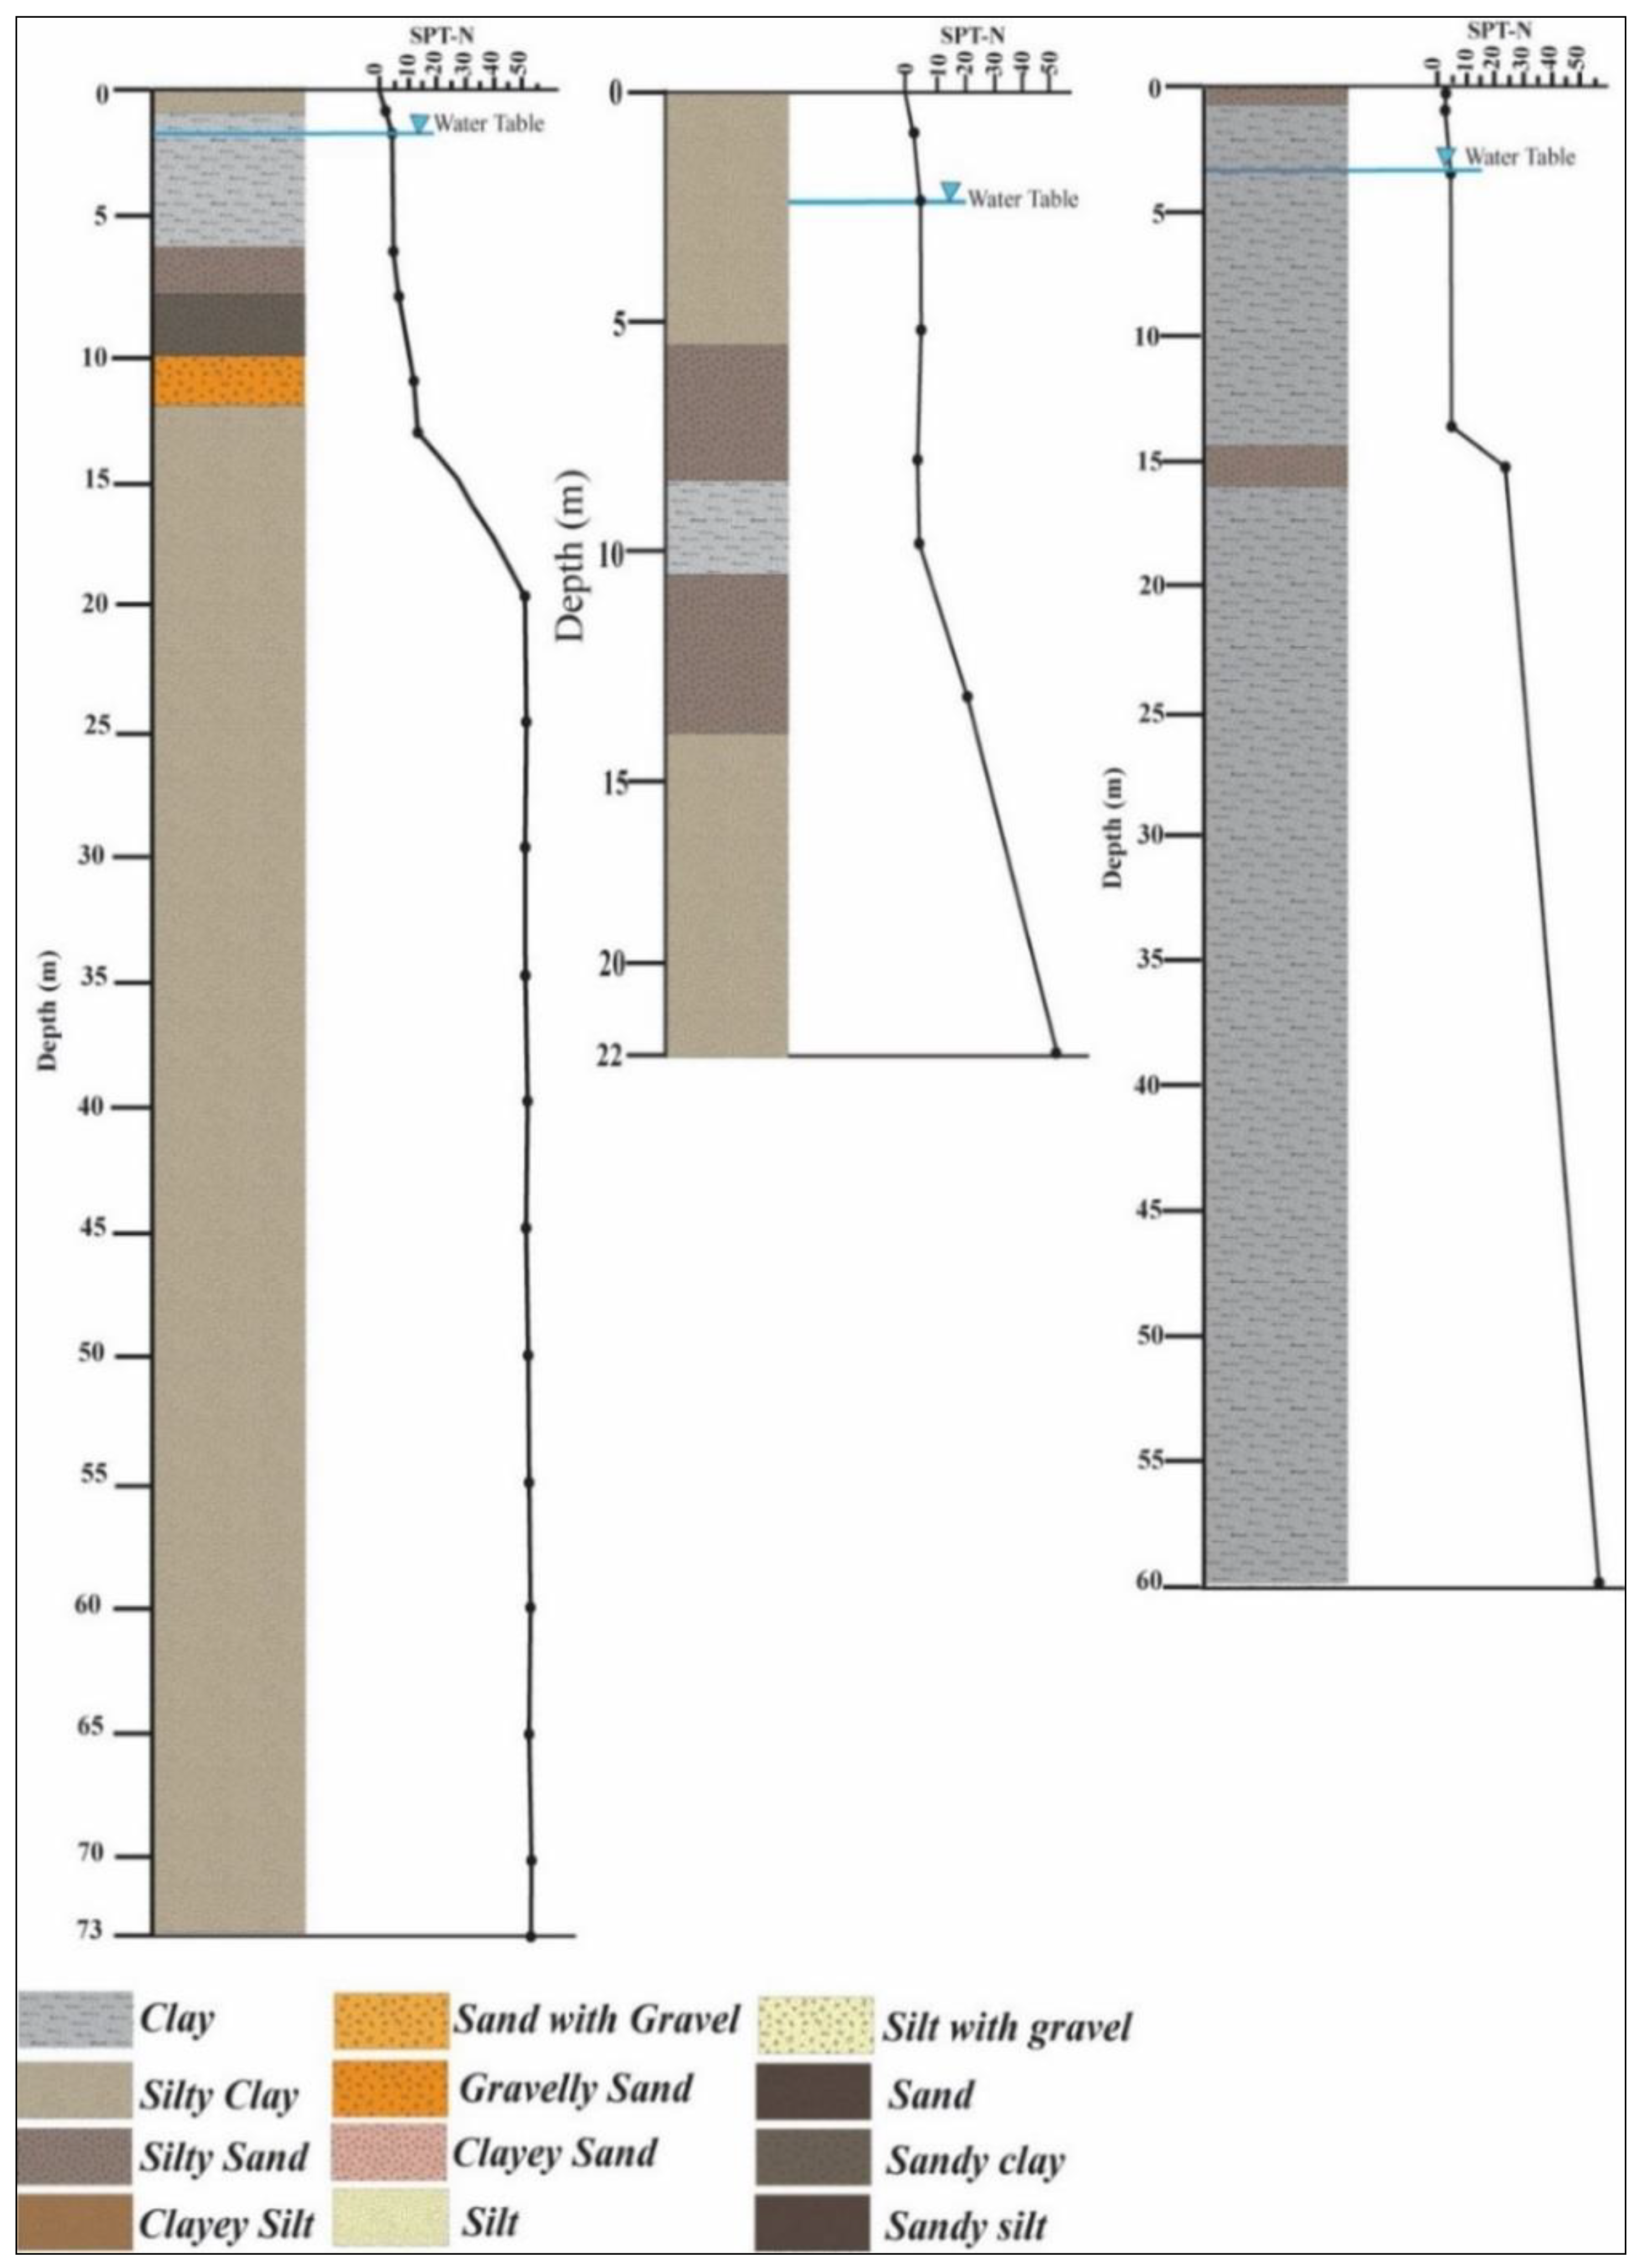
4.3. Result of Selected SPT in the Heunghae Basin

Geotechnical investigation results from 41 boreholes covering the lateral extent of the Heunghae basin were collected. Around the Heunghae basin, the geotechnical investigations were available for varying depths depending upon the bedrock depth. For a better estimation of liquefaction potential and lateral variation of liquefaction-prone soil along the basin, we considered the borehole data with maximum depth from the Integrated Data Base Center of National Geotechnical Information, Korea (https://www.geoinfo.or.kr), which varies from ground surface to 80 m (Figure 4). The typical bore log and variation of SPT-N with depth for the borehole BB24, BB26, and BB 80 are presented in Figure 7. The geotechnical data suggest that the soils are mostly CH, ML, MH, SM, SP, SW, and GW as per the unified soil classification system (USCS). The SPT-N values for the boreholes taken for the analysis vary from 1 to 50, which indicates the soils are in a range of very loose to very dense conditions. The groundwater table varies from ground level to 15 m in the southern part of the basin.

4.4. SPT Based Liquefaction Potential Assessment

There are several methodologies for the estimation of liquefaction potential of the soil using in situ field testing parameters like SPT-N, Cone Penetration Test (CPT), shear wave velocity at 30 m (Vs30) as we all several laboratory testing methods such as cyclic triaxial test, resonant column test, shake table test, etc. [65,66,67]. The lab testing methods are complex and lead to difficulties associated with sample disturbance during sampling and testing. The empirical stress based SPT-N approach has gained a wide acceptance in geotechnical engineering communities [68]. Cyclic stress ratio (CSR) is defined as the seismic demand of the soil, whereas the capacity of the soil to resist liquefaction is defined as cyclic resistance ratio (CRR) [6,69,70,71]. These two parameters are used to determine the factor of safety against liquefaction (FSL).

4.4.1. Estimation of Cyclic Stress Ratio (CSR)

For the estimation of cyclic stress ratio (CSR) of soil, a simplified equation proposed by [69,70] has been used, which is given by Equation (1). The equation proposed by [68] was simplified by [70] to estimate the CSR values.
C S R = 0.65 a m a x × σ v g × σ v × r d
where amax is the peak horizontal acceleration on the ground surface, g is the acceleration due to gravity, σv and σ’v is the total and effective stress and rd is the stress reduction factor of the soil. The stress reduction factor was calculated using an equation proposed by [71] and given in Equation (2).
r d = ( 1.0 0.411 z 0.5 + 0.04 z + 0.00175 z 1.5 ) ( 1.0 0.417 z 0.5 + 0.0573 z 0.0062 z 1.5 + 0.001216 z 2 )
where z is the depth in meters below the ground surface.

4.4.2. Estimation of Cyclic Resistance Ratio

Cyclic Resistance Ratio (CRR) has been used by several researchers for the liquefaction potential estimation. Several researchers have proposed equations for the estimation of CRR using SPT-N data [69,70,72,73]. In this present analysis, the equation proposed by [69] has been used. In the [70] method, the cyclic resistance ratio (CRR) needs fineness content correction and the (N1)60cs values are the value of (N1)60 to an equivalent clean sand value. The equation used for CRR estimation is given in Equation (3).
CRR 7.5 = 1.0 34 ( N 1 ) 60 CS   + ( N 1 ) 60 CS 135 +   [ 50 [ 10 × ( N 1 ) 60 CS + 45 2 1 200 ]
Since the earthquake magnitude is different from Mw = 7.5, it is compulsory to modify the CRR value according to the magnitude of the earthquake used so that the CRR values will be more realistic for the earthquake used for the present liquefaction potential analysis. For the same, the magnitude was scaled down using the following equation
MSF 7.5 = 10 2.24 M w 2.56

4.4.3. Correction for SPT-N Blow Count

SPT-N samplings were carried out by the Korean Industrial Standard (KSF) 2307 (test method specified for penetration test by Korean Industrial Standards) [63], which is similar to ASTM D1586-11 [63,64]. The measured SPT-N values were corrected using the NCEER report 1997 and 2001 [70]. The measured N values were corrected for overburden correction (CN), hammer energy (CE), Borehole diameter (CB), rod length (CR), liner correction (CS) and fines content. The corrected values of ((N1)60cs) was calculated using Equation (5).
( ( N 1 ) 60 CS ) = N × ( C N ) × ( C E ) × ( C B ) × ( C R ) × ( C S )
(N1)60cs = α × β × (N1)60

4.4.4. Factor of Safety against Liquefaction (FSL)

The liquefaction potential defined as a factor of safety against liquefaction (FSL) and can be quantified as the ratio between cyclic resistance ratio (CRR) vs. cyclic stress ratio (CSR). The equation used for the estimation of factor of safety against liquefaction is given as Equation (7).
F S L = CRR ( CSR ) M = 7.5 σ = 1
If the FSL value is ˂1, the soil is prone to liquefaction and if the FSL is ˃1, the soil is safe against liquefaction.

4.4.5. Assessment of Liquefaction Potential Index

The liquefaction potential index (IL) quantifies the severity of liquefaction and predicts whether the liquefaction features will reach the ground surface or not [38,73,74,75]. The liquefaction potential index for a specific site can be calculated by integrating the factor of safety (FSL) of a soil column with depth [38,76]. A weighting function has been added to give more weight to the shallow layer, close to the ground surface. In the present analysis, we estimate the liquefaction potential index (IL) using Equation (8) given by [38] for all the boreholes taken into consideration for liquefaction analysis along the southern boundary of the Heunghae basin.
I L   = 0 z F ( z ) . w   ( z ) d z
where z is the depth of the midpoint of the soil column taken for analysis, Dz is the differential increment of depth. The weighting factor, w(z) and the severity factor, F(z) were calculated as:
F(z) = 1 − FSL for FSL ˂ 1. 0; F(z) = 0 for FSL ≥ 1. 0
W(z) = 10–0.5z for z ˂ 20 m and w (z) = 0 for z ≥ 20 m.
For the soil profile, IL was calculated using Equation (9) which is given below.
IL = i = 1 n w i F i H i
with Fi = 1 – FSLi for FSL ˂ 1; Fi = 0 for FSL ≥ 1.
Where Hi is the thickness of the individual soil layer. N is the number of the total soil layer, FSL is the factor of the safety against liquefaction, wi is the weighting factor (=10–0.5 Hz), and zi is the depth of ith layer (m) [76,77].

4.4.6. Post Liquefaction Settlement Estimation

For the level ground, the post liquefaction settlement can be estimated from the volumetric strain induced due to the rise in excess pore water pressure [42,77,78,79,80]. Most of these methods are analytical and based on laboratory studies. In this present study, the methodology proposed by Ishihara and Yoshimine [80] was used for the post liquefaction settlement estimation.

5. Liquefaction Analysis

In total, 41 borehole pieces of data (Figure 4) were taken from the epicentral area within 3 km radius from the epicenter. The selection of the borehole was designed in such a way that it covered the southern part of the Heunghae basin, which experienced more sand boils than the northern part of the basin. The soil ejected to the ground surface during the liquefaction was mostly sand and silty sand (Figure 2f and Figure 6). The NOVOLIQ [81] software was used for the liquefaction analysis, which was designed for liquefaction potential analysis of layered soil. The input parameters for the liquefaction analysis were soil type, SPT N value, unit weight, percentage of fines, earthquake magnitude, groundwater table depth and distance from the fault, etc.

6. Results and Discussion

In total, 41 borehole pieces of data (Figure 4) were taken for the present analysis. A cross-section covering 10 km along the E-W direction of the Heunghae basin was selected on the basis of surface manifestation of sand boils during the Pohang earthquake. Since there were no borehole data available passing thought the center of the basin, the southern part of the basin was taken for the detailed liquefaction analysis as a representative section of the basin. A recent study [47] reported that the southern part of the Heunghae basin had more reported cases of liquefaction than the northern part. An empirical method introduced by the National Center for Earthquake Engineering Research (NCEER) [5] was used for detailed liquefaction analysis to delineate the variation in depth of liquefaction prone soil around the epicentral area.
From the analysis, the silty sand and sandy soil having lower SPT-N values (between 1–20) show a factor of safety against liquefaction lower than 1. Along the 10.5 km transect, the central part of the Heunghae basin (Figure 8) shows evidences of liquefaction at shallow depth. The silty soil, silty sand, and sandy soil from 1.5 to 15 m show FSL lower than 1 and are prone to liquefaction. The lateral variation of liquefiable soil layer for the southern part of the epicenter well matches with the present analysis (Figure 8). The variation of FSL with depth for some of the boreholes with evidence of liquefaction is shown in Figure 9.
The liquefaction potential index (IL) for each borehole was assessed using Equation (8). The estimated IL varies from 2 to 19 for the boreholes showing FSL lower than 1 and zero for boreholes having FSL higher than 1. The estimated IL for the boreholes are given in Table 3. In terms of liquefaction susceptibility, the central part of the basin is more susceptible than the east and west side of the southern part of the basin. This agrees well with the field evidence of liquefaction during the sand boil of the earthquake. The post liquefaction settlement estimated for each borehole varies from 6 to 50 cm and was mostly caused by the soil layers from 1.5 to 15 m, showing lower FSL. The post liquefaction settlement for each borehole is given in Table 3.
Understanding the spatial correlation between the liquefaction potential of soil, the probability of liquefaction, post-liquefaction settlement and its aerial extent with exposure to the population, buildings and infrastructures around the epicentral area will help for sustainable land use management in the future. Since this is the first time ever liquefaction phenomenon observed in the Korean Peninsula, detailed reconnaissance survey, land damage analysis, delineation of liquefiable subsurface soil layers will help in addressing the liquefaction risk around the epicentral area or areas with similar geological settings. On the basis of land damage distribution, most of the damaged lands are categorized as moderate to major land damage and confined between the Gokgang and Chogok Rivers. This may be due to the presence of alluvial soil at shallow depth. The land damage distribution map will help for the quantitative hazard assessment of the areas, especially for heavy construction. This information will also help for further detailed liquefaction hazard mapping with more geotechnical data and lead to liquefaction sustainable land use planning.

7. Conclusions

The paper presents the liquefaction analysis, probability of liquefaction and post liquefaction settlement for the Heunghae basin, which has experienced extensive liquefaction during the 2017 Pohang earthquake. A detailed post-liquefaction survey was carried out immediately after the earthquake. The result of liquefaction survey shows that the southern part has more sand boil than the northern part. To determine the depth of liquefiable soil along the southern part of the basin, SPT-N values were collected from the Integrated Data Base Center of National Geotechnical Information, Korea. From the present study, it can be inferred that:
  • The liquefaction triggered during the Mw 5.4 Pohang earthquake was localized and observed more in the southern part than the northern part of the basin. This may be due to the basin geometry, presence of the Heunghae fault at the center of the basin and the locality lying between the Gokgang River and the Chogok River with a shallow water table.
  • On the basis of land damage distribution, most of the damaged lands are categorized as moderate to major land damage and confined between the Gokgang and Chogok Rivers.
  • The grain size analysis of the ejected soil suggests that the soils are silty sand, sand with gravel, and sandy soil, which falls in the range of most liquefied soils reported in the literature.
  • A 10.5 km long profile was chosen to determine the liquefaction potential, LPI, post-liquefaction settlement along the southern part of the basin, using SPT-N data and the Pohang earthquake ground motion data recorded at PHN2 station. The analysis indicates that the silty soil, silty sand, and sandy soil from 1.5 to 15 m deep are prone to liquefaction.
  • Liquefaction susceptibility of the soil based on SPT-N value showed that the soils from 1.5 to 15 m possess FSL values from 0.2 to 1.0. The liquefaction potential index (IL) estimated for the boreholes suggests that the southern part of the Heunghae basin has a low to high liquefaction potential index (IL) values ranging from 2 to 19, which complements with the field evidence of sand boils during the earthquake.
  • From the post liquefaction settlement, the soils having FSL values lower than 1 show maximum post-liquefaction settlement ranging from 6 to 50 cm.
  • This study suggests that the soils of the Heunghae basin are prone to liquefaction for earthquakes higher than Mw 5.4 and more comprehensive geotechnical investigations are required for better estimation of liquefiable soil depth along with the preparation of liquefaction hazard zonation maps.
  • Similar liquefaction potential analysis must be carried out for other basins situated in close proximity to the Yangsan and Ulsan faults, including the Pohang basin, a major industrial center along the SE Korean Peninsula. This study will support the national disaster management authorities in developing a sustainable guideline for liquefaction hazard mitigation.

Author Contributions

In the present research, S.P.N., O.G. and K.P. analyzed the field data, developed the idea and prepared the manuscript. Y.-S.K. encouraged us and supervised the findings of this work with continuous technical inputs during the preparation of the manuscript. All authors have read and agreed to the published version of the manuscript

Funding

This research was supported by a grant (2017-MOIS31-006) of the Fundamental Technology Development Program for Extreme Disaster Response funded by Ministry of Interior and Safety (MOIS, Korea).

Acknowledgments

Authors are thankful to the Ministry of Interior and Safety (MOIS, Korea) for providing the for supporting post-earthquake field survey to collect the liquefaction data, Integrated Data Base Center of National Geotechnical Information, Korea for providing free access to geotechnical data used for the liquefaction analysis.

Conflicts of Interest

The authors declare no conflict of interest.

List of Symbols

SPT-NStandard Penetration Test
CPTCone penetration Test
NNumber of blows
CSRCyclic Stress Ratio
CRRCyclic Resistance Ratio
MSFMagnitude scaling factor
FSLFactor of Safety against Liquefaction
amaxmaximum acceleration
Vs30shear wave velocity at 30 m
PGAPeak Ground Acceleration
LPILiquefaction Potential Index
LLLiquid Limit
PIPlasticity Index
KSFKorean Industrial Standard
USCSUnified Soil Classification System
ASTMAmerican Standard for Testing Materials
PHNPOSEIDON seismic station at Pohang
NZSNew Zealand design Standards
NCEERNational Center for Earthquake Engineering Research

References

  1. Seed, B. Soil Liquefaction and Cyclic Mobility Evalution for Level Ground during Earthquakes. J. Geotech. Geoenv. Eng. 1979, 105, 14380. [Google Scholar]
  2. Leeder, M.R. Soft sediment deformation structures. In Sedimentology; Springer: Berlin/Heidelberg, Germany, 1982; pp. 111–116. [Google Scholar]
  3. Bates, R.L.; Jackson, J.A. Glossary of Geology; American Geological Institute: Alexandria, VA, USA, 1984; p. 788. [Google Scholar]
  4. Marcuson, W.F.; Franklin, A.G. State of the Art of Undisturbed Sampling of Cohesionless Soils; US Army Engineer Waterways Experiment Station: Vicksburg, MS, USA, 1979. [Google Scholar]
  5. Youd, T.L.; Idriss, I.M. Liquefaction resistance of soils: Summary report from the 1996 NCEER and 1998 NCEER/NSF workshops on evaluation of liquefaction resistance of soils. J. Geotech. Geo. Eng. 2001, 127, 297–313. [Google Scholar] [CrossRef] [Green Version]
  6. Youd, T.L.; Perkins, D.M. Mapping liquefaction-induced ground failure potential. J. Soil Mech. Found. Div. 1978, 104, 433–446. [Google Scholar]
  7. Marto, A.; Tan, C.S. Short review on liquefaction susceptibility. Int. J. Eng. Res. Appl. 2012, 2, 2115–2119. [Google Scholar]
  8. Seed, H.B.; Lee, K.L. Liquefaction of Saturated Sands during Cyclic Loading. J. Soil Mech. Found. 1966, 92, 105–134. [Google Scholar]
  9. Yoshimi, Y.; Tokimatsu, K.; Kaneko, O.; Makihara, Y. Undrained Cyclic Shear Strength of Dense Nigata Sand. Soils Found. 1984, 24, 131–145. [Google Scholar] [CrossRef] [Green Version]
  10. Sladen, J.A.; D’Hollander, R.D.; Krahn, J. The Liquefaction of Sands, a Collapse Surface Approach. Can. Geotech. J. 1985, 22, 564–578. [Google Scholar] [CrossRef]
  11. Yamamuro, J.A.; Covert, K.M. Monotonic and cyclic liquefaction of very loose sands with high silt content. J. Geotech. Geo. Eng. 2001, 127, 314–324. [Google Scholar] [CrossRef]
  12. Hushmand, B.; Scott, R.F.; Crouse, C.B. Centrifuge liquefaction tests in a laminar box. Geotechnique 1988, 38, 253–262. [Google Scholar] [CrossRef] [Green Version]
  13. Flora, A.; Lirer, S.; Silvestri, F. Undrained Cyclic Resistance of Undisturbed Gravelly Soil. Soil Dyn. Earthq. Eng. 2012, 43, 366–379. [Google Scholar] [CrossRef]
  14. Lentini, V.; Castelli, F. Liquefaction Resistance of Sandy Soils from Undrained Cyclic Triaxial Tests. Geotech. Geol. Eng. 2019, 37, 201. [Google Scholar] [CrossRef]
  15. Seed, R.B.; Michael, F.R.; Stephen, E.D. Liquefaction of Soils in the 1989 Loma Prieta Earthquake. In Proceedings of the 1991 International Conferences on Recent Advances in Geotechnical Earthquake Engineering and Soil Dynamics, St. Louis, MO, USA, 17 October 1989. [Google Scholar]
  16. Bardet, J.P.; Kapuskar, M. Liquefaction sand boils in San Francisco during 1989 Loma Prieta earthquake. J. Geotech. Eng. 1993, 119, 543–562. [Google Scholar] [CrossRef]
  17. Elgamal, A.W.; Zeghal, M.; Parra, E. Liquefaction of reclaimed island in Kobe, Japan. J. Geotech. Eng. 1996, 122, 39–49. [Google Scholar] [CrossRef]
  18. Tokimatsu, K.; Mizuno, H.; Kakurai, M. Building damage associated with geotechnical problems. Soils Found. 1996, 36, 219–234. [Google Scholar] [CrossRef] [Green Version]
  19. Van Ballegooy, S.; Malan, P.; Lacrosse, V.; Jacka, M.E.; Cubrinovski, M.; Bray, J.D.; O’Rourke, T.D.; Crawford, S.A.; Cowan, H. Assessment of liquefaction-induced land damage for residential Christchurch. Earthq. Spectra 2014, 30, 31–55. [Google Scholar] [CrossRef]
  20. Cubrinovski, M.; Bray, J.D.; Taylor, M.; Giorgini, S.; Bradley, B.; Wotherspoon, L.; Zupan, J. Soil liquefaction effects in the central business district during the February 2011 Christchurch earthquake. Seismol. Res. Lett. 2011, 82, 893–904. [Google Scholar] [CrossRef]
  21. Mukunoki, T.; Kasama, K.; Murakami, S.; Ikemi, H.; Ishikura, R.; Fujikawa, T.; Yasufuku, N.; Kitazono, Y. Reconnaissance report on geotechnical damage caused by an earthquake with JMA seismic intensity 7 twice in 28 h, Kumamoto, Japan. Soils Found. 2016, 56, 947–964. [Google Scholar] [CrossRef]
  22. Widiyanto, W.; Santoso, P.B.; Hsiao, S.C.; Imananta, R.T. Post-event field survey of 28 September 2018 Sulawesi earthquake and tsunami. Nat. Hazards Earth Syst. Sci. 2019, 19, 2781–2794. [Google Scholar] [CrossRef] [Green Version]
  23. Paulik, R.; Gusman, A.; Williams, J.H.; Pratama, G.M.; Lin, S.L.; Prawirabhakti, A.; Sulendra, K.; Zachari, M.Y.; Fortuna, Z.E.D.; Layuk, N.B.P.; et al. Tsunami hazard and built environment damage observations from Palu City after the September 28 2018 Sulawesi earthquake and tsunami. Pure Appl. Geoph. 2019, 176, 3305–3321. [Google Scholar] [CrossRef]
  24. Scalen, K. Liquefaction and the law: Understanding challenges and failure to strengthen hazard management regulations. NZJ Envtl. L. 2016, 20, 279. [Google Scholar]
  25. Fan, X.; Juang, C.H.; Wasowski, J.; Huang, R.; Xu, Q.; Scaringi, G.; van Westen, C.J.; Havenith, H.B. What we have learned from the 2008 Wenchuan Earthquake and its aftermath: A decade of research and challenges. Eng. Geol. 2018, 241, 25–32. [Google Scholar] [CrossRef]
  26. Green, R.A.; Boomer, J.J. What is the smallest earthquake magnitude that needs to be considered in assessing liquefaction hazard? Earthq. Spectra 2019, 35, 1441–1464. [Google Scholar] [CrossRef]
  27. Ishihara, K. Liquefaction and flow failure during earthquakes. Geotechnique 1993, 43, 351–451. [Google Scholar] [CrossRef]
  28. Robertson, P.K. Suggested terminology for liquefaction. In Proceedings of the 47th Canadian Geotechnical Conference, Halifax, NS, Canada, 21–23 September 1994; pp. 277–286. [Google Scholar]
  29. Fukue, M.; Kawakami, T. Damage to man-made island caused by the 1995 Hogo-ken Nanbu earthquake. Mar. Geo. Geotech. 1996, 14, 237–250. [Google Scholar] [CrossRef]
  30. Tonkin and Taylor Limited. Darfield Earthquake 4 September 2010: Geotechnical Land Damage Assessment and Reinstatement Report, Stage 1 Report, Earthquake Commission; 2010. Available online: https://www.eqc.govt.nz/sites/public_files/t-t-stage1.pdf (accessed on 7 February 2020).
  31. Tonkin and Taylor Limited. Darfield Earthquake 4 September 2010: Geotechnical Land Damage Assessment and Reinstatement Report, Stage 2 Report, Earthquake Commission; 2010. Available online: https://www.eqc.govt.nz/sites/public_files/stage2-report.pdf (accessed on 7 February 2020).
  32. Orense, R.P.; Kiyota, T.; Yamada, S.; Cubrinovski, M.; Hosono, Y.; Okamura, M.; Yasuda, S. Comparison of liquefaction features observed during the 2010 and 2011 Canterbury earthquakes. Seismol. Res. Lett. 2011, 82, 905–918. [Google Scholar] [CrossRef]
  33. O’Rourke, T.D.; Jeon, S.S.; Toprak, S.; Cubrinovski, M.; Hughes, M.; van Ballegooy, S.; Bouziou, D. Earthquake response of underground pipeline networks in Christchurch, NZ. Earthq. Spectra 2014, 30, 183–204. [Google Scholar] [CrossRef]
  34. Van Ballegooy, S.; Malan, P.J.; Jacka, M.E.; Lacrosse, V.I.M.F.; Leeves, J.R.; Lyth, J.E.; Cowan, H. Methods for characterizing effects of liquefaction in terms of damage severity. In Proceedings of the 15th World Conference on Earthquake Engineering 2012 (15WCEE), Lisbon, Portugal, 24–28 September 2012; pp. 1–10. [Google Scholar]
  35. Mader, G.G.; Spangle, W.E.; Blair, M.L.; Meehan, R.L.; Bilodeau, S.W.; Degenkolb, H.J. Land Use Planning after Earthquakes; William Spangle and Associates: Parata Valley, CA, USA, 1980. [Google Scholar]
  36. Nakai, S.; Sachio, Y.; Akihiko, K. Interpreting ground conditions and earthquake damages based on the land use and its change. In Proceedings of the 12th World Conference on Earthquake Engineering, Auckland, New Zealand, 30 January–4 February 2000. [Google Scholar]
  37. Jacka, M.E.; Murahidy, K.M. Observation and characterisation of land damage due to liquefaction and lateral spreading. In Proceedings of the 9th Pacific Conference on Earthquake Engineering, Auckland, New Zealand, 14–16 April 2011. [Google Scholar]
  38. Iwasaki, T. A practical method for assessing soil liquefaction potential based on case studies at various sites in Japan. In Proceedings of the Second Int. Conf. Microzonation Safer Construction Research Application, San Francisco, CA, USA, 1978, 26 November 1978; Volume 2, pp. 885–896. [Google Scholar]
  39. Lai, C.G.; Bozzoni, F.; Mangriotis, M.D.; Martinelli, M. Soil liquefaction during the 20 may 2012 M5. 9 Emilia earthquake, northern Italy: Field reconnaissance and post-event assessment. Earthq. Spectra 2015, 31, 2351–2373. [Google Scholar] [CrossRef]
  40. Dobry, R. Liquefaction of soils during earthquakes. In National Research Council (NRC), Committee on Earthquake Engineering; Report No. CETS-EE-001; National Academy Press: Washington, DC, USA, 1985. [Google Scholar]
  41. Yilmaz, I.; Bagci, A. Soil liquefaction susceptibility and hazard mapping in the residential area of Kütahya (Turkey). Environ. Geol. 2006, 49, 708–719. [Google Scholar] [CrossRef]
  42. Ibrahim, K.M.H.I. Liquefaction analysis of alluvial soil deposits in Bedsa south west of Cairo. Ain Shams Eng. J. 2014, 5, 647–655. [Google Scholar] [CrossRef] [Green Version]
  43. Sonmez, H. Modification of the liquefaction potential index and liquefaction susceptibility mapping for a liquefaction-prone area (Inegol, Turkey). Environ. Geol. 2003, 44, 862–871. [Google Scholar] [CrossRef]
  44. Lenz, J.A.; Laurie, G.B. Spatial variability of liquefaction potential in regional mapping using CPT and SPT data. Soil Dyn. Earthq. Eng. 2007, 27, 690–702. [Google Scholar] [CrossRef]
  45. Papathanassiou, G. LPI-based approach for calibrating the severity of liquefaction-induced failures and for assessing the probability of liquefaction surface evidence. Eng. Geol. 2008, 96, 94–104. [Google Scholar] [CrossRef]
  46. Papathanassiou, G.; Mantovani, A.; Tarabusi, G.; Rapti, D.; Caputo, R. Assessment of liquefaction potential for two liquefaction prone areas considering the May 20, 2012 Emilia (Italy) earthquake. Eng. Geol. 2015, 189, 1–16. [Google Scholar] [CrossRef]
  47. Naik, S.P.; Kim, Y.S.; Kim, T.; Su-Ho, J. Geological and Structural Control on Localized Ground Effects within the Heunghae Basin during the Pohang Earthquake (MW 5.4, 15th November 2017), South Korea. Geosciences 2019, 9, 173. [Google Scholar] [CrossRef] [Green Version]
  48. Gihm, Y.S.; Kim, S.W.; Ko, K.; Choi, J.H.; Bae, H.; Hong, P.S.; Lee, Y.; Lee, H.; Jin, K.; Choi, S.J.; et al. Paleoseismological implications of liquefaction-induced structures caused by the 2017 Pohang earthquake. Geosci. J. 2018, 6, 871–880. [Google Scholar] [CrossRef]
  49. Choi, J.H.; Ko, K.; Gihm, Y.S.; Cho, C.S.; Lee, H.; Song, S.G.; Bang, E.S.; Lee, H.J.; Bae, H.K.; Kim, S.W.; et al. Surface Deformations and Rupture Processes Associated with the 2017 M w 5.4 Pohang, Korea, Earthquake. Bull. Seismol. Soc. Am. 2019, 109, 756–769. [Google Scholar] [CrossRef]
  50. Kang, S.; Kim, B.; Bae, S.; Lee, H.; Kim, M. Earthquake-Induced Ground Deformations in the Low-Seismicity Region: A Case of the 2017 M5. 4 Pohang, South Korea, Earthquake. Earthq. Spectra 2019, 35, 1235–1260. [Google Scholar] [CrossRef]
  51. Choi, J.H.; Kim, Y.S.; Choi, S.J. Identification of a suspected Quaternary fault in eastern Korea: Proposal for a paleoseismic research procedure for the mapping of active faults in Korea. J. Asia Earth Sci. 2015, 113, 897–908. [Google Scholar] [CrossRef]
  52. Yoon, S.H.; Sohn, Y.K.; Chough, S.K. Tectonic, sedimentary, and volcanic evolution of a back-arc basin in the East Sea (Sea of Japan). Mar. Geol. 2014, 352, 70–88. [Google Scholar] [CrossRef]
  53. Kee, W.S.; Kihm, Y.H.; Lee, H.; Cho, D.L.; Kim, B.C.; Song, K.Y.; Koh, H.J.; Lee, S.R.; Yeon, Y.K.; Hwang, S.; et al. Evaluation and database construction of Quaternary faults in SE Korea. Korea Inst. Geosci. Miner. Resour. 2009, 1, 327. (In Korean) [Google Scholar]
  54. Chang, C.J.; Chang, T.W. Behavioral Characteristics of the Yangsan Fault based on Geometric Analysis of Fault Slip. J. Eng. Geol. 2009, 19, 277–285. [Google Scholar]
  55. Jun, M.S.; Jeon, J.S. Focal mechanism in and around the Korean Peninsula. Geophys. Geophys. Explor. 2010, 13, 198–202. [Google Scholar]
  56. Son, M.; Song, C.W.; Kim, M.C.; Cheon, Y.; Cho, H.; Sohn, Y.K. Miocene tectonic evolution of the basins and fault systems, SE Korea: Dextral, simple shear during the East Sea (Sea of Japan) opening. J. Geol. Soc. 2015, 172, 664–680. [Google Scholar] [CrossRef]
  57. Korean Meteorological Administration. KMA Report on Pohang Earthquake (Korean); Korean Meteorological Administration: Seoul, Korea, 2018; pp. 1–41. [Google Scholar]
  58. American Society for Testing and Materials. Committee D18 on Soil and Rock. In Standard Test Methods for Particle-Size Distribution (Gradation) of Soils Using Sieve Analysis; ASTM International: West Conshohocken, PA, USA, 2004. [Google Scholar]
  59. Tsuchida, H.; Hayashi, S. Estimation of Liquefaction Potential of Sandy Soils; Publication of Mcgraw Hill Book Company: New York, NY, USA, 1972. [Google Scholar]
  60. Park, S.S.; Nong, Z.; Choi, S.G.; Moon, H.D. Liquefaction Resistance of Pohang Sand. J. Korea Geotech. Soc. 2018, 34, 5–17. [Google Scholar]
  61. NZGS 2010. Guidelines for Geotechnical Earthquake Engineering Practice in New Zealand. In Module 1—Guideline for the Identification, Assessment and Mitigation of Liquefaction Hazards; New Zealand Geotechnical Society: Wellington, New Zealand, 2010. [Google Scholar]
  62. Integrated DB Center of National Geotechnical Information. Available online: http://www.geoinfo.or.kr (accessed on 5 February 2020).
  63. KSF 2307. Test. Method for Standard Penetration. Korean Industrial Standards. Available online: https://infostore.saiglobal.com/en-us/standards/ks-f23072007655646_SAIG_KSA_KSA_1503420/ (accessed on 7 February 2020).
  64. A.S.T.M., D1586-11. ASTM D1586-11 Standard Test. Method for Standard Penetration Test. (SPT) and Split-Barrel Sampling of Soils, ASTM International, West. Conshohocken, PA. 2011. Available online: https://www.astm.org/Standards/D1586.htm (accessed on 7 February 2020).
  65. Naik, S.P.; Patra, N.R.; Malik, J.N. Assessment of liquefaction potential of alluvial soil of Indo-Gangetic Interfluves, Northern India. In Proceedings of the GeoCongress 2012; Oakland, CA, USA, 25–29 March 2012, pp. 1859–1868.
  66. Naik, S.P.; Patra, N.R. Generation of Liquefaction Potential Map for Kanpur City and Allahabad City of Northern India: An Attempt for Liquefaction Hazard Assessment. Geotech. Geol. Eng. 2018, 36, 293–305. [Google Scholar] [CrossRef]
  67. Naik, S.P.; Kundu, A.; Patra, N.R.; Bandopadhaya, S.; Reddy, G.R. Earthquake Response Analysis of Soils from Rudrapur and Khatima Sites Adjacent to Himalayan Frontal Thrust (HFT) using Field and Laboratory-Derived Dynamic Soil Properties. J. Earthq. Eng. 2019, 1–31. [Google Scholar] [CrossRef]
  68. Ansal, A.; Tönük, G. Source and site factors in microzonation. In Earthquake Geotechnical Engineering; Springer: Berlin/Heidelberg, Germany, 2007; pp. 73–92. [Google Scholar]
  69. Seed, H.B.; Idriss, I.M. Simplified procedure for evaluating soil liquefaction potential. J. Soil Mech. Found. Div. ASCE 1971, 97, 1249–1273. [Google Scholar]
  70. Seed, H.B. Earthquake Resistant Design of Earth Dam. In Proceedings of symposium on seismic design of embankment and caverns, Philadelphia; ASCE: New York, NY, USA, 1983; pp. 41–64. [Google Scholar]
  71. Zhang, G.; Robertson, P.K.; Brachman, R.W.I. Estimating liquefaction-induced lateral displacements using the standard penetration test or cone penetration test. J. Geotech. Geoenviron. Eng. 2004, 130, 861–871. [Google Scholar] [CrossRef] [Green Version]
  72. Blake, T.F. Formula (4), Summary Report of Proceedings of the NCEER Workshop on Evaluation of Liquefaction Resistance of Soils; Youd, T.L., Idriss, I.M., Eds.; Technical Report NCEER 97-0022; Temple Square: Salt Lake City, UT, USA, 1997. [Google Scholar]
  73. Cetin, K.O.; Seed, R.B.; Kiureghian, A.D.; Tokimatsu, K.; Harder, L.F.; Kayen, R.E.; Moss, R.E.S. Standard penetration test-based probabilistic and deterministic assessment of seismic soil liquefaction potential. J. Geotech. Geoenviron. Eng. ASCE 2004, 130, 1314–1340. [Google Scholar] [CrossRef] [Green Version]
  74. Idriss, I.M.; Boulanger, R.W. SPT-Based Liquefaction Triggering Procedures; Report UCD/CGM-10/02; Department of Civil and Environmental Engineering; University of California: Davis, CA, USA, 2010. [Google Scholar]
  75. Luna, R.; Frost, J.D. Spatial liquefaction analysis system. J. Comput. Civ. Eng. 1998, 12, 48–56. [Google Scholar] [CrossRef]
  76. Lenz, J.; Baise, L.G. Variability of LPI across geologic units for regional liquefaction mapping. Dyn. Response Soil Prop. 2007. [Google Scholar]
  77. Dixit, J.; Dewaikar, D.M.; Jangid, R.S. Assessment of liquefaction potential index for Mumbai city. Nat. Hazards Earth Syst. Sci. 2012, 12, 2759–2768. [Google Scholar] [CrossRef] [Green Version]
  78. Tokimatsu, K.; Seed, H.B. Evaluation of settlements in sands due to earthquake shaking. J. Geotech. Eng. 1987, 113, 861–878. [Google Scholar] [CrossRef]
  79. Ishihara, K.; Yoshimine, M. Evaluation of settlements in sand deposits following liquefaction during earthquakes. Soils Found 1992, 32, 173–188. [Google Scholar] [CrossRef] [Green Version]
  80. Jishnu, R.B.; Naik, S.P.; Patra, N.R.; Malik, J.N. Ground response analysis of Kanpur soil along Indo-Gangetic Plains. Soil Dyn. Earthq. Eng. 2013, 51, 47–57. [Google Scholar] [CrossRef]
  81. NovoLiq software, Programming Alireza Afkham Designed for Soil Liquefaction Analysis during Earthquake, First Released on September 2009. Address: 4188 Hoskins Road, North Vancouver, BC, Canada. Available online: https://novotechsoftware.com/geotechnical-software/soil-liquefaction-software/ (accessed on 20 December 2019).
Figure 1. Geological map of the study area showing the location of the Heunghae basin, the epicenter of the 15 November 2017 Pohang earthquake and its focal mechanism (modified from [47]).
Sustainability 12 01234 g001
Figure 2. Field evidences of liquefaction observed during the Pohang earthquake. (a) Linear chain of sand boils observed around epicentral area. (b, d) Isolated sand boils of larger than 1 m in diameter observed in a rice farm and dry river beds ejecting fine sand/silty sand and coarse sand. (c) Field photos showing isolated/lenticular sand boil craters. (e) Water logging in the rice farms immediately after the earthquake. (f) Section of the sand boils where the soil samples were taken for grain size analysis.
Sustainability 12 01234 g002
Figure 3. Photographs showing damaged buildings around the epicentral area during the Mw 5.4 Pohang earthquake. (a) Separated pipeline due to differential settlement of the building. (b) Diagonal cracks on a wall. (c,d) Differential settlement of the foundation column of the Daeseong Apartment.
Sustainability 12 01234 g003
Figure 4. Land damage distribution map as per the NZS 2010. The land damage distribution was categorized on the basis of reported surface evidences of liquefaction. Moreover, the red square shows the borehole locations taken for the detailed liquefaction potential analysis and liquefaction potential index (IL) estimation.
Sustainability 12 01234 g004
Figure 5. Ground motion data used for the present analysis recorded at PHA2 [57] station near the Heunghae basin. (a) Recorded ground motion at PHA2 station [57]. (b) Ground motion for the time period of strong shaking [57].
Sustainability 12 01234 g005
Figure 6. Grain size distribution graph for ejected sand from the sand boils during the Pohang earthquake. The average diameter of the tested sand (D50 = 0.17 mm–0.285 mm) and the coefficient of curvature values (Cc = 1) of the soil indicate that the ejected sands are coarse-grained and well graded.
Sustainability 12 01234 g006
Figure 7. Typical bore logs showing the soil types and variation of SPT-N with depth for borehole BB24, BB26, and BB80.
Sustainability 12 01234 g007
Figure 8. Figure shows the elevation profile taken from the southern part of the Heunghae basin and bore holes showing liquefaction in the present analysis. The liquefaction analysis suggests that the silty sand, sand with gravel, and the sandy soil are prone to liquefaction. It well matches with the locations of liquefaction during the Pohang earthquake. Dashed line joins the maximum liquefiable depth of soil layer for each borehole.
Sustainability 12 01234 g008
Figure 9. Typical plot showing the variation of FSL with depth for some boreholes in the present study. It shows that most of the soil lying between 1.5 to 15 m is prone to liquefaction.
Sustainability 12 01234 g009
Table 1. Land damage categories solely based on earthquake-induced land damage from the Pohang earthquake adopted from [30,31,61,62].
Local Scale Damage ZoneDescriptionsLand Damage Category
No Apparent Land DamageNo apparent land damage or signs of liquefaction evidence at the surfaceBlue
Minor Land DamageShaking-induced land damage occurred, but limited to minor cracking, no surface evidence of liquefactionGreen
Minor to Moderate Land DamageMinor to moderate amounts of surface evidence of liquefaction, small cracks from ground oscillation with no vertical displacement, no lateral spreadingLight Orange
Moderate Land DamageModerate to severe surface evidence of liquefaction, small cracks from ground acceleration, limited lateral spreadingDark Orange
Moderate to Major Land DamageModerate to major lateral spreading, extensive liquefaction, large ground cracksRed
Major Land DamageExtensive lateral spreading, large open ground cracks, extensive liquefactionBlack
Table 2. Typical soil profile data collected from the Integrated Data Base Center of National Geotechnical Information, Korea (https://www.geoinfo.or.kr) [62], for BB-20 used for the present analysis.
Depth (m)SPT-NSpecific GravityUnit Weight (kN/m3)Liquid Limit (LL)%Plasticity Index (PI)USCS Soil Type
0.6042.6819.6046.815.7ML
1.1042.6819.6046.815.7ML
2.7042.6820.5046.815.7ML
8.5022.692078.924MH
11.60202.691878.924MH
14402.692278.924MH
35502.692078.924MH
Table 3. Estimated LPI and post liquefaction settlements for the boreholes showing liquefaction.
Serial No.ID of the Borehole (Figure 4)Liquefaction Potential Index (IL)Post Liquefaction Settlement (cm)
1BB-033.1230.07
2BB-1612.8920.74
3BB-201227.10
4BB-223.989.63
5BB-244.4423.31
6BB-265.5222.85
7BB-282.3416.59
8BB-301.4613
9BB-3412.8541.28
10BB-369.3326.26
11BB-3812.6229.46
12BB-409.6322.82
13BB-4413.0128.49
14BB-472.7332.33
15BB-4919.1748.26
16BB-541.666.45
17BB-557.6321.84
18BB-5710.1727.79
19BB-5911.7330.90
20BB-6111.0525.90
21BB-806.3842.49
22SB-047.2319.03
23SB-082.466.35

