1. Introduction
Transportation network companies (TNCs) have expanded their operation and reached more than 600 cities worldwide [
1], out of which 173 are in Central and South America [
2]. TNCs are part of an explosive increase in innovative services for urban mobility, categorized under the umbrella term of shared mobility services, which encompass services such as ridesharing, car-sharing, and ridesourcing [
3,
4]. Information and Communication Technology (ICT) advances in recent decades, along with the concept of the shared economy, have led to the emergence of new businesses models that, according to Watanabe et al. [
5], have streamlined the interactions between transportation demand and supply and the individual and collective mobility behaviors that define how we engage with urban spaces. As these new models for urban mobility become more mainstream in the Latin American region, understanding their impacts on modal shift and other unexpected outcomes becomes a challenge for local authorities, and urban and transportation planning agencies in a context of concerns round urban sustainability and social equity.
The major success in the expansion of TNCs partly derives from the broad acceptance by users and their perception of comparative advantages in relation to traditional services of taxi services. Some widely recognized advantages include the convenience of on-time services that can be requested from mobile phones, feedback and rating mechanisms that allow for a constant improvement of the services, better vehicle conditions, etc. TNCs have also been at the center of debates related to labor regulation as they enable app users to provide transport services as “partner drivers,” enabling peer-to-peer on-demand ridesourcing supply, which, although it provides flexibility to both user-riders and user-drivers, has been called into question in relation to the protection of the latter [
6]. Such features have positioned TNCs as contested alternatives for ride hailing services. The introduction of TNCs in cities of Latin America has been followed by protests from the traditional taxi industry, disputes to define their legal conditions, and pressures to local and national governments to address the disruption and understand its economic, social, and environmental repercussions in urban contexts. Such repercussions range from potential increases (or decreases) in congestion, changes in travel behavior, and mode choice patterns that affect the performance and financial sustainability of urban transportation systems, to increasingly pressing environmental concerns associated to induced changes in the size and composition of the private vehicle fleet and its usage levels.
Specifically, this paper seeks to contribute to the literature on travel behavior and impact assessment of technology disruption in the transportation sector by analyzing how TNCs affect the reallocation of travel demand after they start operating. As in the case of other countries, TNCs have opened a wide range of mobility options that are reshaping and streamlining how travel demands are met. We explore the choice patterns of TNC users and non-users by estimating discrete choice models for public transportation, private vehicles, taxi and TNCs. We use data from the Household Travel Survey of Bogotá (2015) and secondary information sources to build a cost dataset (i.e., Uber API and Google Maps API). Based on a stated preferences survey and given the assumption that demand is only reallocated, we follow Ortuzar and Willumsen [
7] to estimate a trip replacement ratio of each origin-destination (OD) pair.
Our study proposes a primary data collection and a modal-shift analysis methodology to estimate the total amount of trips that are reallocated to TNCs in the mode split that was observed in the city before their introduction. This analysis, though limited to four modes of transportation for our case study (public transportation, private vehicles, taxis, and TNCs) can be understood as a solution to overcome the lack of data of TNC trips in existing household travel surveys. Our results suggest that public transportation and taxi services are contributing most to a new travel demand of TNC trips. Such findings are a relevant contribution to current debates around emerging technologies and their implications for sustainable urban mobility, governance and regulation of urban transportation in rapidly growing cities. The findings and methods developed throughout this paper can serve as point of reference for the debate and analysis around similar cases facing a rapid technological transition and a transformation of their urban mobility ecosystem driven by emerging technologies, and changes in behavior they might induce on different demand segments.
The paper is very timely in relation to the current climate for TNCs in Latin America, as an increasing number of local and national authorities grapple with the challenge of regulating emerging forms of shared mobility. A fertile ecosystem for start-up investments and entrepreneurship in the region has given rise to both global and homegrown companies seeking to fill gaps in the urban mobility market through data-driven innovations and adapted versions of services in various sectors for the local conditions. TNCs and other players in the industry have quickly expanded their operations to cities across the globe, including large investments in cities in Latin America and the Caribbean. This is the fastest growing and most profitable region with the highest number of simultaneous trips for Uber, with more than 25 million monthly active riders across 15 countries [
8]. In 2017, the platform was working in 26 cities in 11 countries in the region, with Brazil being Uber’s second largest market in the world with 500,000 drivers, and according to the company, more than 17 million users and Central America having an estimated 1.3 million users in the first half of 2018 [
9].
The case of Uber in Colombia has recently made the headlines of regional news by marking the first time the company ceased operations in a country in Latin America. After a lengthy legal process with the Colombian courts following a lawsuit by incumbent taxi operators, a local regulatory body’s sentence declared the company’s services illegal and ordered Uber’s cease of passenger transport operations by 31 January 2020. Only 20 days later, on 20 February 2020, Uber has launched a hybrid model of “car rental with a driver” under a variety of service categories that mimics its different options as ridesourcing. This enables the company to circumvent the court’s decision and operate within existing regulations in the country, opening a new debate in relation to the operation of the ridesourcing platform and its role in the city’s urban mobility and renewed resistance from conventional taxi operators in the country [
10,
11]. Such a development marks a milestone in the Colombian and regional context for the operation and regulation of TNCs and it is a call for attention to current regulations applied to TNCs and its enforcement. Many other regional and local competitors are still active in Colombian cities as well as nearly all countries in Latin America and the Caribbean. Beat, Cabify and Didi are the main ridesourcing alternatives to Uber in the region after the merger of Cabify and Easy. Such companies remain active both in Colombia, where they are not affected by the court’s decision against Uber, and in Latin American cities where they continue expanding their operations. The above reflects the competitive nature of the ridesourcing market despite Uber’s setback in Colombia. Such strong degree of competition and adaptability of TNCSs in the market supports the need to better-understand the influence of ridesourcing services in capturing demand from other transport modes and its environmental and social consequences as they become increasingly relevant actors in the current and future demand and supply for urban mobility in our cities.
2. TNCs and Travel Behavior
The influence of new mobility alternatives and ICT on travel behavior has become a regular issue of enquiry in recent academic research and practice-oriented work from the private sector, development agencies, and the third sector. The intersection between different social identities and other individual characteristics have caught the attention of researchers in various disciplines. Garikapati et al. [
12] suggest that younger generations brought up in a time when technology is commonplace, and connectivity is a given, are less prone to traditional car ownership, and many do not see driving as a necessity. The literature acknowledges that younger, better-educated, and higher-income transport users are more likely to become TNCs riders [
13,
14,
15].
Although some readings make a positive interpretation of these trends as generational changes and shifts toward smarter and more sustainable development trajectories, other authors caution of the dangers of the digital divide and access barriers of TNCs as potential mechanisms of social exclusion. User profiles of TNCs alternatives in various contexts point to specific demographic and more affluent groups being the main beneficiaries of this and other sharing economy transportation alternatives. Such a profile, according to Poushter [
16,
17], raises questions around the equity implications of ridesharing, TNCs, and other forms of transport that could substitute public transit in times when the division between publicly and privately provided transit alternatives is becoming increasingly blurry.
Clewlow and Mishra [
13] found that TNC users in the United States have lower levels of car ownership than non-users, although not necessarily less than regular public transport users. Their study reported little change in travel behavior after of the introduction of TNCs by 2016. However, even early evidence suggests some changes in travel behavior in relation to car usage, including a decrease in personal driving and disposal of personal vehicles (26% and 9%, respectively) [
13]. Furthermore, evidence from the same study suggest a potential for substitution of bus services and integration with long-distance public transport (commuter rail) (ibid). Jin et al. [
18] identified from a large review of the latest literature around ICT and TNCs that the relationship between TNCs services and public transport can be differentiated between competition and complementary effects depending on context-specific conditions for the regulation, supply, and operation of both transit and TNCs providers. The literature suggests that flexible on-demand services fill significant spatial and temporal gaps left by more rigid networks of public transport, having the implicit potential to increase accessibility at the local scale. These studies, though focused on other regions different from Latin America and more descriptive analysis, provide a framework to analyze modal changes in travel demand with respect to public transportation. As explained in the methodology section, we distinguish TNC-replaced trips for public transportation as complementary and competition trips.
Research considering comparisons among traditional taxis industries and the new mobility as a service MAAS paradigm including services such as Uber or Lyft are limited, which is mainly due to almost all associated technology did not exist before 2010. Nevertheless, there are significant works analyzing MAAS and its possible implications, studies intended to quantify the level of satisfaction perceived by taxi users, and a strong body of literature regarding how users choose their transportation mode [
19,
20,
21]. In addition to this, there is research studying the operative issues of taxis businesses [
22,
23]. A preliminary literature review suggests that the main data source for this kind of analysis would be composed by stated preferences surveys where people is asked to choose a transport mode to commute considering different characteristics of the modes; furthermore, they are asked about their preferences when the characteristics of the modes vary. Also, discrete choice models offer a suitable mathematical approximation to study the stated survey data. This is consistent and expected when considering that transport planning strongly relies on survey data and in discrete choice modelling techniques. Stated surveys and discrete choice models are widely used to study commuters’ patterns and to demand forecasting; thereby, results are usually part of larger planning projects.
According to Alonso et al. [
24], there is currently an abundance of methodologies to assess the perceived quality of service of transport modes. In his work, a survey was designed prior to a focus group. Then two ordered probit models were fit—the first one considers perceptions without previous information, and the second one considers perceptions when additional information is provided. Waiting time was found to be the most important factor, followed by journey time, safety, accessibility, and comfort. Fare was not an important variable within the model. Surveys are very popular for this kind of study. Nevertheless, some research has leaned toward stated preference surveys. For example, Frei et al. [
25] assessed the demand in Chicago for a flexible, demand-adaptive transit service (similar to Uber) with a web-based stated preference survey that used the API of google maps to get better origins and destinations and thus, creating realistic choice scenarios. Following the discrete choice modelling tradition, this work applied multinomial logit, mixed-logit and panel mixed-logit choice models. Marten and Ferrie [
26] also used stated preference surveys to assess the demand for Uber in undergraduate students using a disaggregated demand model. In our paper, we follow a similar approach by that of Alonso et al. [
24] and considering an economic consistent choice model that includes user preferences before and after the introduction of TNCs.
Quasi-experimental studies that address the changes in travel demand after the introduction of TNC services are significantly limited. In the work by Hall et al. [
27], a difference-in-difference model is estimated for cities in the US and with an identification approach that considers the variation of the intensity and timing of TNC penetration. Their results support the idea that a single outcome cannot be generalized, and they additionally show that, for the average transit agency, TNCs complement last and first mile trips and increase ridership by five percent after two years. They note, however, that positive effects are perceived more in larger cities than less dense urban areas. Although their work also responds to the question about induced travel changes, their paper does not look at the urban dynamics of each city and focuses only on estimating the effect on public transportation. Our research addresses the need of understanding the induced changes in different modes at a more system level of a specific urban area in Latin America and the Caribbean.
This research consolidates a set of empirically tested analytical and informative tools that can contribute to analysis and negotiation capabilities of local administrations and practitioners concerned with urban transport planning and management. In this context, our paper presents a methodological proposal and case study on how to overcome data availability issues concerning TNC trips and travel patterns and assess changes in travel demand, considering users preferences and real travel attributes of different modes of transportation. This paper proposes a novel approach to address the modal shift in Latin America and the Caribbean by considering users preferences based on existing OD information and a reallocation of travel demand. The following sections describe the data and methodology to asses changes in travel demands and urban public transportation, the main results and final remarks, and some preliminary policy implications.
3. Materials and Methods
Our main data set to estimate the discrete choice models and replacement ratio is built from the following three main sources: (i) a household origin-destination survey (HHTS) for Bogotá from 2015, (ii) the Uber Application Program Interface (API), and (iii) a stated-preferences survey collected in early 2019 for the purpose of the study. The first dataset has information about the number of trips people perform in a typical day as well as the mode of transport used, travel times, costs and other socio-demographic characteristics. The second data source is a travel cost and time dataset built from Uber’s API and the origin-destination coordinates of the trips by different modes of interest in the household travel survey. The third source of data involved the design and collection of 1796 stated- and revealed-preferences surveys to capture the necessary data for building a discrete choice model for mode choice including TNCs.
3.1. Bogotá’s Household Origin-Destination Survey
The 2015 household travel survey for Bogotá (also addressed locally as an origin-destination survey) collected information from more than 4800 homes and almost 92,000 inhabitants (47.4% males and 52.6% females). 10.7% of households belonged to socioeconomic stratum (SES) 1, 45.7% to SES 2, and 35.6% to SES 3, which altogether represent low and middle income. On the other hand, 5.4% are households belonging to SES 4, 2% to SES 5 and only 0.6% to SES 6. This distribution, although not representative of the higher-income groups is consistent with population records at the city level and other studies for public transit demand [
28,
29]. In the case of Bogotá, the age range between 20 and 30 years concentrates most of the sample, becoming an ideal target demographic for emerging players in TNC business. This survey, however, does not capture the travel patterns of TNCs trips, as the questionnaires for the 2015 survey did not include TNCs as a mobility alternative. Average travel times are above 40 min in a private vehicle, while there is a marginally shorter travel time in a taxi (36.35 min). Lower SESs have the higher travel times in all cases as there are high correlations between income and location in relation to the main centers of activities in the city, such as the city center.
3.2. Uber Data
The recently available literature suggests the mining of data from the transportation applications via publicly available APIs are a feasible information source for simulation-based analysis of travel behavior and the operations of TNCs and other data-driven transportation services [
30]. In the case of Uber’s API, data has been mostly used for the simulation and optimization of pricing and driving in relation to taxi services, with examples both in the global north [
30,
31,
32] and the global south [
33]. Nevertheless, most of this research is focused on the “supply side” of the operation, with little available research using the data for analysis of travel patterns and distributional issues for users. Uber’s API allows consulting the platform’s data at any given moment using input information of origin and destination in the form of geographical coordinates. The API produces as output a dataset of travel features based on its algorithm’s estimation of times, distances, and costs, using the extensive GPS data that Uber collects from its own partner drivers [
33]. Despite small empirical differences between estimated and actual times and costs, state-of-the-art research suggests these are good proxies for travel costing estimates if the input data of origin-destination is of good quality (ibid). The API retrieves the following information: unique identifier, ISO 4217 code, display name of product, minimum price, lower bound price, upper bound price, expected surge multiplier, expected activity duration, and expected activity distance (in miles).
We extracted 50,760 queries using the coordinates of origins and destinations of public transit, taxi and private car trips in the HHTS 2015 sample. Such trips are representative of 10,548,182 total trips using the reported expansion factors in the survey dataset (77% public transport, 6% taxi, 16% private vehicles), spanning 28,165 origin-destination pairs. The queries represent 78% of the sample of trips in the HHTS for the three modes of analysis, excluding outliers and zero-duration trips. As Uber’s API produces real-time data, queries were made within three-hour windows of the original travel time in the survey during a week in April 2019. API-mined data for Uber’s travel cost attributes are an essential input for the simulation of trips via TNCs given lack of available data and resources for collection of primary information about travel behavior linked to emerging disruptions at a representative level in the city.
3.3. Stated Preferences Surveys
Stated-preference (SP) surveys have traditionally been the go-to method for mode choice model applications in the transportation field for over three decades [
34]. Stated-preference data stems from hypothetical choice situations where the researcher defines the trade-offs to which respondents are confronted [
29,
30]. In this regard, choice sets in SP surveys are usually built from a carefully selected range of attributes using experimental design techniques that yield a suitable number of choice experiments. Recent recommendations in the literature suggest applying care to identifying parameter estimates consistently and with low standard errors while presenting alternatives that consider individual, context-specific and market constraints [
35]. When considering new alternatives for transportation choices, it is important to present information in a similar way as their market framing. We tried to apply context-specific considerations for the application of the SP survey in Bogotá, which are consistent with the recommendations by Danaf et al. [
34], building on observable travel behavior in the local context and previously applied instruments for a similar target population in the city.
Our survey included questions associated with SP and also revealed preferences (RP) surveys, which capture information about recent travel patterns of respondents, thus informing the scenarios in the SP experiment. Experimental design for SP surveys applied principles of wide span and linearly independent variation in attribute levels [
35]. We developed a factorial design for orthogonal results and reduced it for practical implementation using the method for fractional factorial design following the recommendations by Walker et al. [
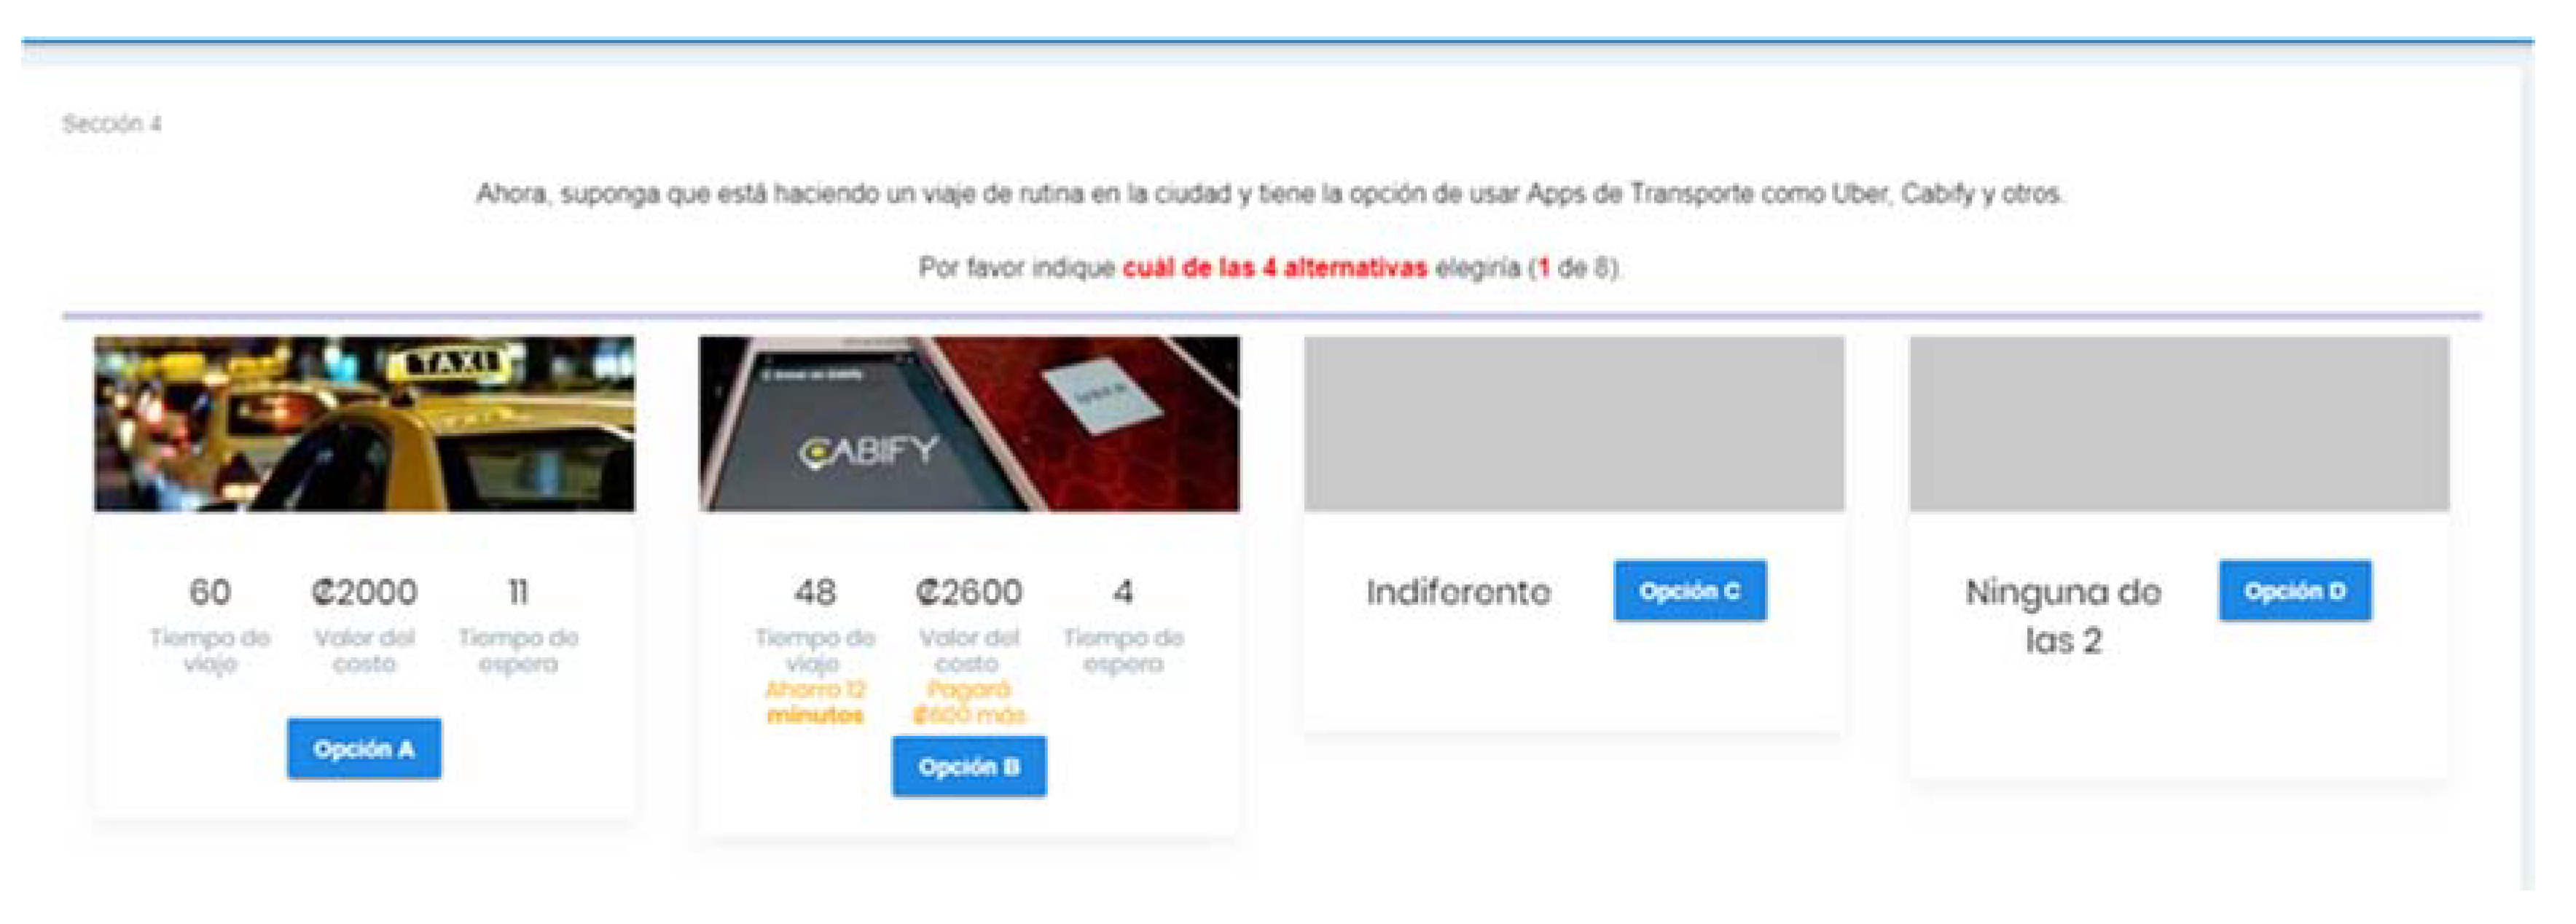
36], eliminating dominant and inferior alternatives. The experimental design involved four transportation mode choices (public transit, taxis, private vehicles, and TNCs), with three main travel attributes for public vehicles, TNCs, and taxis (cost, travel time, and waiting time) and two attributes for private vehicles (in-vehicle time and parking costs). The design involves examining three levels for each attribute. Respondents were presented with eight stated choice experiments (SCEs) designed around a current and a future alternative (TNCs). SCEs were selected based on the respondent’s current mode and travel time from the RP part of the survey (see example in
Figure 1). Two scenarios were presented considering the best and worst conditions for TNCs, and then respondents were asked to address the remaining six alternatives, which were selected at random.
A total of 1732 surveys were collected in Bogotá during 20 days between late January and February 2019 through a mixed data gathering protocol of household and web-based surveys. Then, 850 surveys were collected in randomly selected households in the zones belonging to the highest quartiles of trip generation in the transportation modes of interest according to the HHTS, the rest of the sample was obtained via self-selected web respondents. Analysis of data from the two data collection approaches revealed small variability within homogeneous groups for which mode choice analysis build on the entire sample after data cleaning (91%). In addition, over 94% of all respondents answered all SCEs. Most respondents also varied their choices in accordance with the changing profiles for TNCs, allowing the instrument to capture relevant trade-offs for estimation of the discrete choice model. Survey datasets were tested using Cronbach’s Alpha test to measure the information’s internal consistency obtaining a high coefficient of reliability.
3.4. Mode Choice Model and Analysis of Substitution
SP data were used to estimate a mode choice models between current alternatives and TNCs as future alternative. The model followed a utility maximization choice protocol, using a mixed logit model with random parameters and error terms following the normal or the log-normal distribution. The choice protocol model is specified as a binary logit that includes travel attributes of time, cost and waiting time. The utility equations are presented in Equations (1) and (2) below:
where
U0,
UF denote the utility of the current and future alternatives, being the first our original modes (car, taxi, and public transit), and the second TNCs.
β1,
β2,
β3 are the coefficient of each variable;
cost0,
costF refer to the travel fare or parking fees depending on the model;
time0,
timeF are time variables; and
wait0,
waitF refer to the waiting time for the two alternatives under consideration for each model. Travel time and waiting time variability coefficients follow the log-normal distribution through the exponential form which ensures that all these parameters are negative. Normally, distributed error terms are used to account for correlations among alternatives. For cars, in-vehicle travel time includes both average travel time and parking time, while for other modes it only includes average travel time. Two different in-vehicle travel time coefficients are estimated—for drive alone and for other motorized modes. For transit with car access, this includes the total in-vehicle travel time in car and in transit. Cost is the fare for all modes except for car, which is the sum of fuel and parking cost. The model was estimated using maximum simulated likelihood (MSL) in Python Biogeme [
37].
The estimation results are presented in
Table 1. Parameters for the choice model are applied to the baseline dataset and the simulated travel attributes from the Uber API to estimate forecasts of mode substitution on a trip-to-trip basis. Applying the mean changes in trip attributes under TNCs using Uber as a proxy versus the business-as-usual scenario, we modified values of the relevant travel attributes for each alternative in the HHTS sample and calculated revised choice probabilities or trip replacement ratios [
7,
38], which we aggregated into market shares of transportation mode choice.
5. Discussion
One of the main challenges in transport planning in rapidly growing cities in a context of rapid technological changes is the lack of updated and readily available data for decision-making. In this paper, we proposed a methodology to estimate the potential reallocation of travel demand in the face of rapid expansion of TNCs in emerging markets in cities of the global south. Our paper builds on traditional datasets such as existing Household Travel Surveys and Origin and Destination data in combination with Big Data sources such as public API’s of TNCs such as Uber and small samples of primary data to estimate potential travel attributes for trips at risk of substitution of competition with new forms of on-demand transportation. The methodology proposes a cost-effective and relatively simple approach that is well-supported by mainstream approaches to demand modelling in the literature. Such methodology serves as an alternative to overcome lack of available data of TNCs’ travel patterns for planning, decision-making, research and regulation. This constitutes an important contribution to debates about data generation and evaluative assessment of the effects of emerging forms of urban transportation in contexts where local authorities are yet to apply a city-wide mobility survey or a similar instrument for capturing data about travel patterns associated with these platforms, or where due to lack of clear governance and regulation frameworks there is limited to no access to proprietary data from TNC operators.
Among limitations of the analysis is the underlying assumption that travel demand does not change, for which only potential reallocation can be assessed. Despite the study’s limitations, our results suggest that TNC demand is comprised by more than 33% of trips coming from public transportation. This is a worrying finding from a public policy, planning, and sustainability perspective. However, out of this potential loss in transit demand, the analysis of complementarity, competition, and substitution building on the algorithm suggested by Wang and Ross [
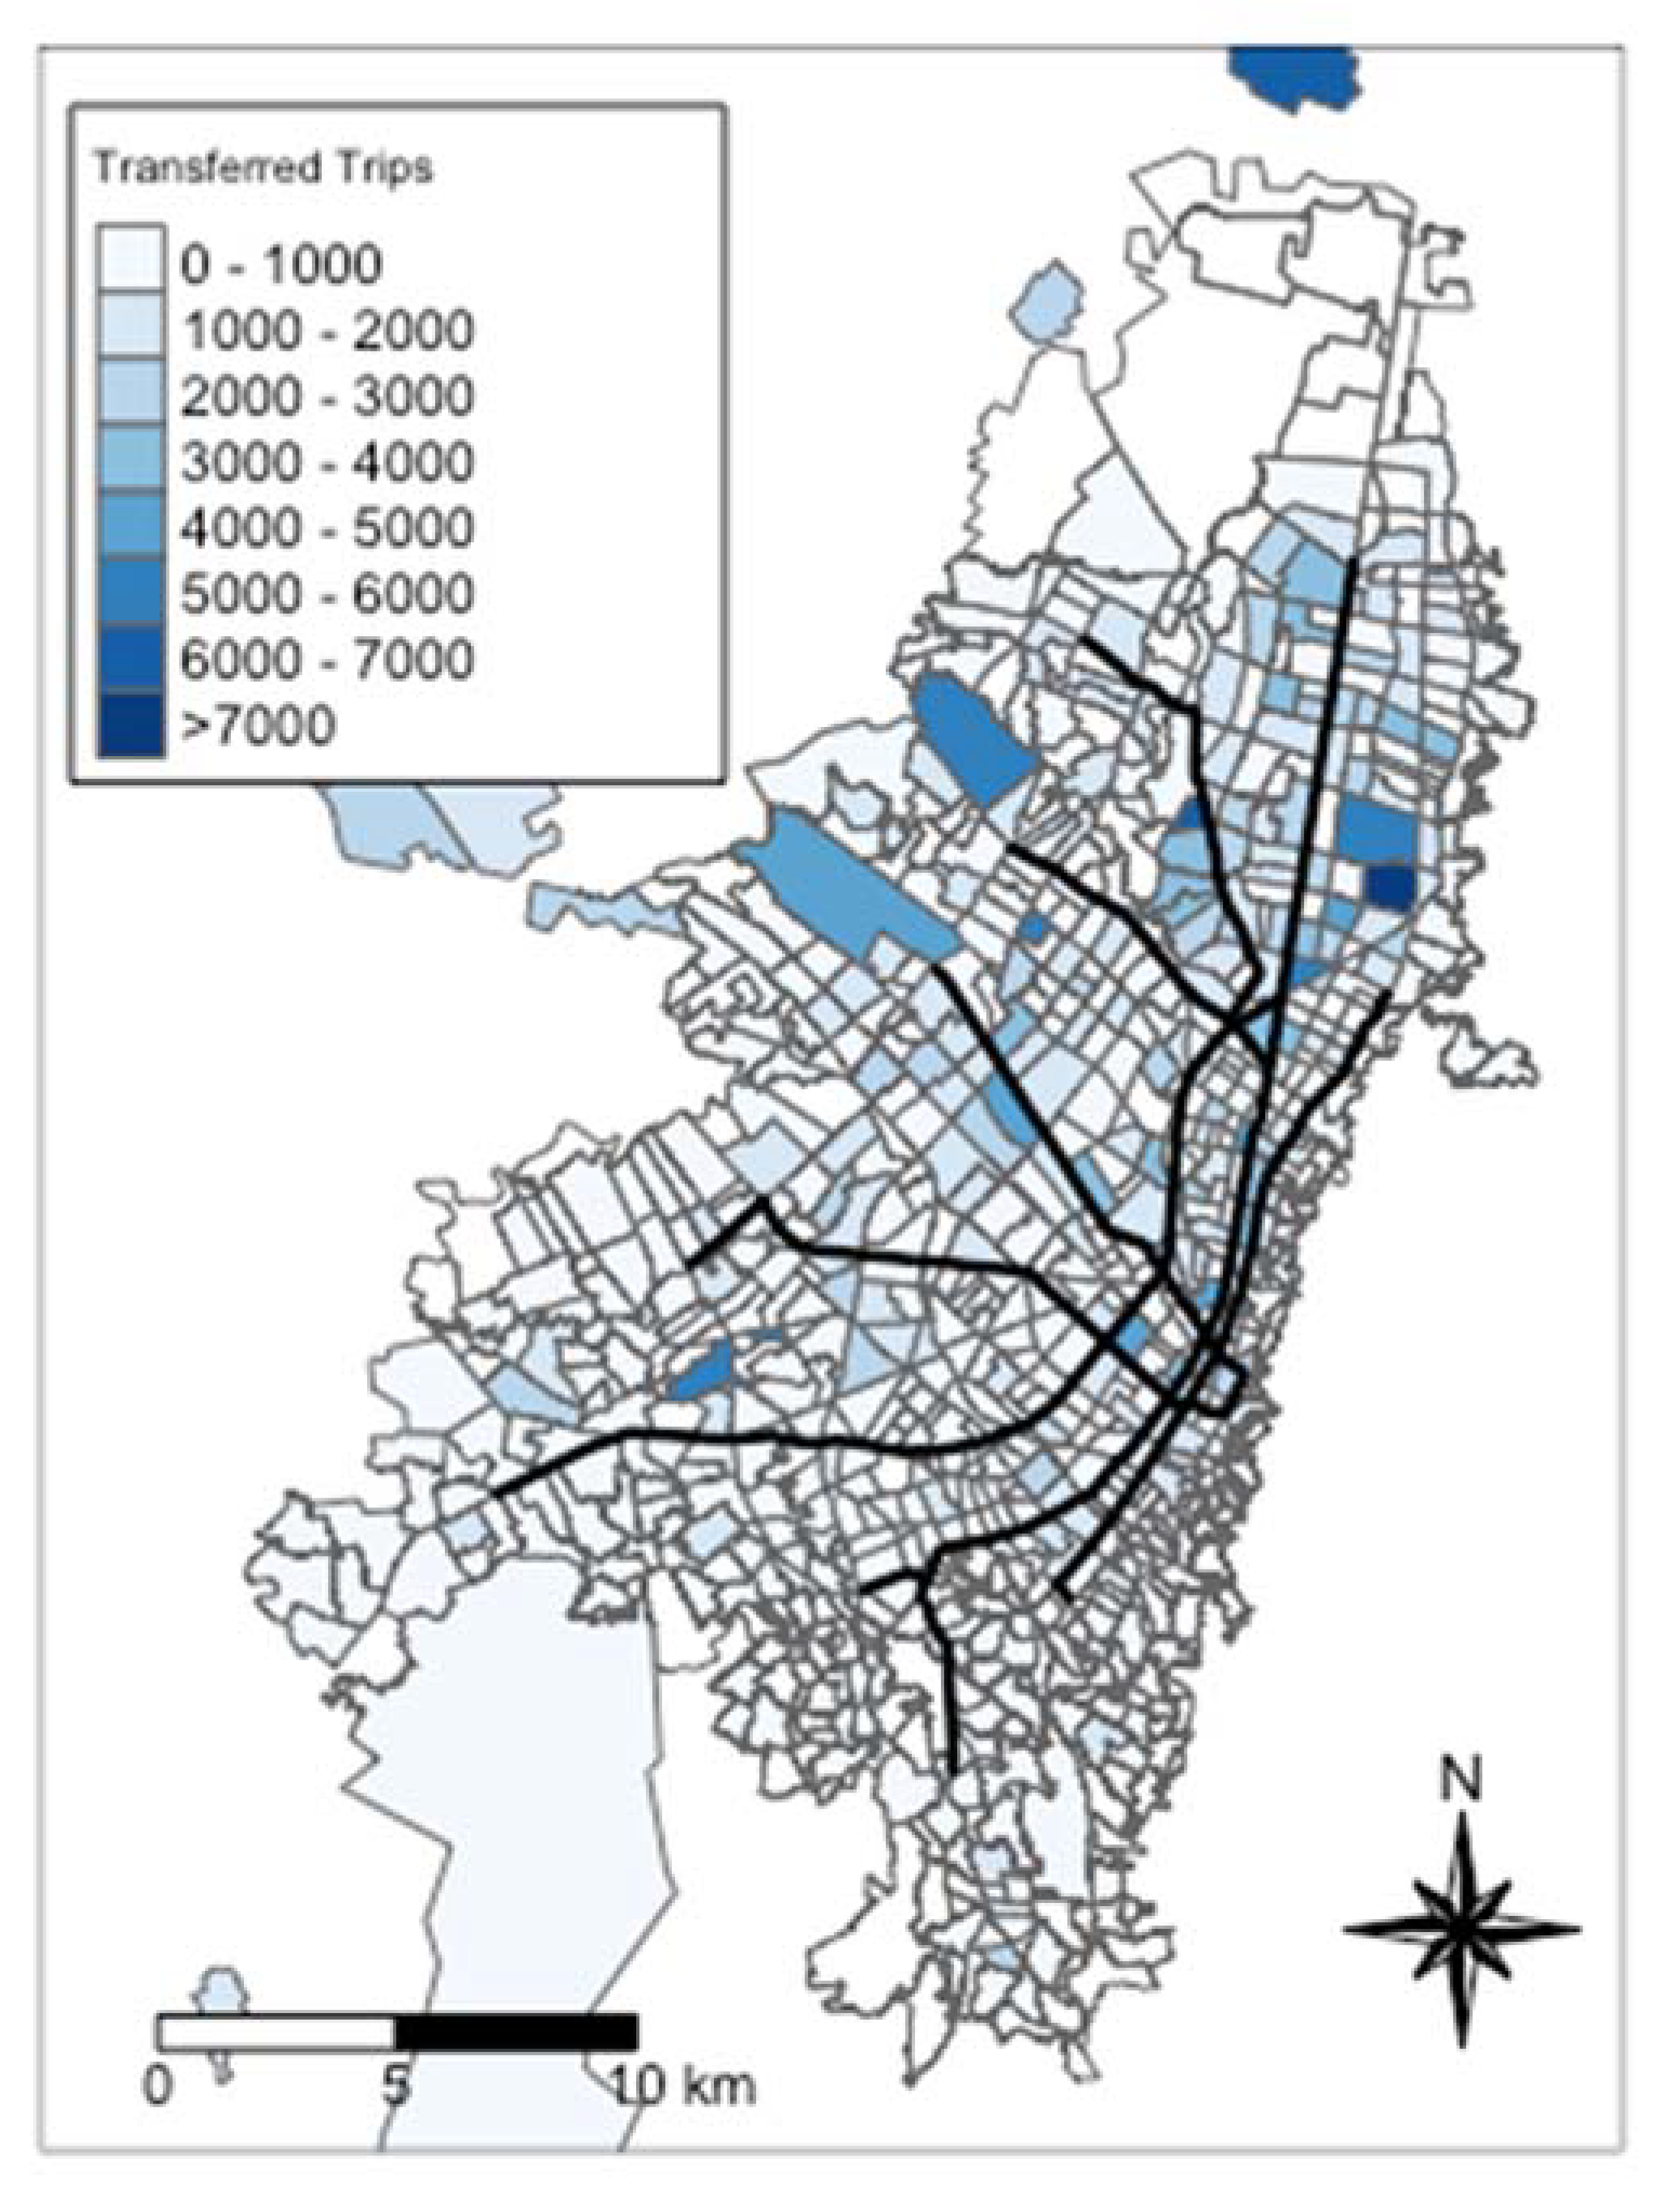
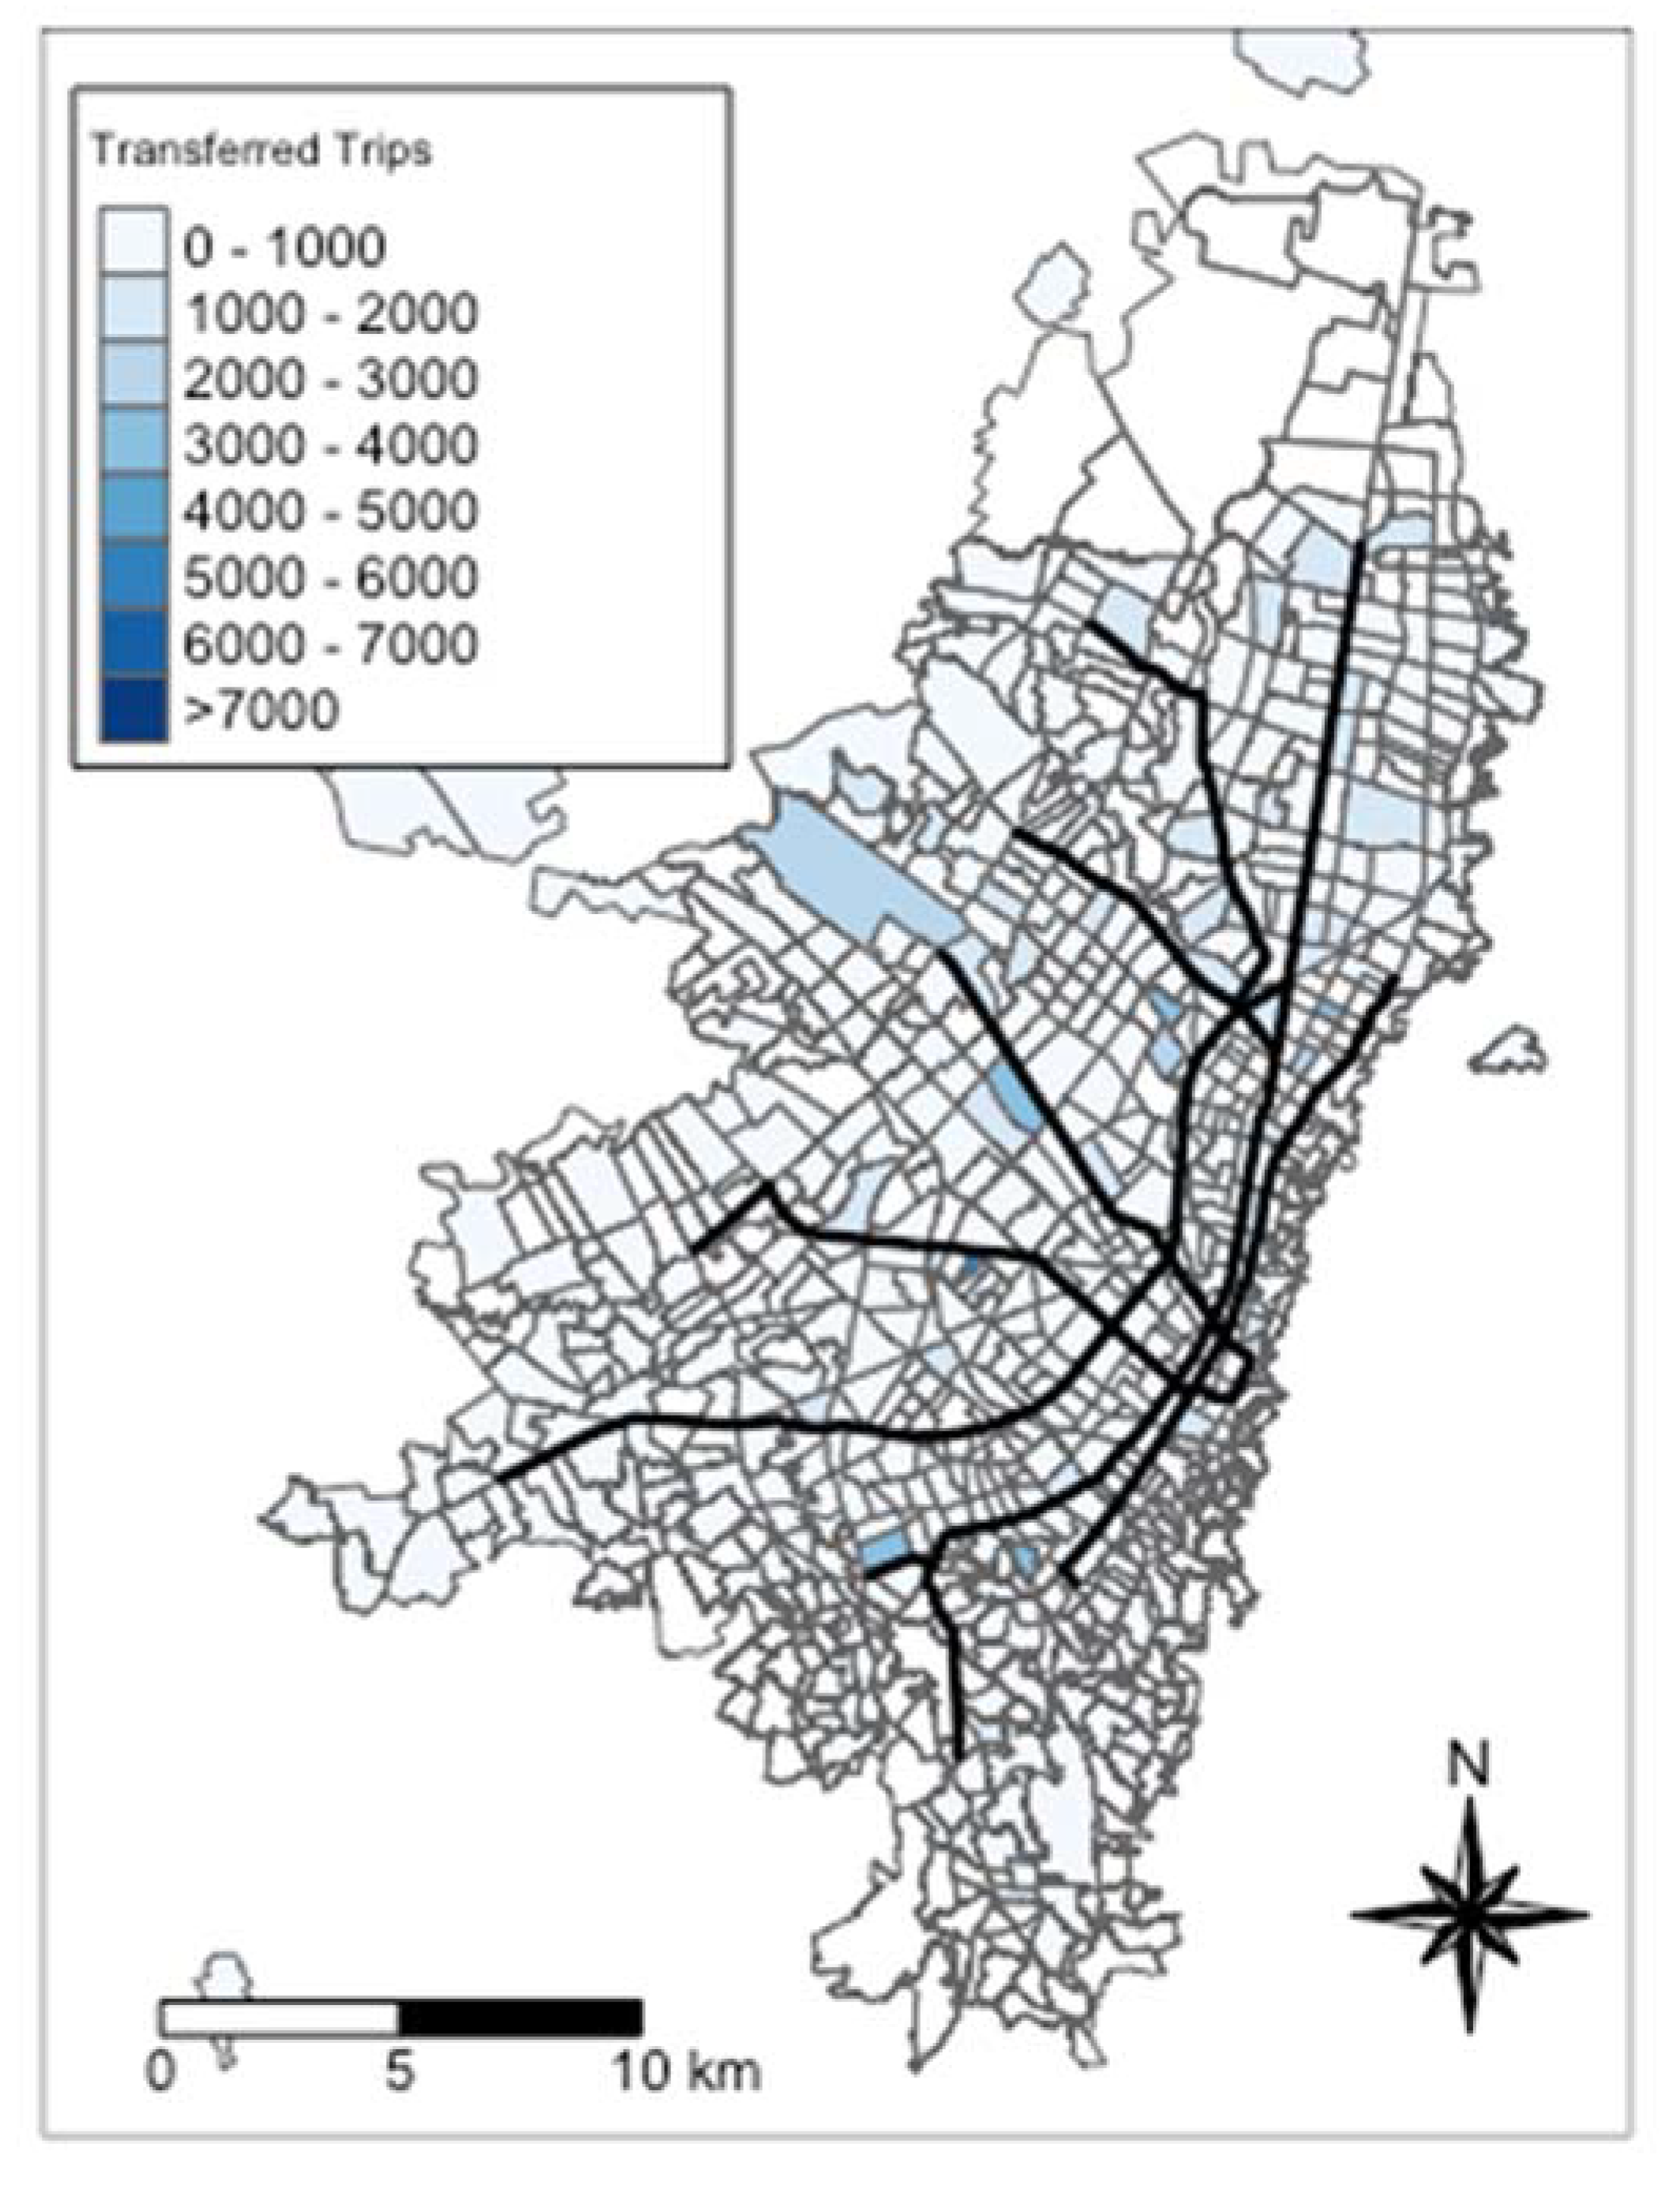
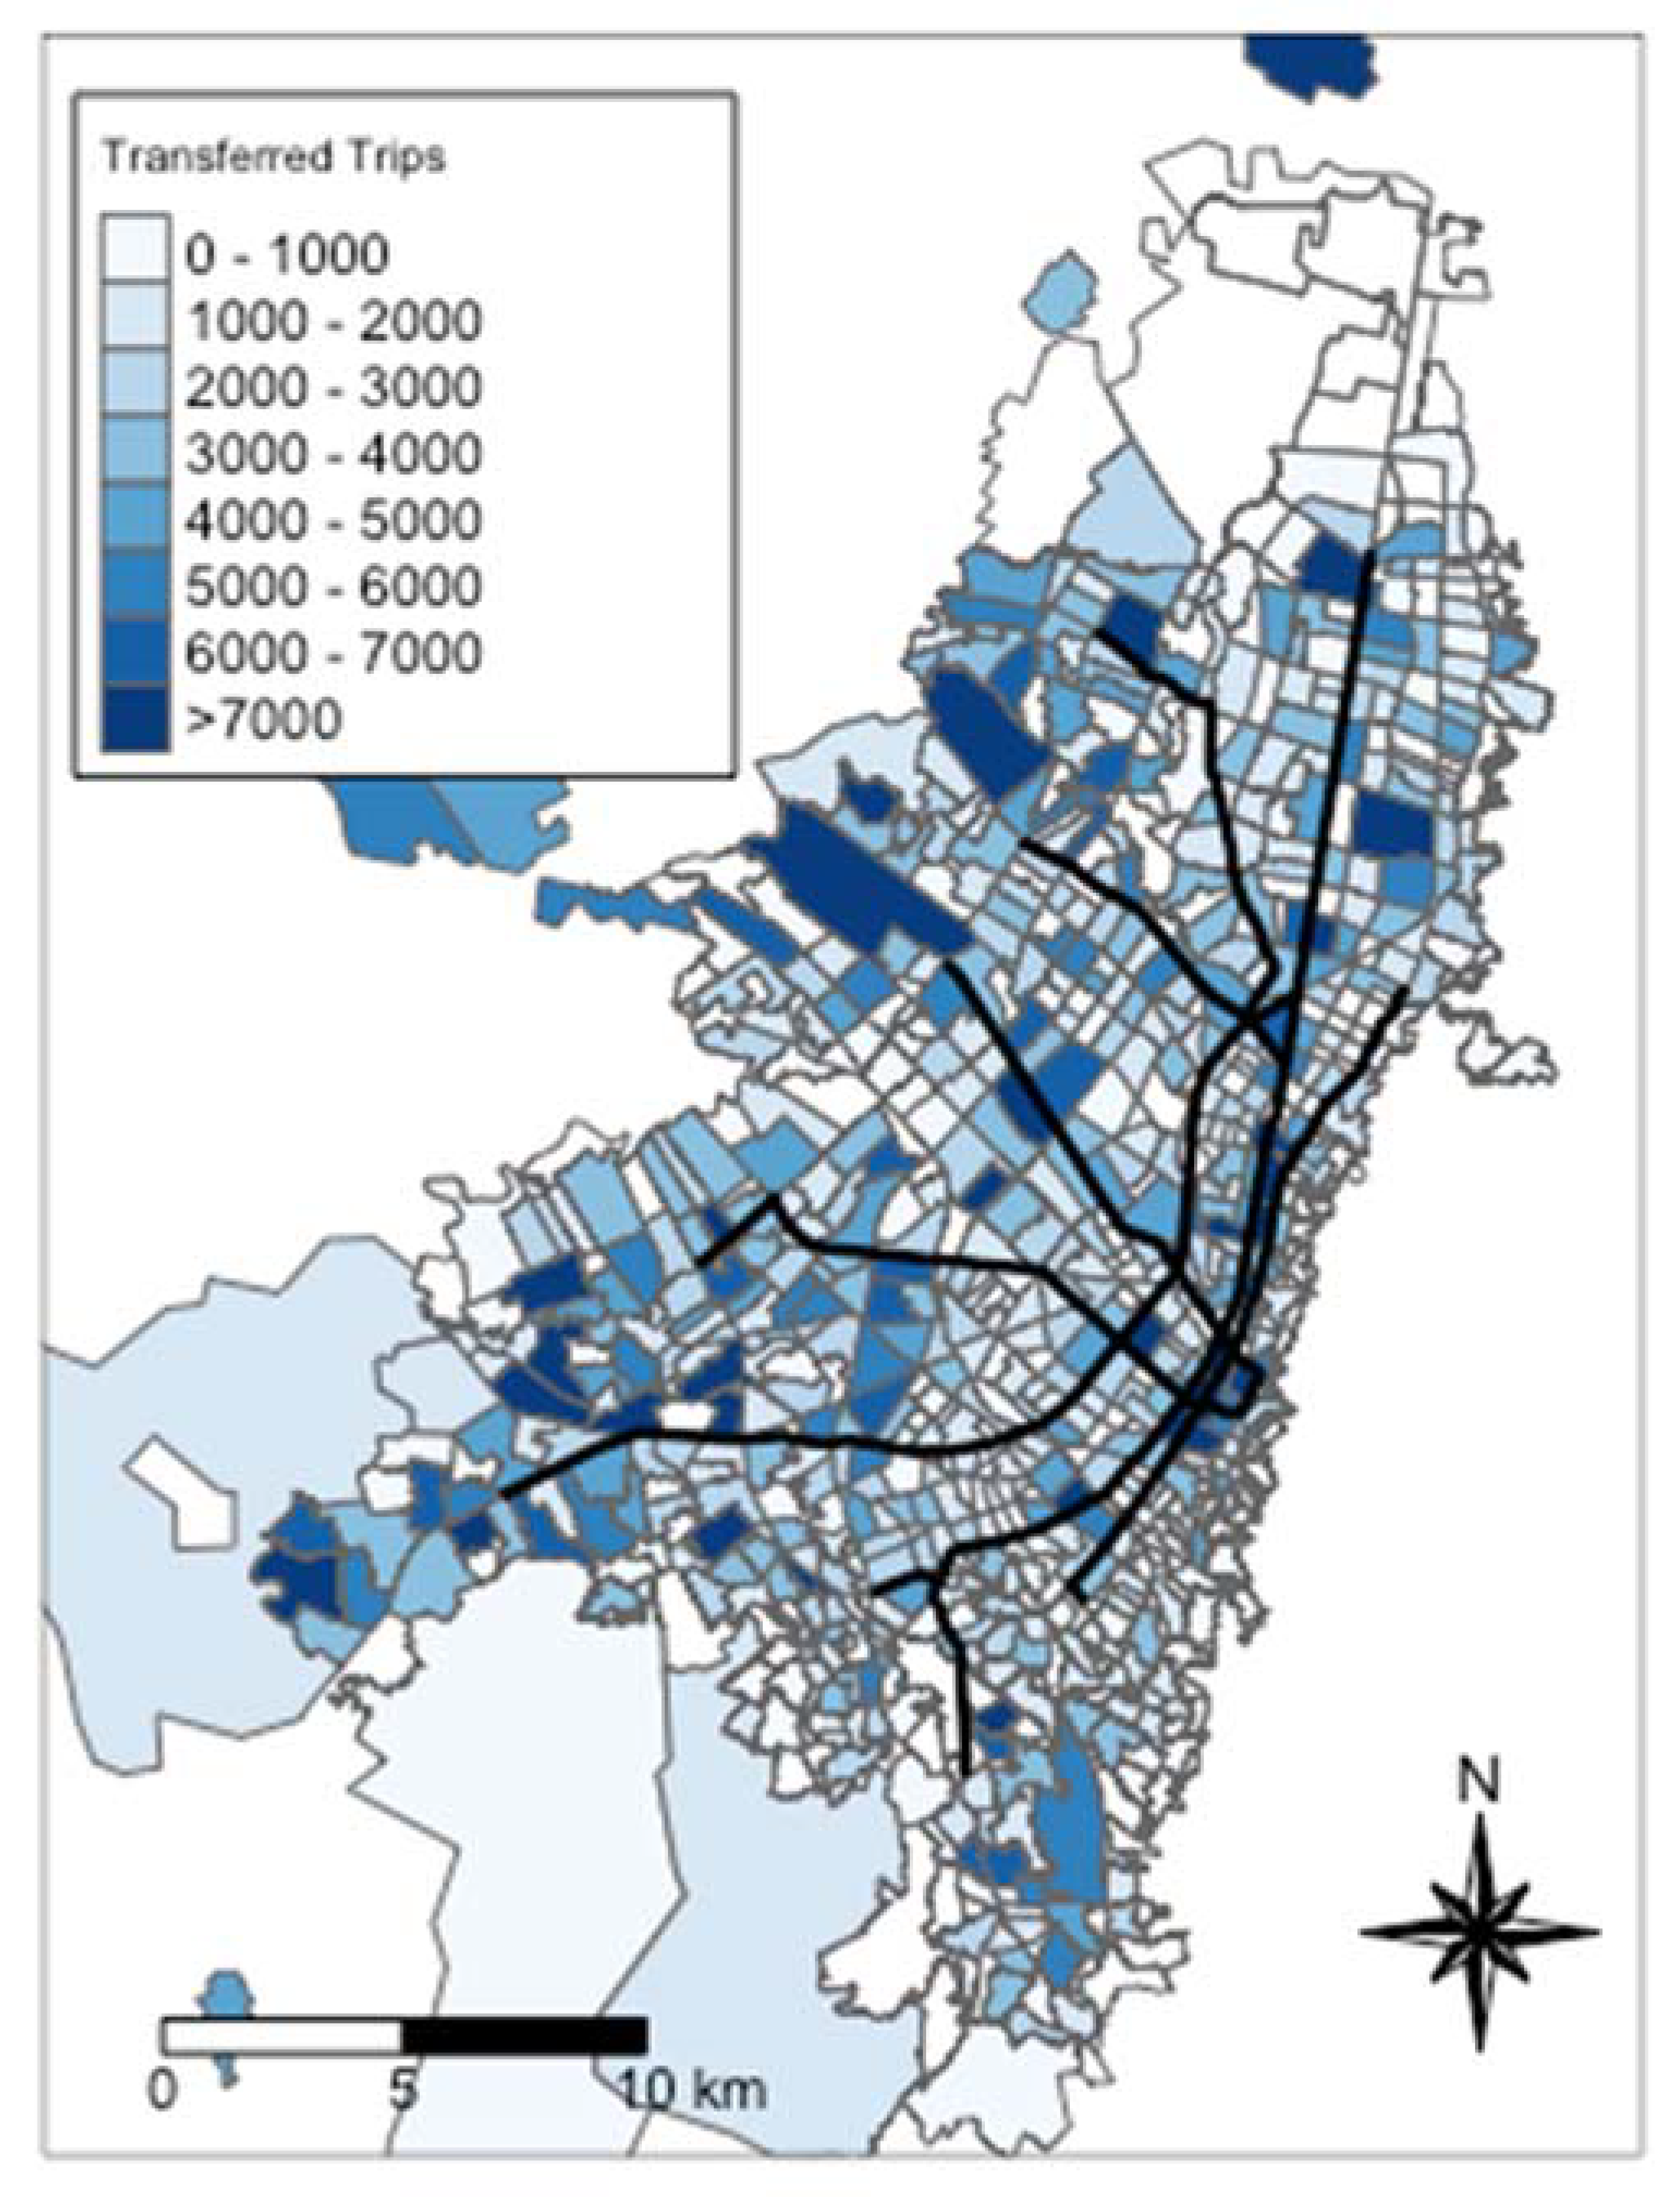
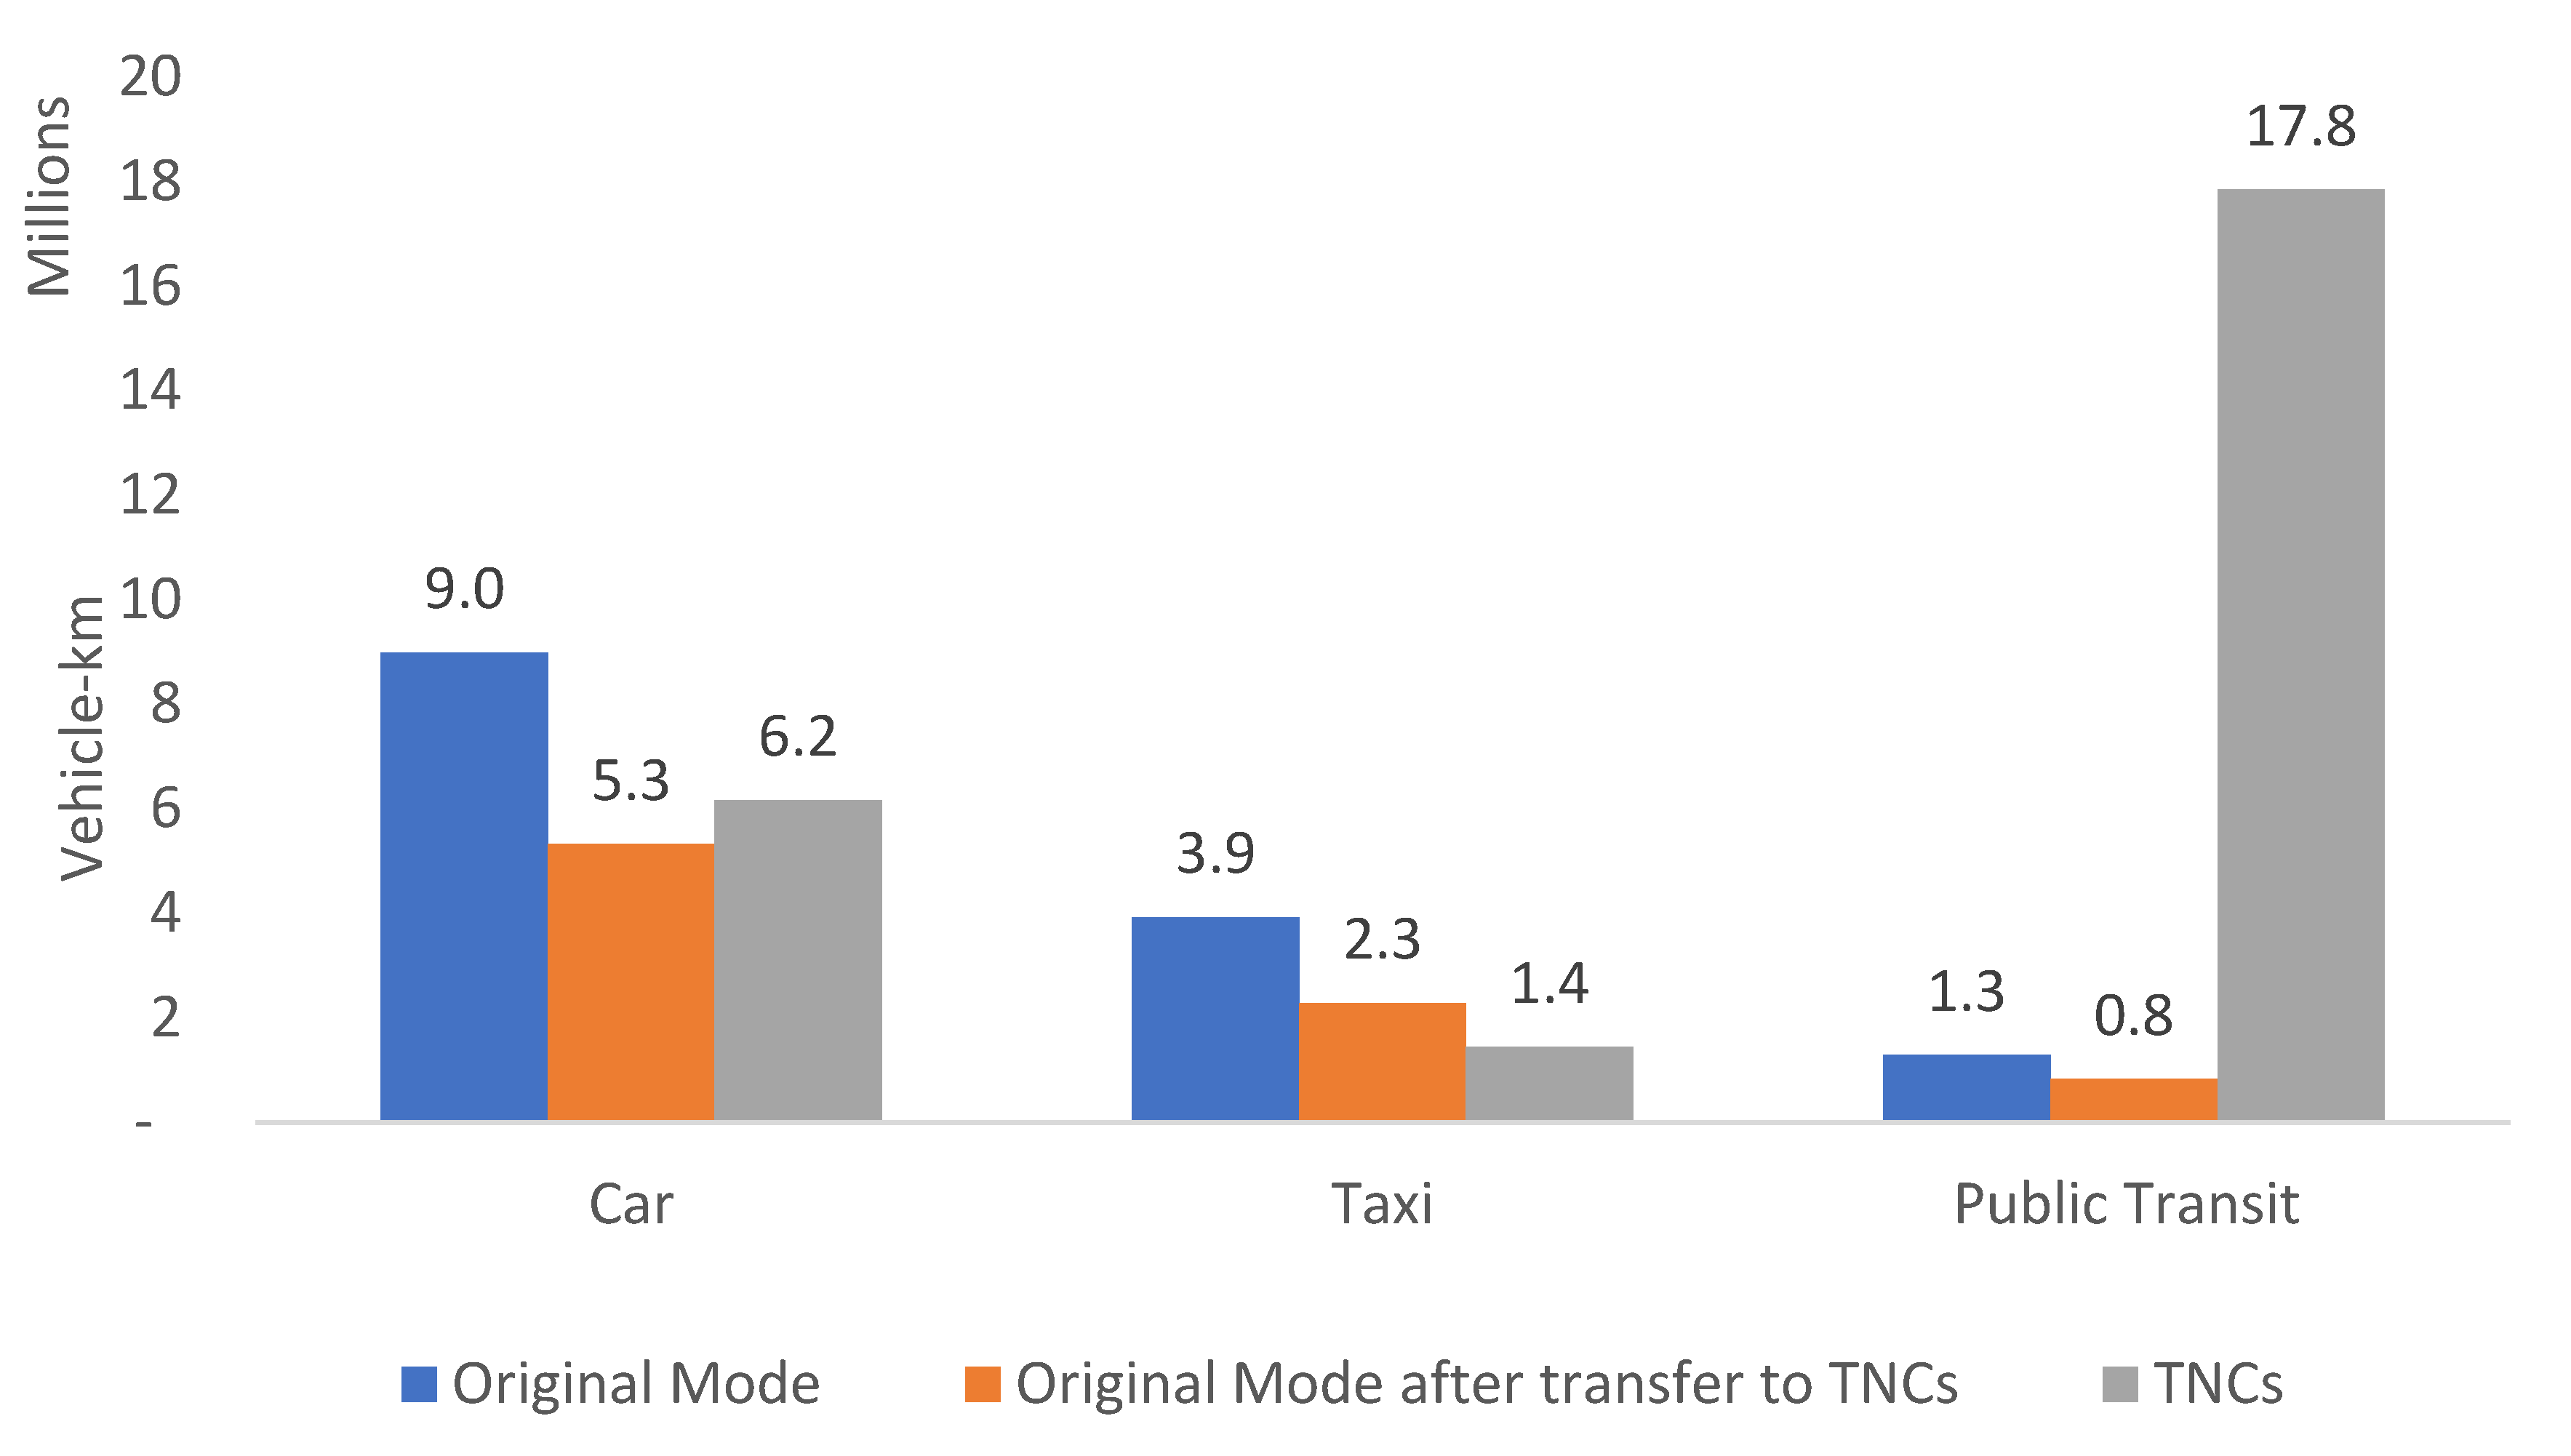
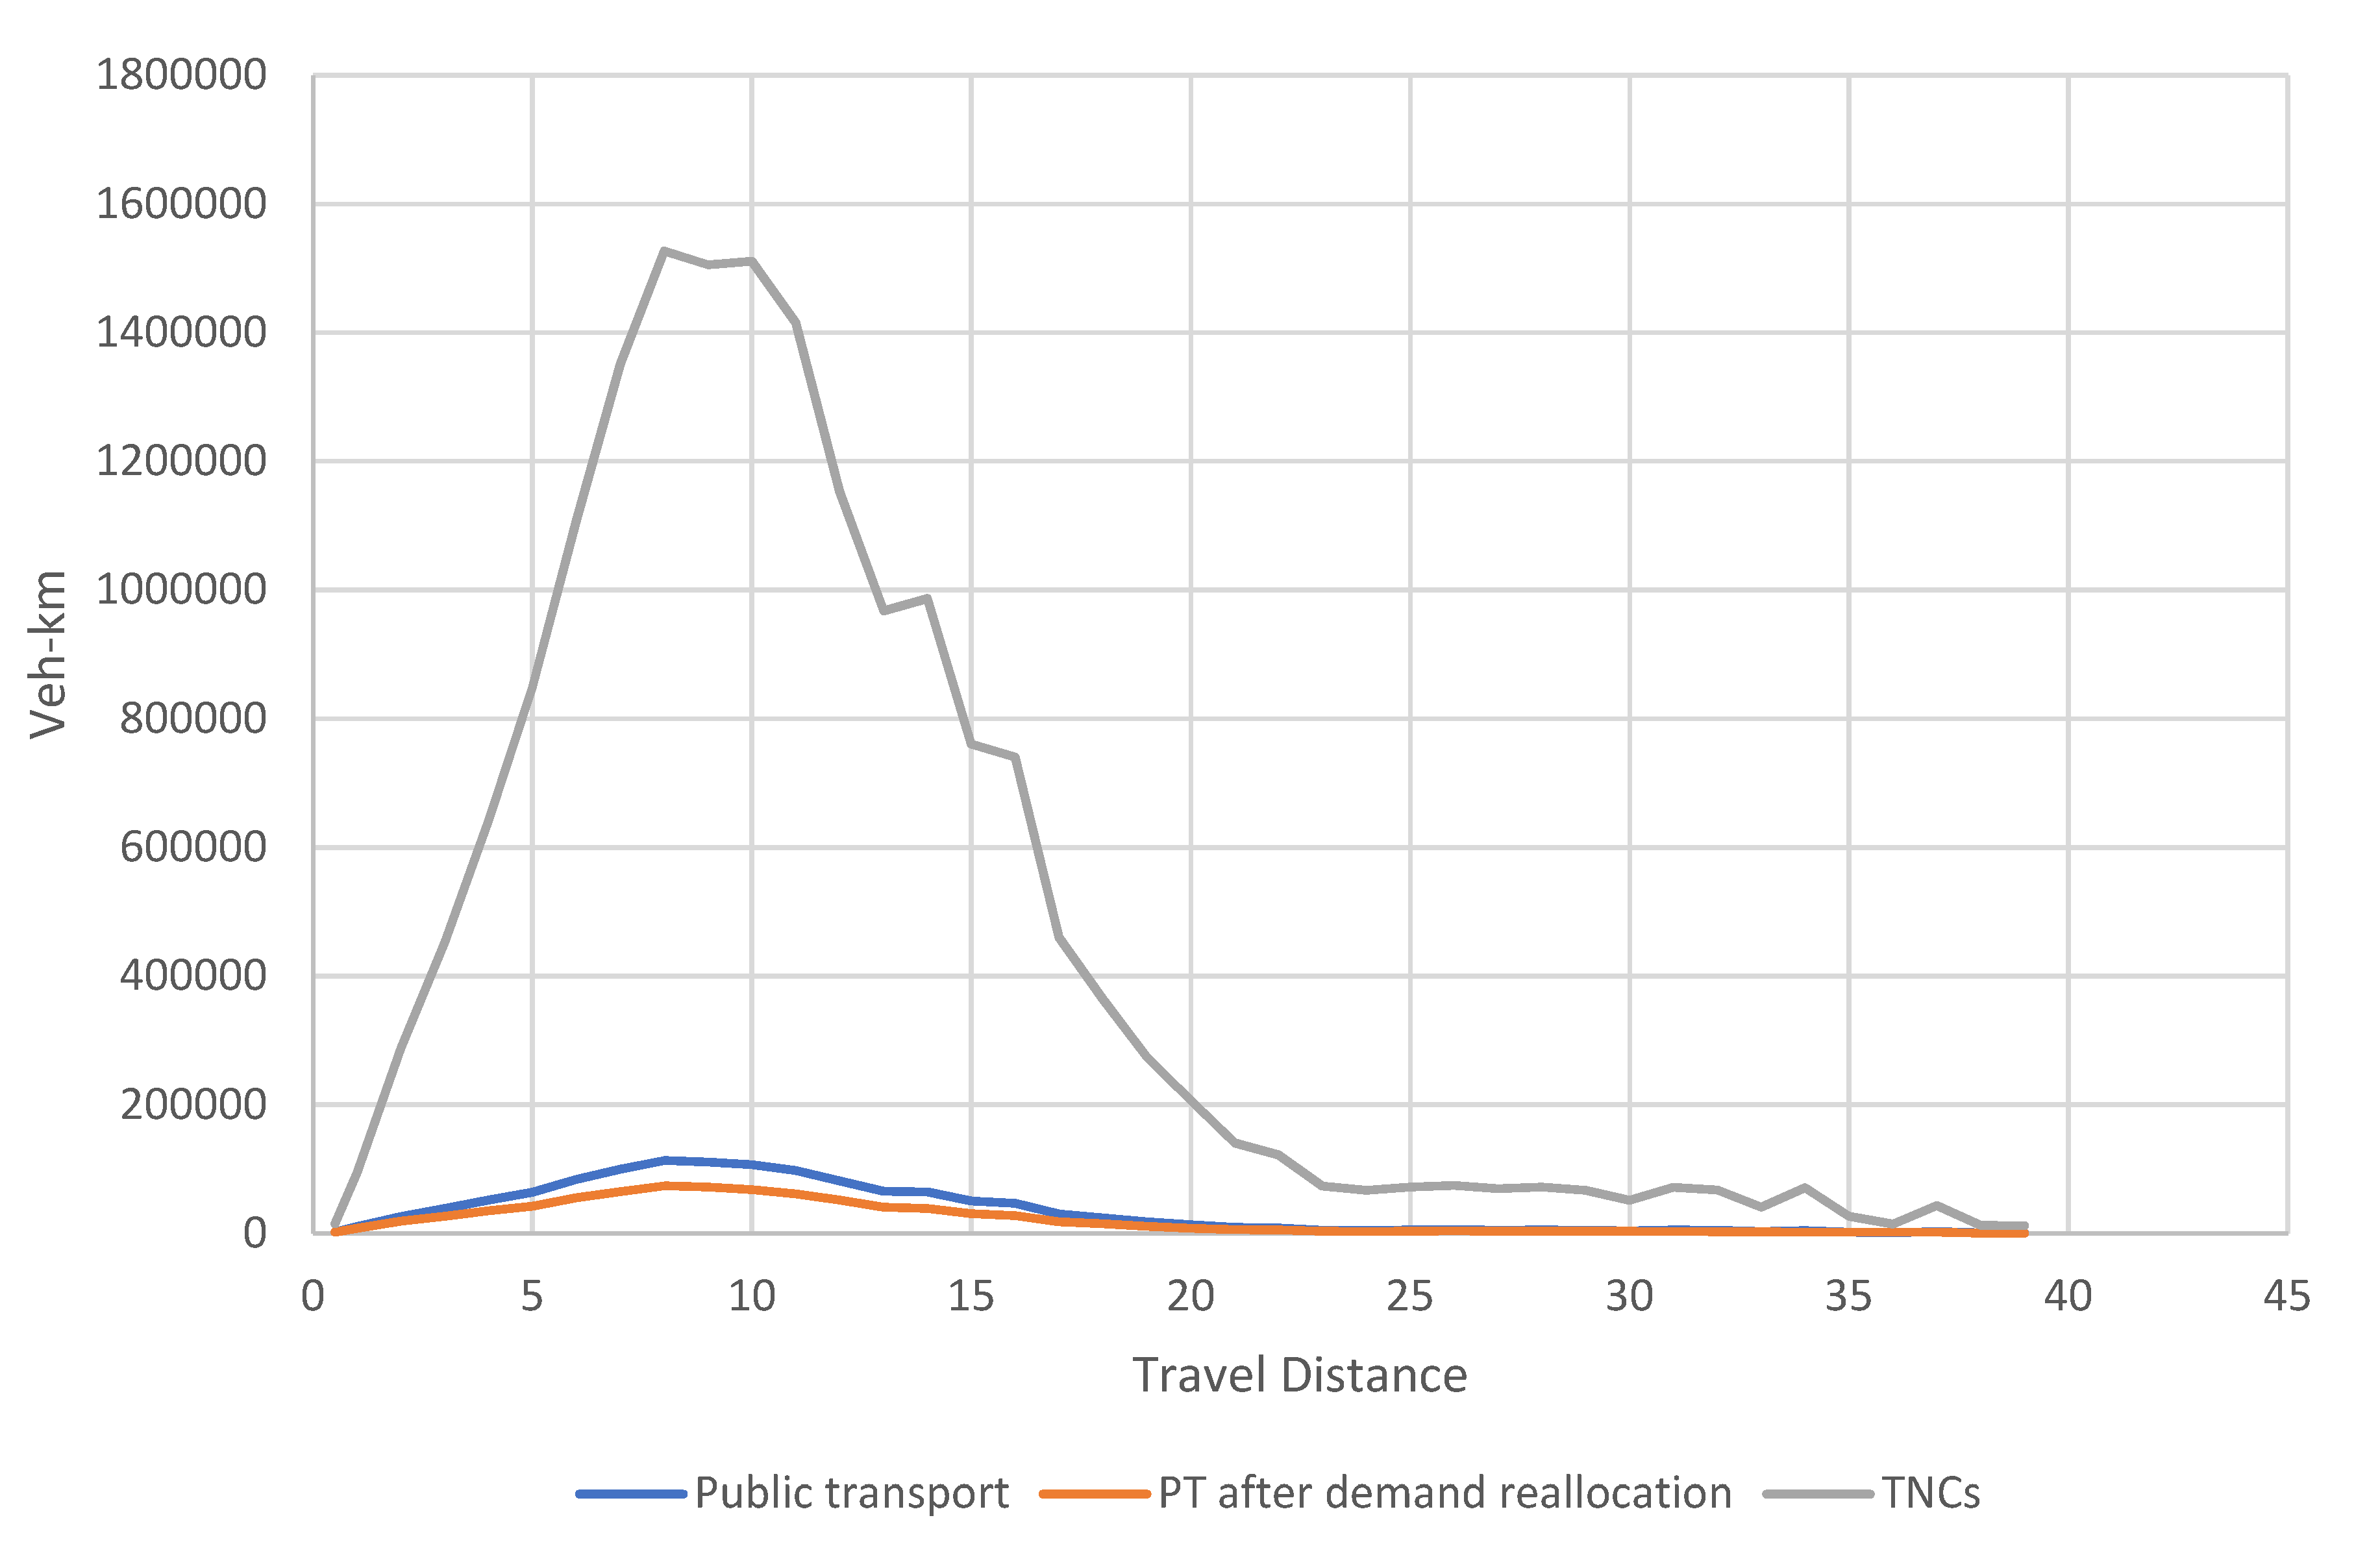
39] reflects that trips that are complementing public transport services and connecting public transport facilities both in time and distance are nearly 51% of the potentially transferable from transit to TNCs. The remaining share is considered as being made up of competition trips, which is relevant not only for public transit financial sustainability but also for other relevant urban development concerns such as the environmental footprint of urban mobility, and the consequences of increasing demand for small-scale vehicles for health and road safety as suggested by the large increase in vehicle-km travelled in each mode as shown in
Section 4.4. Potential private vehicle- and taxi-transferred trips account for less than 30% of TNC demand, and there are small differences between the spatial distribution of taxis and TNCs in Bogotá, as has been found in many other urban settings. However, considering scenarios of increase in vehicle-km due to empty km of operation in TNCs and taxi, there are relevant changes in the total contribution of these modes to congestion as compared to the baseline situation. These findings have relevance for policy and practice insofar as they suggest the absorption of demand currently served by public and private transport modes which is bound to change the configuration of traffic in the city and has severe implications for sustainability. Our findings gain additional relevance considering the new landscape for the operation of Uber in Colombia as it and other TNCs continue posing a challenge for the regulation of urban mobility, demand of public transit and car-induced vehicle-km by private vehicle, as well as to the sustainability of urban mobility in the country if left unchecked. This calls into questioning some of Bogotá’s policies in relation to traffic demand management, regulation of on-demand transport, and access to public transport, as well as suggesting potential trade-offs of different segments of demand in relation to cost and time not identified in earlier research.
Further research is needed in order to estimate the precise and specific dynamics of complementarity and competition during a typical day and specific parts of the city, which may shed light on some of the claims that TNC companies have used for the introduction of special services during the night or in areas of high night-time activity (e.g., Uber Angel). Such an aim would require more detailed information for different periods of the day and more sophisticated statistical models that incorporate time-bound controls and interactions. However, our paper presents a general overview that can serve as a guideline to design or improve transportation systems and their interoperability with emerging forms of urban mobility. In addition, further research needs to refine the proposed analysis in this paper by including non-motorized modes, which are also potentially at risk of substitution by TNCs, particularly in higher SES groups. Considering that, a larger share of transferred trips from public transport to TNCs is concentrated in middle-income socioeconomic stratums, additional targeting of promotion and behavior change programs and policies is also necessary.
As highlighted by different authors, increasing motorization rates and income per capita levels are threatening the sustainability of public transport systems and creating spillover effects on congestion and urban dynamism. Further research needs to address such unintended outcomes in terms of agglomeration effects and the heterogeneity of mobility disruption impacts for different income levels in urban areas. This paper also highlights the importance of developing local analytical capabilities to exploit existing travel surveys and data, as well as having protocols to exchange information with transport network companies and define strategies to ensure an optimal performance and interoperability of different urban mobility alternatives.
Our findings suggest the need for a balanced approach between regulation, enforcement and integration between different alternatives that enable the increase of accessibility within a framework of sustainable and inclusive mobility. Such an approach will require of the development of multi-stakeholder partnerships and a comprehensive governance and regulation framework that recognizes TNCs as active and adaptable players in the ecosystem of urban mobility of the city.
