Article

Application of Biostimulants Containing Amino Acids to Tomatoes Could Favor Sustainable Cultivation: Implications for Tyrosine, Lysine, and Methionine

by
Marina Alfosea-Simón
1,
Silvia Simón-Grao
1,2,
Ernesto A. Zavala-Gonzalez
3,
Jose María Cámara-Zapata
1,
Inmaculada Simón
1,
Juan José Martínez-Nicolás
4,
Vicente Lidón
4,
Wilbert M. Rodríguez-Ortega
5 and
Francisco García-Sánchez
2,*
1
Department of Applied Physics, Universidad Miguel Hernández, 03300 Orihuela, Spain
2
Department of Plant Nutrition, Center of Edaphology and Applied Biology of Segura, 30100 Murcia, Spain
3
Atlántica Agrícola I+D Department, 03400 Villena, Spain
4
Department of Plan Production, Universidad Miguel Hernández, 03300 Orihuela, Spain
5
Independent Researcher, Miami, FL 33222, USA
*
Author to whom correspondence should be addressed.
Sustainability 2020, 12(22), 9729; https://doi.org/10.3390/su12229729
Submission received: 28 October 2020 / Revised: 17 November 2020 / Accepted: 19 November 2020 / Published: 21 November 2020
(This article belongs to the Special Issue Sustainable Applications in Agriculture)

Abstract

:
Tomato (Solanum lycopersicum L.) is one of the most important crops worldwide as per its production and the surface cultivated. The use of biostimulant products plays a fundamental role in mitigating the negative effects of climate change and reducing the use of conventional fertilizers. Many of these products are formulated with amino acids (AAs). This study was conducted to elucidate the effects of the foliar application of tyrosine (Tyr) (15 mM), lysine (Lys) (15 mM), methionine (Met) (15 mM), and a Tyr + Lys + Met (15 mM + 15 mM + 15 mM) mixture on the physiological and metabolic processes, vegetative growth, and nutritional state of Optima variety tomato plants. The results showed that application of the AAs, individually and combined, was beneficial for the growth of the aerial part, net assimilation of CO2, and water use efficiency (WUE). Application of Tyr resulted in the best WUE. The metabolomics study revealed that AA treatments increased the concentration of proline, fructose, and glucose, whose role was to stimulate glycolysis and the Krebs cycle. Thus, the plants could have greater reduction power and energy, as well as more carbon molecules for their growth processes.

1. Introduction

The tomato (Solanum lycopersicum L.) is one of the most important crops worldwide on the economic and social level [1]. Its fruit is of great interest to today’s society, as it is a source of compounds with great human health benefits [2]. According to the statistical data of the Food and Agriculture Organization (FAO) (2020) [3], Spain is the second-largest producer of tomatoes in Europe, with approximately 56 thousand hectares cultivated and a yield of 85 t/ha.
In the last few years, agricultural production has been threatened by climate change, which brings with it high temperatures and periods of drought that are long-lasting and more intense. Along with this, the world population has increased considerably. This is said to be the general trend in the coming years; therefore, it is necessary to increase the production and yield of many crops to feed the world’s population in environmental conditions that are increasingly more unfavorable for cultivation [4,5]. This must be accomplished together with a greater awareness and respect for sustainability and the environment, specifically referring to uncontrolled irrigation and use of harmful fertilizers [5,6]. Thus, researchers and agriculture companies are planning studies to gain new scientific knowledge for developing sustainable crop growing strategies that are respectful of the environment. Some of these strategies are based on the application of biostimulant products [7], whose use has been observed to significantly increase crop yields due to the stimulation and improvement in physiological and metabolic processes of plants under conditions of soil and climate stress [8].
Biostimulant plant products, according to the UE 2009/1009 regulation [9], are defined as “products that stimulate the nutrition processes of plants independently of the nutrient content of the product, with the sole objective of improving the efficiency of the use of nutrients of plant crops, their tolerance to abiotic stress, their quality properties, or to increase the availability of nutrients that are immobilized in the soil or rhizosphere.” These products can be formulated with different chemical families, among which we find (i) humic acids, (ii) hydrolyzed proteins, (iii) algae extracts, (iv) chitosan and biopolymers, (v) inorganic compounds, (vi) beneficial fungi, and (vii) beneficial bacteria [10]. However, in the last few years, a great quantity of free amino acids has been added to biostimulant products, as they have numerous effects on crops, such as (i) increasing the availability of nutrients and quality of plants, (ii) softening the negative effects of certain environmental stresses, (iii) acting as hormone precursors, (iv) acting as signaling factors for different physiological processes, such as glutamate receptors (GRL), (v) regulating the absorption of nitrogen, (vi) favoring the development of roots, and (vii) regulating antioxidant metabolism [8,11,12].
Although the positive impact of amino acid application is well known, there is little information on the role that each amino acid (AA) plays in physiological and metabolic processes. There is also a lack of information on their proper use, as AA effects depend on a combination of factors, such as the crop, the dose utilized, weather, manner and timing of application, and so on [13,14]. Therefore, to formulate custom biostimulant combinations that are specific and efficient, the first step is to know and understand the role that each AA plays in the physiological and metabolic processes of crops, and to identify the antagonistic, neutral, or synergistic effects that may occur when various amino acids are combined into a single formulation. Some studies have assayed the application of commercial biostimulants on tomato plants; for example, ‘Fitomare’® increased drought tolerance [15], ‘CycloFlow’® resulted in the best yield of plants grown under high temperatures [16], the combination of ‘Tecamin Flower’® and ‘Tecamin Brix’® utilized under saline conditions improved the yield and the quality of tomato fruits [17], and ‘Megafol’® and ‘Viva’® showed a positive response in plants whose nutrition was conventional [18]. However, all of these products were formulated with great quantities of compounds, and this hinders the understanding of the mechanisms responsible for improving the plant’s tolerance to abiotic stresses.
Among the amino acids that are commonly utilized for formulate biostimulant products, we find tyrosine, lysine, and methionine, which are added either as free amino acids or as parts of hydrolyzed proteins. Tyrosine (Tyr) is an aromatic amino acid needed for the synthesis of proteins and metabolites with diverse physiological functions, such as antioxidants, pollinator attractants (betalain), and inducers of secondary metabolism defense compounds (rosmarinic acid, dhurrin, and benzylisoquinoline alkaloids). This amino acid is synthesized downstream in the shikimate pathway, which is also a precursor for other aromatic AAs. The levels of Tyr in crops change depending on their stage of development, their types of tissues, and the species and variety [19]. Lysine is an amino acid involved in diverse responses against abiotic and biotic stresses through the sacharopine pathway (SACPATH) [20]. It is synthesized in the metabolic route of aspartate, which produces threonine, methionine, and isoleucine [21]. Methionine regulates the development of plants, and it is a precursor for metabolic responses in an ecosystem that help plants adapt to diverse environmental conditions [22,23]. Methionine also regulates the assimilation of polyamines, secondary metabolites, and ethylene, aside from favoring resistance to abiotic stresses through the S-adenosyl methionine (SAM) pathway [23,24]. Rai [25] showed that exogenous application of this amino acid could help plants tolerate or resist various abiotic stresses. Nevertheless, limited scientific information has been found on the specific effect that individual application of these compounds has on the physiological and metabolic processes of plants, and even less information is available on the simultaneous application of these AAs as a mixture. Knowing all of these aspects could be very useful when formulating the newest generation of biostimulants, either through the addition of free amino acids or through the selection of raw materials that contain AAs in the ratio and concentration desired. Therefore, the main objective of the present study was to understand the effects that exogenous application of the amino acids tyrosine, lysine, and methionine, either individually or as a mixture, has on the physiological, metabolic, and nutritional processes of tomato plants of the ‘Optima’ variety, and to determine if these changes have an effect on the growth of the plants.

2. Materials and Methods

2.1. Growing Conditions and Plant Material

The study took place in a multi-tunnel greenhouse at the experimental field of the CEBAS “La Matanza”, located in the municipality of Santomera (Murcia). To monitor the temperature, a cooling system and aluminum shade cloths (30%) were utilized, which maintain the optimum environmental conditions for the crops. The environmental characteristics of the greenhouse during the experiment were as follows: photosynthetically active radiation (PAR) of 1000 nmol m−2 s−1, day/night temperatures of 32/19 ± 3 °C, relative humidity (RH) day/night of 52/80 ± 5%, and a natural photoperiod of 15 h.
For this study, tomato plants (Solanum lycopersicum L.) var. ‘Optima’ were utilized, obtained from the nursery Babyplant S.L. (Santomera, Murcia, Spain). The seedlings were transplanted to 3.5 L pots containing a “Universal” substrate (Projar professional, 2018, Quart de Poblet, Spain), after which they were placed in the greenhouse described above. The substrate was composed of 50% yellow and black peat, 40% coconut fiber, and 10% perlite. Once the plants were transplanted, water was applied at pH 8.3 and an electric conductivity (EC) of 0.9 dS m−1 in an irrigation system composed of lines containing 4 L h−1 self-compensating drippers. The volume of water applied was sufficient for drainage to be observed after each irrigation event. Two weeks after irrigating with only water, the plants were irrigated with 50% Hoagland nutrient solution for one minute a day, composed of KNO3 (27 g 100 L−1), Ca(NO3)2 (42 g 100 L−1), KH2PO4 (7 g 100 L−1), MgSO4 (13 g 100 L−1), Fe-EDTA (1 g 100 L−1), and micronutrients (1 g 100 L−1; Hidromix S, Valagro). After two weeks, the fertilization was increased to 100% Hoagland solution, twice a day, five minutes in the morning and five minutes in the afternoon. Additionally, there was 15% drainage after each irrigation. One week after irrigating with the 100% solution, the different AA treatments were applied.

2.2. Amino Acid Preparation

In this study, the amino acids tyrosine (Tyr), lysine (Lys), and methionine (Met) were assayed and were acquired from Calid Iberica (Barcelona, Spain). For the preparation of each AA (each was prepared independently), a stock solution for each was prepared by weighing 7 g and diluting with 100 mL of milliQ water. Once the stock solutions were prepared, the treatment solutions were prepared for foliar application, including (i) control treatment (milliQ water), (ii) treatment with Tyr (15 mM), (iii) treatment with Lys (15 mM), (iv) treatment with Met (15 mM), and (v) treatment with Tyr + Lys + Met (15 mM + 15 mM + 15 mM; a mix of the three AAs). The pH of each solution was adjusted to 5.5–7.5, and Tween-20 was added at a final concentration of 0.1%. Tween-20 is a wetting agent that improves and facilitates the adherence of solutions to the leaves of plants.

2.3. Application of the Treatments

Diverse treatments were applied so that most of the foliar area was covered by the formulations. This was done one week after starting the irrigation with 100% Hoagland nutrient solution. The day after application, the plants were sprayed with distilled water to ensure greater absorption of the product, as the leaf cuticle swells and its permeability increases. Treatments were applied to 12 plants (four experimental units with three plants per experimental unit).

2.4. Parameters Evaluated

2.4.1. Gas Exchange Parameters

Gas exchange parameters were measured in fully expanded and developed leaves between 8:30 and 11:00 a.m. in two plants per experimental unit one week after foliar application. For this, a portable photosynthesis analyzer was utilized (PP System Ciras2, Hitchin, UK), whose measurement conditions were adjusted to a PAR = 1200 mmol m−2 s−1 and 400 ppm of CO2 in the measurement chamber. This equipment measured the net assimilation rate of CO2 (ACO2) and stomatal conductance (gs), and it calculated the water use efficiency (WUE = ACO2/Eleaf, where Eleaf corresponds to the value of leaf transpiration obtained in each measurement) [26].

2.4.2. Chlorophyll Fluorescence and Concentration Parameters

An FMS-2 portable modulated pulse fluorimeter (Hansatech Instruments Ltd., Pentney, UK) was utilized. Measurements were taken with the same plants used to determine the gas exchange parameters. The measurement conditions are described in Simón-Grao et al. [26]. The CL-01 portable measurement device (SPAD units, Hansatech) was utilized to measure the chlorophyll concentration, expressed as SPAD units.

2.4.3. Growth Parameters

Height was recorded after measuring the chlorophyll fluorescence and gas exchange parameters before the final harvest, and the diameter of the plants was measured at three different heights. In the final sampling, the shoots (leaves and stem) were weighed with a Sartorius precision scale (Acculab). Afterwards, four leaflets were taken, weighted, and washed with deionized water. They were then dried in an oven at 60 °C for at least 48 h. This material was used to determine the concentration of mineral nutrients. Leaflets were also collected, frozen with liquid nitrogen, and stored at −80 °C for posterior metabolic analysis. Leaflet samples for the ionomic and metabolomic study were chosen randomly at a middle height of the plant, ensuring that these were fully developed.

2.4.4. Measuring the Concentration of Mineral Nutrients in Leaf Tissues

The concentrations of Na, K, Mg, Ca, P, S, Fe, Cu, Mn, Zn, and B were determined from oven-dried leaf samples. These were ground to a fine powder and digested with HNO3:H2O2 (5:3 v/v) using a microwave (CERM Mars Xpress, Matthews, NC, USA) with a temperature ramp that reached 200 °C. These were posteriorly analyzed using inductively coupled plasma mass spectrometry (ICP-MS, Iris Intrepid II, Thermo Electron Corporation, Franklin, TN, USA) [23]. Total C and N were analyzed with a Thermo Finnigan C/N elemental analyzer (Milan, Italy).

2.4.5. Metabolomic Analysis of Leaf Tissues

A “non-directed” metabolomic analysis was performed with leaflet samples frozen in liquid nitrogen. These samples were lyophilized and ground to obtain a fine powder. The extraction protocol utilized to prepare the samples for nuclear magnetic resonance (NMR) was the same as that utilized by Van der Sar et al. [27], and the equipment utilized for the analysis was a 500 MHz Bruker spectrometer (Bruker Biospin, Rheinstetten, Germany) with a 5 mm broadband Prodigy BBO N2 cryoprobe.
The NMR equipment provided a frequency graph of the detected signals. The resulting spectra were sent to the Chenomx NMR suite version 8.3 processor (Chenomx, Edmonton, Alberta, Canada) to quantify the metabolites, where the samples were standardized with Trimethylsilylpropionic acid sodium salt (TSP) internal standard, and the pH was maintained at around 6. This processor contains a large database that is used to detect metabolites found at concentrations greater than parts-per-million. Among the metabolites found and/or quantified, the following are underlined: aspartate, glutamate, alanine, glutamine, isoleucine, valine, tyrosine, proline, phenylalanine, citrate, formate, fumarate, malate, fructose, glucose, sucrose, 4-Aminobutyrate (GABA), and trigonelline [28,29].

2.5. Statistical Analysis

This study utilized a single-factor experimental design, in which the application of different AA treatments was studied. Statistical analysis consisted of one-way analysis of variance (ANOVA) (treatments) performed with the statistical package SPSS version 24. The values presented for each treatment were from a total of four biological units (n = 4). When ANOVA was significant (p < 0.05), Duncan’s multiple range test was utilized to separate the means. Pearson’s correlation coefficient was utilized with the same statistical package, which determined the linear relationship between the diverse variables. Student’s t test was utilized to verify the existence of significant differences detected between the metabolites and the control. For this, the data were transformed through the square root of the value divided by 100. Likewise, a principal component analysis (PCA) and a cluster analysis (CA) were performed.

3. Results

3.1. Vegetative Growth Parameters

The vegetative growth parameters that were significantly affected by the treatments were the stem diameter and the dry weight of the shoot (Sh; Table 1). The control plants obtained values of 13 g plant−1 and 11 mm plant−1 for the shoot biomass and diameter of the stem, respectively. Exogenous foliar application of Tyr, Lys, Met, and Tyr + Lys + Met showed shoot (Sh) dry weight (dw) values greater than those of the control plants (between 19 and 21 g dry weight (dw)). Control plants had a greater stem diameter, although significant differences were only found for the Tyr and Tyr + Lys + Met treatments. As for the height, significant differences between the different treatments were not found (Table 1).

3.2. Physiological Study

For the gas exchange parameter, significant differences were observed between the treatments. The control plants obtained values of ACO2 = 16.8 μmol m−2 s−1, gs = 1196.3 mmol m−2 s−1, and WUE = 2.38 μmol CO2 mmol−1 H2O (Table 2). These values increased for ACO2 and WUE and decreased for gs with the AA treatments. Individual AA treatments increased ACO2 up to 23% as compared to the control, while the Tyr + Lys + Met treatment increased ACO2 up to 16% without significant difference from the control. As for the gs parameter, the control plants obtained the highest values as compared to plants treated with the AAs. Among the latter, the plants treated with Tyr obtained the lowest values, followed by Met, Lys, and Tyr + Lys + Met. As for WUE, the lowest values were found in the control treatment, followed by Lys, Met, and Tyr + Lys + Met, and Tyr obtained the lowest values among AA-treated plants.
As for chlorophyll fluorescence, ANOVA did not reveal significant differences between the different treatments (Table 2). The chlorophyll content measurements were significantly different in the fully developed leaves (DL) and the buds (LB). In this case, the control plants had chlorophyll values of 24.8 and 20.1 SPAD units for DL and LB, respectively (Table 2). The plants treated with Met had the highest chlorophyll (Chl) DL values, with 30.8 SPAD units (although only significant with the Tyr + Lys + Met treatment). On the other hand, plants treated with Lys had the highest LB values as compared with the other treatments (although this was only significant with the control and Tyr + Lys + Met treatments).

3.3. Ionomic Study

The nutritional states of the plants one week after foliar application of the AAs were significantly different between the Ca, K, Mg, Na, P, B, Cu, Fe, and Mn treatments (Table 3). The control plants had the highest foliar concentrations, reaching values of 4.22, 4.25, 1.03, 0.34, and 0.46 g 100 g−1 dw for Ca, K, Mg, Na, and P, respectively. AA treatments, independently of their nature, produced significant decreases in the foliar concentration, although a significant difference between AA treatments was found only for Na. Thus, the plants treated with Met and Lys obtained values that were lower than those treated with Tyr + Lys + Met.
As for the micronutrients analyzed, the control plants obtained values of 49.1, 9.1, 172.6, 78.3, and 28.0 ppm for B, Cu, Mn, and Zn, respectively. As for B and Cu, the same was found for the micronutrients, in that the greatest concentration was found for plants not treated with AAs. In the case of Fe concentration, the greatest was found in the plants treated with Lys (210.8 g 100 g−1 dw), while for the remaining treatments, the concentration ranged between 145 and 158 ppm (Table 3). Zn was the only microelement that was not significantly different between treatments.

3.4. Metabolomic Study

3.4.1. Amino Acids

Nuclear Magnetic Resonance (NMR) was utilized to detect the following AAs: glutamate, proline, glutamine, aspartate, alanine, phenylalanine, valine, tyrosine, and isoleucine. These amino acids can be divided into two groups according to their concentration. The first is composed of glutamate, proline, glutamine, and aspartate, whose concentrations were higher than 2 mg g−1 dw, with glutamate having the highest concentration of 7.7 mg g−1 dw. These amino acids represented 81% of the total; of this, 37% was glutamate, 25% proline, and 19% glutamine (Table 4, Figure S1). The second group was composed of alanine, phenylalanine, valine, tyrosine, and isoleucine, with concentrations lower than 1 mg g−1 dw.
Foliar application of AAs changed the plant profile in the leaves with respect to those not treated with AAs. Applications of Tyr, Lys, Met, and their combination increased the concentration of proline from 5 to 9.18 mg g−1 dw, with no differences observed between AA treatments. The concentration of glutamine decreased with the application of the four AA treatments with respect to the control treatment. This decrease was similar to the individual treatments with Tyr, Lys, and Met, and was lower than for the application of the Tyr + Lys + Met combination. The concentration of aspartate only increased with applications of Tyr and the Tyr + Lys + Met mix, and the concentration of isoleucine increased with the application of all four AA treatments.

3.4.2. Organic Acids

The organic acids identified and quantified with H-NMR in the tomato plant leaves were malate, citrate, fumarate, and formate (Figure 1), whose concentrations decreased from malate (39.2 mg g−1 dw) to formate (0.07 mg g−1 dw), so that the concentrations of malate and citrate represented 79% and 21%, respectively, of the total organic acids quantified (Figure S2).
AA treatments changed the concentrations of organic acids in the leaves with respect to the control treatment. All AA treatments increased the concentration of malate significantly as compared to the control, with the Tyr + Lys + Met treatment reaching the highest value of 57.2 mg g−1 dw. No significant differences were found between the control plants and those treated with lysine. As for citrate and fumarate, all AA-treated plants, independently from single AAs or their mixture, showed lower values as compared to the control. Significant differences were also observed between the AA treatments. Thus, the plants treated with the Tyr + Lys + Met mixture had the lowest concentration of citrate as compared to the rest of the treatments, and the plants treated with Lys had the greatest concentration of fumarate (Figure 1). An increase in formate concentration was observed in the following order: Tyr < Lys = Met < Tyr + Lys + Met. However, despite the changes in plants after application of the diverse treatments, all AA concentrations relatively followed the same distribution pattern with respect to the control plants (Figure S2).

3.4.3. Sugars

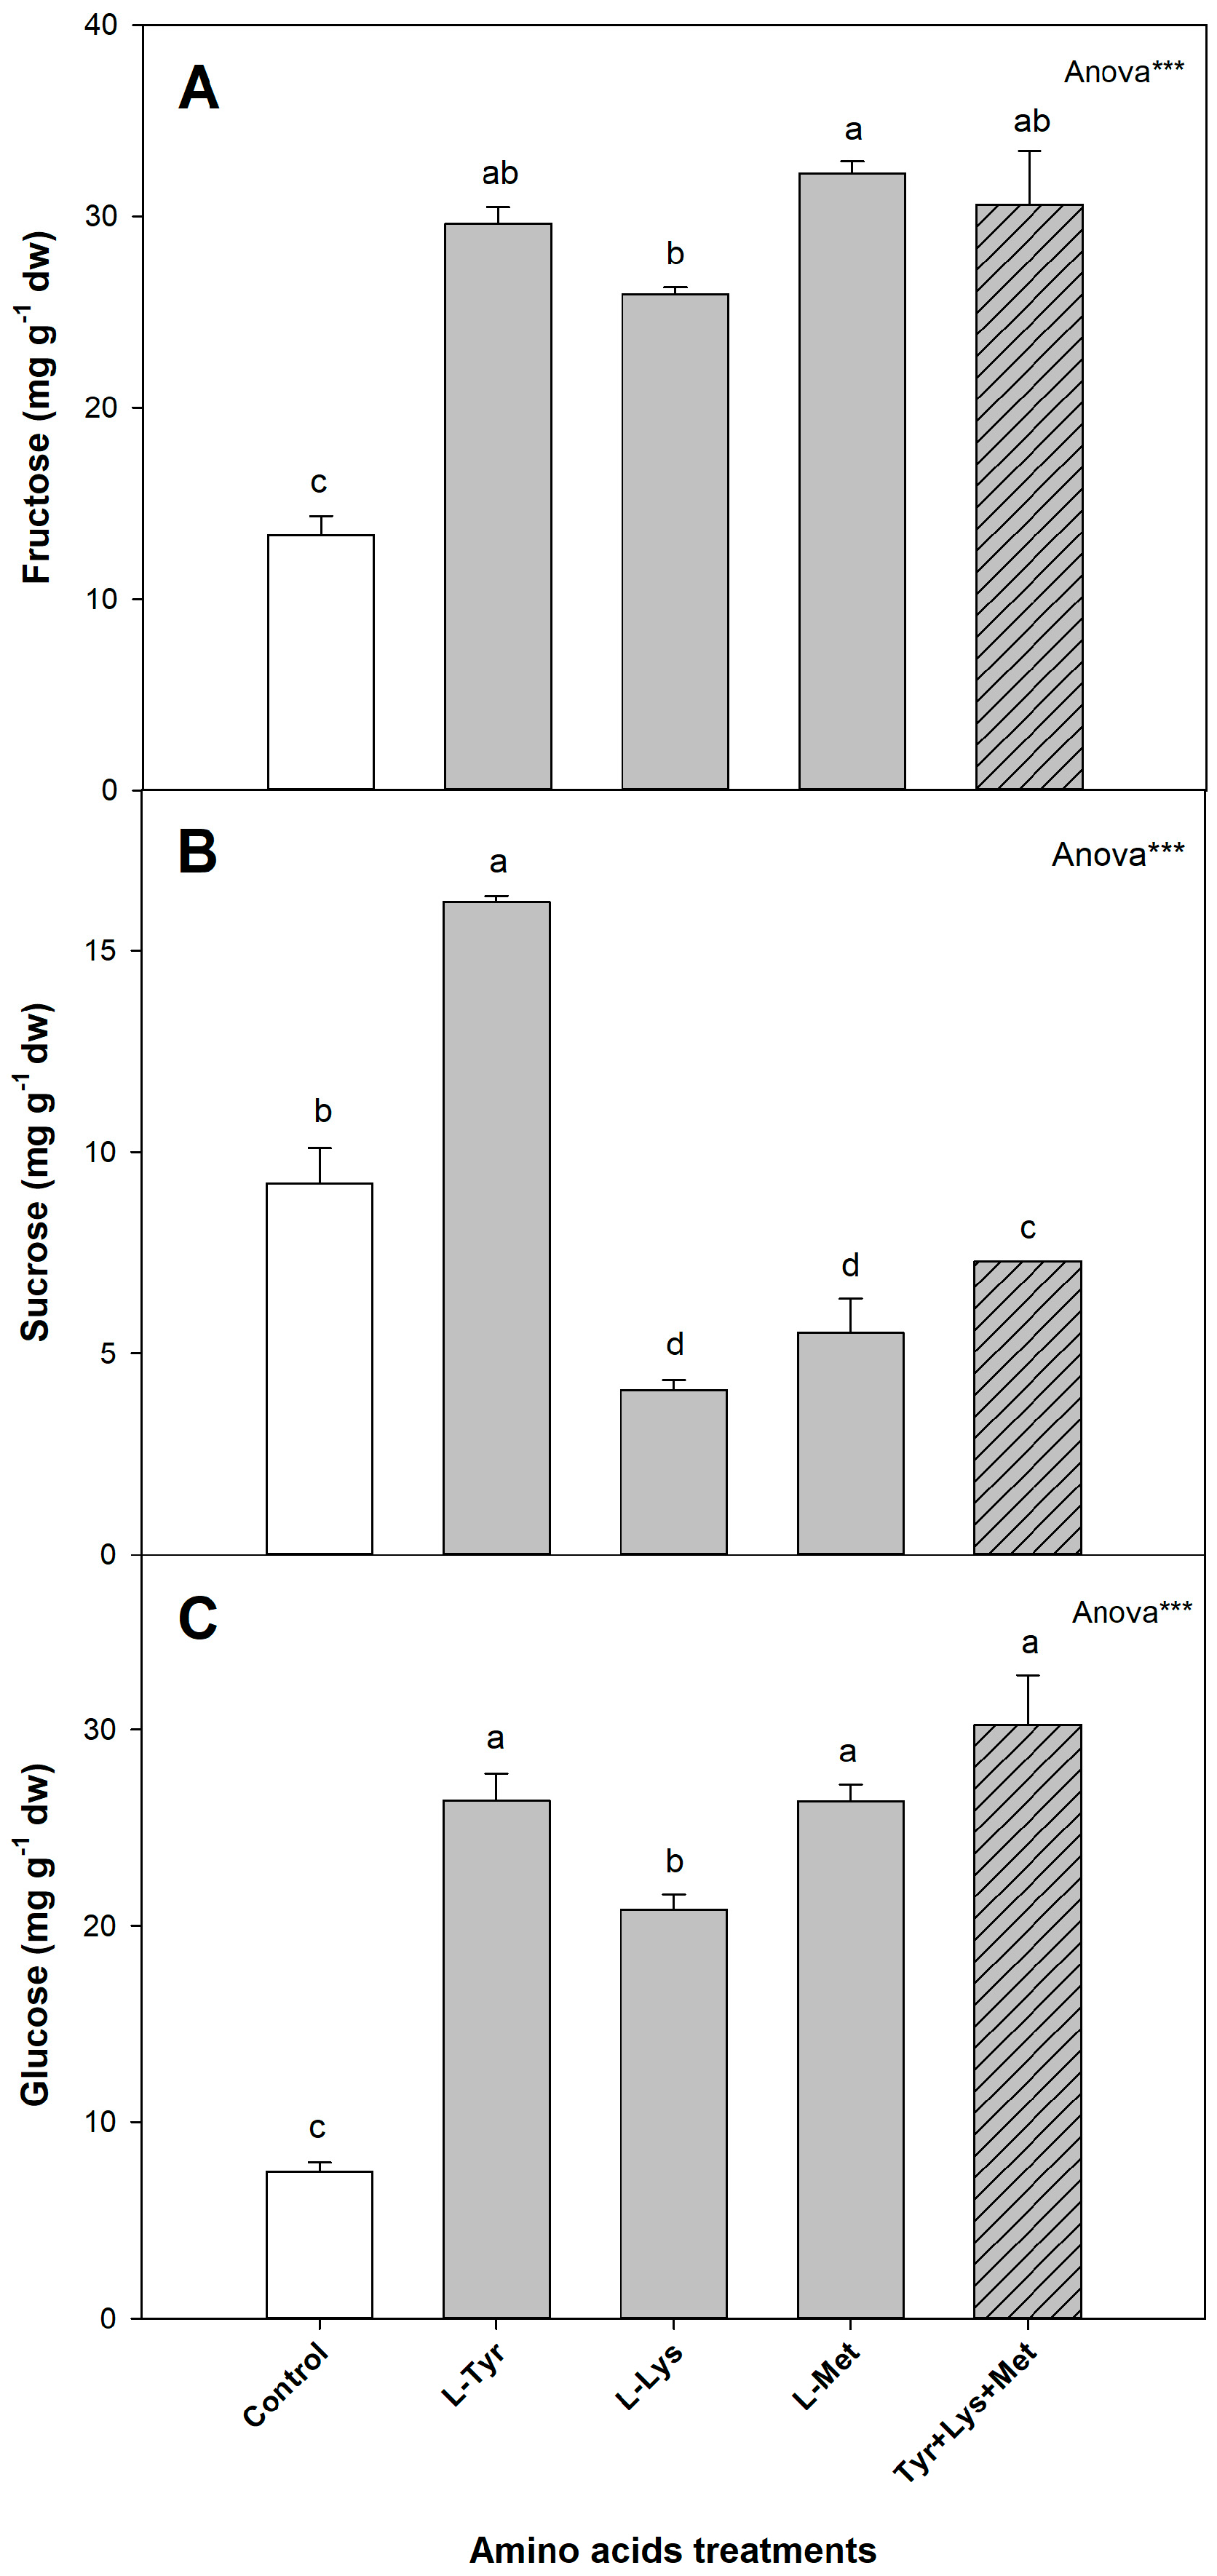
NMR analysis identified and quantified the sugars fructose, glucose, and sucrose, with the highest being fructose (44%), followed by sucrose (31%) and glucose (25%) (Figure 2 and Figure S3). The application of AA treatments affected the concentrations of these sugars.
For fructose, the AA treatments increased the concentration significantly with respect to the control. Among the AA treatments, the greatest value was found for Met and the lowest for Lys. For sucrose, two different responses were observed: an increase with the application of Tyr, reaching a value of 16.2 mg g−1 dw, and a decrease with the application of Lys, Met, and the AA mixture, with the lowest concentration obtained for Lys (4.1 mg g−1 dw). The concentration of glucose increased significantly in all AA treatments with respect to the control treatment. Between the AA treatments, the lowest value was found for Lys.

3.4.4. Other Metabolites

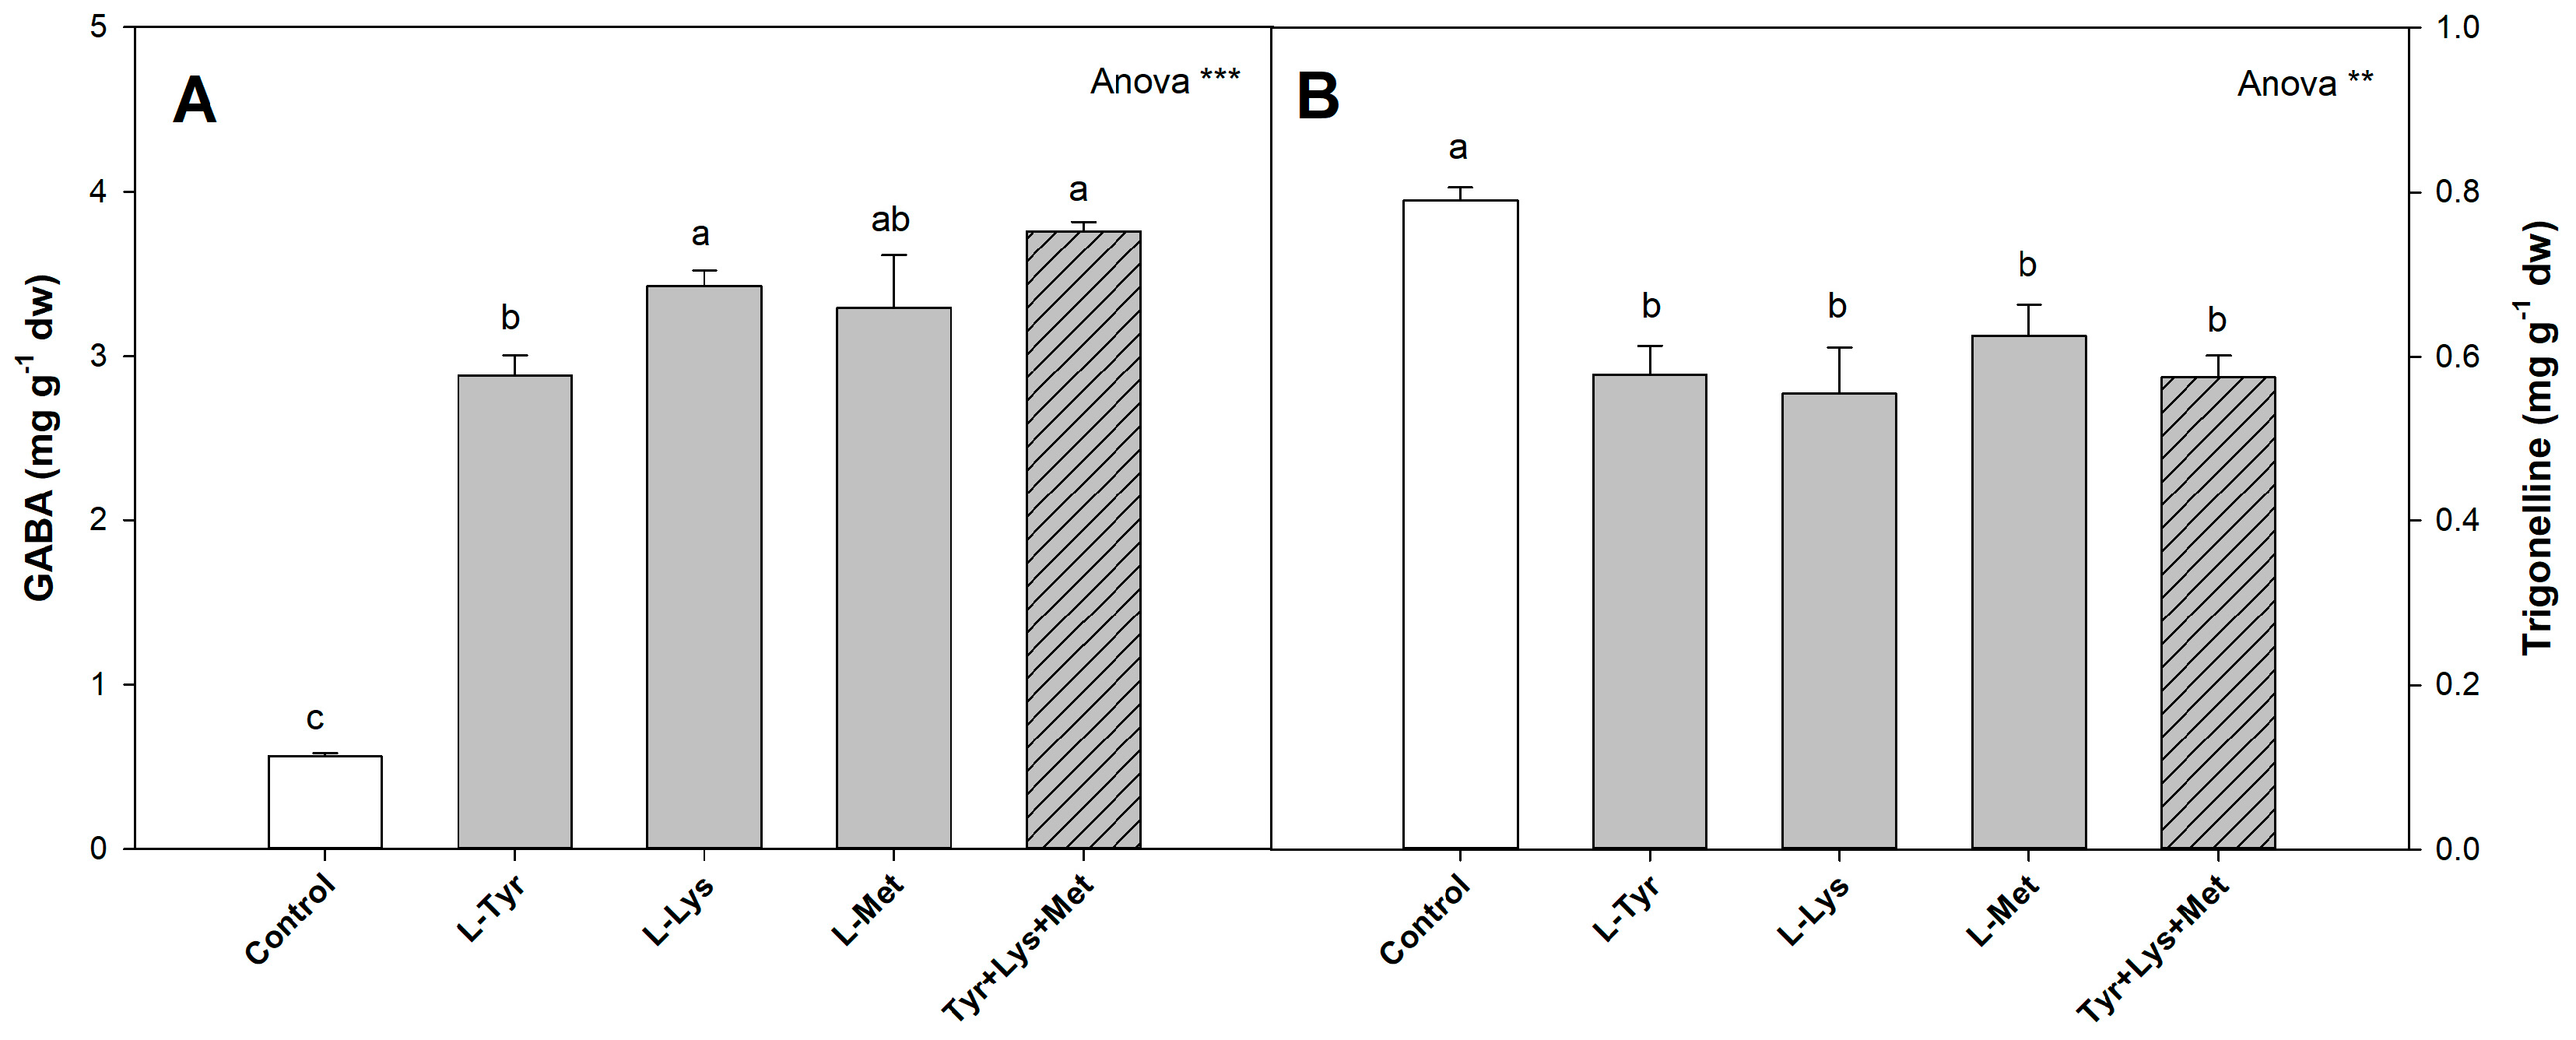
Other metabolites were also quantified, such as 4-Aminobutyrate (GABA) and trigonelline (Figure 3); in control conditions (without AAs), their concentrations were 0.56 and 0.79 mg g−1 dw, respectively. Both compounds showed significant differences in treatment application. The concentration of GABA increased with the application of AAs as compared to the control, with the Tyr + Lys + Met treatment greatly increasing its concentration (3.8 mg g−1 dw). Trigolline, on the other hand, suffered a decrease when the AAs were applied to the plants. This decrease was similar for the four AA treatments, with a range of values between 0.55 and 0.62 mg g−1 dw.

3.5. Principal Component Analysis (PCA) and Cluster Analysis

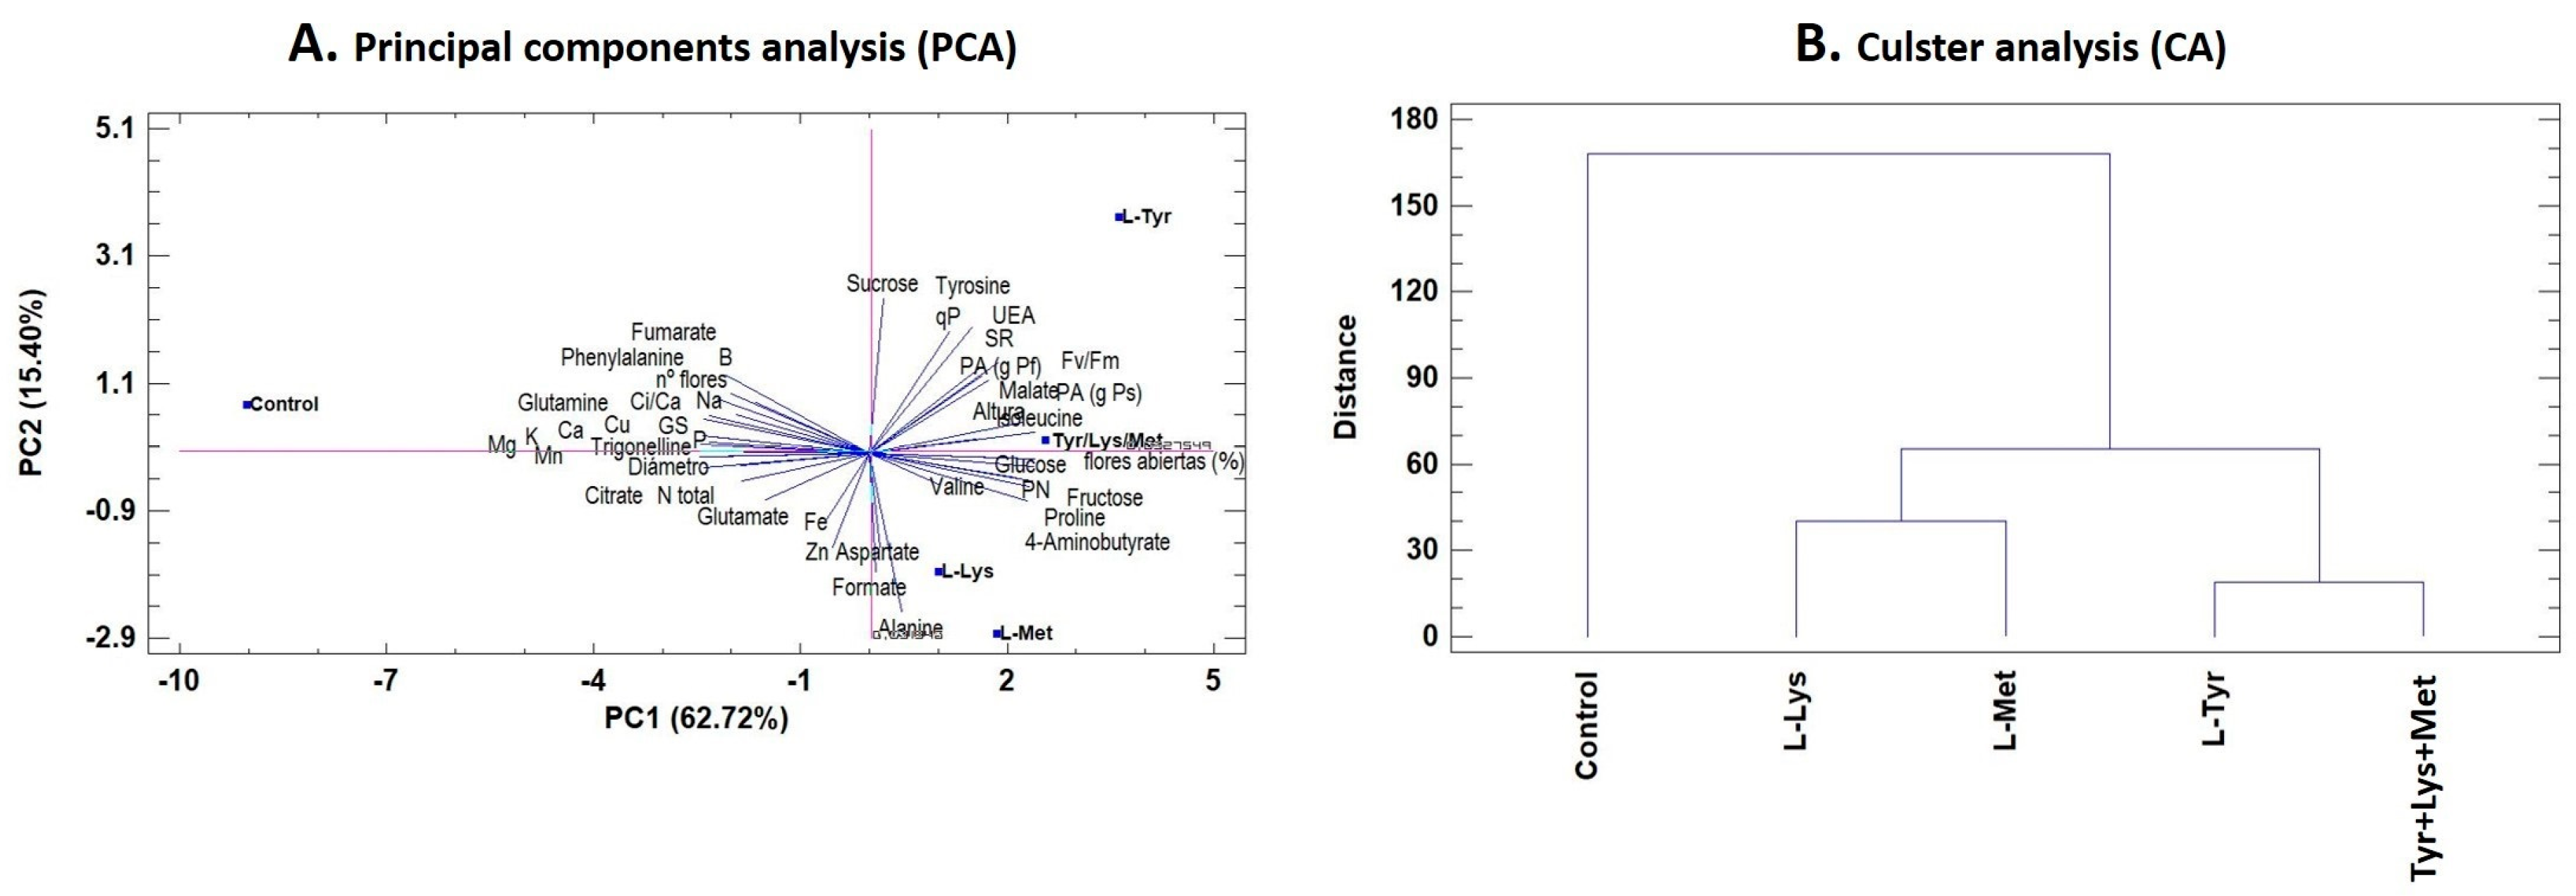
Figure 4 shows the results of the principal component analysis and the cluster analysis. The three main components explained 90.49% of variance, represented as PC1, PC2, and PC3. It was noted that PC1 (62.72%) explained the Sh (g dw), number of flowers, open flowers (%), gs, Ci/Ca, Ca, K, Mg, Na, P, Cu, Mn, isoleucine, proline, citrate, malate, fructose, glucose, 4-Aminobutyrate, and trigonelline. The cluster analysis showed two completely different groups: one composed of the control group and the other of the AA treatments. In the latter, two distinct groups could be distinguished: one composed of Met and Lys and another one composed of Tyr and Tyr + Lys +Met.

4. Discussion

The application of amino acids is an agricultural practice that is becoming more widespread, as it supports sustainable agriculture thanks to the role that amino acids play in the physiological, metabolic, and biochemical processes of plants (e.g., water relations, photosynthesis, antioxidant capacity, nutrient absorption, and stress signaling, to name a few), which have an effect on the plant’s vegetative and reproductive development as well as the quality of the crops [12]. Thus, amino acids are some of the most utilized components when formulating biostimulants. These can be added as free amino acids or through sources of botanical or animal origin that contain a great number and concentration of amino acids [11]. However, to achieve greater efficiency in the use of biostimulant products, it is important to first understand the effects that individual AAs have on the physiological, biochemical, and metabolic processes for each crop of interest, and also to determine the possible antagonistic, synergistic, or neutral effects when these are applied as mixtures.
In our assays, exogenous application of amino acids, either individually (Tyr, Lys, and Met) or as a mixture (Tyr + Lys + Met), significantly increased the growth rate of tomato plants as compared to the control plants. Therefore, foliar application of these AAs has beneficial effects on tomato plants (Table 1). In other studies, it was also observed that application of these AAs had positive effects on the crops. In a study conducted by El-Sherbeny and da Silva [30] in beet plants, foliar application of tyrosine at a concentration of 0.55 mM increased the vegetative growth of the plants. Additionally, an assay performed with lettuce plants grown in a hydroponic system to which methionine was applied through the roots showed that this application notably improved the performance of the crop [11]. Likewise, in an experiment with tomato plants grown in a hydroponic system and under salt stress, Met treatment mitigated the negative effects of salinity [23]. Lastly, these positive effects of Met application were also previously verified in caupi pea plants under drought conditions [31], and in bitter melon plants as well [32].
The combined application of Tyr + Lys + Met did not alter the plant response with respect to individual AA application. Therefore, the combination of these three AAs had a neutral effect, as it did not improve or worsen the outcome. However, synergistic or antagonistic interactions between the AAs have been observed in other studies. For example, in a study conducted with tomato plants grown under saline treatments, an antagonistic effect was observed when methionine and arginine were applied together, as the combined application of these two amino acids had negative effects on the plants. In the same study, a synergistic effect was found for the simultaneous application of proline and glutamic acid, as the response of the plants was better than when these AAs were applied separately [23]. However, in a study conducted with lettuce plants, where glycine and glutamine were applied individually or combined, no important differences were found in the results [33]. In a treatment with soy seeds, a synergistic effect with the AAs cysteine, phenylalanine, glycine, and glutamate was observed when these were applied as a mixture [12].
Individual application of Tyr, Lys, and Met stimulated physiological processes of plants, as observed in the gas exchange data (Table 2), in which ACO2 increased by 30% with respect to the control plants. AA application also downregulated stomatal conductance and leaf transpiration (data not shown). The ratio between ACO2 and leaf transpiration (a ratio known as water use efficiency, WUE) increased with the application of AA treatments with respect to the control plants, and this parameter was higher in plants from the Tyrosine treatment. High WUE values are beneficial to crops, as they indicate that for the same quantity of water transpired, they are able to produce a greater biomass, allowing the plants to regulate and save water in a sustainable manner during their development cycle. Thus, with these data, it can be concluded that the applications of Tyr, Lys, and Met induced an increase in WUE in plants by regulating non-stomatal factors (even when the concentration of substomatal CO2 decreased and ACO2 increased) and stomatal factors (regulation of stomata opening and closing).
In photosynthesis, there are various non-stomatal factors, such as the photochemical efficiency of photosystem II, the carboxylation efficiency, the activity of photosynthetic enzymes, and the chlorophyll concentration [34,35]. The results of chlorophyll fluorescence in our assays allowed us to conclude that application of these AAs induced an increase in ACO2 through the biochemical reactions of C metabolism and not through the light-dependent processes of photosynthesis, as changes were not observed in the qP, Fv’/Fm’, and ΦPSII parameters (Figure 5). However, these AAs increased the concentration of chlorophylls, which could be the reason why ACO2 increased. Some evidence of ACO2 and gs regulation has already been published by Kong et al. [36], but the possible mechanisms involved in these effects are still unknown. Bakry et al. [37] observed that exogenous application of Tyr in concentrations of 0.27, 0.55, and 0.83 mM improved growth by increasing the photosynthetic pigments of the plants. Likewise, in an assay with lettuce plants to which Met was applied through the roots in a hydroponic system, better results were obtained with the lowest doses (0.0013 and 1.3·10−7 mM), highlighting that these doses improved the photosynthetic activity and also showed an increase in performance. It was also demonstrated that higher doses damaged the photosynthesis machinery [11]. On the other hand, in an experiment conducted with bean plants irrigated with seawater, to which a commercial product based on amino acids was applied at different concentrations, a relationship between the AAs and photosynthetic production was established [38]. However, foliar application of two commercial products, ‘Kadoustim’® and ‘Humi Fort’®, composed of AAs, did not show an increase in photosynthetic parameters [39]. In conclusion, these studies confirm that the response mechanisms involved are still unknown, and this could be due to the great variability existing between amino acids, doses, crops to which these are applied, timing, and manner of application.
In the ionomic study, all the plants, independently of the treatment, had leaf nutrient concentrations within normal ranges for tomato crops (Table 3; [40]). However, this concentration was lower (Ca, K, Mg, and P) in the plants treated with AAs. This result indicates that the AA treatments inhibited absorption of the nutrients; however, this result may be related with a dilution affect that may occur when shoot mass increases by 46%. The decrease in concentration of minerals, without being affected by the growth parameters or ACO2, could also indicate that application of these AAs increases the nutrient efficiency, meaning that for a given lower concentration of nutrients in the leaves, these plants are able to increase their growth and stimulate their physiological processes, as compared to plants not treated with AAs. A different model from the one stated previously was only observed for N and Fe. In the case of N, this could be due to the extra supply of N given to the plants treated with the AAs. The relationship between the AAs and N assimilation is more related to the general levels found in the cell than to the accumulation of a specific AA [41]. On the other hand, more recent studies have shown that Ca is an essential element for plants, and it also plays an important role in N assimilation. Lastly, an appropriate supply of Ca can considerably increase nitrate transport and also increase the concentration of amino acids in leaves and roots [42].
Our metabolic study showed that application of AAs, independent of treatment, changed the aminogram of the leaves: the concentration of proline increased and that of glutamine decreased. This indicates that for our plants treated with exogenous AAs, proline was the main amino acid, and glutamine increased its concentration near aspartate values (Table 4, Figure S1). Proline is an amino acid that plays multiple roles in plants, including osmotic adjustment, stabilization of membranes and proteins, reserving carbon and nitrogen, inhibition of reactive oxygen species (ROS), etc. [43,44]. The increase in this AA due to exogenous applications of Tyr, Lys, and Met led to a better response of the plants to environmental conditions. Although the plants were not subjected to abiotic stress during the experiment, the temperatures commonly reached inside a greenhouse located in the Mediterranean region, especially at midday, could affect their development, so that an increase in endogenous proline could have palliated the negative effects caused by environmental factors. Along the same line, we found an increase in isoleucine in all AA treatments and an increase in tyrosine in the treatments with Tyr and Tyr + Lys + Met. Tyrosine and isoleucine have specific functions in crops. It is known that branched amino acids such as isoleucine play a fundamental role in a plant’s tolerance to stresses, and this could be due to the adjustment of intracellular pH, accumulation of osmolytes, and the detoxification of reactive oxygen species (ROS), xenobiotics, and heavy metals. This AA could also be an alternative source of C under stress, given that branched amino acids promote their own degradation during specific times, such as seed germination and senescence, or at times when sugars are lacking [45]. This is also corroborated by Li et al. [46], attesting that accumulation of isoleucine could palliate the negative effects of salinity by improving glycolysis. Among the many functions of Tyr, pollinator attraction, defense, and a greater structural support are attributed to the greater assimilation of lignin [19]. This amino acid is synthesized in the shikimate route, more specifically starting with chorismate. This route is a starting point for the biosynthesis of carbocyclic aromatic compounds, and it is also a precursor for other AAs, such as phenylalanine and tryptophan. In addition, chorismate is involved in the synthesis of vitamins K and E, folate, plastoquinones, and co-enzyme Q [21].
NMR analysis identified the compounds malate, citrate, fumarate, and formate as the major organic acids. These compounds participate in the tricarboxylic acid cycle (citrate, fumarate, and malate) and the pentose phosphate pathway (formate). The organic acid profile, according to their concentrations, followed the order malate > citrate > fumarate = formate (Figure S2). This order did not change with the application of different AAs, although the concentration of these compounds was affected by the AA treatments with respect to the control plants. These data indicate that application of AAs modifies the metabolic processes in the plants. A generalized response was observed with the application of Tyr, Lys, Met, and their mixture, based on an increase in the concentration of malate and a decrease in the concentration of citrate and fumarate in all AA treatments. The increase in malate in the Krebs cycle (major acid) could indicate that treatments with AAs induced a greater influx of C to the glycolysis cycle, which could generate greater oxidation power (redox potential) and energy (NADH, FADH2, and ATP) with respect to the plants that were not treated with the AAs [47].
The major sugars in tomato plant leaves are fructose, sucrose, and glucose (Figure 2). In control plants, their concentrations decreased in the following order: fructose > sucrose > glucose. However, when the AAs were applied, the order changed to fructose > glucose > sucrose. Therefore, the AAs could have promoted a greater influx of C into the plant, thereby increasing the concentrations of fructose and glucose, so that the increase in glucose shuttled more C to the glycolysis reactions as compared to the synthesis of sucrose. This would result in the plant having greater redox potential and more C and energy available for its growth [47].
GABA is a non-proteinogenic amino acid that can temporarily store nitrogen, thereby reducing excess accumulation of amines produced during photorespiration and maintaining appropriate pH. The synthesis of GABA is catalyzed by the enzyme glutamate decarboxylase (GAD) and liberates CO2 under drought stress conditions, which promotes correct functioning of the Calvin cycle with closed or semi-closed stomata. Thus, pressure on the photosynthetic electron chain is relieved, the concentration of ROS decreases, and photodamage to leaf tissues is curbed. GABA can act as an osmolyte with no toxic effects in equilibrating the water potential during cellular dehydration, and it works as an antioxidant to stabilize and protect thylakoids and macromolecules [48].

5. Conclusions

In this study, foliar applications of Tyr, Lys, and Met at concentrations of 15 mM had beneficial effects on tomato plants, as an increase in vegetative growth was observed compared to the control plants. This was due to the treatments stimulating ACO2 and increasing the efficient use of nutrients; therefore, despite the reduced concentration of minerals, this did not limit the physiological processes. Another interesting result from the experiments was that treatments with AAs increased the water use efficiency as a result of the increase in ACO2 as well as a reduction in gs. Thus, application of these AAs could be useful for agronomic strategies directed towards saving water and, therefore, will support the practice of sustainable agriculture. Our metabolic study indicated that greater vegetative growth of the plants treated with AAs could be due to (i) increased proline concentration in the plants, which is an AA related to the processes of osmotic adjustment and protection against adverse environmental factors; (ii) the greater increase in ACO2 rate, promoting additional carbon in the shape of fructose and glucose, which are destined towards the processes of glycolysis and the Krebs cycle to obtain a greater reducing power and energy, as well as more C molecules needed for the growth of the plants. To link metabolic profiles with vegetative growth, artificial intelligence will be needed in the future to estimate how plant growth is initiated with these metabolic profiles.

Supplementary Materials

The following are available online at https://www.mdpi.com/2071-1050/12/22/9729/s1, Figure S1: Profile of AA concentration (%) quantified with NMR in leaves of the tomato plant of var. Optima one week after exogenous application of the AA treatments: Control (without AAs), L-Tyrosine (L-Tyr), L-Lysine (L-Lys), L-Methionine (L-Met), and the Tyr + Lys + Met combination. * indicates significant differences (p < 0.05) between the means as established by Student’s t test (n = 4). Figure S2: Profile of organic acid concentrations (%) quantified with NMR in leaves of the tomato plant of var. Optima one week after exogenous application of the AA treatments: Control (without AAs), L-Tyrosine (L-Tyr), L-Lysine (L-Lys), L-Methionine (L-Met), and the Tyr + Lys + Met combination. * indicates significant differences (p < 0.05) between the means as established by Student’s t test (n = 4). Figure S3: Profile of sugar concentration (%) quantified with NMR in leaves of the tomato plant of var. Optima one week after exogenous application of the AA treatments: Control (without AAs), L-Tyrosine (L-Tyr), L-Lysine (L-Lys), L-Methionine (L-Met), and the Tyr + Lys + Met combination. * indicates significant differences (p < 0.05) between the means as established by Student’s t test (n = 4).

Author Contributions

F.G.-S., E.A.Z.-G. and I.S. conceived the idea and designed the experiments; M.A.-S., S.S.-G. and V.L. performed the experiments; M.A.-S., J.M.C.-Z., J.J.M.-N. and W.M.R.-O. contributed to the analysis and discussion of results; M.A.-S. wrote the first draft of the paper, and all authors contributed to improving the paper. All authors assisted in writing and improving the paper. All authors have read and agreed to the published version of the manuscript.

Funding

This research was funded by the State R&D Program Oriented to the Challenges of the Society, Innovation, and Ministerial Science (Spain government), grant number RTC-2016-4568-2.

Conflicts of Interest

The authors declare no conflict of interest.

Abbreviations

The following abbreviations are used in this manuscript:
AAsamino acids
ACO2net assimilation of CO2
CAcluster analysis
Chl HDchlorophyll in completely developed leaves
Chl HBchlorophyll in leaf buds
Fv’/Fm’antenna efficiency of photosystem II
ΦPSIIquantum efficiency of photosystem II
gsstomatal conductance
Lyslysine
Metmethionine
PCAprincipal component analysis
NMRNuclear Magnetic Resonance
Tyrtyrosine
WUEwater use efficiency

References

  1. Tonhati, R.; Mello, S.C.; Momesso, P.; Pedroso, R.M. L-proline alleviates heat stress of tomato plants grown under protected environment. Sci. Hortic. 2020, 268, 109370. [Google Scholar] [CrossRef]
  2. Chavan, R.F.; Sakhal, B.K. Studies on the effect of exogenous application of salicylic acid on post-harvest quality and shelf life of tomato fruit Cv. Abhinav. Food Res. 2020, 4, 1444–1450. [Google Scholar] [CrossRef]
  3. Food and Agriculture Organization (FAO). Datos Sobre Alimentación en Agricultura (FAOSTAT). Available online: http://www.fao.org/faostat/en/#home (accessed on 14 September 2020).
  4. Parry, M.L. Climate Change and World Agriculture, 1st ed.; Routledge: London, UK, 2019. [Google Scholar]
  5. Mutale-Joan, C.; Redouane, B.; Najib, E.; Yassine, K.; Lyamlouli, K.; Laila, S.; Zeroual, Y.; El Arroussi, H. Screening of microalgae liquid extracts for their bio stimulant properties on plant growth, nutrient uptake and metabolite profile of Solanum lycopersicum L. Sci. Rep. 2020, 10, 1. [Google Scholar] [CrossRef] [Green Version]
  6. Foley, J.A.; Ramankutty, N.; Brauman, K.A.; Cassidy, E.S.; Gerber, J.S.; Jonhnston, M.; Mueller, N.D.; O’Connell, C.; Ray, D.K.; West, P.C.; et al. Solutions for a cultivated planet. Nature 2011, 478, 337–342. [Google Scholar] [CrossRef] [Green Version]
  7. Lucini, L.; Rouphael, Y.; Cardarelli, M.; Canaguier, R.; Kumar, P.; Colla, G. The effect of a plant-derived biostimulant on metabolic profiling andcrop performance of lettuce grown under saline conditions. Sci. Hortic. 2015, 182, 124–133. [Google Scholar] [CrossRef]
  8. Rouphael, Y.; Colla, G. Editorial: Biostimulants in Agriculture. Front. Plant Sci. 2020, 11, 124–133. [Google Scholar] [CrossRef] [Green Version]
  9. Reglamento (UE) 2019/1009 del Parlamento Europeo y del Consejo de 5 de Junio de 2020. Available online: https://www.boe.es/doue/2019/170/L00001-00114.pdf (accessed on 21 September 2020).
  10. Du Jardin, P. Plant biostimulants: Definition, concept, main categories and regulation. Sci. Hortic. 2015, 196, 3–14. [Google Scholar] [CrossRef] [Green Version]
  11. Khan, S.; Yu, H.; Li, Q.; Gao, Y.; Sallam, B.N.; Wang, H.; Liu, P.; Jiang, W. Exogenous application of amino acids improves the growth and yield of lettuce by enhancing photosynthetic assimilation and nutrient availability. Agronomy 2019, 9, 266. [Google Scholar] [CrossRef] [Green Version]
  12. Teixeira, W.F.; Fagan, E.B.; Soares, L.H.; Umburanas, R.C.; Reichardt, K.; Neto, D.D. Foliar and seed application of amino acids affects the antioxidant metabolism of the soybean crop. Front. Plant Sci. 2017, 8, 327. [Google Scholar] [CrossRef] [Green Version]
  13. Parađiković, N.; Teklić, T.; Zeljković, S.; Lisjak, M.; Špoljarević, M. Biostimulants research in some horticultural plant species—A review. Food Energy Secur. 2019, 8, 2. [Google Scholar] [CrossRef]
  14. Colla, G.; Nardi, S.; Cardarelli, M.; Ertani, A.; Lucini, L.; Canaguier, R.; Rouphael, Y. Protein hydrolysates as biostimulants in horticulture. Sci. Hortic. 2015, 196, 28–38. [Google Scholar] [CrossRef]
  15. Simón-Grao, S.; Garcia-Sanchez, F.; Alfosea-Simón, M.; Simón, I.; Lidón, V.; Ortega, W.M.R. Study on the foliar aplication of fitomare® on drought tolerance of tomato plants. IJPAES 2016, 6, 15–21. [Google Scholar]
  16. Francesca, S.; Arena, C.; Hay Mele, B.; Schettini, C.; Ambrosino, P.; Barone, A.; Rigano, M.M. The use of a plant-based biostimulant improves plant performances and fruit quality in tomato plants grown at elevated temperatures. Agronomy 2020, 10, 363. [Google Scholar] [CrossRef] [Green Version]
  17. Maach, M.; Boudouasar, K.; Akodad, M.; Skalli, A.; Moumen, A.; Baghour, M. Application of biostimulants improves yield and fruit quality in tomato. Int. J. Veg. Sci. 2020, 1–6. [Google Scholar] [CrossRef]
  18. Klokić, I.; Koleška, I.; Hasanagić, D.; Murtić, S.; Bosančić, B.; Todorović, V. Biostimulants’ influence on tomato fruit characteristics at conventional and low-input NPK regime. Acta Agric. Scand. B Plant Soil Sci. 2020, 70, 233–240. [Google Scholar] [CrossRef]
  19. Schenck, C.A.; Maeda, H.A. Tyrosine biosynthesis, metabolism, and catabolism in plants. Phytochemistry 2018, 149, 82–102. [Google Scholar] [CrossRef]
  20. Arruda, P.; Barreto, P. Lysine Catabolism Through the saccharopine pathway: Enzymes and intermediates involved in plant responses to abiotic and biotic stress. Front. Plant Sci. 2020, 11, 587. [Google Scholar] [CrossRef]
  21. D’Mello, J.P.F. Amino Acids in Higher Plants; D’Mello, J.P.F., Ed.; CABI International: Edinburgh, UK, 2015. [Google Scholar]
  22. Amir, R.; Hacham, Y.; Galili, G. Cystathionine γ-synthase and threonine synthase operate in concert to regulate carbon flow towards methionine in plants. Trends Plant Sci. 2002, 7, 153–156. [Google Scholar] [CrossRef]
  23. Alfosea-Simón, M.; Zavala-Gonzalez, E.A.; Camara-Zapata, J.M.; Martínez-Nicolás, J.J.; Simón, I.; Simón-Grao, S.; García-Sánchez, F. Effect of foliar application of amino acids on the salinity tolerance of tomato plants cultivated under hydroponic system. Sci. Hortic. 2020, 272, 109509. [Google Scholar] [CrossRef]
  24. Capaldi, F.R.; Gratão, P.L.; Reis, A.R.; Lima, L.W.; Azevedo, R.A. Sulfur metabolism and stress defense responses in plants. Trop. Plant Biol. 2015, 8, 60–73. [Google Scholar] [CrossRef] [Green Version]
  25. Rai, V.K. Role of amino acids in plant responses to stresses. Biol. Plant. 2002, 45, 481–487. [Google Scholar] [CrossRef]
  26. Simón-Grao, S.; Nieves, M.; Cámara-Zapata, J.M.; Martínez-Nicolás, J.J.; Rivero, R.M.; Fernández-Zapata, J.C.; García-Sánchez, F. The Forner Alcaide n° 5 citrus genotype shows a different physiological response to the excess of boron in the irrigation water in relation to its two genotype progenitors. Sci. Hortic. 2019, 245, 19–28. [Google Scholar] [CrossRef]
  27. Van der Sar, S.; Kim, H.K.; Meissner, A.; Verpoorte, R.; Choi, Y.H. Nuclear Magnetic Resonance spectroscopy for plant metabolite profiling. Handb. Plant Metab. 2013, 57–76. [Google Scholar] [CrossRef]
  28. Duynhoven, J.V.; Van As, H.; Belton, P.S.; Webb, G.A. Magnetic Resonance in Food Science: Food for Thought, 1st ed.; Royal Society of Chemistry: Cambridge, UK, 2013. [Google Scholar]
  29. Becerra-Martínez, E.; Florentino-Ramos, E.; Pérez-Hernández, N.; Zepeda-Vallejo, L.G.; Villa-Ruano, N.; Velázquez-Ponce, M.; García-Mendoza, F.; Bañuelos-Hernández, A.E. 1H NMR-based metabolomic fingerprinting to determine metabolite levels in serrano peppers (Capsicum annum L.) grown in two different regions. Food Res. Int. 2017, 102, 163–170. [Google Scholar] [CrossRef]
  30. El-Sherbeny, M.; da Teixeira Silva, J.A. Foliar treatment with proline and tyrosine affect the growth and yield of beetroot and some pigments in beetroot leaves. J. Hortic. Res. 2013, 21, 95–99. [Google Scholar] [CrossRef] [Green Version]
  31. Merwad, A.R.M.A.; Desoky, E.S.M.; Rady, M.M. Response of water deficit-stressed Vigna unguiculata performances to silicon, proline or methionine foliar application. Sci. Hortic. 2018, 228, 132–144. [Google Scholar] [CrossRef]
  32. Akram, N.A.; Umm, E.H.; Ashraf, M.; Ashraf, M.; Sadiq, M. Exogenous application of L-methionine mitigates the drought-induced oddities in biochemical and anatomical responses of bitter gourd (Momordica charantia L.). Sci. Hortic. 2020, 267, 109333. [Google Scholar] [CrossRef]
  33. Noroozlo, Y.A.; Souri, M.K.; Delshad, M. Stimulation Effects of Foliar Applied glycine and glutamine amino acids on lettuce growth. Open Agric. 2019, 4, 164–172. [Google Scholar] [CrossRef]
  34. Yordanova, R.; Popava, L. Effect of exogenous treatment with salicylic acid or photosynthetic activity and antioxidant capacity of chilled wheat plants. Gen. Appl. Plant Physiol. 2007, 33, 155–170. [Google Scholar]
  35. Nishiyama, Y.; Allakhverdiev, S.I.; Murata, N. Protein synthesis is the primary target of reactive oxygen species in the photoinhibition of photosystem II. Physiol. Plant 2011, 142, 35–46. [Google Scholar] [CrossRef]
  36. Kong, D.; Hu, H.C.; Okuma, E.; Lee, Y.; Lee, H.S.; Munemasa, S.; Cho, D.; Ju, C.; Pedoeim, L.; Rodriguez, B.; et al. L-Met activates arabidopsis GLR Ca2+ channels upstream of ROS production and regulates stomatal movement. Cell Rep. 2016, 17, 2553–2561. [Google Scholar] [CrossRef]
  37. Bakry, B.A.; Sadak, M.S.; Abd El-Monem, A.A. Physiological aspects of tyrosine and salicylic acid on morphological, yield and biochemical constituents of peanut plants. PJBS 2020, 23, 375–384. [Google Scholar]
  38. Sadak, M.S.; Abdelhamid, M.T.; Schmidhalter, U. Effect of foliar application of aminoacids on plant yield and some physiological parameters in bean plants irrigated with seawater. Acta Biol. Colomb. 2015, 20, 141–152. [Google Scholar]
  39. Molaie, H.; Panahi, B.; Tajabadipour, A. The effect of foliar application of some amino acid compounds on photosynthesis and yield of two commercial cultivars in pistachio orchards of Kerman province in Iran. IJACS 2013, 5, 2827–2830. [Google Scholar]
  40. Watanabe, T.; Maejima, E.; Yoshiruma, T.; Urayama, M.; Yamauchi, A.; Owadano, M.; Okada, R.; Osaki, M.; Kanayama, Y.; Shinano, T. The ionomic study of vegetable crops. PLoS ONE 2016, 11, e0160273. [Google Scholar] [CrossRef] [Green Version]
  41. Padgett, P.E.; Leonard, R.T. Free amino acid levels and the regulation of nitrate uptake in maize cell suspension cultures. J. Exp. Bot. 1996, 47, 871–883. [Google Scholar] [CrossRef] [Green Version]
  42. Xing, Y.; Zhu, Z.L.; Wang, F.; Zhang, X.; Li, B.Y.; Liu, Z.X.; Wu, X.X.; Ge, S.F.; Jiang, Y.M. Role of calcium as a possible regulator of growth and nitrate nitrogen metabolism in apple dwarf rootstock seedlings. Sci. Hortic. 2021, 276, 109740. [Google Scholar] [CrossRef]
  43. Dar, M.I.; Naikoo, M.I.; Rehman, F.; Naushin, F.; Khan, F.A. Proline accumulation in plants: Roles in stress tolerance and plant development. In Osmolytes and Plants Acclimation to Changing Environment: Emerging Omics Technologies; Iqbal, N., Nazar, R., Khan, N.A., Eds.; Springer: New Delhi, India, 2016; pp. 155–166. [Google Scholar]
  44. Pervaiz, A.; Iqbal, A.; Khalid, A.; Manzoor, A.; Noreen, S.; Ayaz, A.; Zafar, Z.; Athar, H.; Ashraf, M. Proline induced modulation in physiological responses in wheat plants. J. Agric. Environ. Sci. 2019, 8, 112–119. [Google Scholar] [CrossRef]
  45. Joshi, V.; Joung, J.G.; Fei, Z.; Jander, G. Interdependence of threonine, methionine and isoleucine metabolism in plants: Accumulation and transcriptional regulation under abiotic stress. Amino Acids 2010, 39, 933–947. [Google Scholar] [CrossRef]
  46. Li, M.; Guo, R.; Jiao, Y.; Jin, X.; Zhang, H.; Shi, L. Comparison of salt tolerance in Soja based on metabolomics of seedling roots. Front. Plant Sci. 2017, 8, 1101. [Google Scholar] [CrossRef]
  47. Zhong, M.; Yuan, Y.; Shu, S.; Sun, J.; Guo, S.; Yuan, R.; Tang, Y. Effects of exogenous putrescine on glycolysis and Krebs cycle metabolism in cucumber leaves subjected to salt stress. Plant Growth Regul. 2016, 79, 319–330. [Google Scholar] [CrossRef]
  48. Carillo, P.; Woo, S.L.; Comite, E.; El-nakhel, C.; Rouphael, Y.; Fusco, G.M.; Borzacchiello, A.; Lanzuise, S.; Vinale, F. Application of trichoderma harzianum, 6-pentyl-α-pyrone and plant biopolymer formulations modulate plant metabolism and fruit quality of plum tomatoes. Plants 2020, 9, 771. [Google Scholar] [CrossRef] [PubMed]
Figure 1. Concentration of organic acids (mg g−1 dw): malate (A), citrate (B), fumarate (C), and formate (D), quantified with nuclear magnetic resonance (NMR) in leaves of the tomato plant of var. Optima one week after exogenous application of the AA treatments: Control (without AAs), L-Tyrosine (L-Tyr), L-Lysine (L-Lys), L-Methionine (L-Met), and the Tyr + Lys + Met combination. In the ANOVA, ** and *** indicate significant differences at p < 0.01 and 0.001, respectively. The different lowercase letters indicate significant differences (p < 0.05) between the means, as established by Duncan’s test. The vertical bar indicates the standard error of the mean (n = 4).
Sustainability 12 09729 g001
Figure 2. Concentration of sugars (mg g−1 dw): fructose (A), sucrose (B), and glucose (C), quantified with NMR in leaves of the tomato plant of var. Optima one week after exogenous application of the AA treatments: Control (without AAs), L-Tyrosine (L-Tyr), L-Lysine (L-Lys), L-Methionine (L-Met), and the Tyr + Lys + Met combination. In the ANOVA, *** indicates significant differences at p < 0.001. The different lowercase letters indicate significant differences (p < 0.05) between the means, as established by Duncan’s test. The vertical bar indicates the standard error of the mean (n = 4).
Sustainability 12 09729 g002
Figure 3. Concentrations of 4-Aminobutyrate (GABA) (A) and trigonelline (B) (mg g−1 dw) quantified with NMR in leaves of the tomato plant of var. Optima one week after exogenous application of the AA treatments: Control (without AAs), L-Tyrosine (L-Tyr), L-Lysine (L-Lys), L-Methionine (L-Met), and the Tyr + Lys + Met combination. In the ANOVA, ** and *** indicate significant differences at p < 0.01 and 0.001, respectively. The different lowercase letters indicate significant differences (p < 0.05) between the means, as established by Duncan’s test. The vertical bar indicates the standard error of the mean (n = 4).
Sustainability 12 09729 g003
Figure 4. Principal component analysis (PCA) (A) and Cluster analysis (CA) (B) of leaves of the tomato plant of var. Optima one week after exogenous application of the AA treatments: Control (without AAs), L-Tyrosine (L-Tyr), L-Lysine (L-Lys), L-Methionine (L-Met), and the Tyr + Lys + Met combination.
Sustainability 12 09729 g004
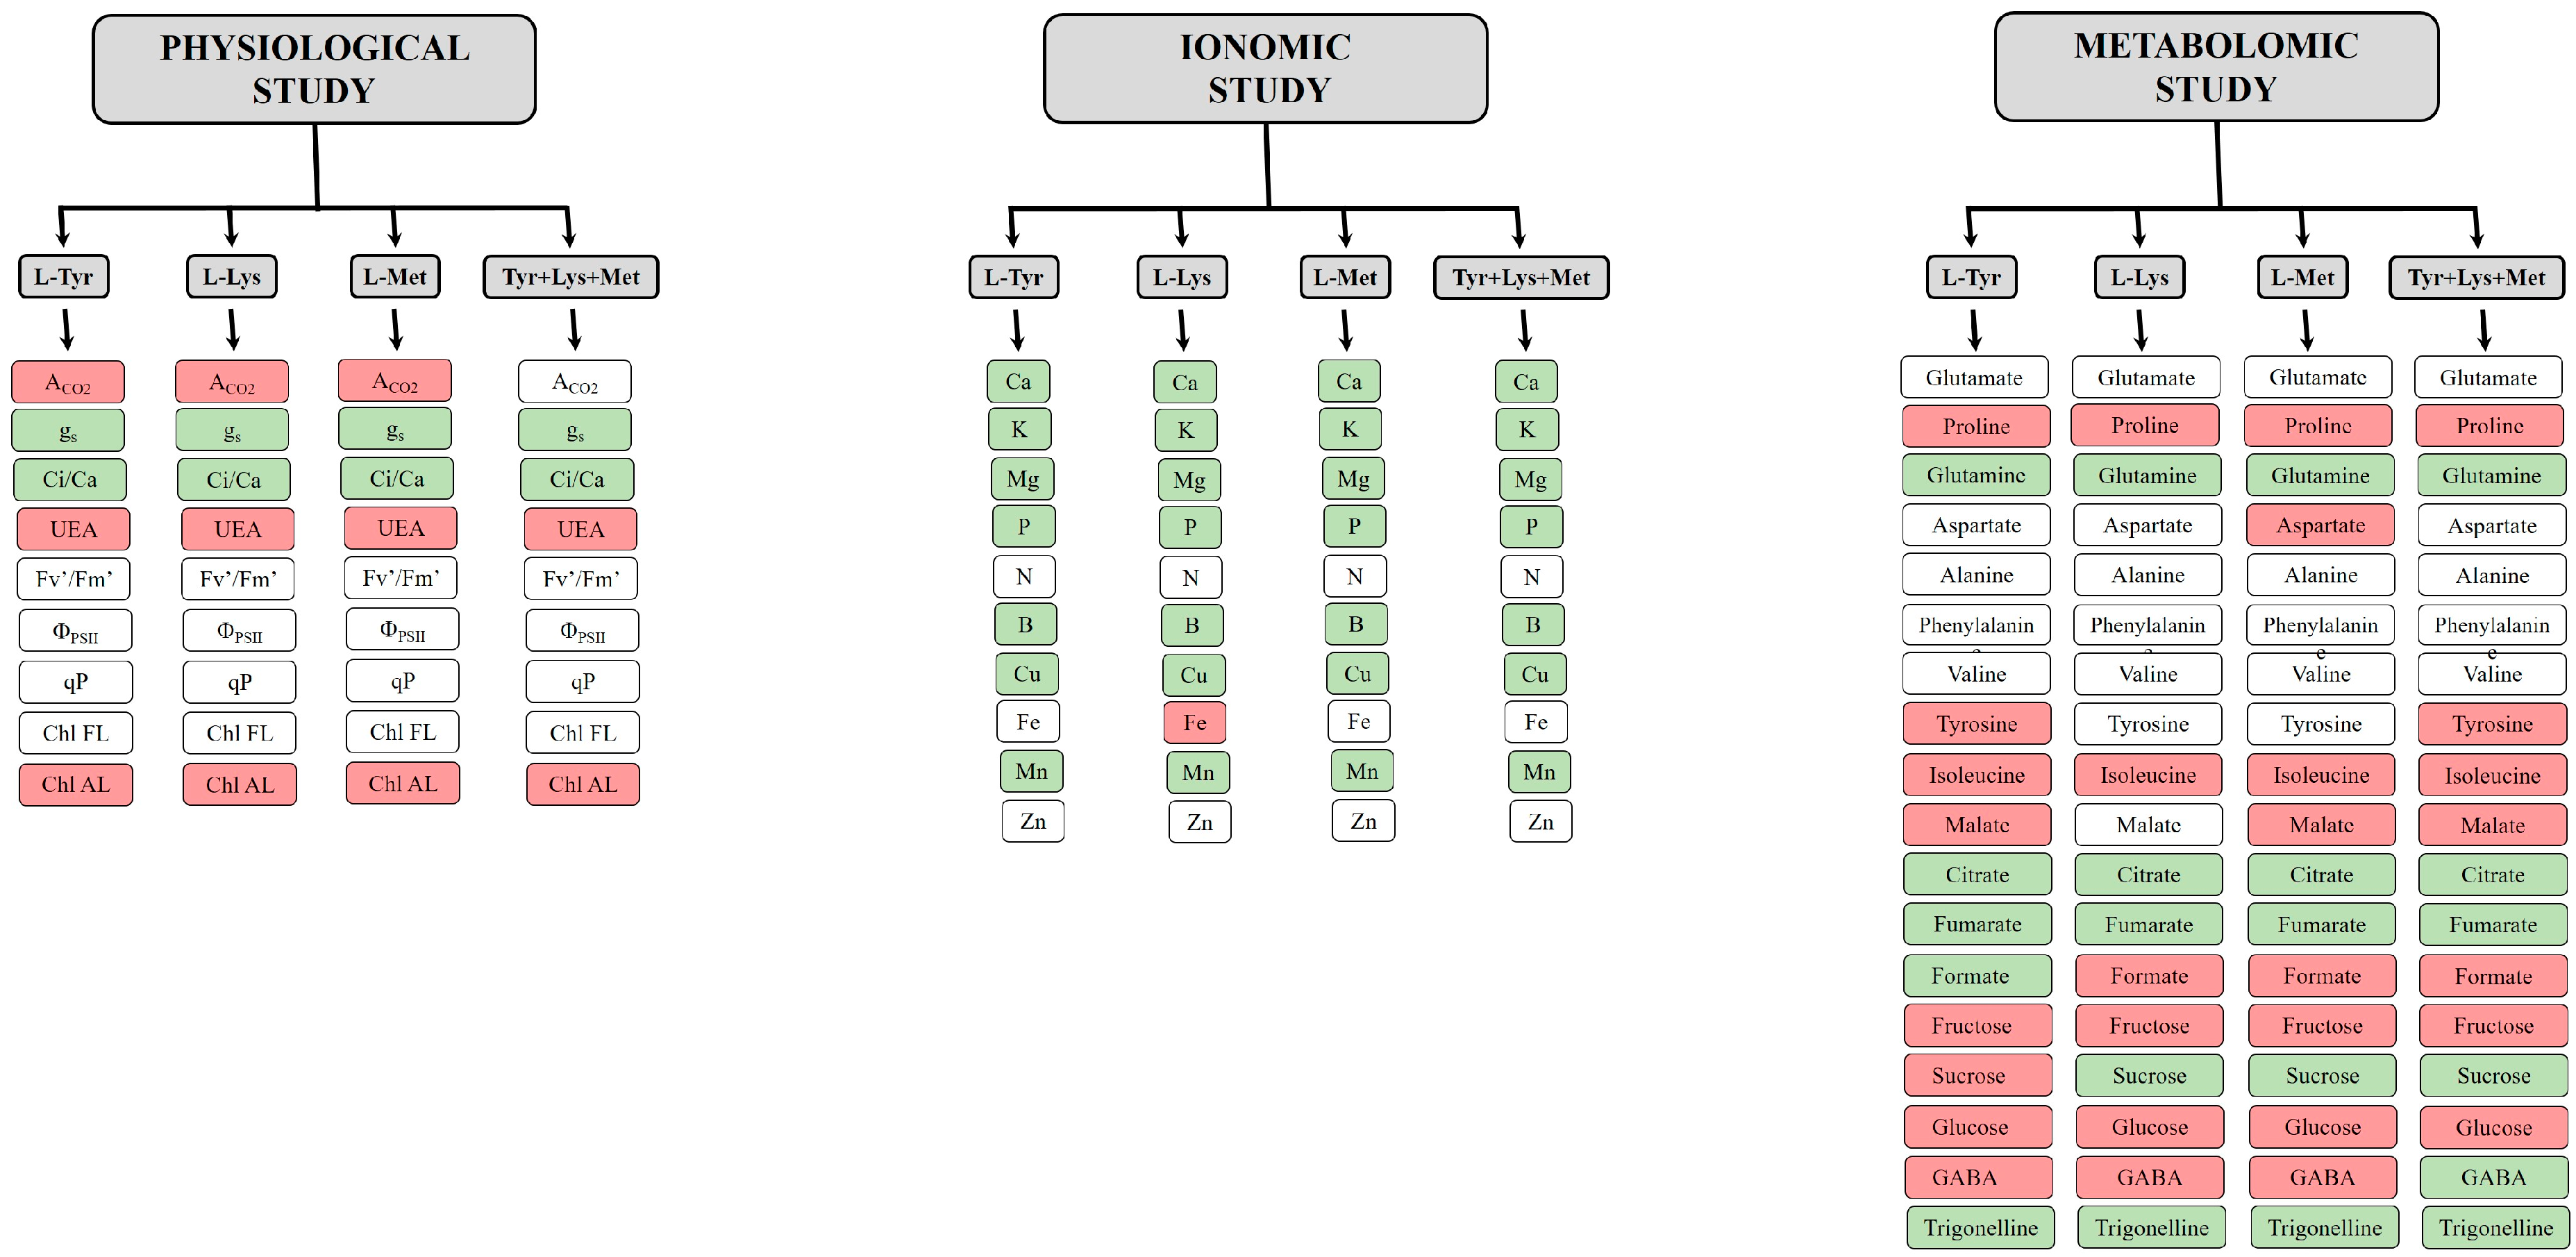
Figure 5. Summary of the relative results with respect to the control obtained after foliar application of the AA treatments: Control (without AAs), L-Tyrosine (L-Tyr), L-Lysine (L-Lys), L-Methionine (L-Met), and the Tyr + Lys + Met combination. The red or green colors indicate a significant increase or decrease, respectively, in metabolite concentration in AA-treated plants as compared to the control treatment. The white color indicates that no significant difference between the control and the corresponding AA treatment was found.
Sustainability 12 09729 g005
Table 1. Shoot (Sh) growth parameters measured in tomato plants of var. Optima one week after exogenous application of the amino acid (AA) treatments: Control (without AAs), L-Tyrosine (L-Tyr), L-Lysine (L-Lys), L-Methionine (L-Met), and the Tyr + Lys + Met combination.
TreatmentsHeight
(cm)
Stem Diameter
(mm)
Sh
(g dw)
Control
(w/o AAs)
39.3 ± 0.510.8 ± 0.1 a13.3 ± 0.4 b
L-Tyr41.0 ± 1.210.0 ± 0.2 b21.2 ± 1.8 a
L-Lys39.0 ± 1.410.1 ± 0.2 ab19.0 ± 0.5 a
L-Met41.5 ± 1.310.2 ± 0.2 ab19.0 ± 0.4 a
Tyr + Lys + Met41.6 ± 2.09.3 ± 0.3 c18.8 ± 0.7 a
ANOVAns*****
In the analysis of variance (ANOVA), ‘ns’ indicates non-significant differences with a confidence interval of 95%; ** and *** indicate significant differences at p < 0.01 and 0.001, respectively. Different lowercase letters indicate significant differences (p < 0.05) between the means, as established by Duncan’s test (n = 4).
Table 2. Gas exchange and chlorophyll fluorescence parameter measurements in the Optima var. tomato plants one week after exogenous application of AA treatments: Control (without AAs), L-Tyrosine (L-Tyr), L-Lysine (L-Lys), L-Methionine (L-Met), and the Tyr + Lys + Met combination. Additionally shown are chlorophyll (Chl) values measured in completely developed leaves (DL) as well as leaf buds (LB).
Gas Exchange Parameters
TreatmentsACO2
(μmol m−2 s−1)
gs
(mmol m−2 s−1)
WUE (μmol CO2
mmol−1 H2O)
Control
(w/o AAs)
16.8 ± 1.5 b1196.3 ± 105.7 a2.38 ± 0.35 c
L-Tyr22.0 ± 1.3 a162.8 ± 18.4 c10.08 ± 0.70 a
L-Lys22.0 ± 1.4 a498.7 ± 51.9 b5.18 ± 0.15 b
L-Met21.6 ± 0.8 a250.4 ± 21.7 c5.79 ± 0.21 b
Tyr + Lys + Met19.6 ± 0.3 ab507.6 ± 46.5 b5.45 ± 0.24 b
ANOVA*******
Chl Fluorescence Parameters
TreatmentsFv’/Fm’ΦPSIIqPChl HD (SPAD)Chl HB
(SPAD)
Control
(w/o AAs)
0.76 ± 0.0110.70 ± 0.0140.93 ± 0.00524.8 ± 2.5 ab20.1 ± 1.8 c
L-Tyr0.80 ± 0.0010.75 ± 0.0030.94 ± 0.00526.4 ± 2.4 ab45.1 ± 2.8 ab
L-Lys0.79 ± 0.0130.74 ± 0.0140.93 ± 0.00330.7 ± 1.7 a46.8 ± 3.6 a
L-Met0.76 ± 0.0300.71 ± 0.0290.92 ± 0.00630.8 ± 2.8 a38.2 ± 3.7 ab
Tyr + Lys + Met0.78 ± 0.0130.73 ± 0.0090.93 ± 0.00820.2 ± 2.0 b36.5 ± 2.2 b
ANOVAnsnsns****
In the ANOVA, ‘ns’ indicates non-significant differences with a confidence interval of 95%; * and *** indicate significant differences at p < 0.05 and 0.001, respectively. Different lowercase letters indicate significant differences (p < 0.05) between the means, as established by Duncan’s test (n = 4).
Table 3. Concentration of macro (g 100 g−1 dw) and micronutrients (ppm) quantified in leaves from the tomato plant of var. Optima one week after exogenous application of AA treatments: Control (without AAs), L-Tyrosine (L-Tyr), L-Lysine (L-Lys), L-Methionine (L-Met), and the Tyr + Lys + Met combination.
Macronutrients (g 100 g−1 dw)
TreatmentsCaKMgNaPN
Control
(sin AAs)
4.22 ± 0.22 a4.25 ± 0.14 a1.03 ± 0.07 a0.34 ± 0.02 a0.46 ± 0.03 a5.04 ± 0.21
L-Tyr2.24 ± 0.07 b3.00 ± 0.13 b0.61 ± 0.04 b0.14 ± 0.01 bc0.28 ± 0.02 b4.63 ± 0.14
L-Lys2.45 ± 0.12 b3.25 ± 0.04 b0.72 ± 0.03 b0.13 ± 0.01 c0.33 ± 0.02 b4.82 ± 0.32
L-Met2.48 ± 0.06 b3.22 ± 0.17 b0.65 ± 0.04 b0.14 ± 0.00 c0.30 ± 0.03 b4.75 ± 0.20
Tyr + Lys + Met2.29 ± 0.16 b3.12 ± 0.16 b0.69 ± 0.05 b0.18 ± 0.01 b0.32 ± 0.02 b4.33 ± 0.07
ANOVA***************ns
Micronutrients (ppm)
TreatmentsBCuFeMnZn
Control
(sin AAs)
49.1 ± 3.7 a9.1 ± 0.4 a172.6 ± 11.7 b78.3 ± 5.3 a28.0 ± 1.0
L-Tyr37.8 ± 1.3 bc5.0 ± 0.2 b144.5 ± 10.9 b56.8 ± 1.9 b26.1 ± 1.1
L-Lys39.6 ± 2.5 b5.0 ± 0.5 b210.8 ± 8.5 a65.4 ± 1.7 b31.4 ± 2.5
L-Met31.6 ± 1.4 c5.3 ± 0.3 b149.7 ± 9.6 b53.5 ± 4.8 b28.4 ± 2.0
Tyr + Lys + Met40.2 ± 1.4 b4.5 ± 0.3 b157.7 ± 8.0 b59.1 ± 3.5 b24.5 ± 1.3
ANOVA**********Ns
In the ANOVA, ‘ns’ indicates non-significant differences with a confidence interval of 95%; ** and *** indicate significant differences at p < 0.01 and 0.001, respectively. The different lowercase letters indicate significant differences (p < 0.05) between the means, as established by Duncan’s test (n = 4).
Table 4. Concentration of the amino acids (mg g−1 dw) quantified with NMR in leaves of the tomato plant of var. Optima one week after exogenous application of the AA treatments: Control (without AAs), L-Tyrosine (L-Tyr), L-Lysine (L-Lys), L-Methionine (L-Met), and the Tyr + Lys + Met combination.
Amino Acids (mg g−1 dw)
TreatmentsGlutamateProlineGlutamineAspartateAlaninePhenylalanineValineTyrosineIsoleucine
Control
(w/o AAs)
7.71 ± 0.805.08 ± 0.41 b4.01 ± 0.33 a2.53 ± 0.19 b0.52 ± 0.040.27 ± 0.010.22 ± 0.010.15 ± 0.01 c0.17 ± 0.01 b
L-Tyr7.36 ± 0.689.08 ± 0.81 a1.82 ± 0.15 c2.51 ± 0.23 b0.47 ± 0.020.24 ± 0.020.24 ± 0.000.92 ± 0.08 a0.28 ± 0.00 a
L-Lys7.79 ± 0.829.76 ± 1.05 a1.45 ± 0.06 c2.54 ± 0.14 b0.60 ±0.030.20 ± 0.020.22 ± 0.020.22 ± 0.01 c0.26 ± 0.02 a
L-Met7.38 ± 0.348.90 ± 0.79 a1.84 ± 0.14 c3.23 ± 0.18 a0.64 ± 0.040.24 ± 0.020.25 ± 0.030.20 ± 0.02 c0.28 ± 0.03 a
Tyr + Lys + Met7.44 ± 0.778.98 ± 0.50 a2.99 ± 0.03 b2.24 ± 0.07 b0.58 ± 0.040.20 ± 0.010.22 ± 0.020.68 ± 0.03 b0.25 ± 0.02 a
ANOVAns******nsnsns****
In the ANOVA, ‘ns’ indicates non-significant differences with a confidence interval of 95%; *, **, and *** indicate significant differences at p < 0.05, 0.01, and 0.001, respectively. The different lowercase letters indicate significant differences (p < 0.05) between the means, as established by Duncan’s test (n = 4).
Publisher’s Note: MDPI stays neutral with regard to jurisdictional claims in published maps and institutional affiliations.