Article

Thermal Comfort in NZEB Collective Housing in Northern Spain

CAVIAR Research Group, Department of Architecture, University of the Basque Country, Plaza Oñati 2, 20018 Donostia, San Sebastián, Spain
*
Author to whom correspondence should be addressed.
Sustainability 2020, 12(22), 9630; https://doi.org/10.3390/su12229630
Submission received: 28 October 2020 / Revised: 16 November 2020 / Accepted: 17 November 2020 / Published: 18 November 2020
(This article belongs to the Special Issue Sustainable Zero Energy Buildings)

Abstract

:
European Building Codes have transitioned towards Net Zero Energy Building (NZEB) requirements in new constructions, demanding high levels of insulation and airtightness derived from research and standards developed in Northern and Central Europe. The use of these principles in Southern Europe, where solar radiation is greater and building typologies and user behaviour are different, may have had a negative impact in Thermal Comfort and Energy Demand and Consumption. In this study, six dwellings located in a 2018 27-storey Passivhaus-certified building were monitored for a period of 9–18 months in 2019 and 2020. In the spirit of a complete Post-Occupancy Evaluation, a User Comfort Survey was carried out. The obtained data were analysed and fixed-limit and adaptative comfort models were used to assess the compliance of several European Comfort Standards, namely, EN ISO 7730, EN 15251, CIBSE TM:52, CIBSE TM:59 and CIBSE Guide A. Experimental results confirmed the issues reported by occupants in the Comfort Survey, making evident a severe overheating problem which we were able to quantify. In addition to presenting the obtained data and its analysis, this paper discusses the plausible causes and health-related implications of excess heat in NZEB Housing in the Northern Spanish climate.

1. Introduction

The improvement of energy efficiency in Europe, regulated by the European Directive EU 2010/31 [1], proposes as an objective the construction of buildings with almost zero energy consumption (NZEB), developed in EC 2016/1318 [2,3]. Some aspects outlined in the document [3] are the use as models of the very low energy consumption buildings developed in Europe with conservative solutions built in the cold climates of Central and Northern Europe. The benchmark are the Passivhaus and Minergie standards, which have a long tradition in Central Europe. The simulations are carried out with very broad reference climates. This methodology has some disadvantages, such as the use as a model of single-family houses with a significantly different behaviour to collective housing, predominant in Spain. The real occupation in collective housing in Spain are higher than the Central European average and internal gains are very influential in buildings with very low energy demand. At the same time, local climatic variations also have a decisive influence on the internal contribution of solar radiation. Some countries and regions have incorporated objectives very similar to those set by the Passivhaus standards into their national regulations [4]. The objective of this study is to verify the behaviour of collective dwellings built under energy-conserving standards such as Passivhaus in the climate of the Basque Country and the degree of interior comfort according to different regulations focused on the detection of overheating.
Overheating is a known problem in highly airtight and insulated buildings with numerous studies confirming it [5,6,7,8,9] and analysing energy efficiency and comfort in a variety of European climates. A common element in these studies is that occupants are often more satisfied with winter comfort than summer comfort. As a summary, a study of the first Passivhaus houses in Denmark [10] states that “the great interest in energy efficiency has reduced the interest in interior comfort. This has led to problems in overheating of buildings, among others”, and concludes that there is an emerging conflict between the implementation of energy efficiency standards and the recommendations of Article 4 of the EU Directive 2010/31: “These requirements shall take into account the general conditions of the indoor climate, avoiding possible negative consequences such as inadequate ventilation, as well as the particular conditions, use and age of the building” [1]. Many of the studies add overheating mitigation measures [11,12,13,14,15,16].

1.1. Overheating and Health

There is a well-established relationship between high temperatures and mortality risk. The European heat waves of 2003 and 2006 caused a significant increase in excess summer mortality, mainly among the elderly and socially isolated [17,18]. In the most recent June-July 2019 European heat wave, an excess mortality of 2964 deaths were recorded in the Netherlands [19]. In August 2003, more than 30,000 excess deaths were recorded throughout Western Europe during the 10 days of the heat wave [20]. In Spain, the excess mortality recorded for that year between June and August was 12,919 people more than the previous period, affecting especially the age group of 70 years or older. Among the causes directly related to heat, heat stroke (169 cases compared to 9 in 2002) and dehydration (191 compared to 71) were the most notable. However, the greatest impact occurred in other causes of death that respond to previous chronic pathologies considered at risk in situations of high temperatures, such as Alzheimer’s disease (which increased by 56.1%) [21]. Although the increase in mortality recorded that year affects to a greater extent the hottest regions of Spain, there is an 11.3% increase in mortality in regions considered to have temperate summers, such as the Basque Country.
As a result, the prevention of heat-related mortality has become a major public health concern in Europe [21,22,23] and in Spain. In this country, the first National Plan of Preventive Actions against the Effects of Excessive Temperatures on Health was published in 2004, and a new one is drawn up every summer with the aim of reducing the potential effects associated with heat waves during the summer period [24]. However, studies with detailed empirical data on indoor temperatures during the summer in buildings, as well as information on the characteristics of dwellings and occupants, are still scarce. It is important to note that the population of Spain is aging. Those over 65 years of age account for 19.4% (9 million) of the total population (47 million) in 2019, of which 2 million live alone according to the National Institute of Statistics. This can have strong implications on excess mortality due to living in apartments with a number of hours of excessive overheating.

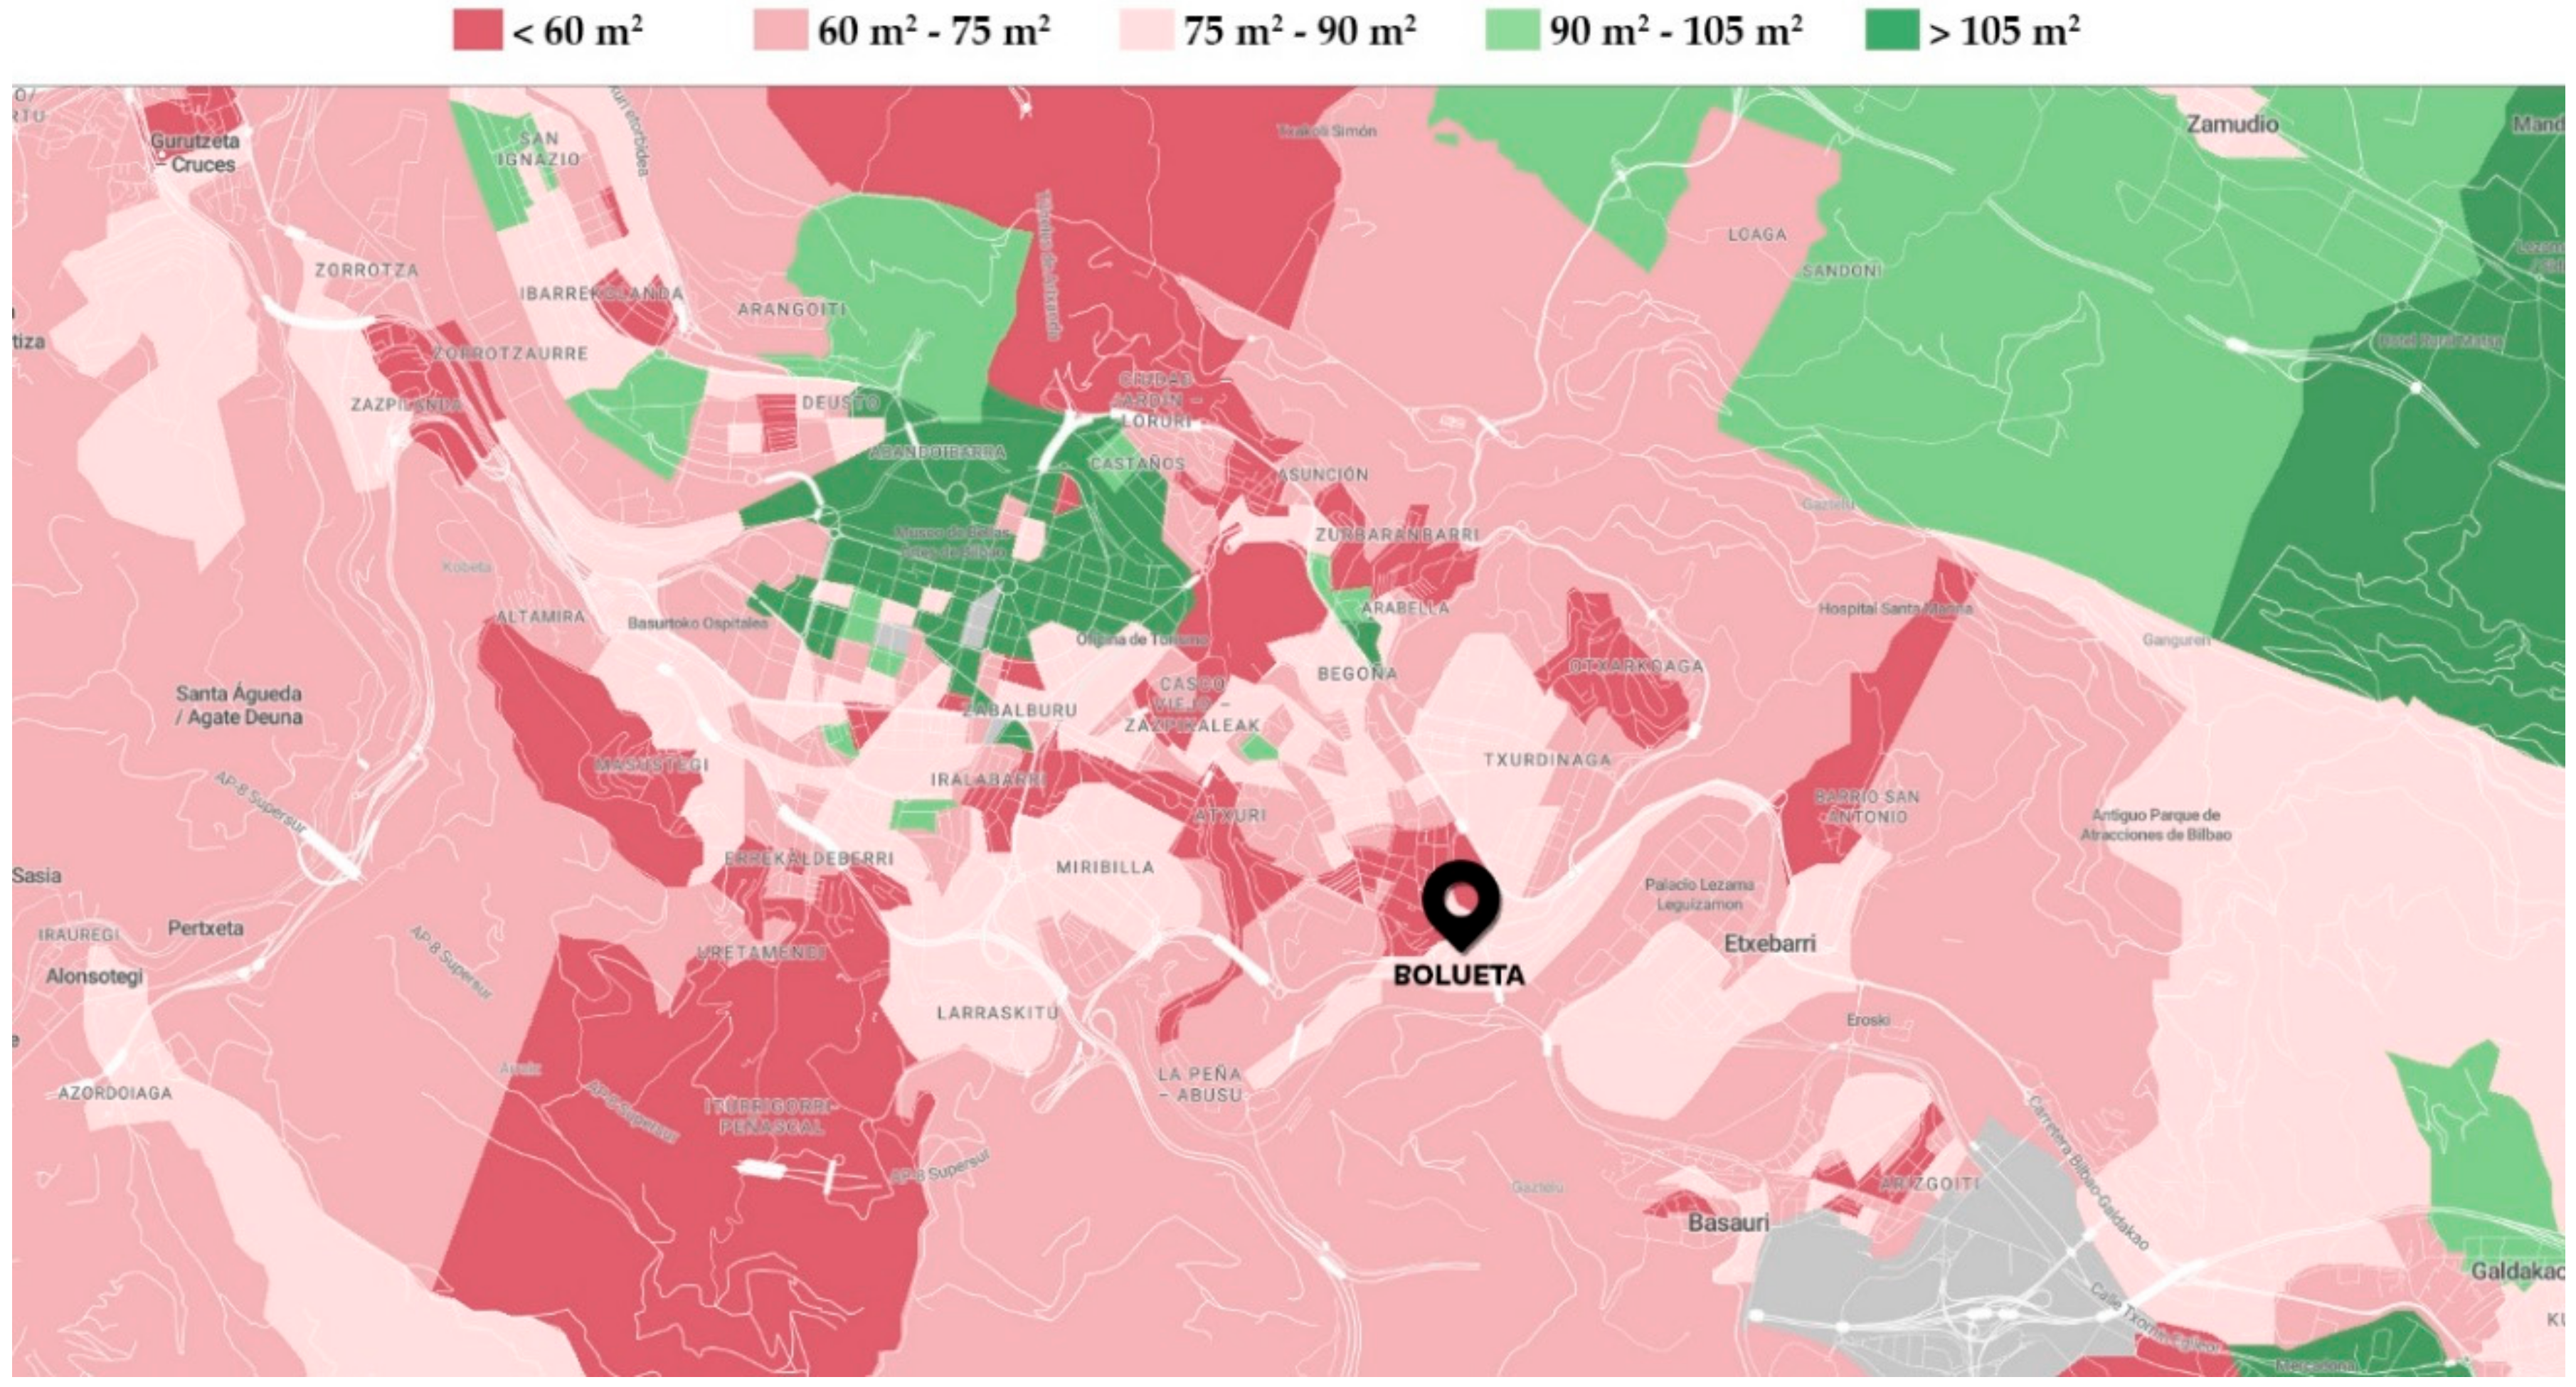
1.2. Housing Typology in Spain

Housing typology impacts greatly in overheating in dwellings. Smaller units with higher occupancy will suffer from more severe overheating, since the higher the density of inhabitants and the smaller the useful surface area, the greater the incidence of internal gains on the global energy balance and, therefore, the greater the impact on the internal temperature. Spain is the European Union country with the highest percentage of population living in an apartment, 64.9% compared to 46% of the European average or less than 20% in countries like the United Kingdom and the Netherlands, according to the latest Eurostat report of 2018 [25]. The average size of the apartment in Spain according to the Cadastre is 144 m2. However, this is very inflated data due to the numerous existing rural dwellings of great size, which are often unoccupied. According to the Basque Institute of Statistics, the average family home in the Basque Country in 2019 had a useful surface area of 87.2 m2 [26]. Publicly subsidised housing has somewhat lower surface area ratios. In the case of the development studied, it has an average closed surface area of some 80 m2, that is, about 21.66 m2 per inhabitant, if one takes into account an average occupation calculated according to the regulations, of 3.66 people per dwelling. The actual occupation according to the August 2019 survey shows an average of 2.45 people/household, that is, a ratio of 32.44 m2/person. In Germany, for example, the useful area per person is 42.9 m2/person [27].
It is understood that the recent occupation of the building in many cases by young people generates these low-occupancy values that will increase over time. This fits in well with the average useful area of the dwelling for the Basque Country as a whole, which is 87.2 m2. The average occupancy rate in Spain is 2.5 inhabitants per home (2.38 in the Basque Country) [26,28], but it must be noted that this is a statistic that reflects the occupancy rate of consolidated homes with a variety of age profiles. Figure 1 shows the average size of homes in the metropolitan area of Bilbao. The parts in red colours correspond to urban areas, housing between 60 and 90 m2. The rural areas with larger single-family homes are in green [29]. Shown in green, in the centre of the image, are the houses of the centre of Bilbao with the bigger bourgeois apartments. The monitored houses are located in an environment of small houses (60–75 m2).

1.3. The Urban Heat Island Effect

Another effect to consider on overheating is the impact of urban heat islands. In the Basque Country, 73% of households are concentrated in cities [26], so urban heat islands can increase the effects of overheating. This situation also implies worse conditions for the use of natural ventilation due to environmental noise in the urban environment. The studies available in Spain focus on cities with very hot summers such as Valencia, Barcelona or Zaragoza. A recent study on urban islands in Bilbao [30] shows that there are clear differences not only between the city and the countryside but also between different parts of the city, and points out the peculiarities of the UHI of Bilbao: “(…) local climatic differences occurring inside the city and show the influence of complex topography and sea/land breeze in the urban climate. Hourly maximum temperature anomaly occurs just after sunrise and an urban cold island (UCI) is developed after midday. Along the year, mean UHI intensity is highest in autumn and the UCI effect increases in spring and summer in relation with sea breeze cooling potential. Diurnal and seasonal variation of air flow patterns appear to influence significantly on UHI intensity” [30]. We must take into account that the climate models used for energy design and building evaluation use climate data from airports, located in clear areas and without the effect of the city, as is the case of Bilbao where the reference station is located at Loiu airport.

1.4. Spanish Overheating Prevention Standards and Regulations

Despite the fact that Spain is a country with high summer temperatures, there are very few regulations that limit overheating in homes or require preventive measures to prevent it from occurring. This contrasts with European countries such as the United Kingdom or France, for example, which have developed specific regulations to prevent this. The climatic zone in which the Basque Country is located means that no autonomous regulations have been drafted with a view either to protect homes from the foreseeable increase in temperatures due to climate change or to increase the efficiency of the building envelope. The housing regulations in force in the Basque Autonomous Community [31] only state that “The lighting sources [windows] in all rooms shall be equipped with blinds, shutters or some system that allows them to be darkened”, referring more to a concept of darkening to allow sleep. The new project for habitability regulations, which is currently being processed [32], goes deeper into this concept by commenting that “…to avoid the entry of undesired solar radiation, the lighting spaces in all rooms will be equipped with blinds, shutters, slats or some system that allows them to be darkened, whose operating mechanism is accessible”. It also favours the types with cross ventilation, considering as such the houses that have adjacent facades and not only opposite facades.
In the case of Spain, current regulations, the Technical Building Code [33], do not require overheating in non-climate-controlled buildings, but only limit the consumption of primary energy from non-renewable sources, depending on the climate zone. By limiting the demand for primary energy, it is understood that an excessive demand for primary energy for cooling is also being limited. For each space where the monthly cooling demand is lower than the limit, it is assumed that cooling is not necessary in that month. When the cooling demand is higher than the limit, the energy consumption needed for cooling is calculated with the projected system (if available) or with virtual low energy equipment in the case of non-air-conditioned spaces. The evaluation of the necessary energy demand is done by means of the unified tool LIDER-CALENER (HULC) [34].
Data that shows the mildness of the Basque Country summer can be found in the number of air conditioning equipment available in homes. In 2008, only 1.7% of households in the Basque Country had air conditioning, as opposed to 35.5% of the national total [35]. The Idealista housing sales website [36] for 2020 indicates the percentage of homes for sale with air conditioning. In Bilbao, 2.1% of homes have air conditioning, while in San Sebastian it rises to 5.8%, and in Vitoria it is only 1%. It indicates only 1.9% for the whole of the autonomous community. However, it is paradoxical that there is a National Plan of Preventive Actions for High Temperatures [24], which tries to inform the population of the risk levels that occur during heat waves depending on the risk area in which each town is located, due to the constant increase in them in recent years. Other countries, however, have much more advanced measures to control the risk of overheating, most notably the United Kingdom [37]. Several reports in this country have highlighted the importance of improving the understanding of the risk of overheating of buildings and identifying the optimal solution routes through long-term planning and improvement of building design [37,38,39,40,41,42]. In France, the latest update of the Thermal Regulation, RT 2020 [4], summer comfort has been identified as one of the primary objectives, together with energy efficiency and CO2 emissions reduction.

1.5. Relevant Previous Case Studies

There is a varied body of research on overheating in residential buildings in Europe [5,6,7,8,9,10,11,12,13,14,15,16]. In [16], there is a wide sample of these studies focusing on buildings with Passivhaus certificate dating 2011 to 2015. Of the 44 cases collected, only 5 (11.3%) refer to collective housing buildings, the rest being detached or semi-detached houses. In the United Kingdom, since the heat wave of 2003, many studies have been conducted on overheating in buildings during the summer, summarised in [43]. In [44], 30 cases of different periods and construction are also studied. The same study presents a monitoring campaign of 129 developments built mainly in the 20th century and, as late as 2006, 50% corresponding to apartments in collective housing. The monitoring of 25 social apartments built under the Passivhaus standard, and located in Sampson Close Coventry, east of Birmingham, [6] can serve as a reference for the problems that this type of construction can have in the summer. The results indicated that the limits of the Passivhaus standard were exceeded in 18 of the 25 monitored dwellings (72%), with a maximum value of 37% of the hours above 25 °C. Two of the apartments reach the limit of the annual value in 45 days of monitoring in 2011. In 2013, with the longest monitoring period (1 May–31 August 2013), all five apartments exceed the annual maximum value of the Passivhaus, with peaks of 32% of hours.
In Spain, there are 128 homes with Passivhaus certification, of which only 16 developments correspond to the collective apartment typology, with this development being the largest in number of apartments and size [45]. In 2018, some 100,000 m2 of built area were certified under the Passivhaus standard, with this development having 28,000 m2 of conditioned useful surface area (Treated Floor Area). This means that only this promotion represents the third part of the certified houses in Spain. A second phase of this development was built and delivered to the homeowners in May 2020, built with the same characteristics, but it did not undergo the Passivhaus certification process.
It is important to emphasise that there is practically no monitoring of collective housing built under the Passivhaus standard in Spain. Only some studies have been carried out on single-family or semi-detached houses [46,47,48]. This results in a very partial bibliography with little relevant data.

2. Materials and Methods

This study is based on a previous analysis of the implementation of the Passivhaus certificate in collective housing in the Basque Country and Navarre [16]. In the previous work, the most common typologies in social housing in the different climates of the Basque Country and Navarre were analysed by means of dynamic simulations. This allowed mainly to detect the typologies with more possibilities of suffering overheating and the climatic zones where the highest frequencies of the phenomenon are produced. The Basque coast is characterised by a temperate climate, in which the effects of overheating could be fought with a great solar protection and using intensively the night ventilation in houses built under the Passivhaus standard. Deviations in ventilation and shading use patterns quickly led to excessive periods of overheating. By means of this study, a correct selection of the range of dwellings that can be more representative in the analysis of the overheating is realised. It is therefore a question of avoiding characterising the most extreme cases.
In this paper, a monitoring campaign was carried out on a Passivhaus-certified collective social housing project built in Bilbao by the regional government of the Basque Country. In the spirit of a complete Post Occupancy Evaluation (POE), the study also included a comfort survey handed out to the occupants.

2.1. Thermal Comfort Models and Standards

Regarding overheating, [44] notes that “At present there is no robust, defensible and universally accepted definition of overheating either for use in the assessment of proposed dwellings, for example, by modelling, or for as-built evaluation…. Consequently, the papers reporting monitoring studies use different criteria to evaluate whether or not overheating has occurred”. For this reason, this study uses different models to detect overheating, summarised in Table 1. There are mainly two types of models, those that meet acceptable temperature thresholds and those adaptive models that vary according to the outside climate.
The choice of comfort models is a fundamental aspect in assessing the quality of the interior climate. The two most adopted models are the Thermal Balance Model or empirical model (EN ISO 7730:2006 and EN 15251:2008) based on studies with climatic chambers, and the Adaptive Models based on field studies, that account for subjective aspects of comfort and are in permanent revision [49]. Thermal Balance Models like EN ISO 7730 [50] best apply to indoor environments where steady-state thermal comfort or mild deviations from comfort occur. In Spain, the technical standard in effect (RITE) [51] is based on EN ISO 7730.
EN 15251 [52] suggests the use of Fanger’s model for mechanically heated and/or cooled buildings and Humphrey’s and Nicol’s adaptative model for buildings without a mechanical cooling system [16]. Some more advanced national standards, that of CIBSE in the United Kingdom, for instance, combine both approaches. CIBSE Guide A [53] follows an empirical model based on fixed limits for temperature, while CIBSE TM:52 [54] follows an adaptative model. These documents also define several criteria for overheating assessment. CIBSE TM:52 is used primarily in commercial buildings and should only be applied when the occupants are able to act on their environment to regulate indoor climate conditions, while TM:59 [55] was developed for housing.
CIBSE guide A (Section 1.5.3.2 and CIBSE TM52 to which it refers) is based upon an adaptive comfort model in EN 15251. CIBSE TM52 recognises that, due to the wide range of comfort temperatures permitted, comfort standards based upon an adaptive comfort model present a design problem. For this reason, it also introduces an exceedance threshold. Conversely, CIBSE as well [56] recognises that because comfort is inherently imprecise the selection of a single temperature, or hours of exceedance metric, is also not without issues.
The comfort range in the Passivhaus standard is based on a steady-state equation that predicts average monthly values without taking into account the effects of thermal inertia [57]. The PHI limits the annual hours above 25 °C to 10%. For the purposes of Passivhaus Certification, the summer comfort condition must be assessed using the Passivhaus Planning Package (PHPP) as being “Acceptable” or better. Less than 5% over 25 °C is typically considered a suitable target and many designers aim for 0% hours. Table 1 summarises the different criteria of the comfort standards used.
What is clear from the literature is that high temperatures in bedrooms overnight are a significant risk and that temperatures above 24 °C may begin to impair sleep and have other associated health impacts. With the lack of a clear definition of overheating in dwellings, studies in this area are as a result subject to a degree of uncertainty [58].

2.2. User Comfort Surveys

Surveys are deemed the most reliable method to detect overheating in buildings already in use [54], as they provide direct information of the occupants’ degree of comfort needless of a model.
As a subjective phenomenon, overheating can best be detected by the observations of the building’s occupants. The results can be examined to see if complaints of overheating are common. If 20% or more of the occupants in any area report overheating, then clearly a problem exists.
A comprehensive POE survey was designed with a holistic approach that accounted not only for Building Performance (BPE), but was also oriented at knowing the perceived comfort, habits and opinions of the occupants and considered non-technical factors as well, in the spirit of a Universal Design Evaluation (UDE). The 28-item survey was made available online for all occupants of the building in the late summer of 2019.

2.3. Description of the Case Study

The analysed building is located in Bilbao. The coastal line of the Basque Country contains the most populated cities in the mentioned territory (more than 1.4 million inhabitants, 60 % of total population), the metropolitan area of Bilbao being the densest (45% of total). The studied building is a recent public development of between 9 and 27 floors that houses 171 apartments, 63 of which are destined to subsidised rental and 108 to fixed-price protected sale.
The homes have been occupied as of March 2019. The building obtained the Passivhaus certificate in March 2018 with a heating demand of 6 kWh/m2y, a design heating load of 7 W/m2 and an airtightness of 0.4 h-1 in the n50 test. The expected overheating periods (hours where T > 25 °C) are 7%, less than the maximum 10% allowed in the PH standard [45]. The building is located in an urban area of the city of Bilbao, in a noisy environment. It is protected from direct solar radiation by opaque reflective blinds located inside the windows. It lacks balconies or any other kind of sun protection. All façades are covered with a black finish aluminium composite façade panel (Figure 2).
Six units were monitored for representativeness of the typological variety and average occupancy of the dwellings. A house was launched on March 13, 2019 while three were monitored since August 30, 2019. Two more apartments were monitored since 16 January 2020 with a typical occupation of a couple with two children. The selected dwellings are also in different floors and have different orientations, and users report different degrees of operation on blinds and windows (Table 2).
The orientations in which windows are available determine the possibility of cross ventilation. Only dwelling 3 has two facades facing each other. This orientation is repeated in 32% of the homes in the development, always with N-S orientations. Houses 4 and 5 have only one orientation to the south, with no possibility of cross ventilation. Twenty-six percent of the apartments in the development have these characteristics, facing south only. Apartments 1, 2 and 6 have two lateral facades. This orientation represents 42% of the homes in the development, with the orientations N-W (16%), N-E (5%), S-E (5%) and S-O (16%). (Figure 3) shows the typical floor plan with the different layouts. The floor plan varies slightly in some floors to accommodate housing for people with reduced mobility. As can be seen, the monitored dwellings are a good representation of the typological variety of the development and even of the usual type of social housing in the Basque Country. A deeper analysis can be found in [16].

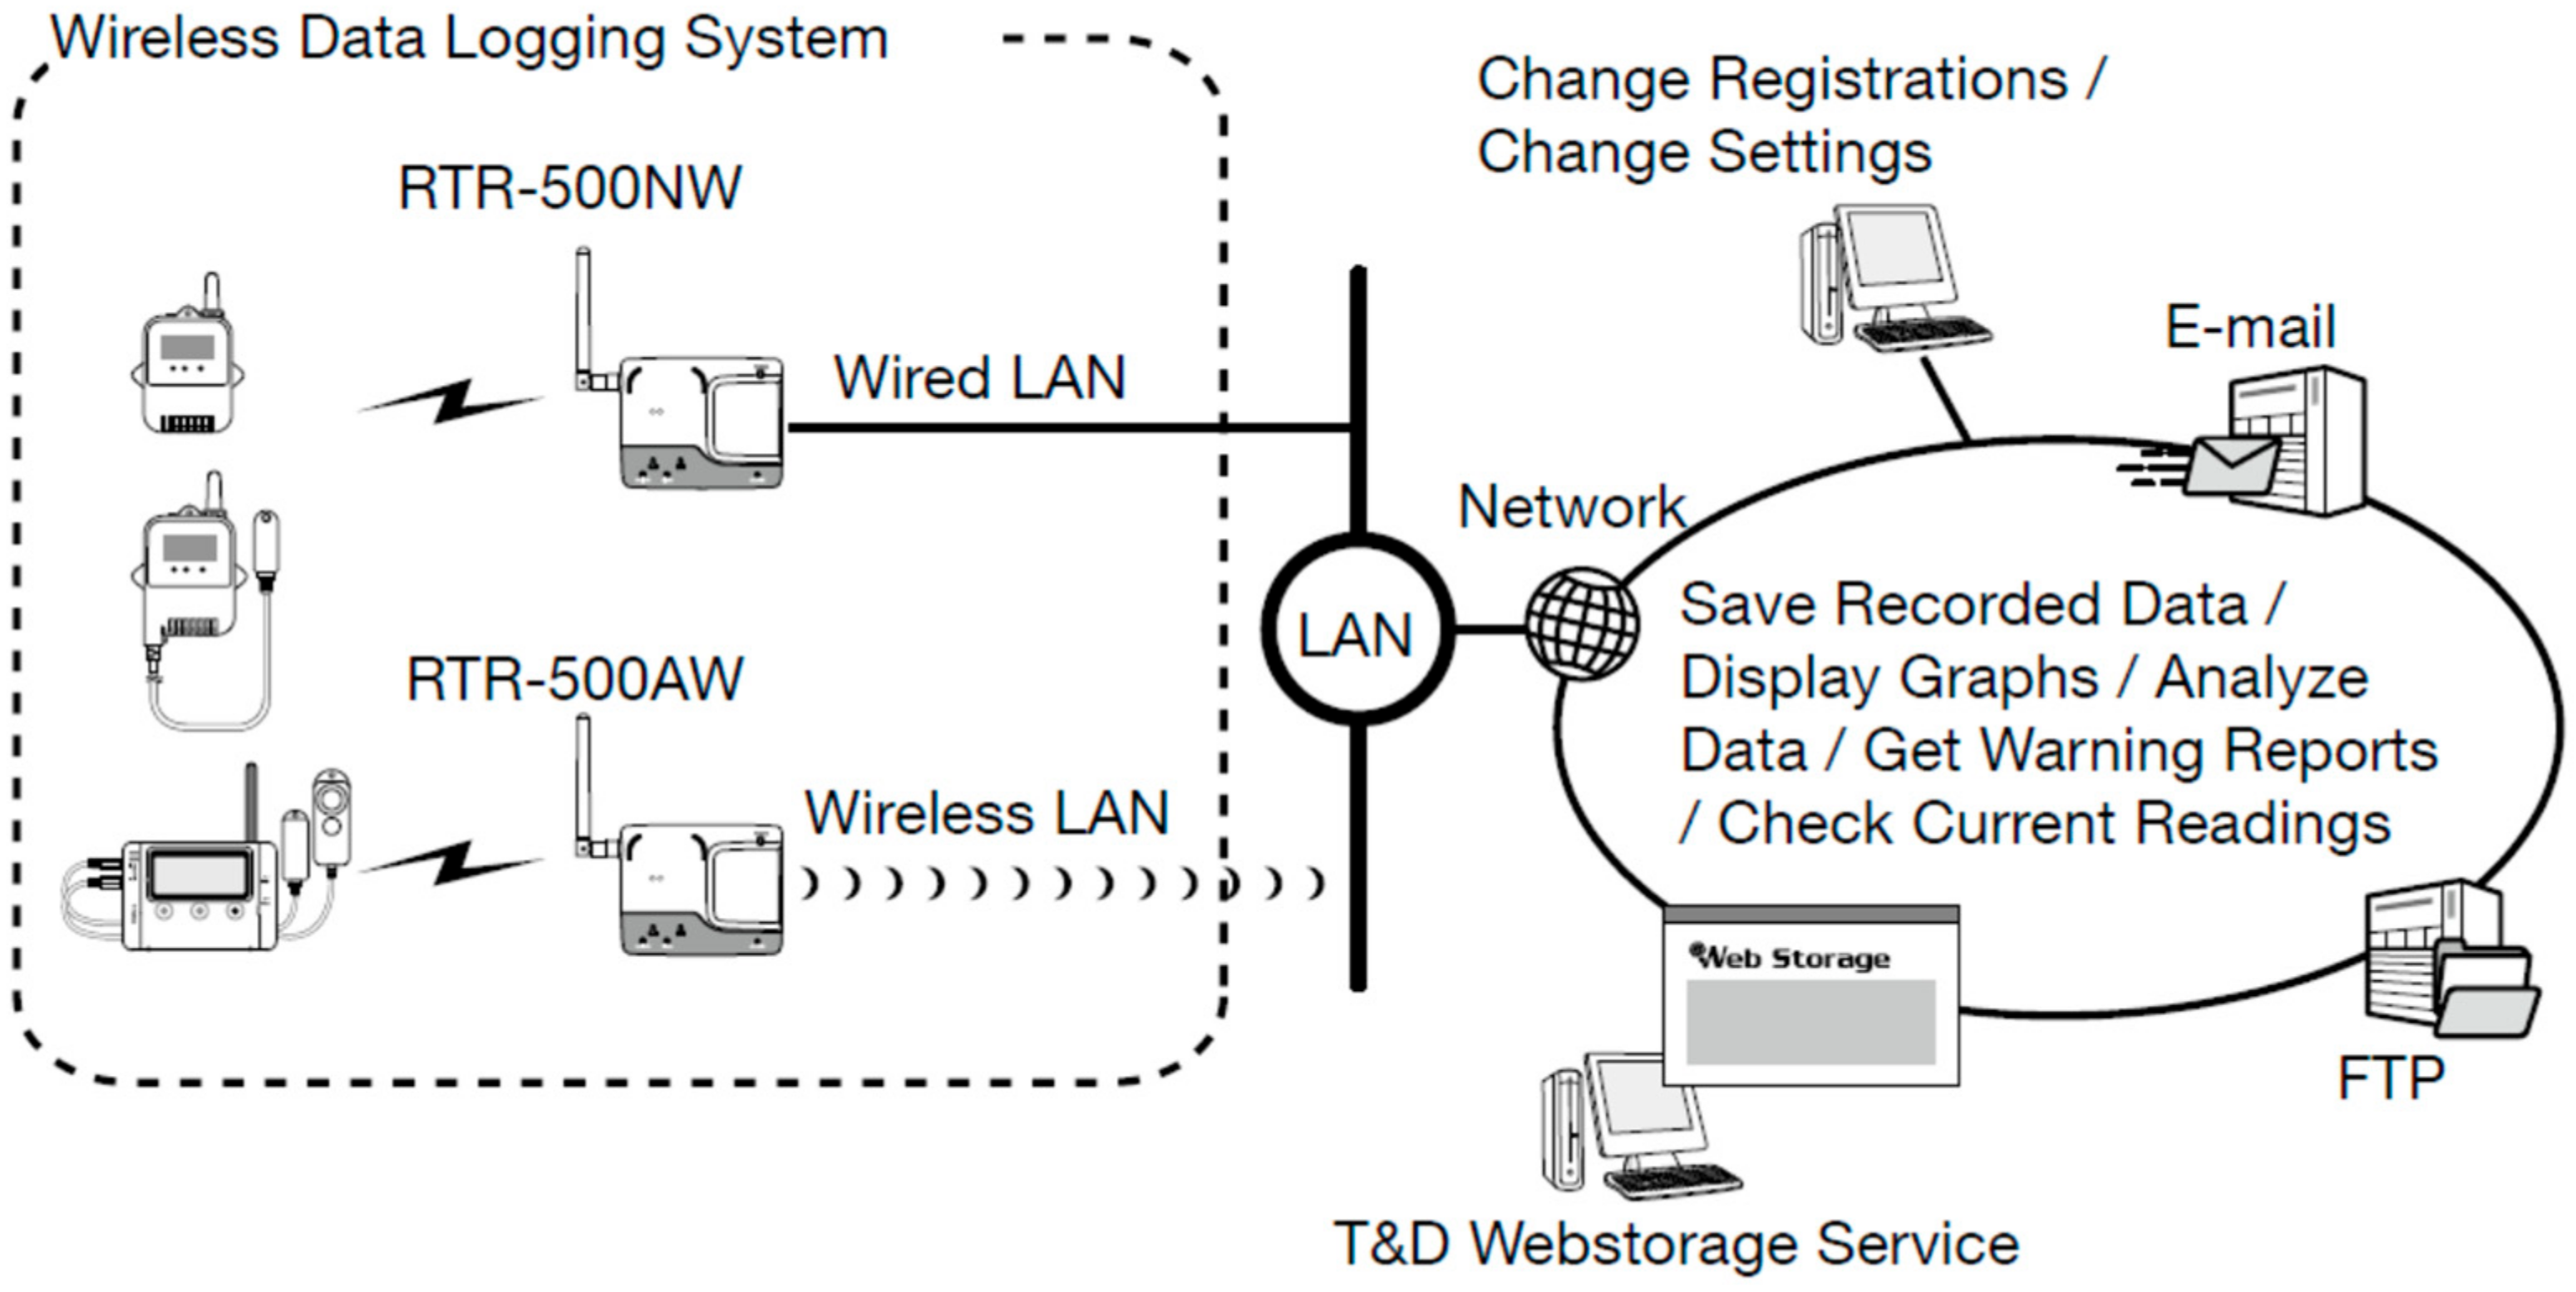
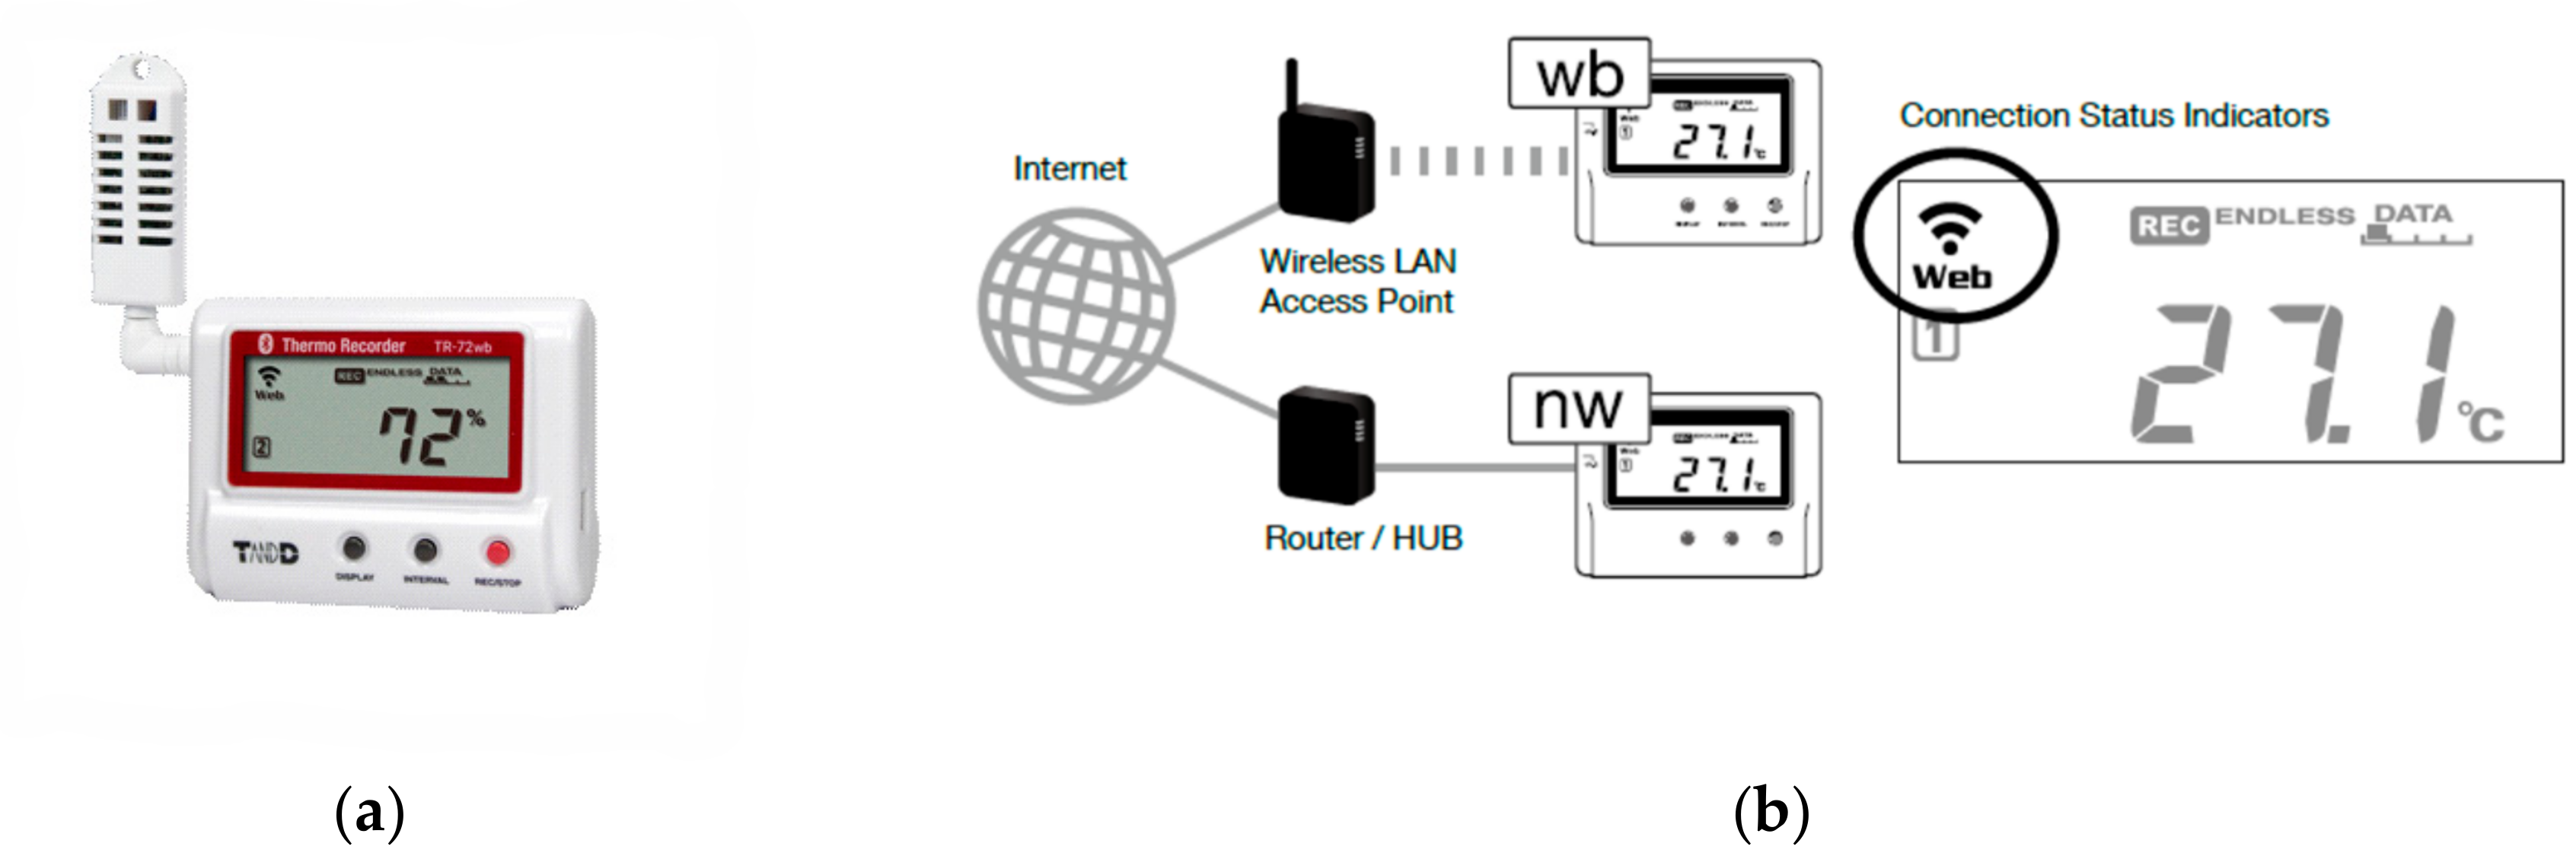
2.4. Data Collection

Because the building was occupied recently, the procedure suggested by CIBSE TM:52 using building occupant surveys may be distorted, as it depends on the occupants’ familiarity with the building. The recommended supplementary procedure is to monitor the operative temperature regularly in various representative spaces in the building. The operative temperature can be measured using a black or dark grey balloon of ~ 40 mm diameter as recommended in an appendix to Chapter 1 of CIBSE Guide A [53].
T&D RTR-576 equipment with three channels, CO2 Concentration, Temperature and Humidity, have been used for monitoring. The measuring range of CO2 is 0 to 9999 ppm, Temperature: 0 to 55 °C (accuracy ± 0.5 °C) and Humidity: 10% to 95% RH (accuracy 5% RH at 25 °C, 50% RH). The reading is transmitted remotely by a T&D RTR-500 unit and allows remote reading through the manufacturer’s own T&D Web Storage service (Figure 4).
Apartments 5 and 6 are monitored with T&D TR-7wb equipment. These equipment have a more basic configuration, but on the other hand they allow the monitoring of the temperature and relative humidity data of the houses in a simpler way. They are connected directly to the user’s Wi-Fi network and allow the downloading of temperature and relative humidity data from a single room (Figure 5).
It is worth noting that both the deterministic and adaptive criteria discussed in Section 2.1 refer to operative temperatures. A limitation of this study, shared with the majority of indoor overheating monitoring studies in the literature, is that dry bulb temperature rather than operative temperature was measured due to the increased complexity and cost associated with mean radiant temperature monitoring. It is often assumed that the difference between dry bulb and mean radiant temperature, and hence the difference between dry bulb and operative temperature, is marginal in well-insulated rooms and locations away from direct solar radiation or other indoor sources of radiation [43,53].

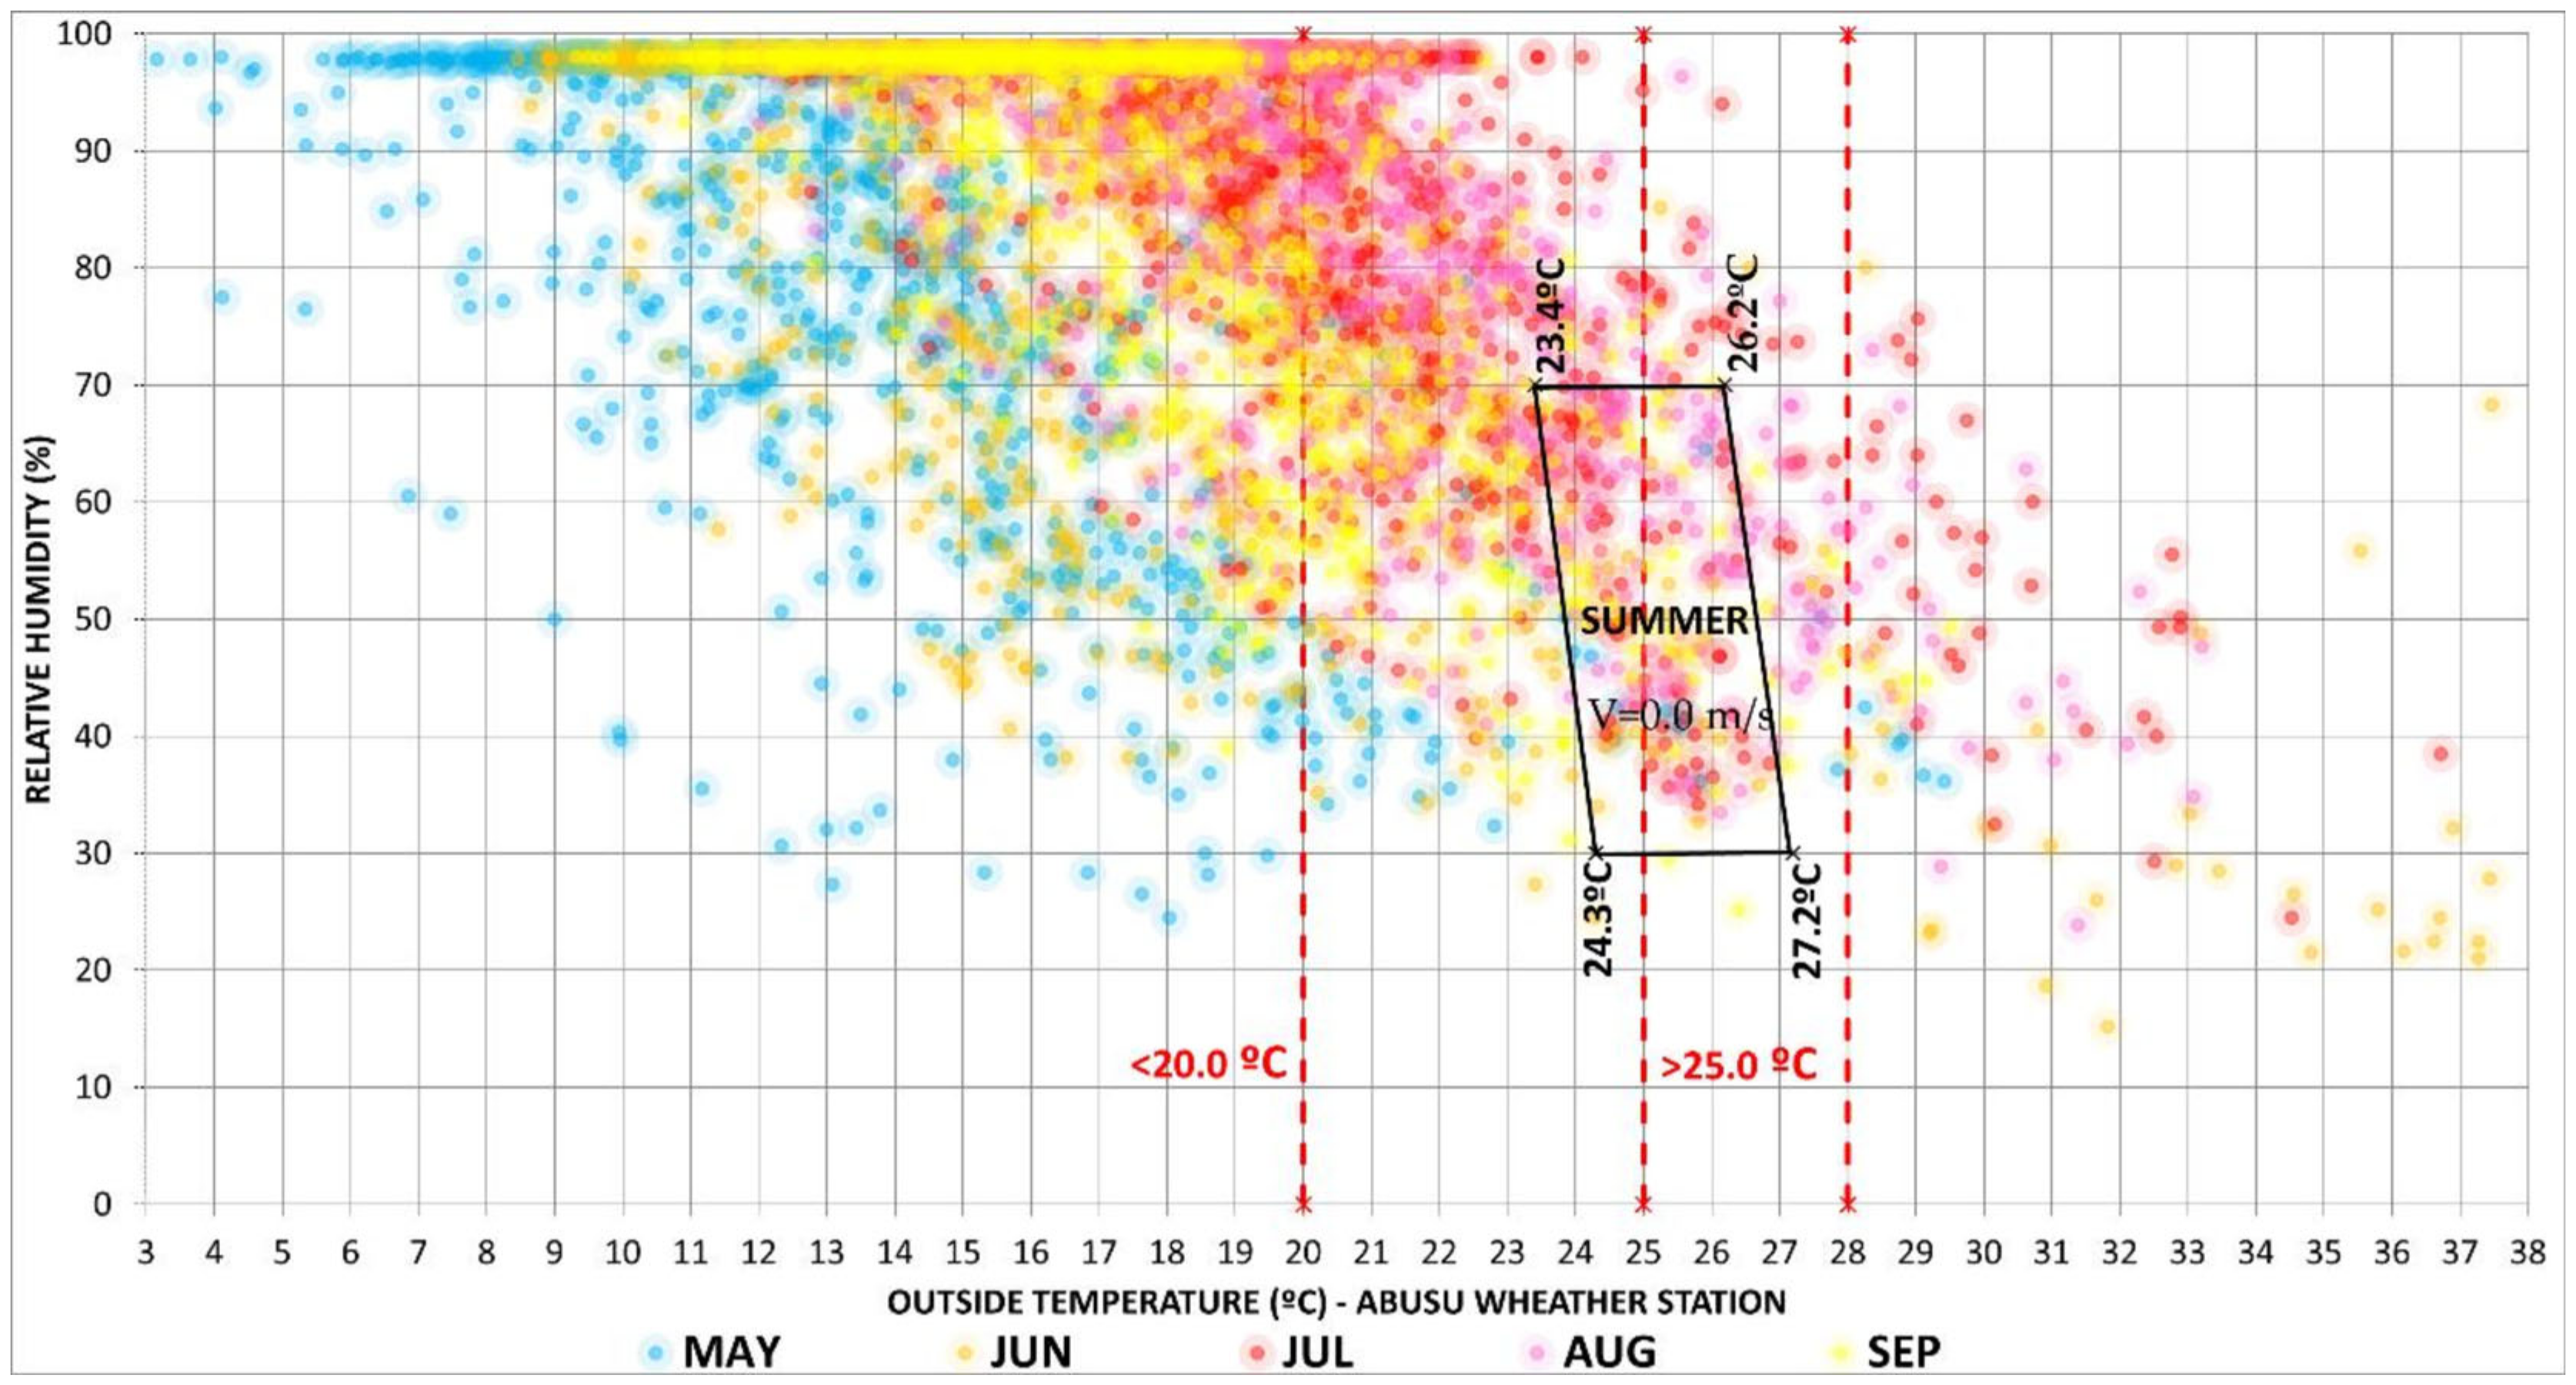
2.5. Outdoor Climatic Data Collection and Analysis

Outdoor weather data was obtained from the nearby weather station of Abusu-La Peña, which is less than 500 meters away from the building. It belongs to the Basque Meteorological Agency, Euskalmet. The analysis of the weather data shows that the monitoring period is within the historical average, both 2019 and 2020 summers not being a particularly hot. Figure 6 shows the superimposition of the data provided by the Abusu weather station on the EN 7730 comfort model.
In the summer of 2019, the following characteristics can be observed in the local climate of the area:
  • General cool environment (69% of the hours below 20 °C), with few hours above 25 °C (7.2%) and less hours above 28 °C (2.6%)
  • The maximum temperature, 37.5 °C, was recorded in June
  • The hottest month, on average, was August
  • High environmental humidity. The maximum relative humidity of all months was 98%. Relative humidity remained above 70% for 72.7% of the summer hours.
Table 3 summarises the data recorded at the Abusu-La Peña weather station in the summer (May–September) of 2019 (3672 h).

3. Results

3.1. Post-Occupancy Evaluation Survey

The CIBSE TM 52 standard for the Prevention of Overheating in European Buildings considers the survey of subjective perceptions of occupants to be the main and most appropriate method for analysing overheating in occupied buildings, considering it especially suitable for buildings where the occupants have a high degree of familiarity with the building, such as housing [54]. To this end, during the months of September and October 2019, a survey was presented to the users of housing in order to assess the comfort conditions, as well as other issues related to their perception of the quality of life in their homes and their opinion on energy consumption. A channel was also set up in which those surveyed could freely contribute with the comments they considered relevant.
The survey was open to all inhabitants of the building, who were informed through posters placed in the elevators, a mailing campaign and an email circulated by the administrators of the Community of Owners. The survey was conducted online through an Internet platform. This allows for instantaneous data collection and automatic data processing.
The response to the questionnaire was high, being carried out by 84 occupants of 54 different dwellings. The survey provides information on the real occupation of the dwellings: 14% have one occupant, 50% have two inhabitants, 14% have two inhabitants and 32% have four inhabitants or more (Figure 7).
The survey highlights discomfort during the summer. One hundred percent of men and 78.9% of women report having sleep-related issues during the summer on a regular basis, either difficulty falling asleep or regarding the quality of said sleep. The most common answer to the general thermal sensation in the summer was “It’s too hot” (95%). The reported clothing index in summer is, on average, 0.27 CLO, equivalent to wearing underwear only, confirming the perception of overheating. Long format comments submitted by the survey-takers depict the problems that excess heat generates in daily life, even if they claim to have permanently ventilated the rooms (20%) and to be very active with the use of the blinds.

3.2. Results of the Monitoring Campaign

In a first stage, the comfort analysis of a single house is carried out. The way to evaluate the comfort with the different regulations is shown with different graphics. This sample exemplifies the work done in the rest of the monitored homes. Later, the main values obtained from the analysis of each house are summarised by means of comparative tables.

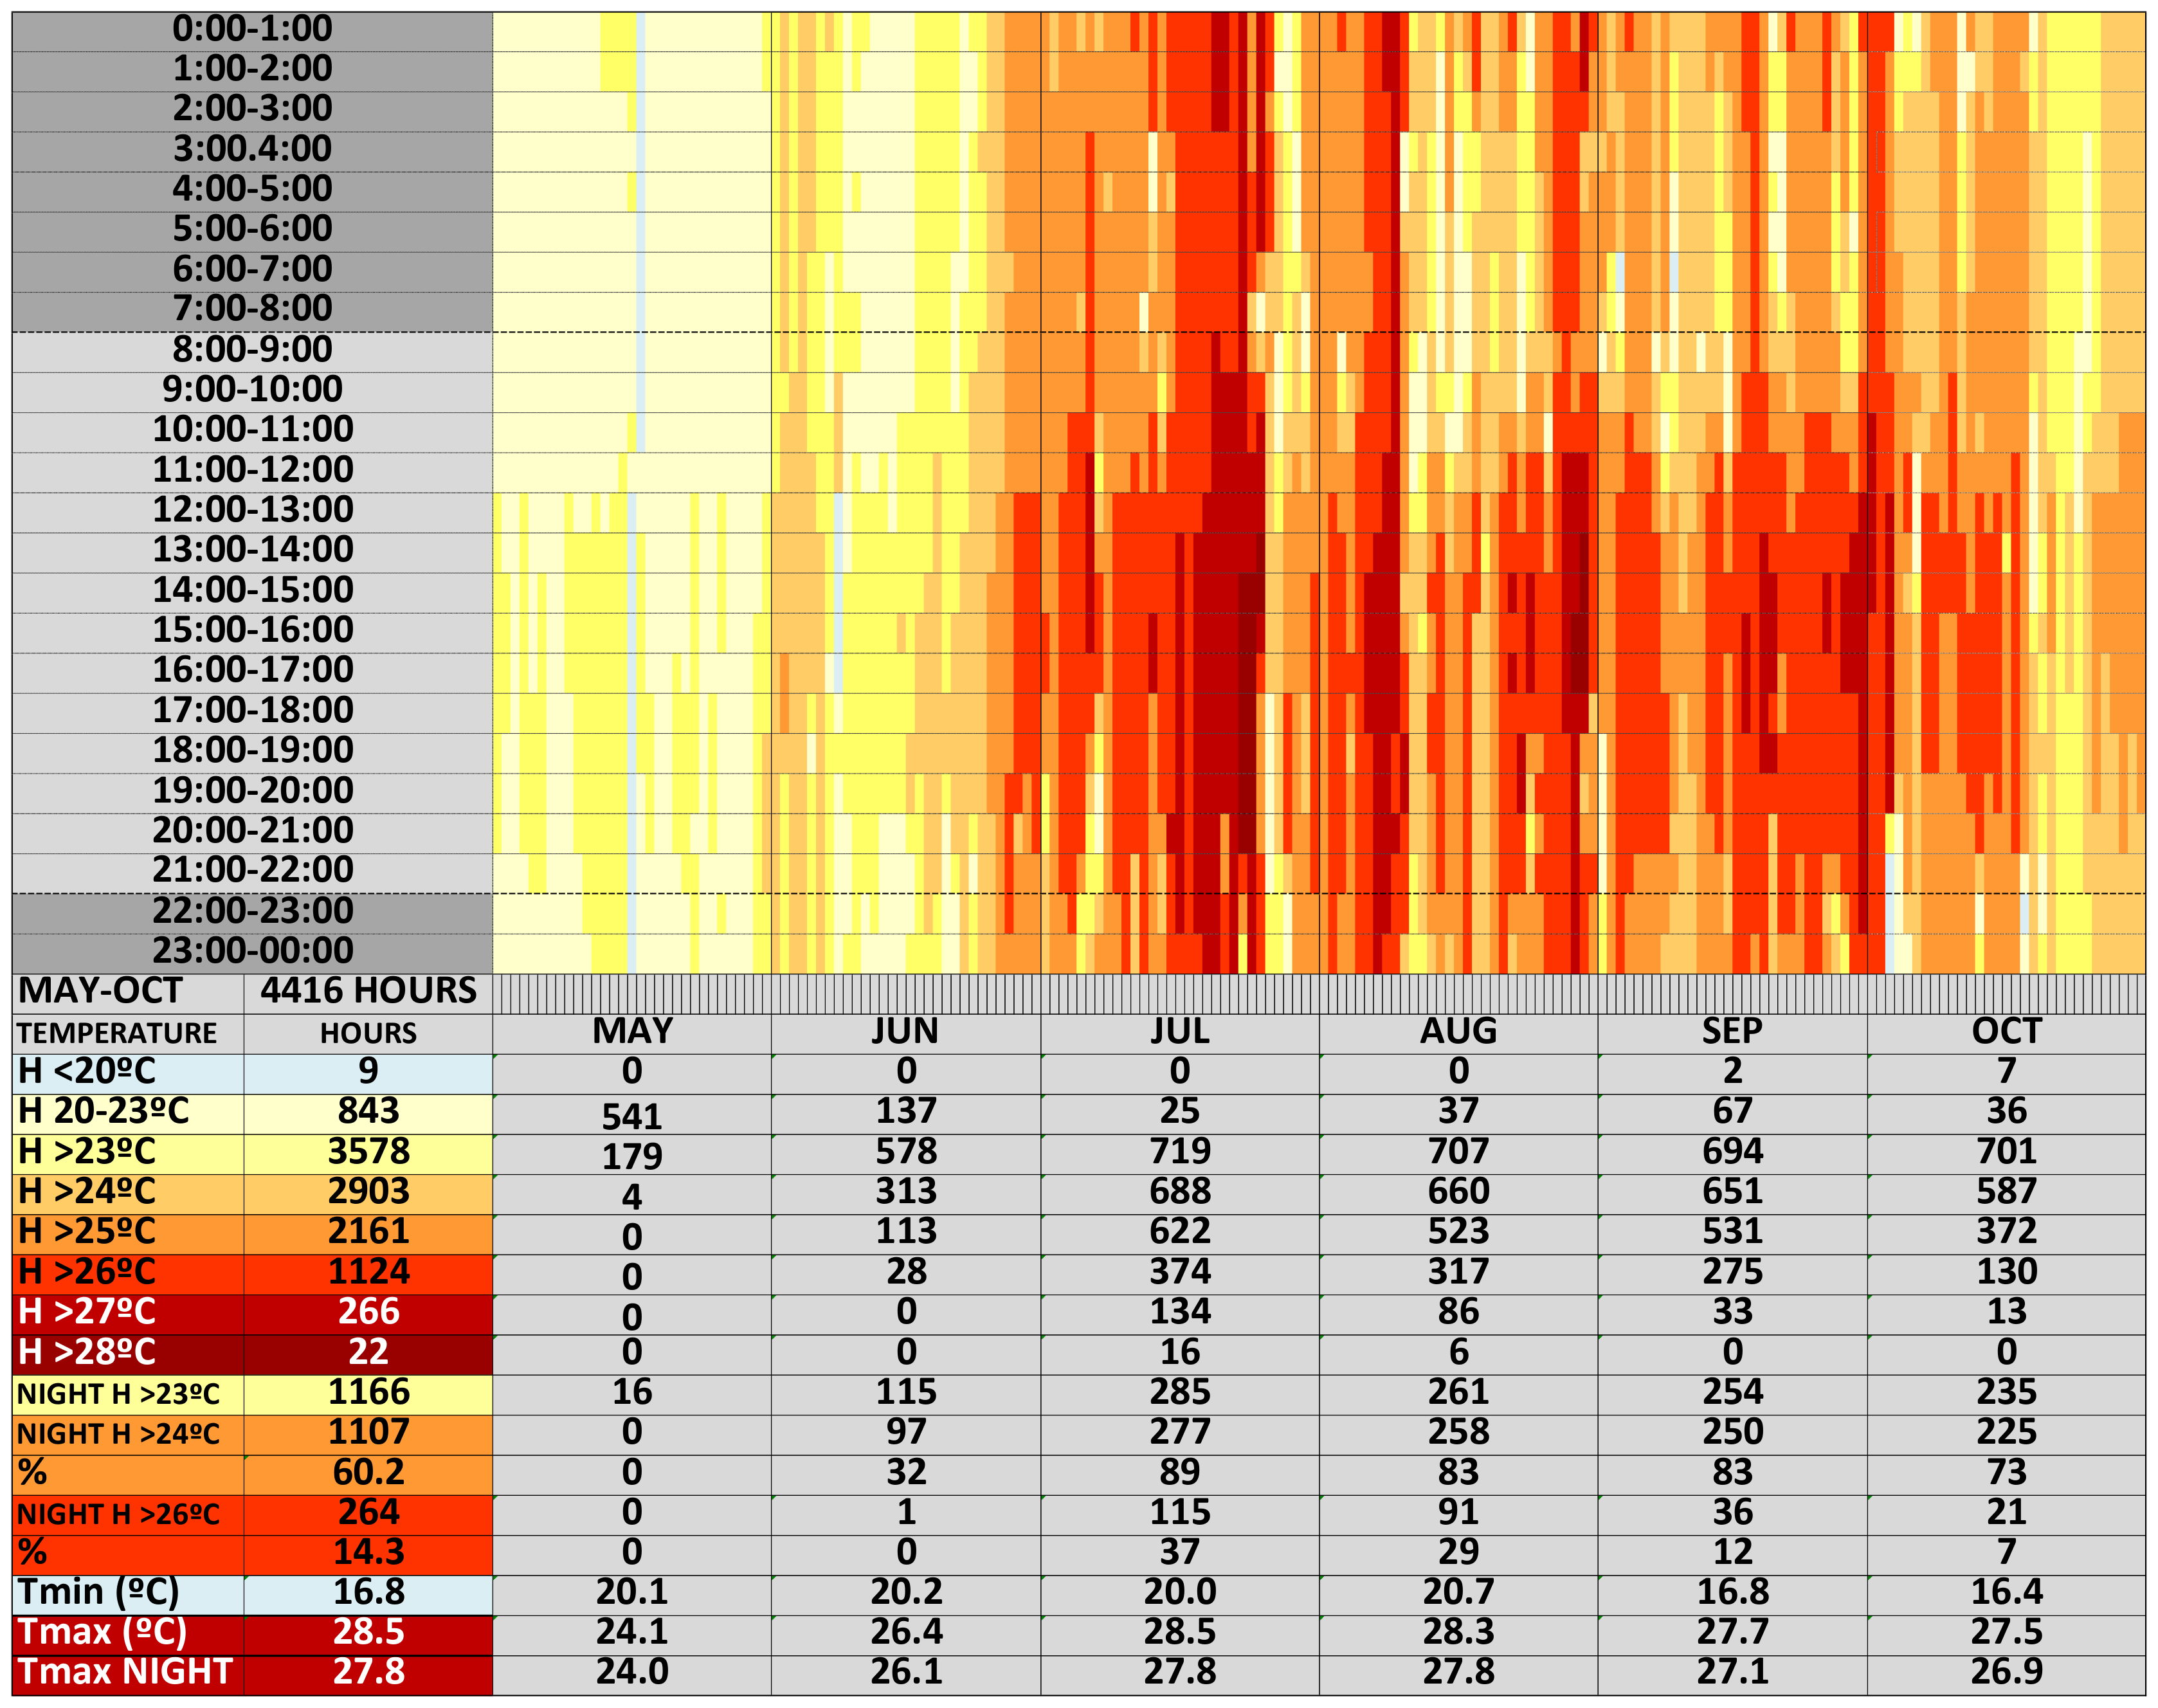
3.2.1. Apartment 1. Comfort Analysis. Period 1 (1 April 2019–31 March 2020)

The results of a full year of apartment 1 are presented. A full year is analysed, from 1 April 2019, to 31 March 2020. This allows the evaluation of comfort in the apartment during the whole year, summer and winter. The graph shows the clear grouping of temperature/humidity pairs in the comfort zones in summer and winter periods. Temperatures below 20 °C are rare, despite the fact that the heating has only been switched on during this period as a test, as stated by the user. However, a clear temperature difference is detected in the upper comfort ranges. This occurs systematically during the summer, but is even observed over long periods in October and November (Figure 8).
According to the comfort chart of the EN ISO 7730 standard, the temperature and relative humidity pairs are analysed in the period from 1 May to 30 September 2019 (Figure 9) for the summer.
The analysis of the winter period (Figure 10), October 2019–March 2020, shows that the month of October and part of November have problems of overheating. This aspect had already been predicted in the simulation phase, and is mainly due to the fact that Bilbao’s climate is highly influenced by the proximity of the sea, which is still at a very high temperature at this time of year.
Of the 3672 hours of the period, 1790 were >25 °C (48.7%). The hottest and most humid month is July (83.6% h > 25 °C) followed by August and September with similar values (70–74%). RHs fall in the range 40%–75%.
Analysis according to the adaptive model EN 15251 shows that the limit marked for Category I in said standard is exceeded often while the limit for Category II is never exceeded (Figure 11).
The following graph of the evolution of temperatures in summer (Figure 12), shows the previously mentioned problem, plotted against the adaptative limits marked by CIBSE TM:52.
In the analysis according to CIBSE TM:59, two variants are studied: dwellings with possible natural ventilation and dwellings with predominant mechanical ventilation. The degree to which these dwellings are naturally ventilated depends on proximity to traffic, proximity to the train tracks and insect nuisance due to the proximity of the river. In addition, the shading system on the inside prevents the opening of the windows when the interior sun protection is lowered. In the first case (natural ventilation), criterion 2 is not met, night hours (22–07 h) where T > 26 °C were 263, when the maximum allowed is 32 h. If it is assumed, as it can be, that mechanical ventilation predominates, total annual hours exceeding 26 °C are limited to 3% (263 h), while the monitoring campaign recorded 1125 h above that limit. Table 4 summarises the compliance of the CIBSE TM: 59 standard.
The analysis of night-time comfort made with the hourly chart (Figure 13) shows the periods with excess of night temperature in summer (May–October). The month of October is added because it has been observed that statistically it is a month with possibilities of overheating in the analysed climate. Night-time hours in summer where T > 24 °C are 61.1%; while night-time hours in summer T > 26 °C are 16.1%. The maximum temperature recorded at night was 27.8 °C.
The CIBSE TM:52 standard was originally designed for working environments in offices and spaces in general and is previous to the CIBSE TM:59 standard, intended for homes. This regulation has an adaptive approach. The inclusion of a fixed temperature limit in a percentage of hours of CIBSE TM:59, allows detecting the risk of overheating in dwellings in a more reliable way. CIBSE TM:59, with its three adaptive criteria, allows us to better visualise the resilience of a building to overheating.
If we consider the building as Category I (with occupation of elderly or other vulnerable occupants), we would obtain these results:
  • The first criterion, Hours of Exceedance (He) limited to 3% of occupied hours, is met.
  • The second criterion, Daily Weighted Exceedance (We), is met.
  • The third criterion, Upper Limit Temperature (Tupp), which that the maximum adaptative temperature limit should never be exceeded by more than 4 degrees Celsius, is met.
In the same manner, it would meet the criteria set for Category II, as it has wider margins. More valuable conclusions will be obtained about the use of this adaptive model in the later analysis of all the apartments.

3.2.2. Comparative Comfort Analysis for the 6 Monitored Apartments. Period 2 (1 October 2019–30 October 2020)

To carry out a comparative analysis, similar monitoring periods are taken from five more apartments in the building. The monitored data range from 1 October 2019, to 30 September 2020. This allows us to make a comparison in the same situations of the summer 2020. Houses 5 and 6 have a shorter monitoring period, not including the complete winter period (16 January 2020–30 September 2020)
In Table 5, it can be seen how the average temperature of the homes is very high throughout the monitoring periods. Housing 1, monitored in two periods, shows a similar range of average temperatures of 23.3–23.2 °C. The rest of the homes range from 23.2–24.7 °C. The minimum temperatures are around 19 °C. In some circumstances there are significant drops in temperature to 16 °C, corresponding to summer days when the windows have been completely opened or specific days when some windows have been left open.
As far as humidity is concerned, the values are around 50%, with no high levels of humidity, below 77% at all times, except for the monitoring device located in the kitchen of dwelling 6, where values of 94% are reached. There are no problems of excess humidity or excessively dry atmosphere.
The following table (Table 6) compiles the percentage of hours above 25 °C broken down by month. All the houses exceed the values set by the PHI and consequently the certified value of 7%.
There is no doubt, in view of the personal interviews and the comfort charts, that each user behaves very differently when it comes to the use of sun protection and ventilation, especially with regard to night-time ventilation.
Apartment 3, due to having facing facades and the best cross ventilation, reaches the most reasonable values of hours above 25 °C, not reaching 15% of the hours in a year (value that still exceeds the limit of the standard).
In personal interviews, the occupants of apartment 4 state that they suffer from heat very intensely, so they keep the windows completely open at night and the blinds down during the day. They even indicate that they prefer to cook at night to avoid introducing more heat into the house. This can be seen perfectly in Figure 14, where the effectiveness of the ventilation pattern of apartment 4 can be compared to that of apartment 2. This indicates that the opening of the windows is more intense in apartment 4, managing to reduce the night temperatures.
Table 7 summarises the number of hours in which the temperature limit set by the Passivhaus Institut is exceeded, on a monthly basis.
It is remarkable how most of the apartments can exceed the 7% stated on the Certificate or even the yearly limit of 10% set by the PHI with data from September and October only.
CIBSE Guide A establishes recommended criteria (Table 8), which are very difficult to meet, and mandatory criteria (Table 9). The most restrictive mandatory criterion limits night hours with T > 26 °C to less than 1%. This is a criterion that none of the homes approves of except for number 3, in which users declare that they sleep with the windows open from 6am, and it is also the only one that has the possibility of night-time ventilation as it has both north and south facades. The group of monitored homes records a range that goes from 0.6% of the hours to a maximum of 34.0% hours with temperature > 26 °C during the night in the case of apartment 2.
Likewise, in Table 9 we observe that dwellings 2, 5 and 6 do not comply with the criterion of hours above 28 °C during the day either, with values that reach 8.8% (apartment 2) of hours above this temperature. Apartment 3 complies with this last criterion, and maintains the lowest number of hours in which T>25 °C. Apartment 3 is also the only one that complies with the criterion of the Guide A of the CIBSE, in spite of declaring in the survey that they sleep with all the windows open during the whole night.
A detailed analysis of apartment 2, one of the worst in terms of data, allows us to observe the evolution of temperatures throughout the day, as shown in Figure 15. The low use of nocturnal ventilation means that temperatures above 26 °C stand at 977 h, 53.1% of total night-time hours, reaching maximum values of 29.1 °C, not far from the maximum daytime temperature of 29.3 °C.
CIBSE TM:59 separates dwellings into those that are naturally ventilated (Table 10) and those that are mechanically ventilated (Table 11). In principle, it can be assumed that all users have free access to natural ventilation. It is true, however, that if we look at the surveys, 13% declare that they suffer from noise from the outside frequently, and 55% punctually. In addition, two other aspects would result in windows being closed at night: the proximity of a river generates complaints about the large number of mosquitoes in the area, and the large presence of families with young children. This leads to consideration of the two options identified by CIBSE for the detection of overheating. In any case, of the monitored houses, all of them declare to make an intensive use of the ventilation except for apartments 2 and 6. In the case of apartment no. 6 this is due to the presence of young children, whose parents responsibly choose to not let windows open without parental supervision in order to prevent accidental falls, a common cause of significative injury in children in urban areas [59].
If we consider that the dwellings are naturally ventilated, that is to say, according to CIBSE TM:59, with ample opportunities to open windows in all the rooms, only apartment 3 would fulfil the two criteria necessary to indicate that they do not suffer from overheating as seen in Table 10.
This is due principally to the night-time hours where temperature is higher than 26 °C criterion, limited to 1% of annual night-time hours, which is only met by apartment 3. However, the adaptative criterion He, hours of exceedance, is failed to be met only in dwelling 2 for category I.
If, in turn, we consider that the apartments are predominantly naturally ventilated, none would comply with the criteria set in the standard.
To visualise in a graphic way the criterion Hours of Exceedance (He), the graph of the apartment 2 is shown in Figure 16. It can be clearly seen how the months of May, June, August and September have an appreciable number of hours that exceed the limits of Category I (763 h) less in Category II (75 h).
Figure 17 shows the analysis for apartment 2 the evolution of indoor temperatures, outdoor temperatures and the limits marked by the CIBSE and EN 15251 standards during the month of August 2020.
If we consider that the apartments are predominantly mechanically ventilated, none of them would meet the criterion of a maximum of 3% of total occupied hours during the year with T > 26 °C (Table 11).
The CIBSE TM:52 standard, as we have mentioned, with its three adaptive criteria, allows us to better visualise a building’s resilience to overheating. Table 12 shows that for buildings classified in Category II, all would comply, except for apartment 6, which failed two criteria simultaneously. If we consider the building as Category I (with occupation of elderly or fragile people, for example), apartments 2, 5 and 6 would present problems of overheating.
The first criterion, Hours of Exceedance (He) limited to 3% of occupied hours, is only infringed in dwelling 2 for Category I. The second criterion, which sets the Daily Weighted Exceedance (We), occurs more frequently, especially if we consider the building within Category I. The third criterion, Upper Limit Temperature (Tupp), no hour above 4 K above the maximum adaptive temperature, seems to be the criterion that is least often violated, except in apartment 6. This indicates that extreme daily temperatures are not frequent, either.

4. Discussion and Conclusions

The scientific literature has predicted in numerous occasions the issues of overheating in Passivhaus certified housing, this study further develops these predictions and presents recorded data from monitoring of a built project that shows real world results can be worse than predictions, due to wrong design decisions taken in this project, namely the interior solar protection and the lack of true cross ventilation. The analysis of overheating periods has been carried out both in quantitative terms, hours T > 25 °C and night hours >26 °C, and by means of adaptive models. Confrontation against less demanding adaptive models has shown a higher degree of compliance; however, the occupants’ responses to the POE surveys they may indicate that they are inadequate. As the British standards show, the combination of both models sets the regulatory trend.
The results show us that, in this case, the data provided by the surveys of the inhabitants are perfectly in line with the quantitative measurement criteria with fixed temperature limits.
During 2019, 95% of the inhabitants declare a thermal sensation of heat during the summer and 94% declare problems to fall asleep, with recurrent complaints in this respect. This clearly indicates a problem of overheating, since more than 20% of the inhabitants declare overheating as indicated in the CIBSE guidelines [54]. Monitoring is precise in this regard, and the limits are widely exceeded both in terms of the general calculation of hours and in terms of night-time hours, so that there can be no question that this is a widely demonstrated fact and that it coincides with the examples mentioned of similar characteristics [6].
Many answers to the User Comfort Survey deepen this problem, especially because of the poor quality of sleep. This can also be seen in the calculation of hours with excessive night-time temperature. The quantitative analysis, the limit set by the Passivhaus Institut and the criteria of CIBSE, allow us to observe that the maximum limits of hours over a set temperature are exceeded. The Passivhaus standard does not differentiate between night and day hours, while the British regulations do. This is a relevant aspect, since the night-time discomfort has much more serious consequences than the day-time one. In some cases, users declare in the surveys serious consequences on work performance due to reduced quality of their sleep.
The adaptive model sets much wider margins for comfort. CIBSE TM:52, which only uses purely adaptive criteria, sets margins that are too wide when considering Category II, and somewhat tighter in Category I. It would indicate that three of the six homes would be within the comfort threshold in Category I, and five for Category II. From the user surveys we see that this is not the perception the inhabitants have.
The combination of criteria provided by CIBSE TM:59, specific to housing, seems to have a more realistic approach to detecting overheating, by combining adaptive aspects with temperature limit thresholds. In this case, all the apartments have failed the limit values for night-time comfort except apartment 3, which has full cross ventilation. However, all of them exceed the adaptive condition for Category II.
CIBSE TM:52 allows us to better visualise and assess overheating, whether it is an occasional issue or a recurrent problem throughout the summer hours. However, it is very tolerant of the number of hours exceeding a threshold, especially at night.
Assessing night temperatures and limiting excess heat at these times seems to be a more appropriate way and one that can better approximate the perception of the phenomenon. While limiting the number of hours with temperatures above 26 °C may be a way to control excess heat, it is still too hot to sleep. CIBSE Guide A [53] recommends a temperature of no more than 23 °C for sleeping, noting that problems with sleep begin to occur at 24 °C. However, these temperatures could hardly be achieved without mechanical cooling in the monitored apartments.
The compactness of the houses and the impossibility of avoiding direct radiation and ventilating at the same time, are the aspects that generate greater difficulties. The discomfort that occurs during the hours of sleep is remarkable, so it is necessary to pay attention to the problems of overheating during these hours of the day. In light of the European regulatory trend in the search for energy savings, this discomfort will not only occur in Passivhaus certified homes but will be a widespread problem in buildings built in this climate in the coming years without adequate mitigation measures, better solar protection and adequate natural ventilation.
Due to numerous complaints from residents of the case study, investigations into possible mitigating factors in overheating are still ongoing. In a first stage, several improvements in the detection of overheating are proposed.
Possible improvements in the User Comfort Survey would include discriminating not only between sexes but also by age. The effect on older people would allow us to better define the precise limits to be considered in this type of building. In this respect, the regulations would have to be on the safety side, since the statistical possibility of a house being occupied by an older person is increasingly high and the health effects of excess heat on this range of the population are contrasted. The use of limits with Comfort Categories that include older people in all cases would allow a longer-term view of comfort in housing. It is clear that adults can cope better with overheating than older people, babies or sick people. However, this cannot be the case, as has been the case with homes without lifts, where over the years it has been found that the lack of foresight in developments has led to high cost works to integrate lifts to improve the mobility of older people. In the future, we should not have to intervene in the homes we are building to improve thermal comfort in summer because of the decisions we are now taking focused solely on energy saving for heating.
Also, an evaluation of the use of night ventilation in a precise way is necessary. Although the evaluation of monitoring allows observation of the use of natural ventilation, by contrasting the drops in indoor temperature with the opening of windows, a precise quantification of its use would improve the understanding of the phenomenon.
Other aspects such as the improvement of adequate solar protection must be studied, although the building presents constructive and typological challenges in order to implement solar protection systems on the outside, which are usually considered most effective for solar control.
These two aspects lead us to the complex evaluation of human behaviour in this type of housing. The so-called passive houses perhaps require extremely active users with the regulation of solar protection and the night ventilation. This behaviour can be thought of as easy in a house with regular occupation. However, in today’s modern life, in which dwellings remain unoccupied for long periods of the day, it is surely more realistic to resort to passive solutions which do not require human action and which allow the building to behave correctly in terms of temperature. It would help, for example, to improve fixed solar protection, thermal inertia, the use of free energy such as earth-air exchangers, favouring natural ventilation at night with passive systems, etc.
The difficult coordination between the needs in ventilation operations to achieve comfort, and the reality of users in very low energy consumption housing is shown in a very significant way in the study carried out in 10 single-family houses in Denmark (Skibet) [10,57] in which users are pointed out as the origin of the problems of overheating, such as not opening the windows for safety reasons or when outside the house, pointing out the answer of the user surveyed that “that is what the idiot architect wanted us to do” for thermal reasons. A better understanding of the physical reality of the user of the home can lead to better design. As pointed out in the aforementioned homes in Skibet, some users point out that they avoid opening windows for safety reasons, and at times they take refuge from the heat in the garage located in the north wing. In collective housing, this type of escape is almost always impossible, even less so if the development has even included a terrace to escape the heat inside.
One of the reasons for the lack of overheating prediction is that, in the previous design phase, the aspects dependent on human behaviour (mainly solar control and natural ventilation) are modelled in a dynamic simulation programme with fixed usage patterns, often seeking the best possible behaviour of the building. Some relevant authors from the Passivhaus Institut [58] point out that little is known about the acceptance of such practices among housing users, so it is difficult to determine, for example, operations with the most realistic blinds. There are, however, studies in office buildings. The study concludes that users seldom manipulate sunscreens more than once a day, and that there is considerable variation in possible manipulations between different users.
At this point, it is worth noting that the Passivhaus Standards summer comfort assessment is based on total-hours-per-annum because a simple steady state model using monthly data, such as PHPP, cannot calculate hour-by-hour performance.
Some authors, such as [60,61,62] with experimental results, point out that these operations with blinds are more determined by levels of luminance and visual comfort than by temperature. In a post-occupation study in passive houses in the United Kingdom, they support the idea that the use of exterior solar protection is more a matter of visual and psychological comfort than of temperature regulation [63].
Finally, in view of the evident reiteration of the phenomenon of overheating of buildings, both as a consequence of the improvement in the thermal envelope, the use of lightweight construction systems and the construction of increasingly smaller houses, together with the effects of climate change, it is necessary to draw up criteria that allow overheating to be detected in the preliminary stages of project design by means of regulations adapted to the temperate and warm climates of southern Europe. This first requires a clear definition, through state regulations, of whether a building is overheated or not and to adapt it to the very different climatic characteristics of Spain. This means exploring in the design phase all the possibilities of passive architecture (solar protection, ventilation, etc.) that will allow avoiding having to resort to implementing active cooling systems in the future, with almost no implementation in the climate in which these dwellings are located.

Author Contributions

I.R.V. prepared and designed the concept for this article; I.R.V. and J.O. performed the experiments, simulations, and wrote the manuscript; X.O. supervised, provided sources, comments, and suggestions for the paper. All authors have read and agreed to the published version of the manuscript.

Funding

The Department of Housing of the Basque Government has financed this research within the “Call for research and dissemination activities at the Basque Country University UPV/EHU and the Higher Technical School of Architecture in 2020”.

Acknowledgments

The authors would like to thank the Municipal Housing Agency of Bilbao and the inhabitants of the Bolueta Tower that have participated in the study, as well as Rubén Llanera from SAFER Instrument.

Conflicts of Interest

The authors declare no conflict of interest.

References

  1. Directive 2010/31/EU of the European Parliament and of the Council of 19 May 2010 on the energy performance of buildings. Off. J. Eur. Union 2010, 3, 124–146.
  2. Commission Recommendation (EU) 2016/1318 of 29 July 2016 on Guidelines for the Promotion of Nearly Zero-Energy Buildings and Best Practices to Ensure That, by 2020, All New Buildings are Nearly Zero-Energy Buildings. Available online: https://eur-lex.europa.eu/legal-content/EN/TXT/?uri=CELEX%3A32016H1318 (accessed on 1 October 2020).
  3. Hermelink, A.; Schimschar, S.; Boermans, T.; Pagliano, L.; Zangheri, P.; Armani, R.; Voss, K.; Musall, E.; Ecofys. Towards Nearly Zero-Energy Buildings. Definition of Common Principles Under the EPBDFinal ReportEcofys. 2012. Available online: https://ec.europa.eu/energy/sites/ener/files/documents/nzeb_full_report.pdf (accessed on 1 October 2020).
  4. Ministères de la Transition Ecologique, France. Réglementation Thermique RT-2020. Available online: https://www.rt-batiment.fr/ and http://www.batiment-energiecarbone.fr/; (accessed on 1 October 2020).
  5. Fletcher, M.J.; Johnston, D.K.; Glew, D.W.; Parker, J.M. An empirical evaluation of temporal overheating in an assisted living Passivhaus dwelling in the UK. Build. Environ. 2017, 121, 106–118. [Google Scholar] [CrossRef]
  6. Sameni, S.M.T.; Gaterell, M.; Montazami, A.; Abdullahi, A. Overheating investigation in UK social housing flats built to the Passivhaus standard. Build. Environ. 2015, 92, 222–235. [Google Scholar] [CrossRef] [Green Version]
  7. Rory, V.J.; Goodhewb, S.; de Wilde, P. Measured indoor temperatures, thermal comfort and overheating risk: Post-occupancy evaluation of low energy houses in the UK. Energy Procedia 2016, 88, 714–720. [Google Scholar] [CrossRef] [Green Version]
  8. Mitchell, R.; Natarajan, S. Overheating Risk in Passivhaus Dwellings. Building Services Engineering Research and Technology. Sage J. 2019, 40, 446–469. [Google Scholar] [CrossRef]
  9. Mcleod, R.S.; Hopfe, C.J.; Kwan, A. An Investigation into Future Performance and Overheating Risks in Passivhaus Dwellings. Build. Environ. 2013, 70, 189–209. [Google Scholar] [CrossRef] [Green Version]
  10. Larsen, T.S.; Jensen, R.L. Comparison of measured and calculated values for the indoor environment in one of the first Danish Passive houses. In Proceedings of the Building Simulation 2011: 12th Conference of International Building Performance Simulation Association, Sydney, Australia, 14–16 November 2011. [Google Scholar]
  11. Carrilho, D.G.; Augusto, A.; Lerer, M.M. Solar Powered Net Zero Energy Houses for Southern Europe: Feasibility Study. Sol. Energy 2012, 86, 634–646. [Google Scholar] [CrossRef]
  12. Causone, F.; Tatti, A.; Pietrobon, M.; Zanghierlla, F.; Pagliano, L. Yearly Operational Performance of a nZEB in the Mediterranean Climate. Energy Build. 2019, 198, 243–260. [Google Scholar] [CrossRef] [Green Version]
  13. Costanzo, V.; Fabbri, K.; Piraccini, S. Stressing the Passive Behavior of a Passivhaus: An Evidence-Based Scenario Analysis for a Mediterranean Case Study. Build. Environ. 2018, 142, 265–277. [Google Scholar] [CrossRef]
  14. Colclough, S.; Kinnane, O.; Hewitt, N.; Griffiths, P. Investigation of nZEB social housing built to the Passive House standard. Energy Build. 2018, 179, 344–359. [Google Scholar] [CrossRef]
  15. Morey, J.; Beizaee, A.; Wright, A. An investigation into overheating in social housing dwellings in central England. Build. Environ. 2020, 176, 106814. [Google Scholar] [CrossRef]
  16. Rodriguez Vidal, I. Evaluation of the Passivhaus Construction Standard and its Application in the Climatic Environment of the Basque Autonomous Community and the Navarra Foral Community. Ph.D. Thesis, University of the Basque Country, Leioa, Spain, 12 April 2016. [Google Scholar]
  17. Kovats, S.; Hajat, S. Heat stress and public health: A critical review. Annu. Rev. Public Health 2008, 29, 41–55. [Google Scholar] [CrossRef] [PubMed]
  18. Fouillet, A.; Rey, G.; Laurent, F.; Pavillon, G.; Bellec, S.; Guihenneuc-Jouyaux, C.; Clavel, J.; Jougla, E.; Hemon, D. Excess mortality related to the August 2003 heat wave in France. Int. Arch. Occup. Environ. Health 2006, 80, 16–24. [Google Scholar] [CrossRef] [PubMed] [Green Version]
  19. Vautard, R.; Boucher, O.; van Oldenborgh, G.J.; Otto, F.; Haustein, K.; Vogel, M.M.; Seneviratne, S.I.; Soubeyroux, J.M.; Kreienkamp, F.; Stott, P.; et al. Human Contribution to the Record-Breaking July 2019 Heat Wave in Western Europe. Available online: https://www.ipsl.fr/en/News/News-releases/Human-contribution-to-the-record-breaking-July-2019-heat-wave-in-Western-Europe (accessed on 16 November 2020).
  20. Kosatsky, T. The 2003 European Heat Waves. Eurosurveillance 2005, 10, 1–9. [Google Scholar] [CrossRef]
  21. Instituto Nacional de Estadística. Statistics National Institute. Press Release. 24 November 2005. Available online: https://www.ine.es/prensa/np393.pdf (accessed on 1 October 2020).
  22. WHO. Heat-Waves: Risks and Responses; Health and Global Environmental Change Series No. 2, Energy, Environment and Sustainable Development: Copenhagen, Denmark, 2004; Available online: https://www.euro.who.int/__data/assets/pdf_file/0008/96965/E82629.pdf (accessed on 1 October 2020).
  23. Menne, B.; Matthies, F. Improving Public Health Responses to Extreme Weather/Heat-Waves: EuroHEAT; WHO: Copenhagen, Denmark, 2009; Available online: https://www.euro.who.int/__data/assets/pdf_file/0010/95914/E92474.pdf?ua=1 (accessed on 1 October 2020).
  24. Ministerio de Sanidad y Consumo. Plan Nacional de Actuaciones Preventivas de los Efectos del Exceso de Temperaturas Sobre la Salud. Available online: https://www.mscbs.gob.es/ciudadanos/saludAmbLaboral/planAltasTemp/2020/Plan_nacional_actuaciones_preventivas.htm (accessed on 1 October 2020).
  25. EUROSTAT Statistics Explained. Statistics on Housing. Available online: https://ec.europa.eu/eurostat/statistics-explained/index.php?title=Housing_statistics/es#Tipo_de_vivienda (accessed on 1 October 2020).
  26. Eustat-Euskal Estatistika Erakundea-Instituto Vasco de Estadística. Available online: https://www.eustat.eus/elementos/ele0017300/a-1-de-enero-de-2019-el-numero-de-viviendas-en-la-ca-de-euskadi-habia-crecido-en-5/not0017383_c.html (accessed on 1 October 2020).
  27. The Hague: Ministry of the Interior and Kingdom Relations. Housing Statistics in the European Union; Dol, K., Haffner, M., Eds.; OTB Research Institute for the Built Environment, Delft University of Technology: Delft, The Netherlands, September 2010.
  28. Instituto Nacional de Estadística. Statistics National Institute. Continuous Household Survey. 2019. Available online: https://www.ine.es/dyngs/INEbase/es/operacion.htm?c=Estadistica_C&cid=1254736176952&menu=ultiDatos&idp=1254735572981#:~:text=La%20Encuesta%20continua%20de%20hogares,de%20las%20viviendas%20que%20habitan (accessed on 1 October 2020).
  29. Instituto Nacional de Estadística. Statistics National Institute. Census 2011. Available online: https://www.ine.es/censos2011_datos/cen11_datos_inicio.htm (accessed on 1 October 2020).
  30. Acero, J.A.; Arrizabalaga, J.; Kupski, S.; Katzschner, L. Urban heat island in a coastal urban area in northern Spain. Theor. Appl. Climatol. 2013, 113, 137–154. [Google Scholar] [CrossRef]
  31. Gobierno Vasco, Departamento de Vivienda y Asuntos Sociales. Ordenanzas de Diseño de Viviendas de Protección Oficial. Boletín Of Gob. Vasco; 2009. Available online: https://www.euskadi.eus/gobierno-vasco/-/eli/es-pv/o/2009/02/12/(1)/dof/spa/html/ (accessed on 1 October 2020).
  32. Gobierno Vasco. Proyecto de Decreto por el que se Regula las Condiciones de Habitabilidad y las Normas de Diseño de las Viviendas y Alojamientos Dotacionales en la Comunidad Autónoma del País Vasco. Available online: https://www.euskadi.eus/informacion_publica/proyecto-de-decreto-por-el-que-se-regula-las-condiciones-de-habitabilidad-y-las-normas-de-diseno-de-las-viviendas-y-alojamientos-dotacionales-en-la-comunidad-autonoma-del-pais-vasco/web01-tramite/es/ (accessed on 1 October 2020).
  33. Código Técnico de la Edificación. Documento Básico Ahorro de Energía HE1: Limitación de la Demanda Energética. Madrid. December 2019. Available online: https://www.codigotecnico.org/DocumentosCTE/AhorroEnergia.html (accessed on 1 October 2020).
  34. Código Técnico de la Edificación. Herramienta Unificada Lider-Calener (HULC). Available online: https://www.codigotecnico.org/Programas/HerramientaUnificadaLIDERCALENER.html; (accessed on 1 October 2020).
  35. Instituto Nacional de Estadística. Statistics National Institute. Household and Environment Survey 2008Housing. Available online: https://www.ine.es/jaxi/Tabla.htm?path=/t25/p500/2008/p01/l0/&file=01013c.px&L=0 (accessed on 1 October 2020).
  36. Idealista Home Sales Website. Study of the Percentage of Homes with Air Conditioning for Sale in 2018. Available online: https://www.idealista.com/news/inmobiliario/vivienda/2018/07/17/766582-solo-un-31-de-las-casas-en-espana-tiene-aire-acondicionado (accessed on 1 October 2020).
  37. Zero Carbon Hub. Overheating in Homes, The Big Picture; Full Report; Zero Carbon Hub: London, UK, 2015; Available online: http://www.zerocarbonhub.org/sites/default/files/resources/reports/ZCH-OverheatingInHomes-TheBigPicture-01.1.pdf (accessed on 1 October 2020).
  38. Public Health England. Heatwave Plan for England. 2015; London, UK. Available online: https://assets.publishing.service.gov.uk/government/uploads/system/uploads/attachment_data/file/888668/Heatwave_plan_for_England_2020.pdf (accessed on 1 October 2020).
  39. Department for Communities and Local Government. Investigation into Overheating in Homes, Literature Review; Department for Communities and Local Government (DCLG): London, UK, 2012; ISBN 9781409835929.
  40. Department for Communities and Local Government. Investigation into Overheating in Homes, Analysis of Gaps and Recommendations; Department for Communities and Local Government (DCLG): London, UK, 2012; ISBN 978-1-4098-3591-2.
  41. Department for Environment Food and Rural Affairs. The National Adaptation Programme: Making the Country Resilient to a Changing Climate; Internet; Department for Environment Food and Rural Affairs: London, UK, 2013; ISBN 978-0-10-851238-4. Available online: https://assets.publishing.service.gov.uk/government/uploads/system/uploads/attachment%20data/file/209866/pb13942-nap-20130701.pdf (accessed on 1 October 2020).
  42. NHBC Foundation. Understanding Overheating–Where to Start: An Introduction for House Builders and Designers; NHBC Foundation: Milton Keynes, UK, 2012. [Google Scholar]
  43. Pathan, A.; Mavrogianni, A.; Summerfield, A.; Oreszczyn, T.; Daviesa, M. Monitoring summer indoor overheating in the London housing stock. Energy Build. 2017, 141, 361–378. [Google Scholar] [CrossRef]
  44. Lomas, K.L.; Porritt, S.M. Overheating in Buildings: Lessons from Research. Building Research and Information. Available online: https://doi.org/10.1080/09613218.2017.1256136 (accessed on 1 October 2020).
  45. Passive House Database. Available online: https://passivehouse-database.org/ (accessed on 1 October 2020).
  46. Hidalgo, J.M.; Psomas, T.; García-Gáfaro, C.; Heiselberg, P.; Millán, J.A. Overheating Assessment of a Passive House Case Study in Spain, Madrid. Spain, 2015–AIVC. Available online: https://www.aivc.org/sites/default/files/62.pdf (accessed on 1 October 2020).
  47. Costanzo, V.; Echarri-Iribarren, V.; Sotos-Solano, C.; Espinosa-Fernández, A.; Prado-Govea, R. The Passivhaus Standard in the Spanish Mediterranean: Evaluation of a House’s Thermal Behaviour of Enclosures and Airtightness. Sustainability 2019, 11, 3732. [Google Scholar] [CrossRef] [Green Version]
  48. Bunyesc, J. Passive house in Mediterranean climate. In Proceedings of the 16th International Conference on Passive Houses, Hannover, Germany, 4–5 May 2012; pp. 365–370. [Google Scholar]
  49. Attia, S.; Eleftheriou, P.; Xeni, F.; Morlot, R.; Menezo, C.; Kostopoulos, V.; Betsi, M.; Kalaitzoglou, I.; Pagliano, L.; Cellura, M.; et al. Overview and Future Challenges of nearly Zero Energy Buildings (nZEB) Design in Southern Europe. Energy Build. 2017, 155, 439–458. [Google Scholar] [CrossRef]
  50. AENOR. Ergonomics of the Thermal Environment-Analytical Determination and Interpretation of Thermal Comfort using Calculation of the PMV and PPD Indices and Local Thermal Comfort Criteria (UNE-EN ISO 7730:2005). 2006. Available online: https://global.ihs.com (accessed on 1 October 2020).
  51. Ministerio de Industria, Energía y Turismo. Reglamento de Instalaciones Térmicas En Los Edificios. Boletín Off. Estado 2007, 207, 35931–35984. [Google Scholar]
  52. AENOR. Indoor Environmental Input Parameters for Design and Assessment of Energy Performance of Buildings Addressing Indoor Air Quality, Thermal Environment, Lighting and Acoustics (UNE-EN 15251:2008); AENOR: Madrid, Spain, 2008. [Google Scholar]
  53. Chartered Institution of Building Services Engineers. CIBSE Guide A: Environmental Design; CIBSE: London, UK, 2015; ISBN 9781906846541. [Google Scholar]
  54. Chartered Institution of Building Services Engineers. The Limits of Thermal Comfort: Avoiding Overheating in European Buildings; CIBSE TM52: 2013; Chartered Institution of Building Services Engineers: London, UK, 2013; ISBN 978-1-906846-34-3. [Google Scholar]
  55. Chartered Institution of Building Services Engineers. Methodology for the Assessment of Overheating Risk in Homes; CIBSE TM59: 2017; Chartered Institution of Building Services Engineers: London, UK, 2017; ISBN 978-1-912034-18-5. [Google Scholar]
  56. Mulville, M.; Stravoravdis, S. The impact of regulations on overheating risk in dwellings. Build. Res. Inf. 2016, 44, 520–534. [Google Scholar] [CrossRef] [Green Version]
  57. Brunsgaard, C. Understanding of Danish Passive Houses based on Pilot Project Comfort Houses. Ph.D. Thesis, Aalborg University, Aalborg, Denmark, 2010. [Google Scholar]
  58. Schnieders, J. Passive Houses in South West Europe: A Quantitative Investigation of Some Passive and Active Space Conditioning Techniques for Highly Energy Efficient Dwellings in the South West European Region, 2nd ed.; Passivhaus Institut: Darmstadt, Germany, 2009. [Google Scholar]
  59. Benoit, R.; Watts, D.D.; Dwyer, K.; Kaufmann, C.; Fakhry, S. Windows 99: A Source of Suburban Pediatric Trauma. J. Trauma Inj. Infect. Crit. Care 2000, 49, 477–482. [Google Scholar] [CrossRef] [PubMed]
  60. Inkarojrit, V. Balancing Comfort: Occupants’ Control of Windows Blind in Private Offices. Ph.D. Thesis, University of California, Berkeley, CA, USA, 2005. Available online: http://citeseerx.ist.psu.edu/viewdoc/download?doi=10.1.1.66.3256&rep=rep1&type=pdf (accessed on 1 October 2020).
  61. Raja, I.; Nicol, F.; McCartney, K.; Humphries, M. Thermal comfort: Use of controls in naturally ventilated buildings. Energy Build. 2001, 33, 235–244. [Google Scholar] [CrossRef]
  62. Nicol, F. Characterising occupant behaviour in buildings: Towards a stochastic model of occupant use of windows, lights, blinds, heaters and fans. In Proceedings of the 7th International IBPSA Conference, Rio de Janeiro, Brazil, 13–15 August 2001; pp. 1073–1078. [Google Scholar]
  63. Bere Architects. Larch House e Soft Landings Stage 4 Initial Aftercare Workshop in Video Interview with the Occupants of the Larch Passivhaus, Ebbw Vale Wales. 2012. Available online: https://bere.co.uk/ (accessed on 1 October 2020).
Figure 1. Average house size in the metropolitan area of Bilbao, with an indication of the case study location. Source: Authors on the base of elDiario.es, National Institute of Statistics (Instituto Nacional de Estadística, INE) and the Spanish Cadastre.
Sustainability 12 09630 g001
Figure 2. (Left) View of the monitored building. The 2nd tower, still in construction when the photo was taken, can be seen in the background. (Center) Close up of the façade, where the black aluminium façade panels and the size of the windows can be appreciated. (Right) View of the window of a living room, with the interior sunscreen. Source: Authors.
Sustainability 12 09630 g002
Figure 3. Typical floorplan of the Bolueta Tower. The monitored apartments are highlighted in red, with indication of the storey. The western third (left in the image) rises to 27 floors, while the remaining two thirds have 9 floors. Source: Authors.
Sustainability 12 09630 g003
Figure 4. General scheme of remote monitoring and data collection with T&D Devices. Source: T&D RTR-500 Series User Manual.
Sustainability 12 09630 g004
Figure 5. (a) T&D TR-72wb. (b) Remote data collection scheme for T&D TR-7wb Series equipment. Source: T&D TR-7wb Series User Manual.
Sustainability 12 09630 g005
Figure 6. Outside thermal comfort in the 2019 summer according to EN ISO 7730.
Sustainability 12 09630 g006
Figure 7. (Left) Visualisation of the apartments who took the Comfort Survey. The dots in within each apartment depict the number of occupants in each dwelling who took the Survey. (Right) Visualisation of the monitored apartments.
Sustainability 12 09630 g007
Figure 8. Apartment 1. Comfort according to EN ISO 7730 (full year, period 1: 1 April 2019–31 March 2020).
Sustainability 12 09630 g008
Figure 9. Apartment 1. Summer comfort according to EN ISO 7730. In addition to the May-Sept months in the standard, data from October was added to the summer due to the high recorded temperatures. (01 May 2019–31 October 2019).
Sustainability 12 09630 g009
Figure 10. Apartment 1. Winter comfort according to EN ISO 7730. October was deduced from the winter period as explained above. (1 November 2019–30 April 2020).
Sustainability 12 09630 g010
Figure 11. Apartment 1. Adaptative comfort according to EN ISO 15251 (1 May 2019–31 October 2019).
Sustainability 12 09630 g011
Figure 12. Apartment 1. Evolution of internal temperature plotted against the adaptative limits of CIBSE TM: 52 (1 May 2019–30 September 2019).
Sustainability 12 09630 g012
Figure 13. Apartment 1. Night-time comfort for summer 2019, incl. October (1 May 2019–31 October 2019).
Sustainability 12 09630 g013
Figure 14. Comparison of the EN 7730 graphs in summer of apartments 2 (top) and 4 (bottom) in the monitored period 1 May-30 September 2020 and October 2019.
Sustainability 12 09630 g014
Figure 15. Apartment 2. Night-time comfort for summer 2020 (1/05/2020-30/09/2020), incl. October 2020.
Sustainability 12 09630 g015
Figure 16. Apartment 2. Adaptative comfort according to standards EN 15251 and CIBSE TM:59.
Sustainability 12 09630 g016
Figure 17. Apartment 2. Adaptative comfort according to standards EN 15251 and CIBSE TM:59 in August 2020.
Sustainability 12 09630 g017
Table 1. Summary of fixed-threshold and adaptative model thermal comfort standards.
StandardOverheating Criteria
Passivhaus InstitutLimits number hours T > 25 °C
Max. hours where T < 25 °C: 10%, recommends < 5%
Number hours T > 25 °C
  • > 15% Catastrophic
  • 10–15%, Poor
  • 5–10%, Acceptable
  • 2–5%, Good
  • 0–2%, Excellent
CIBSE Guide A [53]Tmax 25 °C for living rooms and 23 °C for bedrooms
Overheating when T > 28 °C 1% for living rooms and T > 26 °C 1% for bedrooms
ISO 7730 [50]Predominantly mechanically ventilated buildings
Rhmin = 40% and for maximum Rhmax = 60%
  • Category A: Tmin 21 °C, Tmax 25.5 °C
  • Category B: Tmin 20 °C, Tmax 26 °C
  • Category C: Tmin 19 °C, Tmax 27 °C
EN 15251 [52]Predominantly naturally ventilated buildings
  • Category I: Buildings with vulnerable occupants, i.e., elderly citizens
Upper temperature limit:
Tcomf = 0.33 Trm + 18.8 + 2
  • Category II: Other buildings
Upper temperature limit:
Tcomf = 0.33 Trm + 18.8 + 3
When the upper temperature limits according to the categories cannot be guaranteed by passive means, mechanical cooling is unavoidable.
CIBSE TM:52 [54]Predominantly naturally ventilated buildings
  • Criterion 1: hours of exceedance (He) 1
  • Criterion 2: daily weighted exceedance (We) 2
  • Criterion 3: upper limit temperature (Tupp) 3
A room is overheated if any two of the three following criteria fail.
CIBSE TM:59 [55]Predominantly naturally ventilated buildings
(a) Living rooms, kitchens and bedrooms:
The number of hours during which ∆T is greater than or equal to a 1 K during the period from May to September will not be more than 3% of occupied hours. (CIBSE Criteria TM52 1: Hours of He Exceedance).
(b) Bedrooms only:
To ensure comfort during sleeping hours the operating temperature in the bedroom from 10 p.m. to 7 a.m. should not exceed 26 °C for more than 1% of the annual hours (32 h).
Predominantly mechanically ventilated:
Living rooms, kitchens and bedrooms:
Annual hours ∆T > 1 K less than 3% of occupied hours
1 The first criterion sets a limit for the number of hours that the operating temperature can exceed the comfort temperature threshold (upper limit of the comfort temperature range) by 1 K or more during the occupied hours of a normal period outside the heating season (1 May to 30 September). 2 The second criterion refers to the severity of overheating on any given day, which can be as important as its frequency, the level of which is a function of both the increase in temperature and its duration. This criterion sets a daily limit for acceptability. 3 The third criterion establishes an absolute maximum daily temperature for a room, beyond which the level of overheating is unacceptable.
Table 2. Summarised characteristics of the monitored dwellings.
Dwelling123456
Monitoring startMarch 2019August 2019August 2019August 2019January 2020January 2020
Occupancy1p2p3p2p4p4p
OrientationS-WS-EN-SSSS-W
No. of orientations222112
Cross ventilationMediumMediumHigh NoNoMedium
Floor27th5th8th4th8th10th
SA, Suseful (m2)82.4268.6681.8254.5178,3782.42
No. of Bedrooms323233
No. of Bathrooms212122
Blind usage freq.1HighLowMediumHighMediumLow
Window opening freq.1HighLowHighHighHighLow
1 Blind usage and window opening frequencies obtained through the POE Survey.
Table 3. Summer 2019 (May–September). Summarised data recorded at Abusu weather station.
SummerMayJuneJulyAugustSeptember
Hours < 20 °C2525 (68.8%)697 (93.6%)562 (78.1%)357 (48.0%)388 (52.1%)521 (72.4%)
Hours >25°C265 (7.2%)12 (1.6%)48 (6.7%)82 (11%)91 (12.2%)32 (4.4%)
Hours >28 °C96 (2.6%)5 (0.7%)30 (4.2%)32 (4.3%)24 (3.2%)5 (0.7%)
Max. T. [°C]37.529.437.536.733.229.5
Hours RH > 70%2670 (72.7%)522 (70.3%)502 (69.8%)561 (75.5%)552 (74.3%)533 (74.1%)
Max. RH [%]98.098.098.098.098.098.0
Table 4. Apartment 1. Compliance with CIBSE TM:59. Summer 2019 (1 May 2019–31 September 2019).
Predominantly Naturally Ventilated 1
DwellingCategoryHours of Exceedance, HeNight hours T > 26 °COverheating 3
Hours%LimitHours%Limit
1I20.0%3%2748.4%1%Yes
II00.0%3%2748.4%1%Yes
Predominantly Mechanically Ventilated 2
DwellingHours T > 26 °COverheating
Hours%Limit
1112512.84%3%Yes
1 Predominantly naturally ventilated: those with heat recovery mechanical ventilation are included in this category if natural ventilation is possible during the summer.2 Predominantly mechanically ventilated: those where there is no possibility of natural ventilation or a limited possibility (e.g., due to poor outdoor air quality or high noise levels).3 Overheating exists if either criterion is failed.
Table 5. Summary of the recorded temperature and relative humidity, all apartments.
Monitoring Period (1 April 2019–31 March2020)
DwellingTemperature (°C)Relative Humidity (%)Absolute Humidity (g/kg)
TmedTminTmaxRHmedRHminRHmaxWmedWminWmax
123.319.528.84935769.055.6216.04
Monitoring Period (1 October 2019–30 September 2020)
DwellingTemperature (°C)Relative Humidity (%)Absolute Humidity (g/kg)
TmedTminTmaxRHmedRHminRHmaxWmedWminWmax
123.216.429.15136779.345.6315.59
224.619.429.34729729.244.4715.90
323.418.228.35026779.194.3016.69
423.915.828.84923769.024.4414.87
Monitoring Period (16 January 2020–30 September 2020)1
DwellingTemperature (°C)Relative Humidity (%)Absolute Humidity (g/kg)
TmedTminTmaxRHmedRHminRHmaxWmedWminWmax
5124.718.532.05026699.974.6315.18
6123.815.840.45224949.673.5917.25
1 The monitoring period is shorter than one complete year.
Table 6. Compliance with the Passivhaus overheating and excessive humidity limits.
Monitoring Period(1 April 2019–31 March 2020)
DwellingHours 1%Overheat.PerformanceHours 2%Humid.
1217024.0YesCatastrophic100011.4%No
Monitoring Period(1 October 2019–30 September 2020)
DwellingHours 1%Overheat.PerformanceHours 2%Humid.
1220225.1YesCatastrophic104111.9%No
2385844.0YesCatastrophic8499.7%No
3114313.0YesPoor8589.9%No
4179020.4YesCatastrophic6277.2%No
Monitoring Period(16 January 2020–30 September 2020)3
DwellingHours 1%Overheat.PerformanceHours 2%Humid.
53246728.1%YesCatastrophic115913.2%No
63154718.8%YesCatastrophic91010.4%No
1 Number of hours in which internal air temperature is higher than 25 °C. It must not exceed 10% in a year. 2 Number of hours in which absolute humidity of internal air W (g/kg) is higher than 12 g/kg. It must not exceed 20% in a year. 3 The monitored period is shorter than one complete year.
Table 7. Percentage in which T > 25 °C in the monitored apartments.
Monitoring Period
(1 April 2019–31 March 2020)(1 October 2019–30 September 2020)(16 January 2020–30 September 2020)
YearMonthDwe.YearMonthDwellingMonthDwelling
1123456
2020January0.02020January0.00.00.05.2January1.50
2020February0.02020February0.00.01.131.0February12.30.5
2020March0.02020March0.00.00.04.2March7.91.3
2019April0.02020April0.02.29.39.7April26.84.7
2019May0.02020May18.665.215.618.4May38.625.0
2019June15.72020June18.695.812.010.8June23.131.2
2019July83.62020July68.2100.028.637.1July57.348.4
2019August70.32020August72.199.342.059.3August92.758.7
2019September74.32020September70.194.439.543.5September76.754.4
2019October50.12019October50.162.116.119.4OctoberXX
2019November1.12019November1.12.70.10.4NovemberXX
2019December0.02019December0.00.00.16.7DecemberXX
2019Year24.82019Year25.144.013.020.4Year28.218.8
Table 8. Compliance with the recommended criteria of CIBSE Guide A. All monitored apartments.
Monitoring Period(1 April 2019–31 March 2020)
Daytime Hours T > 25 °C (Living Rooms)Daytime Hours T > 23 °C (Bedrooms)Night Hours T > 24 °C (Bedrooms)
DwellingHours 1%Hours 2%Hours 3%
1145426.9134641.3103031.6
Monitoring Period( 1 October 2019–30 September 2020)
DwellingDaytime hours T > 25 °C (living rooms)Daytime hours T > 23 °C (bedrooms)Night hours T > 24 °C (bedrooms)
Hours 1%Hours 2%Hours 3%
1142726.3167251.2118336.2
2243151.2193267.9169159.5
398217.9149445.567120.4
4136825.0243774.2128339.1
Monitoring Period(16 January 2020–30 September 2020)4
DwellingDaytime hours T > 25 °C (living rooms)Daytime hours T > 23 °C (bedrooms)Night hours T > 24 °C (bedrooms)
Hours 1%Hours 2%Hours 3%
54176545.7212291.7140560.7
64114629.7141060.993940.6
1 Number of daytime hours in which internal air temperature is higher than 25 °C (living rooms). 2 Number of daytime hours in which internal air temperature is higher than 23 °C (bedrooms). 3 Number of daytime hours in which internal air temperature is higher than 24 °C (bedrooms). 4 The monitored period is shorter than one complete year.
Table 9. Compliance of the mandatory criteria of CIBSE Guide A. All monitored apartments.
Monitoring period(1 April 2019–31 March 2020)
DwellingDaytime Hours 1 T > 28 °C (living rooms)Night Hours 2 T > 26 °C (bedrooms)Overheating 3
Hours 1%LimitHours 2%Limit
1220.41%2748.41%Yes
Monitoring Period( 1 October 2019–30 September 2020)
DwellingDaytime hours 1 T > 28 °C (living rooms)Night hours 2 T > 26 °C (bedrooms)Overheating 3
Hours 1%LimitHours 2%Limit
1520.91%33010.11%Yes
24188.896734.0Yes
300.0200.6No
460.11233.7Yes
Monitoring Period(16 January 2020–30 September 2020)4
DwellingDaytime hours 1 T > 28 °C (living rooms)Night hours 2 T > 26 °C (bedrooms)Overheating 3
Hours 1%LimitHours 2%Limit
52245.81%39617.11%Yes
61874.81667.2Yes
1 Number of annual day-time hours (08:00–21:00 h) in which T > 28 °C must not exceed 1%. 2 Number of annual night-time hours (22:00–07:00 h) in which T > 26 °C must not exceed 1% 3 Overheating exists if either criterion is failed. 4 The monitored period is shorter than one complete year.
Table 10. Compliance of the criteria of CIBSE TM:59 for predominantly naturally ventilated dwellings. All monitored apartments.
Monitoring Period (1 April 2019–31 March 2020)
He 1Night Hours 2 T > 26 °C (Bedrooms)
DwellingCategoryHours 1%LimitHours 2%LimitOverheating 3
1I20.03%2748.41%Yes
II00.02748.4Yes
Monitoring Period (1 October 2019–30 September 2020)
He 1Night hours 2 T > 26 °C (bedrooms)
DwellingCategory.Hours 1%LimitHours 2%LimitOverheating 3
1I1211.43%33010.11%Yes
II170.233010.1Yes
2I7638.796734.0Yes
II750.996734.0Yes
3I420.5200.6No
II00.0200.6No
4I660.81233.7Yes
II50.11233.7Yes
Monitoring Period (16 January 2020–30 September 2020) 4
He 1Night hours 2 T > 26 °C (bedrooms)
DwellingHours 1%LimitHours 2%LimitOverheating 3
54I1782.03%39617.11%Yes
II440.539617.1Yes
64I2162.51667.2Yes
II1261.41667.2Yes
1 Hours of exceedance (May–September) must not exceed 3%. 2 Number of annual night-time hours (22:00–07:00 h) in which T > 26 °C must not exceed 1% 3 Overheating exists if either criterion is failed. 4 The monitored period is shorter than one complete year.
Table 11. Compliance of the criteria of CIBSE TM:59 for predominantly mechanically ventilated dwellings. All monitored apartments.
Monitoring Period (1 April 2019–31 March 2020)
DwellingHours 2 T > 26 °COverheating 3
Hours 2%Limit
1112512.83%Yes
Monitoring Period (1 October 2019–30 September 2020)
DwellingHours 2 T > 26 °COverheating 3
Hours 2%Limit
1107012.23%Yes
2271030.9Yes
33504.0Yes
46777.7Yes
Monitoring Period (16 January 2020–30 September 2020) 4
DwellingHours 2 T > 26 °COverheating 3
Hours 2%Limit
54137015.63%Yes
648009.1Yes
2 Number of annual hours in which T >26 °C must not exceed 3%. 3 Overheating exists if either criterion is failed. 4 The monitored period is shorter than one complete year.
Table 12. Compliance of the criteria of CIBSE TM:52 for predominantly mechanically ventilated dwellings. All monitored apartments.
Monitoring Period (1 April 2019–31 March 2020)
He 1We 2Tupp 3Overheating5
DwellingCat.Hours 1%LimitHours 2LimitHours 2Limit
1I20.03%0600No
II00.000No
Monitoring Period (1 October 2019–30 September 2020)
DwellingCat.He 1We 2Tupp 3Overheating5
Hours 1%LimitHours 2LimitHours 2Limit
1I1211.43%8600No
II170.210No
2I7638.7460Yes
II750.960No
3I420.510No
II00.000No
4I660.840No
II50.100No
Monitoring Period (16 January 2020–30 September 2020) 5
DwellingCat.He 1We 2Tupp 3Overheating5
Hours 1%LimitHours 2LimitHours 2Limit
5I1782.03%13630Yes
II440.530No
6I2162.52745Yes
II1261.41426Yes
1 Hours of exceedance (May-Sept) must not exceed 3%. 2 Daily Weighted Exceedance (We) should not exceed 6 for any given day. 3 Tupp should never exceed Top, for any given hour. 5 Overheating exists if any two of the three criteria is failed.
Publisher’s Note: MDPI stays neutral with regard to jurisdictional claims in published maps and institutional affiliations.

