Article

How to Create Walking Friendly Cities. A Multi-Criteria Analysis of the Central Open Market Area of Rijeka

1
Faculty of Engineering and Architecture, University of Enna KORE, Cittadella Universitaria, 94100 Enna, Italy
2
Department of Transportation & Hydraulic Engineering, School of Rural & Surveying Engineering, Aristotle University of Thessaloniki, 541 24 Thessaloniki, Greece
3
Faculty of Civil Engineering, University of Rijeka Radmile Matejčić 3, 51000 Rijeka, Croatia
*
Authors to whom correspondence should be addressed.
Sustainability 2020, 12(22), 9470; https://doi.org/10.3390/su12229470
Submission received: 15 October 2020 / Revised: 6 November 2020 / Accepted: 7 November 2020 / Published: 13 November 2020
(This article belongs to the Special Issue Sustainable | Sustaining City Streets)

Abstract

:
Current mobility strategies tend to pursue sustainable solutions with low environmental and economic impact, such as the disincentive to the use of private vehicles. Mobility on foot is among the most advantageous forms for short distances, especially if different technological and infrastructural solutions are inserted in the urban context such as underpasses that limit the likely conflicts with motor vehicles. These solutions, however, are not easily perceived as positive because people often do not like to change their usual routes or because they feel psychological discomfort when they pass through closed places. This research work focuses on the evaluation of the benefits of including a small underpass in the city of Rijeka, Croatia and through an Analytical Hierarchy Process (AHP), a multi-criteria analysis, it was possible to prioritize a number of decision-making alternatives, related to qualitative and quantitative evaluations, otherwise not directly comparable, and combining multidimensional measurement scales into a single priority scale. This analysis allows to provide cues for local and non-local urban planning, encouraging through the participatory form an active comparison between the population and local authorities and at the same time allows to assess which multidisciplinary processes (psychological/engineering) are possible to put in place to encourage the research on pedestrian behavior.

1. Introduction

The increase of pedestrian mobility and studies related to urban spaces to facilitate accessibility and walkability is defined as a sustainable strategy for the smart and inclusive growth of cities in perfect harmony with what is enshrined in [1].
The definition of strategies to be adopted at the local level must place particular importance on the bottom-up approach both through participatory planning and through the implementation of the Urban Agenda [2,3].
Walking has recently been one of the most popular forms of mobility proposed in many urban plans and in the new concept of sustainable mobility. It is the most economic form of transport especially for short-haul distances (<1 km). Services and infrastructures often facilitate and simplify the mobility of people with disabilities or the elderly. Empirical data are often acquired through video cameras or sensors and processed in well-known flow allocation models to study the behavior of pedestrians and identify their preferences [4,5,6].
In literature there are several works related to the choice of itineraries. According to [7], the influence of the variables [8] that describe the visual aspect of the urban landscape can influence the choices of the route and outline the positive role of the urban atmosphere linked to the commercial function of the roads.
Several variables in this context can be analyzed and are in general related to the user’s behavioral [9] and perceptual aspects [10] both in terms of safety and usability of the places, i.e., ease in being able to walk around them, especially in shared spaces [11,12]. From the point of view of infrastructure, it is necessary to be able to recognize areas or lanes dedicated to pedestrians and the presence of traffic mixing (pedestrians with cyclists or cars). It is also essential to define specific index or variables in order to avoid phenomena that can produce reduced safety and low comfort. In particular, pedestrian’s safety is analyzed through interviews by the distribution of questionnaires but also through micro-simulation tools that allow to evaluate the Level of Service of the confined or extensive infrastructure such as Pedestrian Level of Service (PLOS) [13]. The assessment of safety and the reduction of the possibility of collisions with vehicular flows is analyzed by defining surrogate parameters on pedestrian trajectories in accordance with [14,15]. The tracking of the pedestrians and therefore the definition of the trajectory and the choice of the routes can be facilitated using technology. This can make the modal choices of the user more understandable. Different technologies and applications on smartphones and tablets allow the analysis of the trajectories through GPS systems and permit the furnishing of information to the user regarding the best route available, varying the places and reasons for moving [16]. The geographic information system platforms (GIS) could be very effective for understanding the spatial aspects of walkable spaces such as distances, densities, points of interests, and so on by themselves or integrated with other tools [17,18,19,20]. Generally, improving parameters such us speed and safety is fundamental to structure a city friendly for walking.
This can be pursued by introducing both motor vehicle travel restrictions and space reallocation, but road pricing must also be combined with the effort that many countries and cities attempt to achieve through the restriction of motor vehicle travel in urban areas. On the other hand, there is a risk that this restrictive approach can actually have a detrimental impact, especially for elderly people, persons with disabilities, and persons with chronic illnesses or otherwise vulnerable users such as parents with strollers [21,22,23].
It is also necessary to support strategies to reduce speed and volume. The traffic speed and volume are major determinants of whether people choose to walk or cycle, how safe they feel, and how possible it is to let their children walk [24,25]. Speed limits of 20 miles per hour are now visible in many cities, along with the closure of school streets and the expansion of low-traffic neighborhoods, which use modal filters to limit the travel speed in residential neighborhoods, and reduce volume and speed while promoting walking and cycling [26].The definition of safe and comfortable environments for walking is another element to analyze [22]. It is not enough to limit the use of the car and reduce the dominance in cities, but it is also essential to invest in improving the pedestrians’ environment.
Cities must increase people’s desire to walk by creating attractive, safe, and direct pedestrian networks that are viable alternatives to the use of private vehicles [27,28,29]. Therefore, pedestrian networks play a fundamental role in connecting urban, residential, commercial, educational, and recreational centers. Accessibility and walkability within different urban areas enables strategies to be pursued that encourage resilient mobility, i.e., the ability to adapt to sudden events, useful for mitigating the impacts of catastrophic and pandemic events [30,31,32].
The implementation of some actions, strategies, and policies that can be considered as tactical urbanism and the planning of green infrastructures within the urban context allow to improve the usability of spaces for pedestrians [33].
These actions can be of different types; for example, they can start from the bottom up and not be regulated or they can refer to top-down actions decided by the municipal administration and by technicians or middle streets that see the support of local policy and the involvement of citizens and the territory.
In this way, tactical urbanism makes it possible to carry out projects for the modification of public spaces that are temporary and of an experimental nature with a high communicative value [34,35].
Today’s pedestrian mobility is encouraged by local and community policies in order to reduce the use of vehicles. Considering also that the European population is characterized by 20% of people being over the age of 65, many administrations are trying to make the routes more comfortable and safer by using underpasses or overpasses and thus reduce the potential of conflicts with the vehicular flow. Mobility is also facilitated by the inclusion of mechanized systems such as stairs, elevators, or treadmills in order to improve accessibility in these areas. On the other hand, the use of underpasses is not often positively perceived by people as they do not like changing their habitual routes or they experience psychological distress when they pass through closed places.
The speed of pedestrians, the perception of users, and the geometric-functional evaluation are useful parameters for the planning of pedestrians’ structure. During the last few years, it has been quite difficult for designers to understand the relationship between the characteristic pedestrian flow and the pedestrian movement using only their experience and their senses. Interactions between pedestrians are difficult to understand and often the presence of closed or small spaces alters their behavior.
The planning and the design of spaces in which pedestrians can be moving as they do in streets and squares must be considered as certain parameters in order to increase the perception of safety in users and therefore to make them more usable. Among these parameters, streets are the spontaneous surveillance that increases the offender’s apprehension given by the risk of being seen by people [36].
This is achieved by maximizing visibility and developing positive social interactions between legitimate users of private and public space. In this way, potential offenders experience increased control and limitations on their potential escape routes.
Another variable to be attenuated is the natural access control that limits the opportunities for criminal behavior by clearly differentiating public and private spaces. This is achieved by intervening on lighting, inserting selective entrances and exits, fencing, and creating large spaces that restrict access or generate a controlled flow.
Finally, the natural territorial reinforcement promotes social control by increasing the definition of spaces and the perception of private property. This can be achieved by using buildings, fences, flooring, signs, lighting, and landscape to express property and define public, semi-public, and private spaces. More specifically, this research tries to analyze the key components that influence the behavior of pedestrians, in particular their attitude, perceptions, motivations, behavior, and habits by implementing a comparison through an Analytical Hierarchy Process (AHP) approach. Therefore, the present work starts from a literature review related to the estimation of the propensities of weak road users to the use of roads with underpasses or high walkability. Generally, the possibility to walk in an urban context depends on the interactions between pedestrians, infrastructure, and context, as represented in Figure 1.
Several examples of pedestrian or mixed infrastructure are presented in the literature: think for example of sidewalks or pedestrian lanes within the same road superstructure but often refers to the use of shared space within urban areas in order to accustom pedestrians but also cyclists to mutual respect and sharing space [37].
The research is therefore aimed at analyzing and comparing different pedestrian routes in order to understand which of them can define a unitary, fluid, safe, and quality road space, where all road users can live together in appropriate and attractive conditions. The objectives of the comparison carried out by this study has allowed to
-
improve the functionality and attractiveness of the road space, separating in some cases the different pedestrian/vehicular currents
-
improve the safety (objective and subjective) of all road users: pedestrians, cyclists, motorists;
-
improve the fluidity of pedestrian flows and other types of vehicles—reduce atmospheric emissions and noise.
The evaluation of different qualitative and quantitative parameters related to the perception of the itineraries and to the measurement of their level of service but also to their frequency of use must be analyzed by choosing appropriate methods. The present work focuses on the multicriteria analysis via AHP method.
The creation of open spaces where people can spend time and visit attractions makes it easier to walk in different cities. In addition to good walking routes and discouraging other modes of travel, people also need a reason to walk to or through an area or to stay in a place [22,38,39]. The possible conflicts between pedestrians and other traffic components must be minimized by considering the creation and management of underpasses. The search for walking routes is also essential to promote walking in the city. To ensure that, pedestrians’ networks are easy to navigate and comfortable for everyone [40].
It is essential to create sustainable public transport networks in cities as an alternative way of travelling for high distances that cannot be covered on foot or bicycle in order to reduce motorized travelling by private vehicles [41]. In addition, transport bus stations and hubs must be strategically located and support and improve mixed land use to encourage greater walking [42]. Several strategies have been implemented such as the creation of dedicated lanes [43] or the advent of the rapid transit bus (acronym: BRT) [44] or demand responsive transport (acronym: DRT services) for weak demand areas [45]. Providing public transport that improves accessibility (not only for the wealthy) is very beneficial for all the areas of a city. It is also essential that the pedestrians can easily reach the bus platform using safe and comfortable crossing points and infrastructures that are accessible on foot and by bicycle. While public transport must be treated as an investment for the city and not just as a mobility investment, it must benefit the city in total.
The implementation of shared mobility services such as cars, bicycles, micromobility, and the study of specific transport demand (by age, gender, work) can reduce the use of private vehicles and thus traffic congestion in urban areas [46,47]. In terms of urban planning, the integration of pedestrian networks and routes into urban planning is essential for cities which try to encourage people to walk [48]. It has been shown that creating cities that embrace mixed-use planning principles, bringing together residential, commercial, recreational, and educational elements in areas of around 400 m2 of neighborhood/town center, has increased the rate of pedestrians and cyclists among residents and visitors [49]. While the more an area of a city has a mixed use of land, the more there are reasons to visit and walk on it. The active participation of the inhabitants [30,50] can also help in the urban planning phase, exploring the critical and positive aspects of every part of the city such as a neighborhood or an infrastructure [51]. Green infrastructure is also a key element of a city and has multiple benefits for both people and the built environment. It has been shown that cities and places that have a high level of greenery both in the streets, including trees and plants in buildings, and in regular open green spaces and parks, present an increase in the level of people’s desire to walk [52,53,54,55,56].
In addition, greenery on the streets improves pedestrian safety because of the reduction of the vehicles’ speed in the road. In order to be able to consider the six previous points, considering the need to implement sustainable policies and to make the best use of the routes in the area under investigation, this research analyzes the user’s perception, which is connected to the transition in an area with a strong pedestrian vocation, laying the foundations for more in-depth research. The goal of this research is the exploration of users’ perception as the short itineraries change, considering the same origin/destination in order to evaluate the ease of walking in the analyzed area.

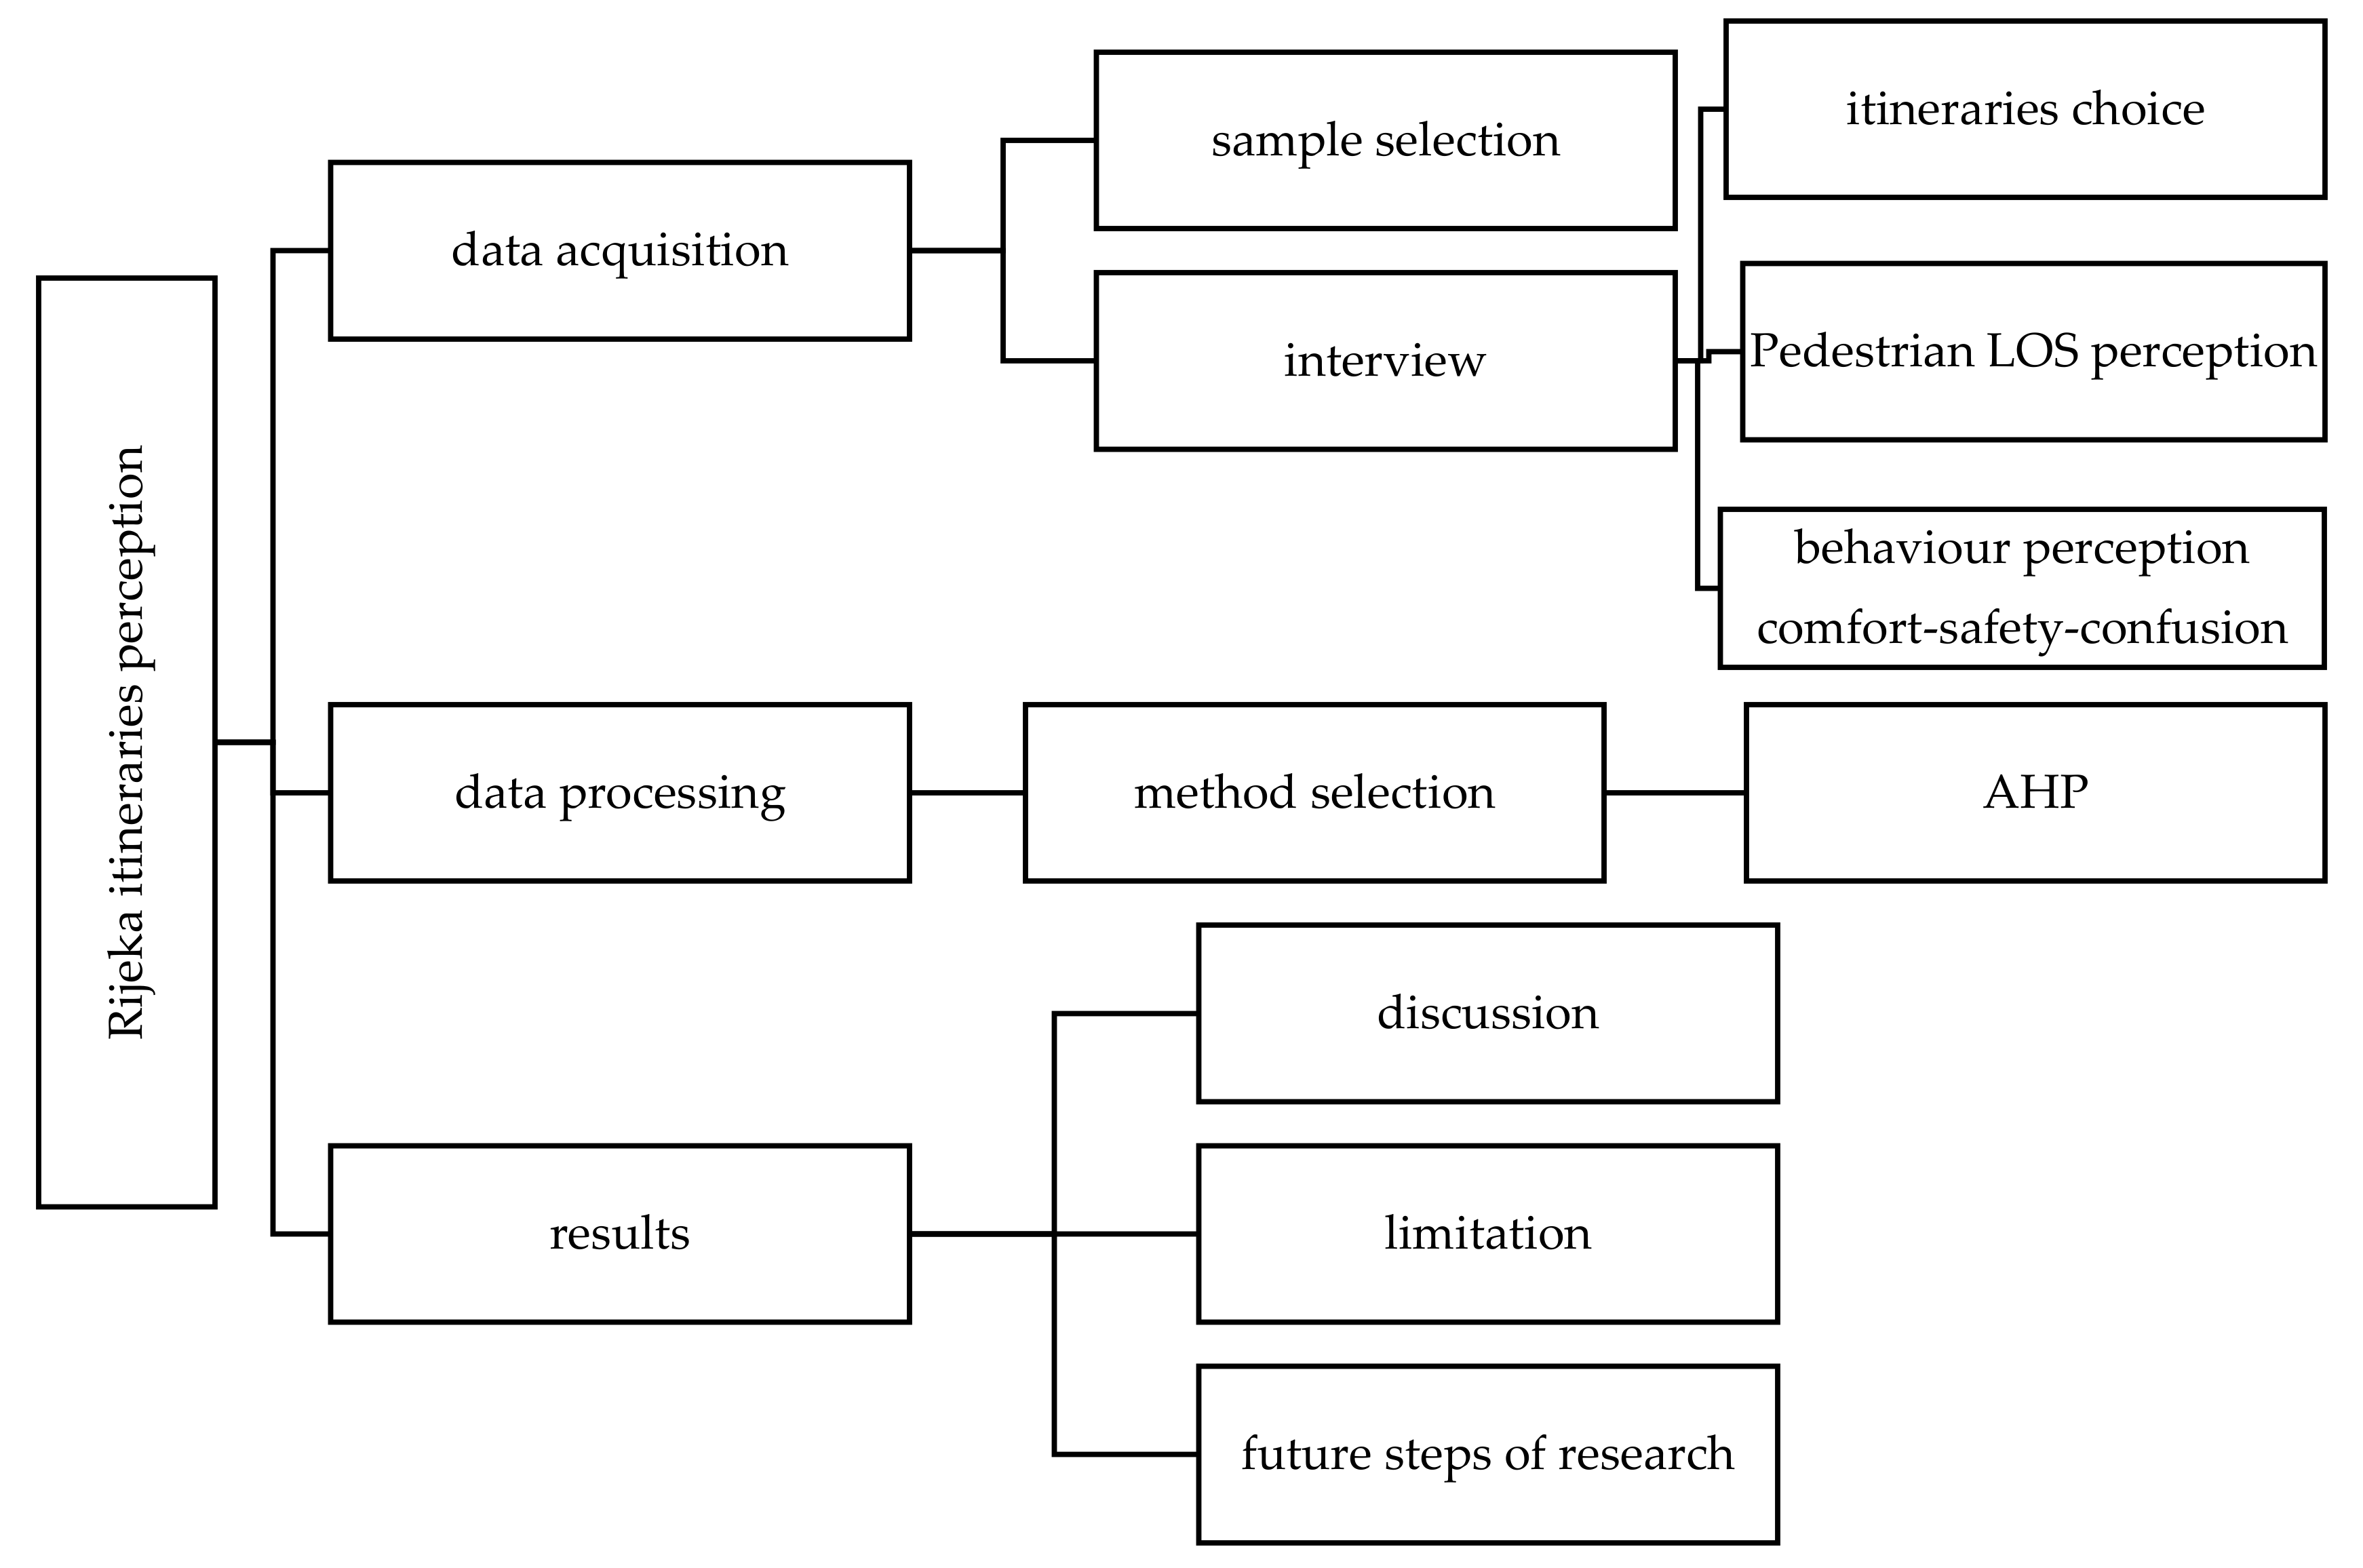
2. Materials and Methods

The research is carried out by introducing a phase of data acquisition according to face-to-face interviews using a survey format and then processing the data through an AHP methodology. The interviews were conducted through the PAPI method (pen and paper interview-paper questionnaire interview) [57]. In fact, the paper questionnaire interview is the most classic of the survey techniques. The interviews were completed by recording the respondent’s answers on a paper questionnaire. Then, the data are entered into a database and analyzed. The database is created in an excel sheet in which the quantitative data have previously been collected in order to be quantified and normalized via equations. The interview approach allows the direct exploration of the perceived sensations through a bottom-up approach. This strategy is also useful to spread a democratic urban planning that can motivate different population groups to cooperate with the local administration [58,59]. The interviews were conducted before the pandemic phase when there were no restrictions on the flow of people moving outdoors. Each interview lasted less than 7 min in order not to cause stress in the interviewed user. The interview involved the acquisition of socio-demographic data and perception of the paths through the evaluation of the LOS (Level of Service) and the definition of the feelings felt in terms of safety, comfort, and confusion. More specifically, the questionnaire that was used consists of three parts and eight questions in total. The first part includes 3 questions concerning the profile of the respondent. Two more questions, which are included in the second part, ask the respondent to show the frequency of use of the road network and his preferences about the four itineraries. The last two questions of the second part request from the respondent to rate the level of service (LOS) of the infrastructure and the possibility to go on walk in the road network. The third part of the questionnaire collects the data that are necessary for the AHP analysis. In this part, the respondent had to compare the four itineraries in pairs using a nine-point scale. This process was accomplished three times in order to collect data concerning the safety, the comfort, and the confusion that the pedestrians feel during the use of the infrastructure. The research steps dealt with in this work are schematically shown in Figure 2.
A specific questionnaire was defined and administered to citizens and tourists allowing a comparison of the results and providing useful judgments to the Local Administrators for the improvement of the connection routes to the examined areas. The choice of the itinerary is often evaluated through mathematical modeling that correlates different input parameters selected by the user through direct or indirect surveys on one’s walking habits. This work aims to describe the selection of the itineraries through the AHP method relating to an area of the city of Rijeka with a high pedestrian flow rate and shows how users can choose one of the proposed itineraries, considering as positive aspects those related to safety and comfort and as negative aspects those related to chaos.
A number of factors can induce and facilitate the creation of a city that can encourage walking. Although each city has its own culture, climate built environment, and social built environment, the fact that the local context and priorities are integrated is also essential; this creates the best walking environment for a city and its people.

2.1. Analytical Hierarchy Process (AHP)

The method that was used for the data analysis of the research is the Analytical Hierarchy Process (AHP). AHP is a Multi-Criteria Analysis (MCA) method, developed by [60]. MCA is a method that is commonly used in the Decision-Making Theory and takes into account all available parameters. It is a complex process that aims to resolve each problem that the surveyor might have. The goal of MCA is the approach of multiple solutions that present the best possible option in the majority of available criteria of the problem [61]. The transparency and mathematical structure of this technique is what establishes it as the most suitable in accomplishing the concept of sustainability by many researchers. Furthermore, its practical value in combination with a user-friendly software increases its attractiveness to practitioners [62]. Through the Analytical Hierarchy Process (AHP), a multicriteria evaluation, it is possible to assign priorities to a series of decision-making alternatives, relating qualitative and quantitative assessments, otherwise not directly comparable, and combining multidimensional scales of measurements in a single priority scale, as in Figure 3.
AHP has the advantage of quantifying quality data that are collected. At first, it defines some criteria with which it creates pairs of comparisons. The goal of the method is to attribute a weight in each criterion that will define its importance. The higher the weight of a criterion, the more important it is [65]. The attribution of the weight is performed by comparing the criteria in pairs using a scale. There are several scales that can be used that stem from psychological theories [66]. One of the most used scales in AHP is the Saaty scale. It is a nine-point scale where 1 is the minimum value and 9 is the maximum. In between these values, numbers 3, 5, and 7 are used. Number 1 is considered the weight multiplied by the criteria that shows the absolute balance in a comparison pair. It is a scale based mainly on empirical studies [60]. The attribution of a weight to each criterion leads into the final ranking of the criteria. For an AHP to be considered complete, all possible pairings of comparisons must be created so that all criteria can be compared.
Cases with a high number of criteria and therefore a high number of comparative pairs may make the research difficult, thus, some comparative pairs may be excluded. In such cases, it is preferred (suggested) to create the minimum number of comparison pairs required in order to acquire the rest of the comparison pairs from them. The number of comparison pairs results from the formula n (n−1)/2 where n equals to the number of criteria [60]. Finally, the AHP method is able to calculate the possible inconsistency between the survey responses using a specific index called Consistency Index (CI). This index has its lowest value as zero (0). The closer to zero the CI is, the smaller the inconsistency. In particular, if CI/RI < 0.1, where RI stands for Random Index (Consistency Index for Random Entries), the inconsistencies are considered acceptable [60].

2.2. AHP Online System-AHP-OS

An AHP online software was used in order to implement the Multi-Criteria Analysis (MCA) with the method of the Analytical Hierarchy Process (AHP), which is called AHP Online System (AHP-OS), and can be found in the Business Performance Management Singapore (BPMSG) website [67]. This software provides a special excel sheet, in which all collected data are entered. It is a very simple and practical way of applying and completing an AHP which allows the user to directly configure the basic parameters of the process (number and name of criteria, size of input data, etc.). From a mathematical point of view, this method is based on the solution of an Eigen value problem.
The data must be quantified in order to import them into the software. More specifically, the quantification of the interviewees’ answers is carried out according to the nine-point scale of Saaty. The software uses these quantitative data (numbers from 1 to 9) of all the comparisons between the criteria and automatically calculates the weight of every criterion. During the data processing, a matrix is created in order to calculate the weight of every criterion and the consistency ratio. The result of every pair-wise comparison is placed into this matrix. Τhe weighting of the criteria, which is the ratio scale, is given from the first dominant right Eigen vector of the matrix. It is essential to mention that a normalization of the quantified data is previously required in order to not import negative values. In this way, the final classification (ranking) of the criteria is made according to the weight of each criterion. Finally, the software can calculate the Consistency Ratio (CR). The CR is defined by the Eigen value of the matrix and it can lead to useful conclusions regarding the inconsistencies between the respondents’ answers as well as the reliability of the AHP’s final results [67].

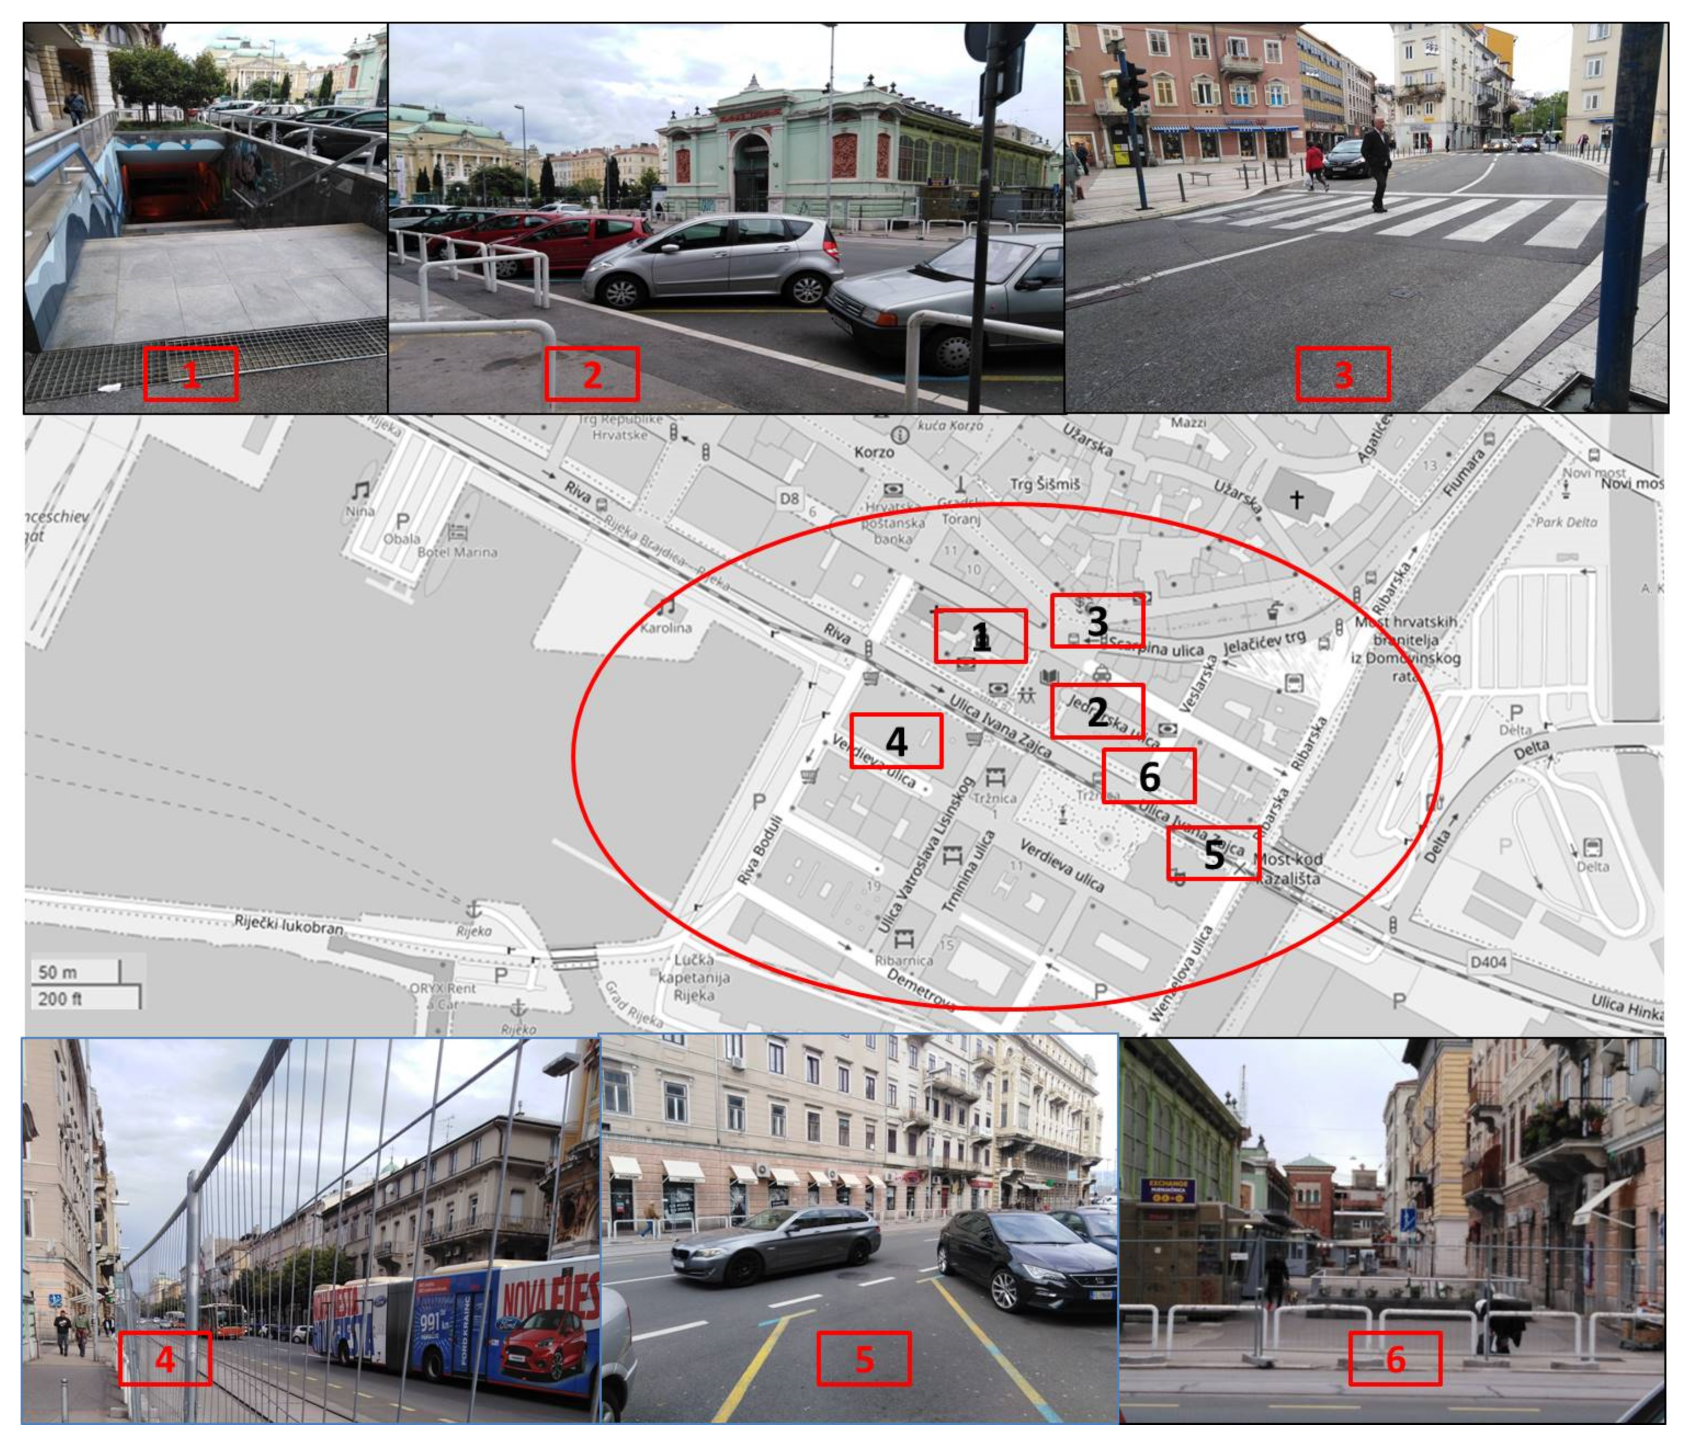
2.3. Case Study Description

Rijeka, Croatia, is a capital of the Coastal Mountain Region county in north-western Croatia, which partly corresponds to the territory of Liburnia and Kvarner. Road safety, especially for pedestrians, requires a lot of attention because out of 404 traffic deaths in Croatia in 2017, 60 were pedestrians (14.9%) and 27 in non-motorized vehicles (6.7%). Injuries were 10.5% for pedestrians and 7.3% for non-motorized vehicles (out of a total of 14,608). Regarding the road deaths, 16.9% were caused by pedestrians and 6.9% by cyclists. According to [68], almost 90% of pedestrian deaths in traffic are in the over 40 age group, showing a high importance of the age factor. Among the main causes of accidents are not only the conditions and the maintenance of infrastructure, but also the limited visibility and the behavior of pedestrians and drivers [12,13]. These data highlight the need to improve the infrastructure and spread a greater culture of road safety among the population. The document considers the comparison of different routes with identical points of origin and destination, allowing walking as the only form of short distance travel.
The city was selected as a case study because it was named as the European Capital of Culture in 2020 and a good flow of tourists was observed in recent years, until the beginning of the pandemic. The center of the city is used by 160,000 pedestrians daily. Most of the pedestrians arrive to the center by vehicles, and 20% of them arrive by foot [68,69].
As the pedestrian mobility is becoming increasingly important, the City of Rijeka is planning several important enhancements: new pedestrian traffic spaces in the portual area, additional underpasses and overpasses related to railway structures, pedestrian access to healthcare services, and the creation of urban microcenters based on pedestrian mobility as residential centers which have a tertiary function (the pedestrian zones, such as squares and roads, are indicated for development). In some parts of the city, the sidewalks are planned with 2 m tree line division for the vehicles. In the center, pedestrian roads are planned with a 12 m section or roads with 6 m pedestrian corridors alongside. Moreover, the elements of mechanical vertical and horizontal mobility are planned in several parts of the city [69,70].
The selected area is the most crowded area of the city by pedestrians due to the tourist attractions and the commercial and tertiary activities present. The analysis was conducted in the city of Rijeka where about 130,000 inhabitants live. Over 19.7% of the resident population is made up of people over the age of 65 years [70] who have a habit of moving on foot or using the public transport. The city is recently characterized by a strong attendance of tourists. The area, which is located closest to the historic center and the port, is fairly flat and allows pedestrians and cyclists to move easily. The city faces the sea and is characterized by large areas that can be easily traveled on foot and characterized by numerous tourist and commercial attractions, as in Figure 4.
Other parts of the city are on sloped terrain. Traffic lights exist in every intersection in the center of the city. These intersections provide very long pedestrian crossings. The traffic light cycle, however, does not provide times of more than 25 s and therefore people, especially the elderly and other vulnerable users, find themselves in difficulty during the crossing and are forced to stop in the middle of their route, waiting for the next green [22]. Almost all of the crossings do not have pedestrian areas that can protect them.
This study involves in an area between the pedestrian center and the outdoor market. These two areas are connected by different itineraries that can be travelled on foot or by car. The work focuses on four pedestrian itineraries characterized by different infrastructural elements.
The area is delimited by two main roads for vehicular flows called Adimićeva (near the open market define by photos n°2 and 6 on Figure 4) and Ivana Zajca (near the Korzo, the main pedestrian only street defined by photo n°3,4 and 5 on Figure 4). They are covered in one way, and today they represent the main transit corridors to and from the city.
The presence of numerous sidewalks allows users to move easily anywhere. The presence of an underpass that connects the two areas analyzed (origin and destination of the movements) reduces this type of potential collision. Specifically, it was considered appropriate to define the main pedestrian area called Korzo as the origin of the four itineraries (yellow area) and the open market (blue area) was instead selected as the final destination, as shown in Figure 5.
The two areas, of the Korzo and the open air market, constitute the two centroids of the exemplified traffic network covered in this study. They are characterized by a high flow of pedestrians during the various hours of the day for both business and pleasure reasons. In addition, the origin node is also characterized by the presence of numerous offices while the destination node is characterized by the presence of the historic covered market and the municipal theater, as well as by numerous restaurants and pubs that attract many tourists. The monitored area was recently embellished with numerous artistic installations and Rijeka finally defined as the European capital of culture 2020.
The questionnaire was given to the citizens of Rijeka who have a good knowledge of the city. The PAPI method was applied in order to acquire the sensations perceived by pedestrians as they travel through the various selected itineraries.
The survey was administered considering the same environmental conditions for all users, i.e., the same period of the day with similar sunlight and similar traffic conditions near the area which is under investigation. Therefore, the sample was limited precisely because of the finding of the same external conditions during the administration of the questionnaire. Among the different sensations experienced by the users during the walk, particular attention was paid to the feeling of safety [71], comfort, and confusion [72,73].
In particular, the area is described in Figure 6. It has been analyzed, proposing the comparison of four itineraries represented in Figure 6 and thus defined:
  • itinerary 1 (IT1) it consists of a path on the sidewalk and traffic-lighted pedestrian crossings
  • itinerary 2 (IT2) also formed by a path on the sidewalk and traffic-lighted pedestrian crossings
  • itinerary 3 (IT3) formed by a direct path on the sidewalk and secondary road
  • itinerary 4 (IT4) formed by a direct route on the underpass
The analysis also considered the presence of a railway track dedicated to a train for the transport of goods to and from the logistics port area which interrupts the pedestrian crossings of the various routes. The Euclidean measure, which is the one taken between origin and destination, is 135 m, and is similar to the length of itinerary IT4. Itineraries 1 and 2 are characterized by lengths of 340 and 300 m while IT3 is 168 m. Since the itineraries are less than 500 m (defined as short-haul journeys), they can be easily walked on.

2.4. Data acquisition. Sample and Survey definition

The sample was randomly selected by carrying out PAPI method at the end of 2019. The survey templates were organized in such a way to ensure unambiguous interpretation of questions and answers. The variables investigated are summarized in Table 1. In particular, they have been included in (socio-demographic data with closed answers), Section 2 (travel habits and road network judgment with closed answers and answers on a scale Likert 1–5), and Section 3 (travel perception with AHP comparison method on a scale of judgment 0–4).

3. Results

3.1. Data Analysis through the Use of Descriptive Statistics

Human factors related to walking are the subject of numerous studies in the literature and are increased comparing with other studies on other road users [74,75]. In general, the functional geometrical characteristics of an infrastructure can be related only to a small part of the pedestrians’ behavior in urban areas. Understanding pedestrians’ behavior in urban areas can lead to significant improvements in the design and planning of pedestrian road and traffic environment, and consequently in the comfort and safety of pedestrians [76,77]. The questionnaire was designed aiming to acquire socio-demographic data, walking aptitude data, and data related with the perception of the risk from the point of view of safety, comfort, and confusion (chaos). Each question allowed only one answer expressed through Likert scales [78,79] or bivariate choice or multivariate choice. In particular, the Likert scale made possible to express a judgment instead of the bivariate and multivariate choice of selecting between two or more options. Section 1 of the survey focused on the evaluation of socio-demographic data i.e., gender, age, and work. The investigated sample shows a higher percentage of men than women as shown in Table 2.
The age that most characterized the sample is between 18 and 24 years of age and followed by the age group 25–39 as shown in Table 3.
The age groups have a close connection with the work activity, in fact the highest percentage of users interviewed were students as shown in Table 4.
Section 2 of the questionnaire focuses on the frequency of walking on the monitored routes and the selection. In fact, Table 5 shows how often the respondents use the road network.
Table 6 indicates the respondents’ preference regarding the four itineraries, showing a slight predominance in the use of the IT4 itinerary.
A synthetic judgment pertaining to the global road network was examined through the definition of perceived type of level of service. This parameter incorporates a general vision of the movement both from the point of view of safety and of the hypothesis of congestion that can increase the travel time. The perceived Level of Service (LOS) of the users stands at an average value equal to LOS C as shown in Table 7. Only 8.6% of respondents rated the LOS with A or B i.e., optimal service levels. This result proves the uncertainty of users regarding the overall quality of the infrastructure.
Finally, through a judgment on a Likert scale, it was expressed on the possibility of being able to move on foot along the monitored road network. The predominant judgment in this case was encouraging and included between positive and very positive, as shown in Table 8.

3.2. Multi-Criteria Analysis through the Use of AHP Method

Therefore, the assessment of the perception of safety within the itineraries was connected to the combination of pedestrian and vehicular flow with reference to both pedestrian crossings and the traffic light cycle. The feeling of comfort was associated with the presence of sidewalks and handrails, in addition to good lighting.
The perception of chaos, on the other hand, has been correlated to a hypothetical congestion of pedestrian and vehicular traffic and to the increase in travel time useful for arriving from origin to destination. All these objectives are often connected to a subjective component of the evaluation of the parameters, that is, judgments and opinions with the objective data or the measurement. The AHP was applied three times using different input data for each column. Table 9 presents the final rankings of each itinerary based on the comfort, the safety, and the confusion (annoyance) of the user. The three parameters (comfort, safety, and confusion) constituted the basic criteria that the respondents took into consideration in order to compare the four itineraries. The ranking of the itineraries in each AHP derives from attributing a weight in each one based on their importance. Additionally, the Consistency Ratio (CR) of each AHP was generated. The CR of an AHP represents the inconsistencies between the responses of the users in a single questionnaire. As mentioned before, if the CR is lower than 10%, the inconsistencies are considered acceptable.
As shown in Table 9, the first two AHP analyses give similar results as they represent two positive features (comfort and safety) for the users of the infrastructure. Actually, these two analyses produce the same ranking of itineraries with small differences on their percentages. Itinerary 4 seems to be preferred by the users based on these two characteristics. Itinerary 3 can be characterized as the least preferable itinerary with Itinerary 2 and Itinerary 1 coming second and third respectively. On the other hand, the third AHP analysis, which represents the confusion, confirms the results of the other two analyses placing Itinerary 1 at the first place and Itinerary 4 at fourth place concerning the confusion that the respondents feel during the use of the road network. Itinerary 3 is considered to be second in the ranking of confusion with a very small percentage difference comparing with the percentage of Itinerary 1 followed by Itinerary 2, which seems to create less confusion to the users of the infrastructure.
The design of an urban context refers to multiple interests, often conflicting, that converge on the road space: those of mobility in its various forms, those of residents, traders, passers-by, without forgetting the needs related to environmental protection (air and noise) and architectural and urban quality. The concept of the road space must guarantee and, if necessary, restore a balance between these interests and needs.
According to the questionnaires that were collected during the survey in the city of Rijeka, 54% of the sample were males; therefore the distribution of the sample between males and females is almost even. The vast majority (90%) were students and employees under 40 years of age. Almost 40% of the sample uses the infrastructure at least 4 times per week, while 25% avoids the use of the infrastructure and uses it seldom; less than 1 time per week. The respondents differed widely on which route they use the most. “Itinerary 4” (IT4) is used slightly more than the rest (31.4%) and the percentages of the four itineraries are very close. Additionally, the highest percentage of the respondents (84.3%) evaluates the level of service of the infrastructures with C and D (in a scale of A to F). Furthermore, 94.3% assesses the possibility of using the infrastructure to go for a walk from positive to absolutely positive. The slight preference of pedestrians towards “Itinerary 4” is confirmed by the Multi-Criteria Analysis, which was produced using the AHP method. The routes were compared in all possible pairs by the users. The results of the comparisons were used as data for the AHP in regard to the safety and comfort of the users. Based on the results, “Itinerary 4” was placed first, scoring 30.4% in comfort and 36% in safety, followed by itineraries 2, 1, and 3. It is worth mentioning that both IT4 and IT3 are shorter that the rest. In the last AHP, the results of the comparisons that were used as data for the AHP concerned annoyance. IT1 acquired the most weight (29.6%), followed by IT3, IT2, and IT4. This work is a first step of investigation which will be subsequently expanded with a second step of investigation and comparison of data in statistical terms. The infrastructure examined is heavily used on an everyday basis by some participants, but by others it is seldom used. The route with the underpass is slightly more used than the other, but as it is shorter than other two routes (IT 1 and IT 2), and safer than the third route (IT 3), it is actually surprising that the preference is not higher. Even more so, as it ranked as the best by AHP in the category of “annoyance.” This shows that the use of this route is impacted by other factors, which should be further analyzed.

4. Discussion

Through slow mobility, it is possible to guarantee social distances and avoid traffic congestions without increasing the number of cars. From this point of view, it is necessary to study all possible zero-impact solutions starting from the analysis of itineraries and comparing the judgments before and after the pandemic. Mobility on foot within urban centers is being increasingly used by students and workers who want to move from home to their destination at distances of less than a kilometer. The results obtained in this research are in line with the results obtained in another recent research.
The distribution in the choice of itineraries was quite uniform with a slight prevalence in the selection of Itinerary 4 characterized by the presence of a well-lit and clean subway.
In accordance with [80], there was a decrease in the use of the subway with age. The perception of the pedestrian safety level was not entirely negative due to the fact that the infrastructure is constantly maintained, and local policies tend to promote strategies in favor of walking.
The AHP analysis has revealed the perceptions of pedestrians concerning the 4 routes in the same environmental conditions. However, this assessment is carried out on a small sample, which highlights the need to know not only the geometrical-functional characteristics of an infrastructure, but also the judgement of the people who habitually use the roads. This fact is of fundamental importance if a participatory planning of the city is to be implemented [81,82].
The overall satisfaction regarding the infrastructure was average, a fact that indicates that this aspect could be analyzed further. The greatly positive assessment of walkability of the infrastructure by the participants indicates that the lower satisfaction regarding the level of service has some complex motives.

5. Conclusions

The estimation of the ease with which it is possible to move around the city on foot depends on several factors, some of which are related to the surrounding environment and psychological and perceptual aspects. The conducted analysis has shown with the results obtained that urban planning is much improved when a democratic approach that allows the population to participate in the choices to be made is included [49,83]. This also shows that there is room for a scientific and professional approach based on analysis and evaluation to arrive at the factors that shape our understanding and perception of space and thus influence our well-being. For example, a more in-depth study of the perception of enclosed spaces, such as flyovers or underpasses, could help to create a series of mitigation actions aimed at maximizing people’s propensity to use them (light diversification, presence of a controller, more escalators) [84,85] The analysis based on the AHP method has allowed to compare different design solutions implemented in a high pedestrian flow area and therefore it is assumed that this approach can be supported by a micro simulation approach in order to better understand the behavior of pedestrians.
The scientific approach could significantly improve the attention and the understanding of the needs of vulnerable users who are underrepresented not only in the usual policy making process, but also in traditional processes of public participation. In addition, as a professional and scientific tool, the implementation of tactical planning could improve the usability of open spaces (location of street furniture, signage, etc.), allowing for better communication and greater involvement of citizens. This is particularly important because of the growing importance of pedestrian traffic in many fields such as transport, climate, walking, economy, and health, and even more so in cities where pedestrian traffic allows social distancing, pollution, and congestion abatement.

Author Contributions

Conceptualization, T.C. and S.B.; methodology, T.C. and S.B.; software, M.T. and T.P.; validation, M.T. and T.P. and S.B.; formal analysis, M.T. and T.P.; investigation, T.C. and G.T.; resources, T.C. and I.M.; data curation, I.M.; writing—original draft preparation, T.C. and S.B.; writing—review and editing, T.C. and S.B. and I.M.; visualization, I.M.; supervision, S.B. and G.T.; project administration, G.T.; funding acquisition, T.C. All authors have read and agreed to the published version of the manuscript.

Funding

This research work was partially funded by the MIUR (Ministry of Education, Universities and Research [Italy]) through a project entitled WEAKI TRANSIT.

Acknowledgments

The authors acknowledge financial support from the MIUR (Ministry of Education, Universities and Research [Italy]) through a project entitled WEAKI TRANSIT: WEAK-demand areas Innovative Transport Shared services for Italian Towns (Project code: 20174ARRHT/CUP Code: J74I19000320008), financed with the PRIN 2017 (Research Projects of National Relevance) program. We authorize the MIUR to reproduce and distribute reprints for Governmental purposes, notwithstanding any copyright notations thereon. Any opinions, findings, and conclusions or recommendations expressed in this material are those of the authors and do not necessarily reflect the views of the MIUR.

Conflicts of Interest

The authors declare no conflict of interest.

References

  1. Urban Agenda for the EU Pact of Amsterdam 2016. Available online: https://ec.europa.eu/futurium/en/system/files/ged/pact-of-amsterdam_en.pdf (accessed on 1 September 2020).
  2. Beets, N.; Envoy, D.U. Together towards an EU Urban Agenda. 2016. Available online: https://ec.europa.eu/regional_policy/sources/docgener/brochure/urban_agenda_eu_en.pdf (accessed on 1 September 2020).
  3. Agenda, U. Urban Agenda for the EU ‘Pact of Amsterdam’. In European Programme for Sustainable Urban Development; EU-European Commission: Brussels, Belgium, 2016. [Google Scholar]
  4. Gruden-Gruden, C.; Campisi, T.; Canale, A.; Tesoriere, G.; Sraml, M. A cross-study on video data gathering and microsimulation techniques to estimate pedestrian safety level in a confined space. IOP Conf. Ser. Mater. Sci. Eng. 2019, 603, 042008. [Google Scholar] [CrossRef]
  5. Bellizzi, M.G.; Eboli, L.; Forciniti, C. Segregation vs. interaction in the walkways: An analysis of pedestrians’ perceptions. Res. Transp. Bus. Manag. 2019, 33, 100410. [Google Scholar] [CrossRef]
  6. Dörrzapf, L.; Kovács-Győri, A.; Resch, B.; Zeile, P. Defining and assessing walkability: An concept for an integrated approach using surveys, biosensors and geospatial analysis. Urban Dev. Issues 2019, 62, 5–15. [Google Scholar] [CrossRef] [Green Version]
  7. Foltête, J.C.; Piombini, A. Deviations in pedestrian itineraries in urban areas: A method to assess the role of environmental factors. Environ. Plan. B Plan. Des. 2010, 37, 723–739. [Google Scholar] [CrossRef] [Green Version]
  8. Saelens, B.E.; Handy, S.L. Built Environment Correlates of Walking: A Review. Med. Sci. Sports Exerc. 2008, 40, S550–S566. [Google Scholar] [CrossRef] [Green Version]
  9. McIlroy, R.C.; Plant, K.L.; Jikyong, U.; Nam, V.H.; Bunyasi, B.; Kokwaro, G.O.; Wu, J.; Hoque, S.; Preston, J.M.; Stanton, N.A. Vulnerable road users in low-, middle-, and high-income countries: Validation of a pedestrian behaviour questionnaire. Accid. Anal. Prev. 2019, 131, 80–94. [Google Scholar] [CrossRef]
  10. Vallejo-Borda, J.A.; Cantillo, V.; Rodriguez-Valencia, A. A perception-based cognitive map of the pedestrian perceived quality of service on urban sidewalks. Transp. Res. Part F Traffic Psychol. Behav. 2020, 73, 107–118. [Google Scholar] [CrossRef]
  11. Frosch, C.; Martinelli, D.; Unnikrishnan, A. Evaluation of Shared Space to Reduce Traffic Congestion. J. Adv. Transp. 2019, 2019, 6510396. [Google Scholar] [CrossRef]
  12. Partnership Urban Mobility, Action Plan in Brief; Karmann-Woessner, A.; Hartig, R.; Schwartz, S.; Dien, G. (Eds.) City of Karlsruhe Executive and External Relations Department: Karlsruhe, Germany, 2019. [Google Scholar]
  13. Muraleetharan, T.; Adachi, T.; Uchida, K.; Hagiwara, T.; Kagaya, S. A Study on Evaluation of Pedestrian Level od Service along Sidewalks and at Intersections Using Conjoint Analysis. J. Infrastruct. Plan. Manag. 2004, 21, 727–735. [Google Scholar] [CrossRef] [Green Version]
  14. Tesoriere, G.; Campisi, T.; Canale, A.; Zgrablić, T. The Surrogate Safety Appraisal of the Unconventional Elliptical and Turbo Roundabouts. J. Adv. Transp. 2018, 2018. [Google Scholar] [CrossRef] [Green Version]
  15. Campisi, T.; Mrak, I.; Canale, A.; Tesoriere, G. The surrogate safety measures evaluation of a staggered crossing on the delta area of Rijeka. AIP Conf. Proc. 2019, 2186, 160006. [Google Scholar]
  16. Carlson, J.A.; Saelens, B.E.; Kerr, J.; Schipperijn, J.; Conway, T.L.; Frank, L.D.; Chapman, J.E.; Glanz, K.; Cain, K.L.; Sallis, J.F. Association between neighborhood walkability and GPS-measured walking, bicycling and vehicle time in adolescents. Health Place 2015, 32, 1–7. [Google Scholar] [CrossRef] [PubMed] [Green Version]
  17. Majic, I.; Pafka, E. AwaP-IC—An Open-Source GIS Tool for Measuring Walkable Access. Urban Sci. 2019, 3, 48. [Google Scholar] [CrossRef] [Green Version]
  18. Zazzi, M.; Ventura, P.; Caselli, B.; Carra, M. GIS-based monitoring and evaluation system as an urban planning tool to enhance the quality of pedestrian mobility in Parma. In Town and Infrastructure Planning for Safety and Urban Quality, Proceedings of the XXIII International Conference on Living and Walking in Cities (LWC 2017), Brescia, Italy, 15−16 June 2017; CRC Press; Taylor & Francis group: London, UK, 2018; pp. 87–94. [Google Scholar]
  19. Weerasinghe, S.; Dissanayake, D. Understanding Human Walking Behaviour in relation to Built Environment: A Mobile GIS Approach. In Proceedings of the GIS Research, London, UK, 18–21 April 2017; Available online: https://huckg.is/gisruk2017/GISRUK_2017_paper_46.pdf (accessed on 1 September 2020).
  20. Ghavampour, E.; del Aguila, M.; Vale, B. GIS mapping and analysis of behaviour in small urban public spaces. Area 2017, 49, 349–358. [Google Scholar] [CrossRef]
  21. Taoa, S.; Heb, S.Y.; Kwan, M.P.; Luo, S. Does low income translate into lower mobility? An investigation of activity space in Hong Kong between 2002 and 2011. J. Transp. Geogr. 2020, 82, 102583. [Google Scholar] [CrossRef]
  22. Mrak, I.; Campisi, T.; Tesoriere, G.; Canale, A.; Cindrić, M. The role of urban and social factors in the accessibility of urban areas for people with motor and visual disabilities. AIP Conf. Proc. 2019, 2186, 160008. [Google Scholar]
  23. Fatima, K.; Moridpour, S.; de Gruyter, C.; Saghapour, T. Elderly Sustainable Mobility: Scientific Paper Review. Sustainability 2020, 12, 7319. [Google Scholar] [CrossRef]
  24. Campisi, T.; Canale, A.; Tesoriere, G. The importance of reaction time on children and drivers during safely crossing phase. AIP Conf. Proc. 2018, 2040, 140014. [Google Scholar]
  25. Ištoka Otković, I. A Model to Predict Children’s Reaction Time at Signalized Intersections. Safety 2020, 6, 22. [Google Scholar] [CrossRef]
  26. Zahabi, S.A.H.; Strauss, J.; Manaugh, K.; Miranda-Moreno, L.F. Estimating potential effect of speed limits, built environment, and other factors on severity of pedestrian and cyclist injuries in crashes. Transp. Res. Rec. 2011, 2247, 81–90. [Google Scholar] [CrossRef]
  27. Knapskoga, M.; Hagena, O.H.; Tennøya, A.; Rynning, M.K. Exploring ways of measuring walkability. Transp. Res. Procedia 2019, 41, 264–282. [Google Scholar]
  28. Azmia, D.I.; Ahmadb, P. A GIS Approach: Determinant of neighbourhood environment indices in influencing walkability between two precincts in Putrajaya. Procedia Soc. Behav. Sci. 2015, 170, 557–566. [Google Scholar] [CrossRef] [Green Version]
  29. Forsyth, A. What is a walkable place? The walkability debate in urban design. Urban Des. Int. 2015, 20, 274–292. [Google Scholar] [CrossRef]
  30. Moraci, F.; Errigo, M.F.; Fazia, C.; Campisi, T.; Castelli, F. Cities under Pressure: Strategies and Tools to Face Climate Change and Pandemic. Sustainability 2020, 12, 7743. [Google Scholar] [CrossRef]
  31. Moslem, S.; Campisi, T.; Szmelter-Jarosz, A.; Duleba, S.; Nahiduzzaman, K.M.; Tesoriere, G. Best–Worst Method for Modelling Mobility Choice after COVID-19: Evidence from Italy. Sustainability 2020, 12, 6824. [Google Scholar] [CrossRef]
  32. Tesoriere, G.; Canale, A.; Severino, A.; Mrak, I.; Campisi, T. The management of pedestrian emergency through dynamic assignment: Some consideration about the “Refugee Hellenism” Square of Kalamaria (Greece). AIP Conf. Proc. 2019, 2186, 160006. [Google Scholar]
  33. Yassin, H.H. Livable city: An approach to pedestrianization through tactical urbanism. Alex. Eng. J. 2019, 58, 251–259. [Google Scholar] [CrossRef]
  34. Delsante, I.; Cartagena, Y.; Ahmed, T.; Baldauf, E.; Li, Y. The Temporary Tactical Urbanism. 2019. Available online: https://pure.hud.ac.uk/en/publications/the-temporary-tactical-urbanism (accessed on 1 September 2020).
  35. Neder, P. A Theory of Change for Public Design: An Analysis of Tactical Urbanism through the Multi-Level Perspective Theory. 2020. Available online: https://etda.libraries.psu.edu/catalog/17696pna7 (accessed on 1 September 2020).
  36. Jeffery, C.R. Crime Prevention through Environmental Design; Sage Publications: Beverly Hills, CA, USA, 1971; Volume 91. [Google Scholar]
  37. Nikiforiadis, A.; Basbas, S.; Campisi, T.; Tesoriere, G.; Garyfalou, M.I.; Meintanis, I.; Papas, T.; Trouva, M. Quantifying the Negative Impact of Interactions Between Users of Pedestrians-Cyclists Shared Use Space. In Proceedings of the International Conference on Computational Science and Its Applications, Cagliari, Italy, 1–4 July 2020; Springer: Cham, Germany, 2020; pp. 809–818. [Google Scholar]
  38. Hadiyanto, W.; Handayani, D.; Yulianto, B. Identification of reluctant factors in using footpaths based on the pedestrians’ perception. AIP Conf. Proc. 2017, 1855, 040012. [Google Scholar] [CrossRef] [Green Version]
  39. Cervero, R.; Sarmiento, O.L.; Jacoby, E.; Gomez, L.F.; Neiman, A. Influences of Built Environments on Walking and Cycling: Lessons from Bogotá. Int. J. Sustain. Transp. 2009, 3, 203–226. [Google Scholar] [CrossRef]
  40. Hollenstein, D.; Bleisch, S. Walkability for different urban granularities, The International Archives of the Photogrammetry, Remote Sensing and Spatial Information Sciences, Volume XLI-B2. In Proceedings of the 2016 XXIII ISPRS Congress, Prague, Czech Republic, 12–19 July 2016. [Google Scholar]
  41. Rossetti, S.; Tiboni, M.; Vetturi, D.; Zazzi, M.; Caselli, B. Measuring Pedestrian Accessibility to Public Transport in Urban Areas: A GIS-based Discretisation Approach; European Transport/Transporti Europei 2020. Available online: http://www.istiee.unict.it/issues/76-2020 (accessed on 1 September 2020).
  42. Taplin, J.H.; Sun, Y. Optimizing bus stop locations for walking access: Stops-first design of a feeder route to enhance a residential plan. Environ. Plan. B Urban Anal. City Sci. 2019, 47, 1237–1259. [Google Scholar] [CrossRef]
  43. He, S.X.; Dong, J.; Liang, S.D.; Yuan, P.C. An approach to improve the operational stability of a bus line by adjusting bus speeds on the dedicated bus lanes. Transp. Res. Part C Emerg. Technol. 2019, 107, 54–69. [Google Scholar] [CrossRef]
  44. Basso, L.J.; Feres, F.; Silva, H.E. The efficiency of bus rapid transit (BRT) systems: A dynamic congestion approach. Transp. Res. Part B Methodol. 2019, 127, 47–71. [Google Scholar] [CrossRef]
  45. Papanikolaou, A.; Basbas, S. Analytical models for comparing Demand Responsive Transport with bus services in low demand interurban areas. Transp. Lett. 2020, 12, 147–169. [Google Scholar] [CrossRef]
  46. Campisi, T.; Torrisi, V.; Ignaccolo, M.; Inturri, G.; Tesoriere, G. University propensity assessment to car sharing services using mixed survey data: The Italian case study of Enna city. Transp. Res. Procedia 2020, 47, 433–440. [Google Scholar] [CrossRef]
  47. Campisi, T.; Ignaccolo, M.; Inturri, G.; Tesoriere, G.; Torrisi, V. The Growing Urban Accessibility: A Model to Measure the Car Sharing Effectiveness Based on Parking Distances. In Proceedings of the International Conference on Computational Science and Its Applications, Cagliari, Italy, 1–4 July 2020; Springer: Cham, Germany, 2020; pp. 629–644. [Google Scholar]
  48. Zheng, Z.; Elefteriadou, L.; Chase, T.; Schroeder, B.; Sisiopik, V. Pedestrian Traffic Operations in Urban Networks. Transportation Research Procedia. In Proceedings of the International Symposium on Enhancing Highway Performance, ISEHP 2016, Berlin, Germany, 14–16 June 2016; Volume 15, pp. 137–149. [Google Scholar]
  49. How to Make Cities Walking Friendly. Available online: http://naturalwalkingcities.com/how-to-make-cities-walking-friendly/ (accessed on 1 September 2020).
  50. Ives, C.D.; Oke, C.; Hehir, A.; Gordon, A.; Wang, Y.; Bekessy, S.A. Capturing residents’ values for urban green space: Mapping, analysis and guidance for practice. Landsc. Urban Plan. 2017, 161, 32–43. [Google Scholar] [CrossRef] [Green Version]
  51. Campisi, T.; Akgün, N.; Ticali, D.; Tesoriere, G. Exploring public opinion on personal mobility vehicle use: A case study in Palermo, Italy. Sustainability 2020, 12, 5460. [Google Scholar] [CrossRef]
  52. Cortinovis, C.; Zulian, G.; Geneletti, D. Assessing Nature-Based Recreation to Support Urban Green Infrastructure Planning in Trento (Italy). Land 2018, 7, 112. [Google Scholar] [CrossRef] [Green Version]
  53. Venter, Z.; Barton, D.; Gundersen, V.; Figari, H.; Nowell, M. Urban nature in a time of crisis: Recreational use of green space increases during the COVID-19 outbreak in Oslo, Norway. Environ. Res. Lett. 2020, 12. [Google Scholar] [CrossRef]
  54. Ovsiannikova, T.; Nikolaenko, M.; Chilbakova, M. Expansion of urban recreation areas as a factor for human capital renovation. MATEC Web Conf. 2018, 143, 04011. [Google Scholar] [CrossRef]
  55. Siqueira-Reis, R.; Hino, A.A.; Ricardo-Rech, C.; Kerr, J.; Curi-Hallal, P. Walkability and physical activity: Findings from Curitiba, Brazil. Am. J. Prev. Med. 2013, 45, 269–275. [Google Scholar] [CrossRef] [Green Version]
  56. Völker, S.; Heiler, A.; Pollmann, T.; Claßen, T.; Hornberg, C.; Kistemann, T. Do perceived walking distance to and use of urban blue spaces affect self-reported physical and mental health? Urban For. Urban Green. 2018, 29, 1–9. [Google Scholar] [CrossRef]
  57. Lebedev, D.V.; Bogdanov, M.B. Пepexoд c PAPI нa CAPI: Oпыт интepвьюepoв и xapaктepиcтики, влияющиe нa иx oжидaния. Monit. Public Opin. Econ. Soc. Chang. J. 2019, 21, 511. [Google Scholar]
  58. Tesoriere, G.; Campisi, T. The Benefit of Engage the “Crowd” Encouraging a Bottom-up Approach for Shared Mobility Rating. In Proceedings of the Computational Science and Its Applications—ICCSA 2020, Lecture Notes in Computer Science, Cagliari, Italy, 1–4 July 2020; Gervasi, O., Murgante, B., Misra, S., Garau, C., Blečić, I., Taniar, D., Apduhan, B.O., Rocha, A.M.A.C., Tarantino, E., Torre, C.M., et al., Eds.; Springer: Cham, Germany, 2020; Volume 12250. [Google Scholar] [CrossRef]
  59. Li, Y.; Beeton, R.J.; Sigler, T.; Halog, A. Enhancing the adaptive capacity for urban sustainability: A bottom-up approach to understanding the urban social system in China. J. Environ. Manag. 2019, 235, 51–61. [Google Scholar] [CrossRef] [PubMed]
  60. Saaty, T.L. Decision making—The analytic hierarchy and network processes (AHP/ANP). J. Systems Sci. Systems Eng. 2004, 13, 1–35. [Google Scholar] [CrossRef]
  61. Roy, B. Multicriteria Methodology for Decision Aiding; Springer: New York, NY, USA, 1996. [Google Scholar] [CrossRef]
  62. Basbas, S.; Makridakis, C.M. A review of the contribution of multi-criteria analysis to the evaluation process of transportation projects. Int. J. Sustain. Dev. Plan. 2007, 2, 387–407. [Google Scholar] [CrossRef]
  63. Mimović, P.; Stanković, J.; Janković-Milić, V. Decision-making under uncertainty–the integrated approach of the AHP and Bayesian analysis. Econ. Res. Ekon. Istraživanja 2015, 28, 868–877. [Google Scholar]
  64. Gurnani, A.P.; Lewis, K. Robust multiattribute decision making under risk and uncertainty in engineering design. Eng. Optim. 2005, 37, 813–830. [Google Scholar] [CrossRef] [Green Version]
  65. Triantaphyllou, E.; Mann, S.H. Using the analytic hierarchy process for decision making in engineering applications. J. Ind. Eng. Appl. Pract. 1995, 2, 35–44. [Google Scholar]
  66. Saaty, T.L. Decision making with the analytic hierarchy process. Int. J. Serv. Sci. 2008, 1, 83–98. [Google Scholar] [CrossRef] [Green Version]
  67. Goepel, K.D. Business Performance Management Singapore (BPMSG), AHP Online System—AHP-OS. 2019. Available online: https://bpmsg.com/ahp/ (accessed on 18 March 2020).
  68. Generalni Urbanistički Plan grada Rijeke—Neslužbeni Pročišćeni Tekst (“Službene Novine Primorsko-Goranske županije” broj 7/07, 14/13 i “Službene Novine Grada Rijeke” broj 8/14, 3/17, 21/19 i 11/20 -ispr.). Available online: https://www.rijeka.hr/wp-content/uploads/2017/01/GUP_ID_JR_2017_Obrazlozenje_neprocisceni.pdf (accessed on 1 September 2020).
  69. Obrazloženje Generalnog Urbanističkog Plana Grada Rijeke—Neslužbeni Pročišćeni Tekst. Available online: https://www.rijeka.hr/wp-content/uploads/2020/03/Obrazlozenje-Generalnog-urbanisti%C4%8Dkog-plana-Grada-Rijeke-neslu%C5%BEbeni-pro%C4%8Di%C5%A1%C4%87eni-tekst.pdf (accessed on 1 September 2020).
  70. Odluka o Donošenju Generalnog Urbanističkog Plana Grada Rijeke—Neslužbeni Pročišćeni Tekst. Available online: https://www.rijeka.hr/wp-content/uploads/2019/09/Odluka-o-dono%C5%A1enju-Prostornog-plana-ure%C4%91enja-grada-Rijeke-neslu%C5%BEbeni-pro%C4%8Di%C5%A1%C4%87eni-tekst.pdf (accessed on 1 September 2020).
  71. Park, Y.; Garcia, M. Pedestrian safety perception and urban street settings. Int. J. Sustain. Transp. 2020, 14, 860–871. [Google Scholar] [CrossRef]
  72. Mehta, V. Walkable streets: Pedestrian behavior, perceptions and attitudes. J. Urban. 2008, 1, 217–245. [Google Scholar] [CrossRef]
  73. Sarkar, S. Determination of service levels for pedestrians, with European examples. Transp. Res. Rec. 1993, 1405, 35. [Google Scholar]
  74. Campisi, T.; Canale, A.; Tesoriere, G.; Lovric, I.; Čutura, B. The Importance of Assessing the Level of Service in Confined Infrastructures: Some Considerations of the Old Ottoman Pedestrian Bridge of Mostar. Appl. Sci. 2019, 9, 1630. [Google Scholar] [CrossRef] [Green Version]
  75. Bosnar, A.; Stemberga, V.; Cuculić, D.; Jerković, R.; Čoklo, M. Pedestrian Traffic Fatalities in Southwestern Croatia. Coll. Antropol. 2008, 32, 129–131. Available online: https://hrcak.srce.hr/34556 (accessed on 3 May 2020).
  76. Janjatović, J.; Pilepić, D.; Pevalek, V. Utjecaj pješačkih prijelaza na poboljšanje mobilnosti pješačkog prometa u gradovima. Zb. Veleučilišta Rijeci 2015, 3, 205–220. Available online: https://hrcak.srce.hr/139728 (accessed on 3 May 2020).
  77. Šurdonja, S.; Cuculić, M.; Pranjić, I.; Deluka-Tibljaš, A.; Renčelj, M. Analiza mogućnosti unaprjeđenja sigurnosti u zonama pješačkih prijelaza izvan raskrižja- primjer iz grada Rijeke. In Hrvatski Kongres o Cestama, Zbornik Radova; Šimun, M., Ed.; Hrvatsko društvo za ceste—Via Vita: Zagreb, Croatia, 2015; pp. 1–6. [Google Scholar]
  78. Jadhav, S.; Mali, V.; Ramachandran, P.K.; Rane, C. Large Scale Modelling of Wind Comfort and Safety Using ‘Pedestrian Comfort Analysis’-A Cloud-based App Crafted for Architects; Centre for Computational Technologies: Pune, India, 2018. [Google Scholar]
  79. Joshi, A.; Kale, S.; Chandel, S.; Pal, D.K. Likert scale: Explored and explained. Curr. J. Appl. Sci. Technol. 2015, 7, 396–403. [Google Scholar] [CrossRef]
  80. Rankavat, S.; Tiwari, G. Pedestrians perceptions for utilization of pedestrian facilities-Delhi, India. Transp. Res. Part F Traffic Psychol. Behav. 2016, 42, 495–499. [Google Scholar] [CrossRef]
  81. Tesoriere, G.; Campisi, T. The Benefit of Engage the “Crowd” Encouraging a Bottom-up Approach for Shared Mobility Rating. In International Conference on Computational Science and Its Applications; Springer: Cham, Germany, 2020; pp. 836–850. [Google Scholar]
  82. Boisjoly, G.; Yengoh, G.T. Opening the door to social equity: Local and participatory approaches to transportation planning in Montreal. Eur. Transp. Res. Rev. 2017, 9, 43. [Google Scholar] [CrossRef] [Green Version]
  83. Mouter, N.; Koster, P.; Dekker, T. Participatory Value Evaluation: A Novel Method to Evaluate Future Urban Mobility Investments; Tinbergen Institute Discussion Paper; Econstor: Amsteradm, The Netherlands, 2019; Available online: https://www.econstor.eu/.
  84. Rankavat, S.; Tiwari, G. Influence of actual and perceived risks in selecting crossing facilities by pedestrians. Travel Behav. Soc. 2020, 21, 1–9. [Google Scholar] [CrossRef]
  85. Nguyen, H. From Pedestrian Thoroughfare to Public Space: The Social Life of the Esplanade Underpass. J. Undergrad. Ethnogr. 2019, 9, 1–17. [Google Scholar] [CrossRef]
Figure 1. Description of variables related to walkability concept.
Sustainability 12 09470 g001
Figure 2. Flow-chart related to the research steps related to the study of the choice of itinerary in the urban area of Rijeka.
Sustainability 12 09470 g002
Figure 3. The approach to decision making and different situations [63,64].
Sustainability 12 09470 g003
Figure 4. Geolocation of the study area and photos of the outdoor market area in Rijeka (map source: https://www.openstreetmap.org/).
Sustainability 12 09470 g004
Figure 5. Evaluated area of Rijeka (Croatia) [22] (map source: https://www.openstreetmap.org/).
Sustainability 12 09470 g005
Figure 6. Different itineraries selected for Analytical Hierarchy Process (AHP) analysis [22] (map source: https://www.openstreetmap.org/).
Sustainability 12 09470 g006
Table 1. Summary of the widespread questionnaire.
Section 1VariableAttributeVariableAttributeVariableAttribute
GenderMale
Female
Age18–24
25–39
40–54
55–64
≥ 65
JobStudent
Worker
Retiree
Other
Section 2VariablePossible reply QuestionPossible reply QuestionPossible reply QuestionPossible reply
(Likert scale)
road use frequency Every day
4 times per week
2–3 times per week
Once per week
More rarely
itinerary selectionItinerary 1
Itinerary 2
Itinerary 3
Itinerary 4
Level of Service (LOS) of road network A
B
C
D
E
F
ease of access1
2
3
4
5
Section 3comparison of routes in pairs
(AHP)
User perceptionScale
comfort
safe
confusion
Saaty scale (0–4)
Table 2. Distribution of respondents based on gender.
GenderFrequencyRelative FrequencyCumulative Relative Frequency
Male3854.3%54.3%
Female3245.7%100.0%
Total70100.0%
Table 3. Distribution of respondents based on age group.
AgeFrequencyRelative FrequencyCumulative Relative Frequency
18–244361.4%61.4%
25–392028.6%90.0%
40–5457.1%97.1%
55–6411.4%98.6%
> 6511.4%100.0%
Total70100.0%
Table 4. Distribution of respondents based on profession group.
ProfessionFrequencyRelative FrequencyCumulative Relative Frequency
Student3448.6%48.6%
Worker3448.6%97.1%
Retiree11.4%98.6%
Other11.4%100.0%
Total70100.0%
Table 5. Distribution of respondents according to the frequency of use of the road network.
Use Frequency Frequency Relative Frequency Cumulative Relative Frequency
Every day912.9%12.9%
4 times per week 1825.7%38.6%
2–3 times per week1521.4%60.0%
Once per week 1014.3%74.3%
More rarely1825.7%100.0%
Total70100.0%
Table 6. Distribution of respondents according to the frequency of use of each route.
Route Travelled Most Frequently Frequency Relative Frequency Cumulative Relative Frequency
Itinerary 11927.1%27.1%
Itinerary 21521.4%48.6%
Itinerary 31420.0%68.6%
Itinerary 42231.4%100.0%
Total70100.0%
Table 7. Distribution of respondents according to the level of service of the infrastructure.
LOS Frequency Relative Frequency Cumulative Relative Frequency
A11.4%1.4%
B57.1%8.6%
C4462.9%71.4%
D1521.4%92.9%
E57.1%100.0%
F00.0%100.0%
Total 70100.0
Table 8. Distribution of respondents based on the possibility to walk in the road network.
Possibility to Go on Walk Frequency Relative Frequency Cumulative Relative Frequency
Absolutely negative00.0%0.0
Very negative11.4%1.4%
Negative34.3%5.7%
Positive3245.7%51.4%
Very positive2840.0%91.4%
Absolutely positive68.6%100.0%
Total70100.0%
Table 9. Results of the Multi-Criteria Analysis through the use of AHP method.
AHP RESULTS
ComfortSafetyConfusion
RoutesWeightsRankingRoutesWeightsRankingRoutesWeightsRanking
Itinerary 122.0%3Itinerary 122.8%3Itinerary 129.6%1
Itinerary 225.8%2Itinerary 223.6%2Itinerary 223.1%3
Itinerary 321.8%4Itinerary 317.6%4Itinerary 328.8%2
Itinerary 430.4%1Itinerary 436.0%1Itinerary 418.5%4
Consistency Ratio (CR) = 1.1%CR = 0.7%CR = 0.2%
Publisher’s Note: MDPI stays neutral with regard to jurisdictional claims in published maps and institutional affiliations.

