Article

Risk Influence Analysis Assessing the Profitability of Large Photovoltaic Plant Construction Projects

by
Luis Serrano-Gomez
and
Jose Ignacio Muñoz-Hernandez
*
Project Engineering Group, Departamento de Mecánica Aplicada e Ingeniería de Proyectos, Escuela Técnica Superior de Ingenieros Industriales de Albacete, University of Castilla-La Mancha, Avda. de España S/N, 02071 Albacete, Spain
*
Author to whom correspondence should be addressed.
Sustainability 2020, 12(21), 9127; https://doi.org/10.3390/su12219127
Submission received: 15 September 2020 / Revised: 22 October 2020 / Accepted: 23 October 2020 / Published: 3 November 2020

Abstract

:
The global energy system is in a phase of change for power generation technologies which involve traditional fossil fuel-based technologies to renewable energy-based systems, thanks to lower construction costs, mainly for photovoltaic energy, and changes in countries’ energy policies. In the case of Spain, both factors have led to a reactivation of renewable technologies, which can be found from the data on requests for access and connection to the electricity transmission network that are being processed in Red Eléctrica de España (REE). The requests that were granted access to the network exceeded 100 GW of power in November 2019 alone, and the companies which made the requests must commence electricity production by 2025. During the early stage of approval considerations, it is necessary to carry out an influence study of the risks that can already be identified, as this would enable determining the effects of these risks on the project’s main financial parameters. Based on a risk identification for similar prior projects, experts are typically asked to make their judgments on the influence of such risks on the main economic variables of a project, focusing on the project’s cost, time, and scope. By applying the fuzzy sets, these judgments can be transformed into triangular values that, through Monte Carlo simulation, allow us to assess the influence of these risks on the main financial parameters: the net present value (NPV), internal rate of return (IRR), and payback (PB); as a result of obtaining these parameters, a response to project risks can be planned. To check the functionality of the model, it was applied to a case study involving a construction project for a 250 MW photovoltaic plant located in Murcia (Spain). The application of this methodology allowed us to determine which evaluation criteria are most appropriate based on the philosophy of the PMO (Project Management Office) and the data that were obtained.

1. Introduction

We are currently in a global situation that favors the use of various forms of renewable energy, the decarbonization of energy production, and the promotion of electric vehicles, with the aim of reducing pollutant emissions and protecting the environment. In Spain, this approach is endorsed by the National Energy and Climate Plan, which has set out its objectives for the new configuration of the national energy mix system for 2021–2030. Among other goals, this plan has set a target of 110 GW of renewable energy generation out of a total of 157 GW of total new electricity generation, which means that 70% of the power mix will be made up of renewable energy by 2030. The expectations created for renewable generation have been so great that, for solar photovoltaic energy alone, there are more than 100 GW of renewable projects in the pipeline, a figure that is well above the 37 GW that was envisaged in the Plan Nacional Integrado de Energía y Clima (PNIEC) 2021–2030.
During this phase of the process, as work progresses, more data and information about projects become available, which allows for a quantitative evaluation to be made. In particular, it becomes possible to conduct a study on the influence of the risks identified at an early stage to determine their effects on the main financial parameters of each project.
In the literature, there are many studies about the quantitative analysis related to the main financial parameters: [1] analyzes three evaluation techniques for assessing the profitability of renewable projects, net present value (NPV), qualitative multicriteria decision-making, and analysis of real options; [2] studies the influence of risk over development costs; [3] seeks to optimize Japan’s global energy portfolio using an internal rate of return (IRR) analysis and the Monte Carlo method; [4] conducts an economic analysis on the implementation of wind turbines on German farms using NPV analysis; [5] establishes a new methodology based on fuzzy logic to predict the cash flow variations over the course of a construction project; [6] studies the risk impact and risk likelihood on 48 commercial construction projects; and [7] uses fuzzy sets theory for the assessment of working capital requirements.
Studies employing fuzzy sets for risk assessments can also be found in the literature. For instance, [8] applies fuzzy sets for risk assessments of complex construction projects; also in [9], the fuzzy sets theory has been applied for risk assessments involving the rehabilitation project of the Polytechnic University of Cartagena, [10] established a risk assessment methodology based on fuzzy analytic hierarchy process (AHP) for public–private partnership (PPP) projects in China, whilst [11] proposes a model based on the fuzzy analytic hierarchy process (FAHP) to improve the efficiency of contractor bidding decisions. Additionally, [12] uses fuzzy sets for risk assessments in nuclear systems, [13] applies fuzzy sets for green product development, and [14] conducts risk assessments of construction projects based on the multi-attribute decision-making methods. Studies employing fuzzy logic can also be found in renewable energy research. For instance, [15] analyzed risk policies for prioritizing renewable energy projects, [16] used fuzzy analytic network process (ANP) to analyze marine wind park operation risks, [17] used fuzzy logic for risk assessments in wind farm construction projects, [18] studied the use of risk analysis in photovoltaics integration building projects in China, [19] applied fuzzy logic in an attempt to minimize costs, deadlines, blockage, and environmental impacts in a hydroelectric construction project, and [20] identified and assessed a biomass gasification system using bow-tie analysis, enabling the identification of the causes and consequences of gas leakage.
A combination of fuzzy sets and probabilistic analysis using Monte Carlo simulation has also been employed in numerous studies, such as that of [21] in which both of these methods were used to predict peak power and to plan power systems. Additionally, [22] used fuzzy sets to study the likelihood of favorable wind conditions in certain areas and used Monte Carlo simulation to predict the quantity of thermal energy that would be produced by a wind turbine, while [23] studied the appropriate error measures for the estimation of fuzzy linear regression model parameters using the Monte Carlo method.
To study the influence of risks on the main profitability project parameters, in this work, based on the previously identified risks, an expert panel was asked to provide judgments on the influence of risks on the main economic items of a project in terms of its cost, time, and scope.
Applying the fuzzy methodology, these judgments were then transformed into triangular numbers which, through the use of Monte Carlo simulation, make it possible to determine the influence of risks on a project’s main financial parameters in terms of the overall project framework, as well as its cost, time, and project scope. These risks can then be classified to plan an appropriate risk response strategy. This comprehensive analysis also allows planning, at a later stage, of the risk response for any given project based on the project management team’s preferred approach to risk management.
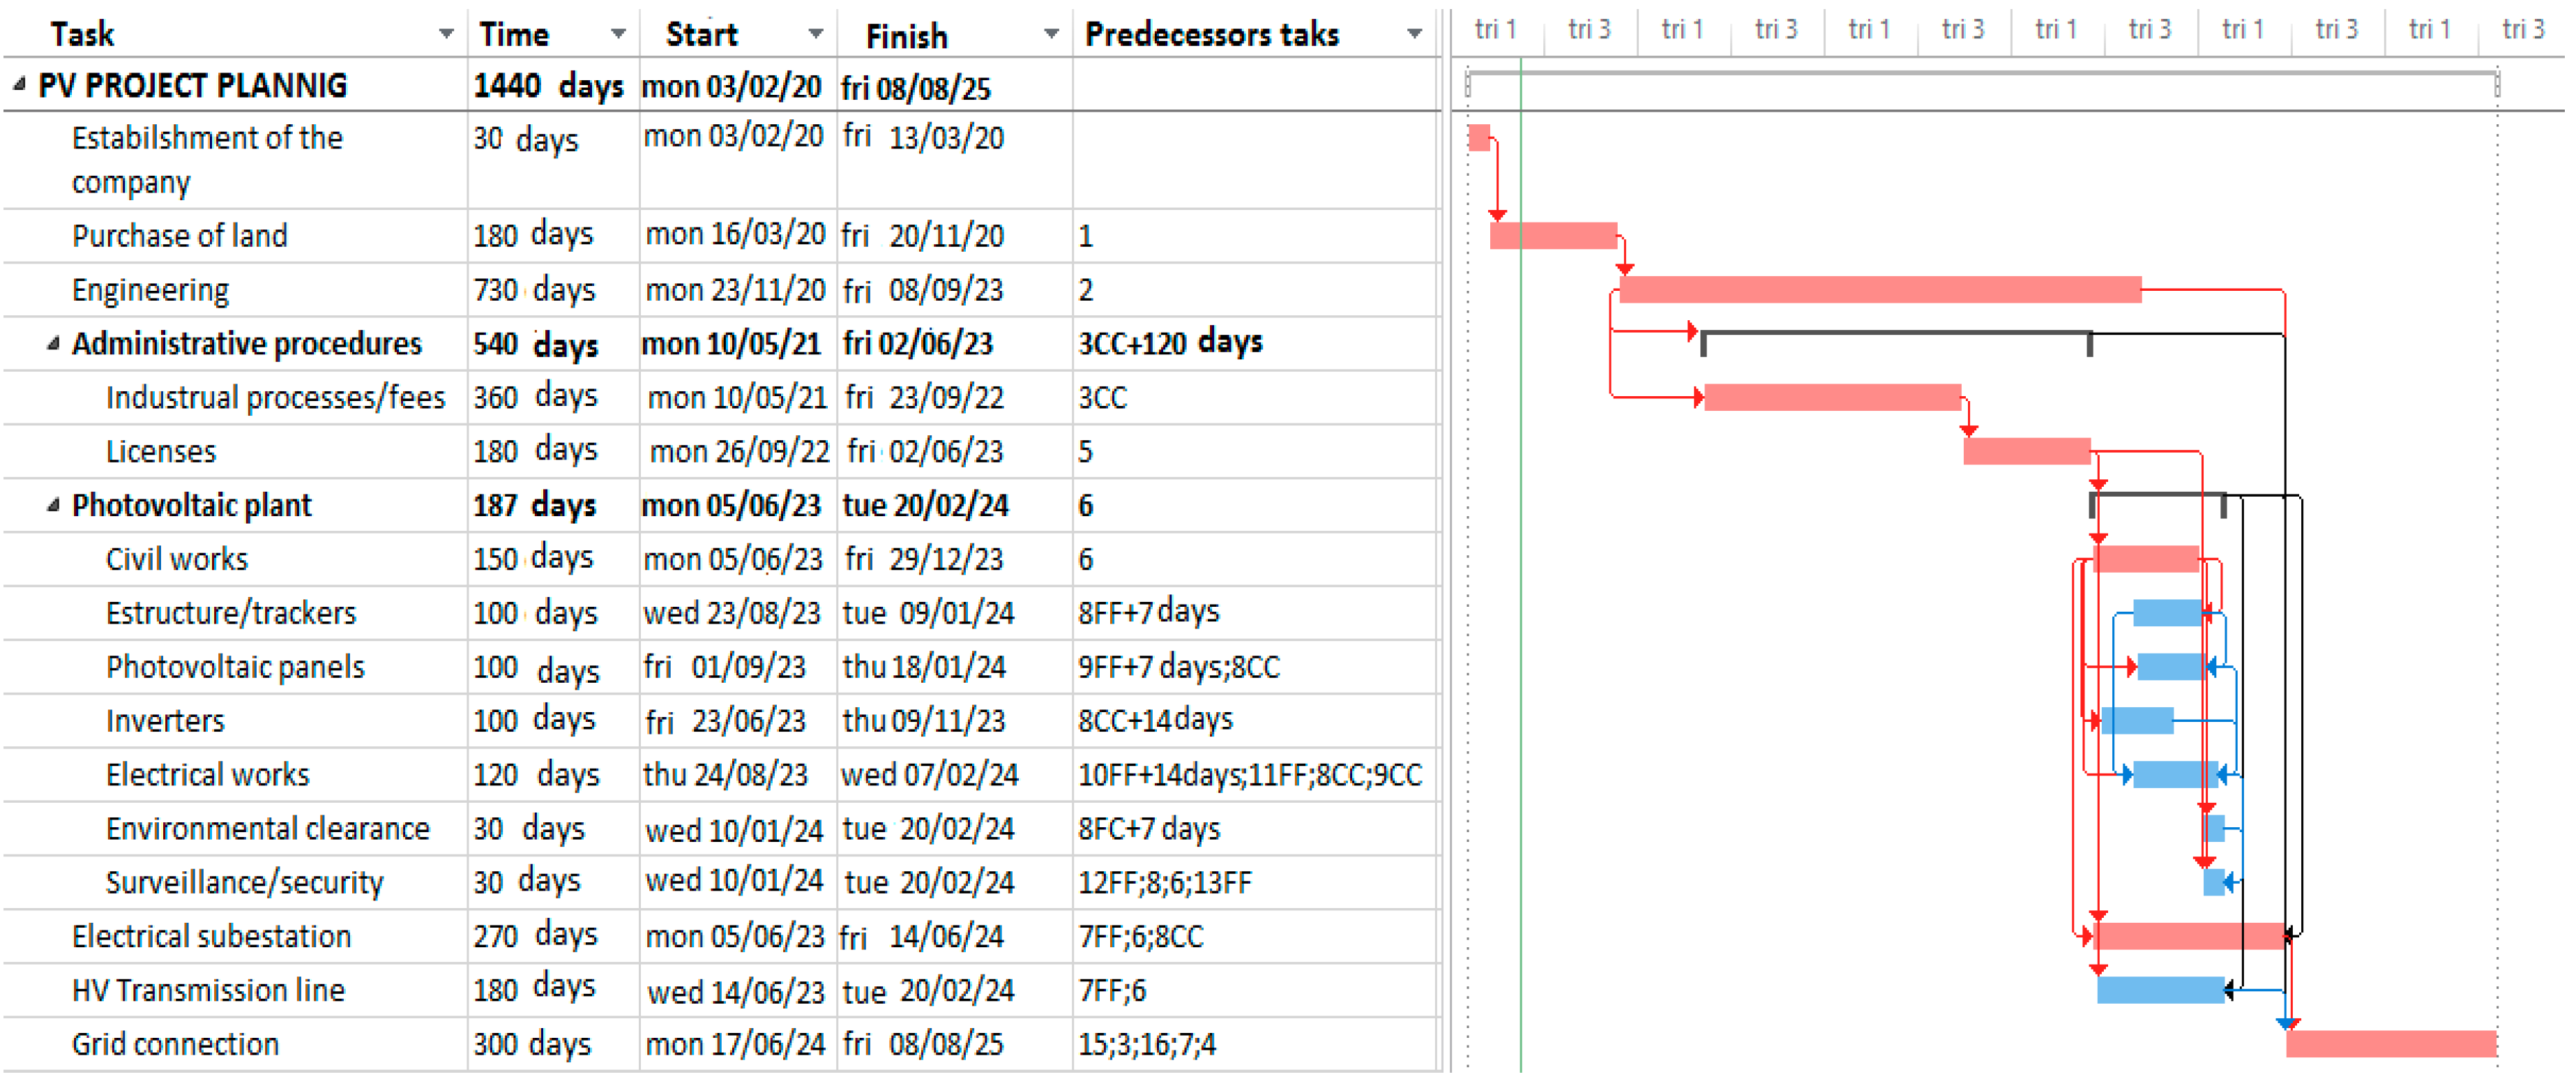
To test the functionality of the model, we applied the methodology to the case study of a construction project for a 250 MW solar photovoltaic plant located in the Spanish region of Murcia.

2. Methodology

Both risk assessment and management have been extensively studied in [24], where definitions and risk metrics are discussed, as well as the ways of addressing issues such as uncertainty, robustness, and resilience.
For carrying out the quantitative risk analysis, a model is proposed, based on the following steps:
  • Establishing a panel of experts.
  • Preparing and sending out surveys.
  • Defining the distribution function of opinions.
  • Prioritizing risks.

2.1. Establishing a Panel of Experts

For qualitative risk analysis, a risk assessment group was established, which was composed of people with extensive experience in construction projects that use renewable photovoltaic energy [25].
The experts must be selected from professionals who have been involved in the development, design, and construction of photovoltaic solar plants, with the aim of covering the greatest possible number of profiles involved in such projects. In particular, the expert panel for qualitative analysis must cover at least the following profiles: Project Manager, Site Manager, Operation and Maintenance Manager, Developer, Administrative Processing Technician, and Plant Supervisor.

2.2. Preparing and Sending Out Surveys

The questionnaires used to gather the experts’ opinions included the following sections:
  • Instructions for completing the questionnaire.
  • General description of the project.
  • Expert opinions on the economic and temporal aspects of the project.
  • Expert opinions on the impact of the risk on the economic and temporal aspects in terms of cost, time, and scope of the project.
These questionnaires had been developed in the following phases:
  • First phase: the experts were asked to question both items with their initial assessments, where they could propose to include, eliminate, or modify both the items and their amounts.
  • Second phase: once the responses had been received and the opinions considered, the experts were asked to approve the items resulting from the first phase. Once this approval had been obtained, they were asked to formulate their opinions on which items were affected by each of the risks identified in [26], from the point of view of cost, project time, and scope, indicating the maximum and minimum values of each item for each risk.
  • Third phase: as a result of the second phase, new items were affected. These items were again included in the questionnaires and sent to the experts for review and assessment. This third phase was repeated as many times as necessary until obtaining the approval of the 10 experts, at which point the survey collection phase was considered to be complete.

2.3. Defining the Distribution Function of the Opinions

As a result of gathering the experts’ opinions, three values were obtained, namely, the minimum value, the expected value, and the maximum value that an item can reach due to the impact of a given risk. Consequently, a triangular distribution function was obtained that behaves in a similar way to a fuzzy number. Following the research carried out by [27], the triangular function was used to analyze the identified risks.
According to fuzzy set theory [9,28,29], in a universal set X, a fuzzy subset A of X is defined by a membership function μA (x), which assigns each element x in X to a real number in the interval [0, 1].
The value of the function μA (x) is the membership grade of x in A. When μA (x) is large, this indicates a strong membership grade of x in A.
Fuzzy numbers are defined as A = {x, μA (x)}, where x is the value in the R interval and its membership function μA: R → [0, 1], with the following properties:
  • Constant in (−∞, a]: μA (x) = 0 Ɐ × є (−∞, a],
  • Strictly increasing in [a, b]
  • Strictly decreasing in [b, c],
  • Constant in [c, ∞): μA (x) = 0 Ɐ × є [c, ∞),
where, a, b, and c are real numbers.
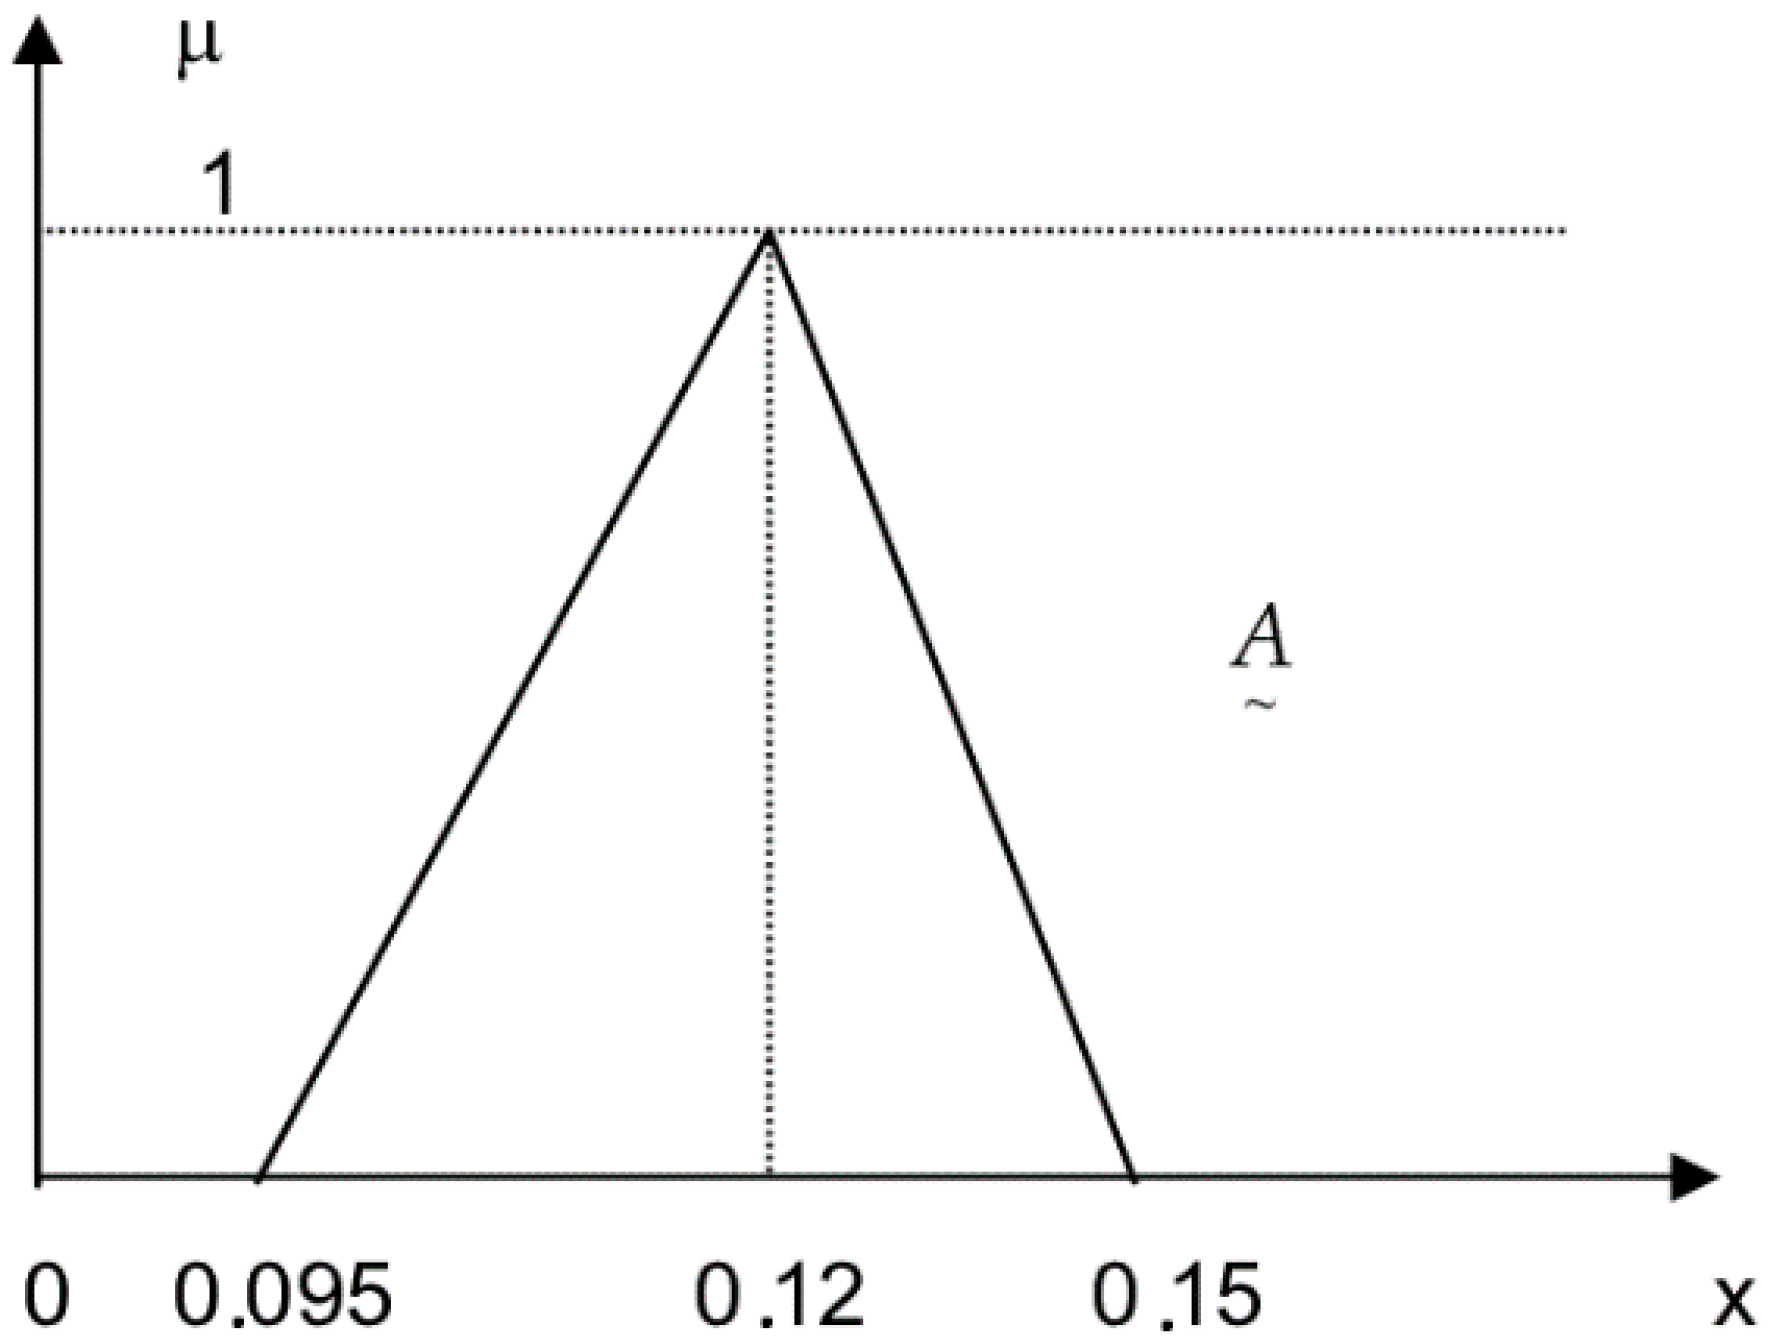
If μLA is defined as the left part of the membership function of a fuzzy number A, defining μLA(x) = μA (x), for all x [a,b], and μRA as the right part of the membership function of the fuzzy number A, defining μRA(x) = μA (x), for all x [b,c], then the triangular fuzzy number is identified as A = (a,b,c), and its membership function defined in Equation (1), where a, b, and c are real numbers, in this case a ≤ b = 0 ≤ c.
μ A ( X ) = [ 0 X < a μ A L ( X ) = X a b a a X b 1 X = b μ A R = X c b c b X c 0 X > c
Figure 1 shows an example of a triangular fuzzy number.

2.4. Risk Prioritization

Once the survey collection phase had been completed, the opinions of the experts were aggregated using the geometric mean, which allows for defining triangular distribution functions for these final opinions on the influence of the identified risks on the items considered. The triangular distribution functions were entered into the @Risk tool (Palisade LLC, Ithaca, NY, USA) for subsequent analysis using Monte Carlo simulation [30].
Using the @Risk tool, 100 Monte Carlo simulations were carried out, each with 10,000 iterations, to obtain results that were representative of the sample.
These simulations yielded a value for the main parameters used to evaluate the profitability of a project, that is, net present value (NPV), payback period (PB), and internal rate of return (IRR). This result was obtained from the emergence of all the risks in the project.
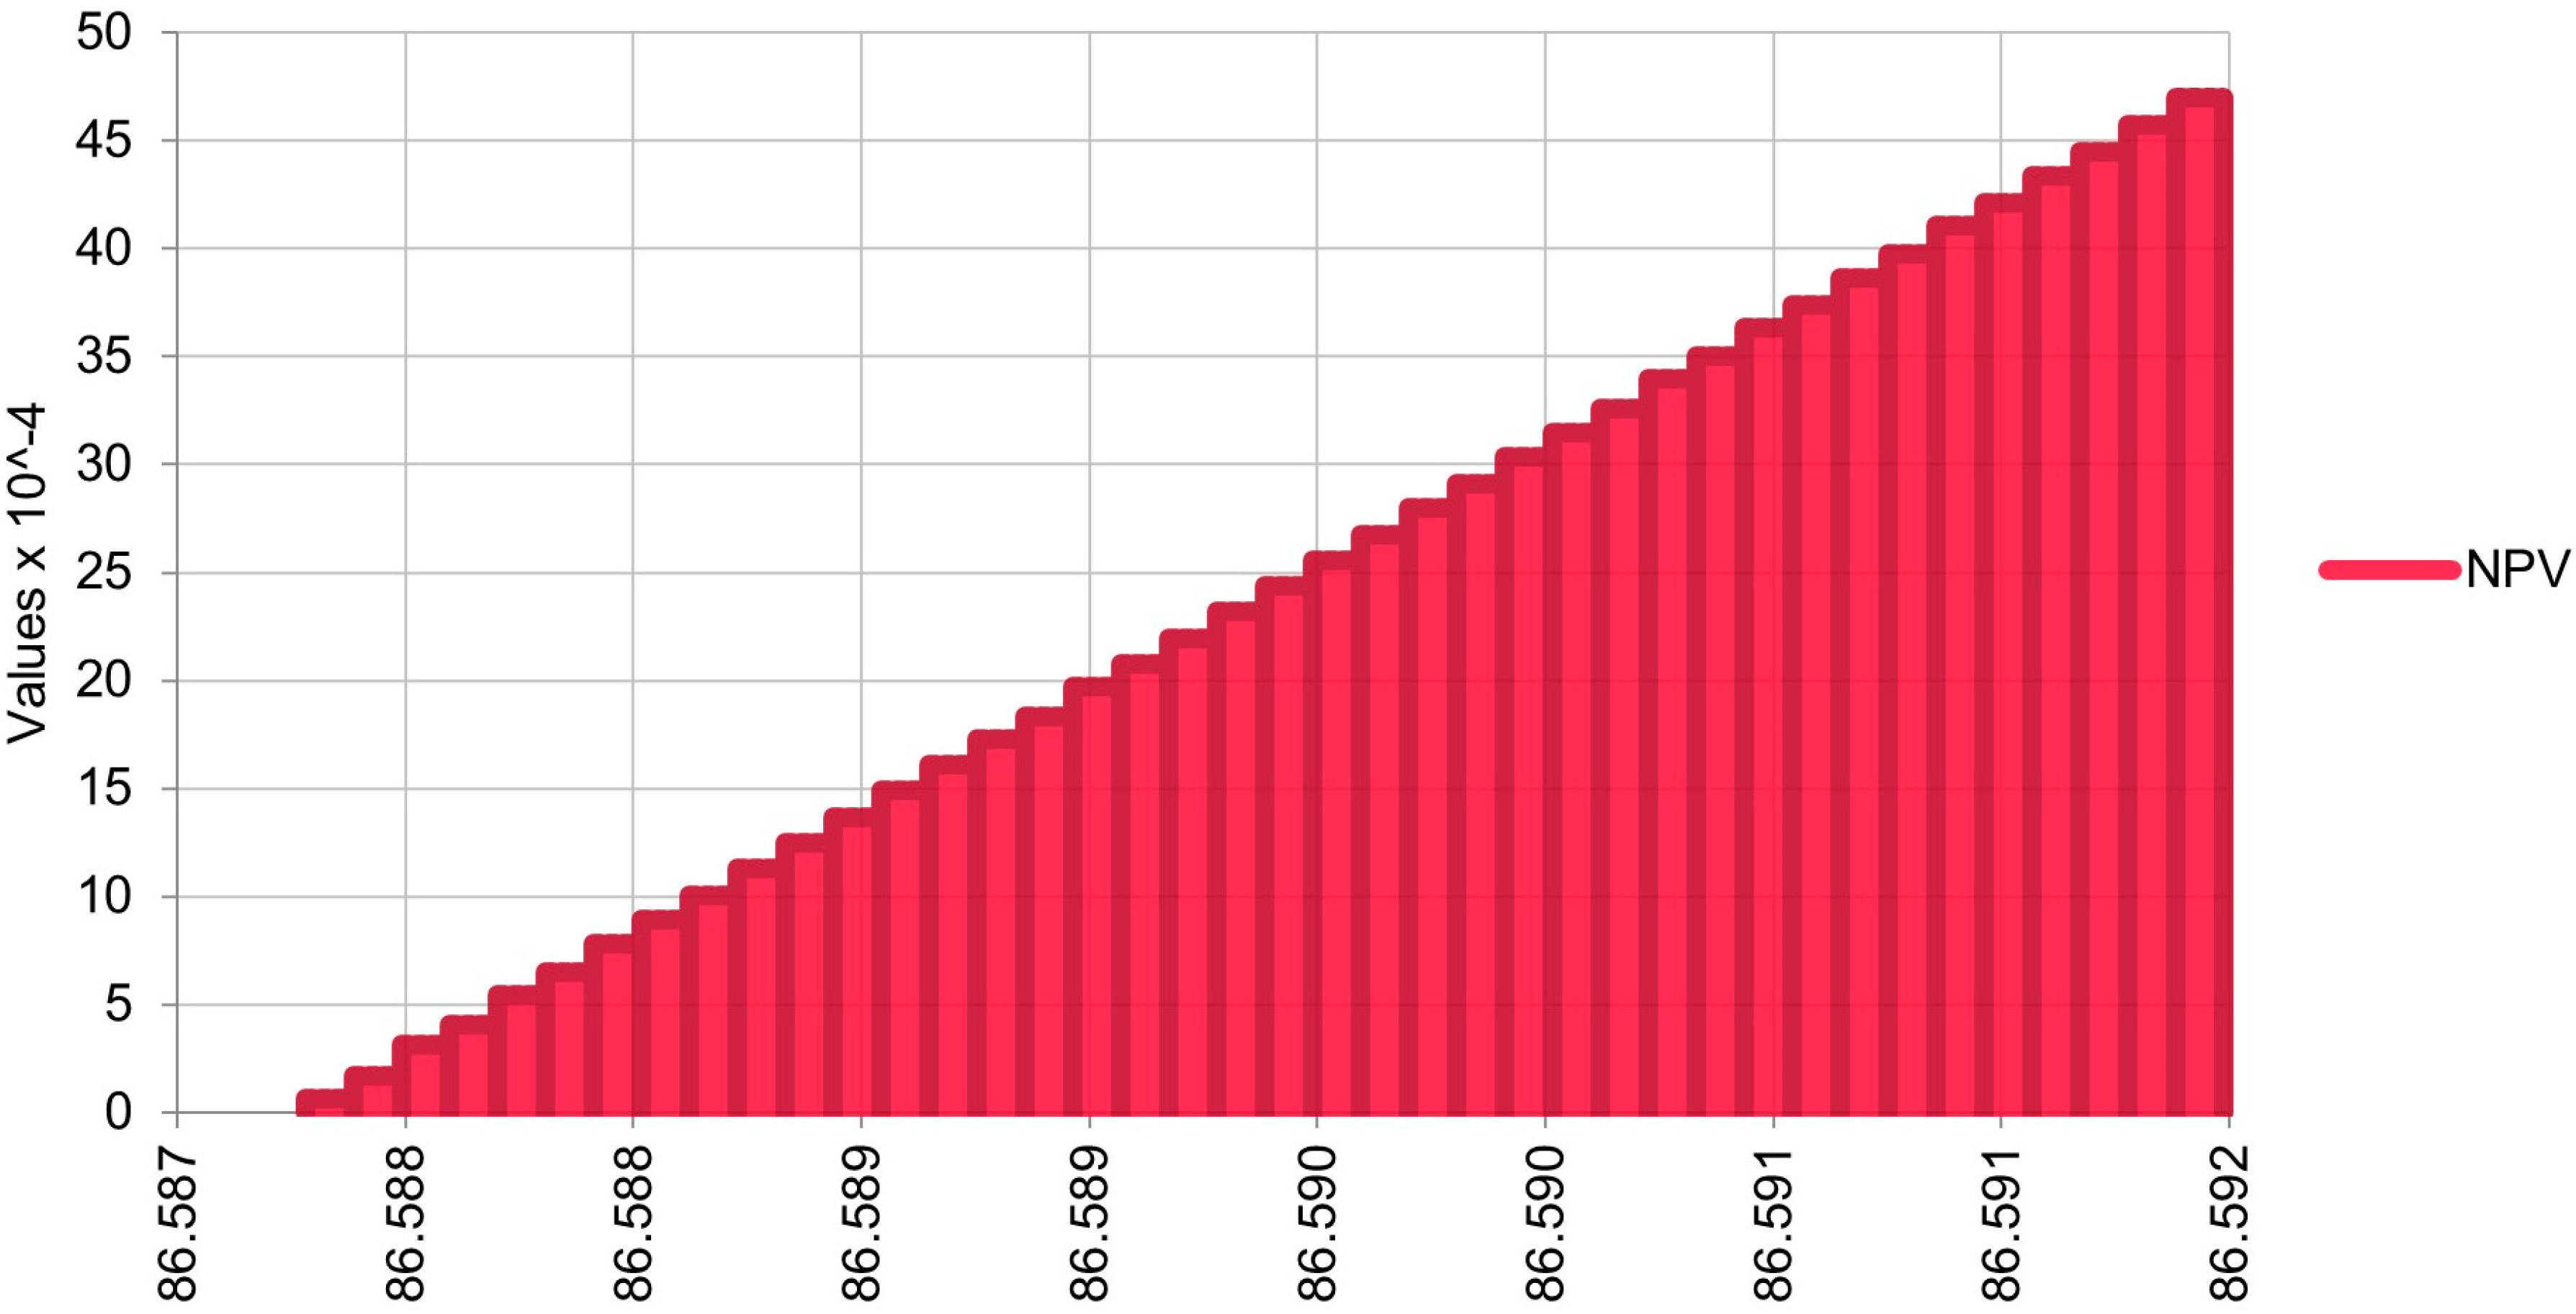
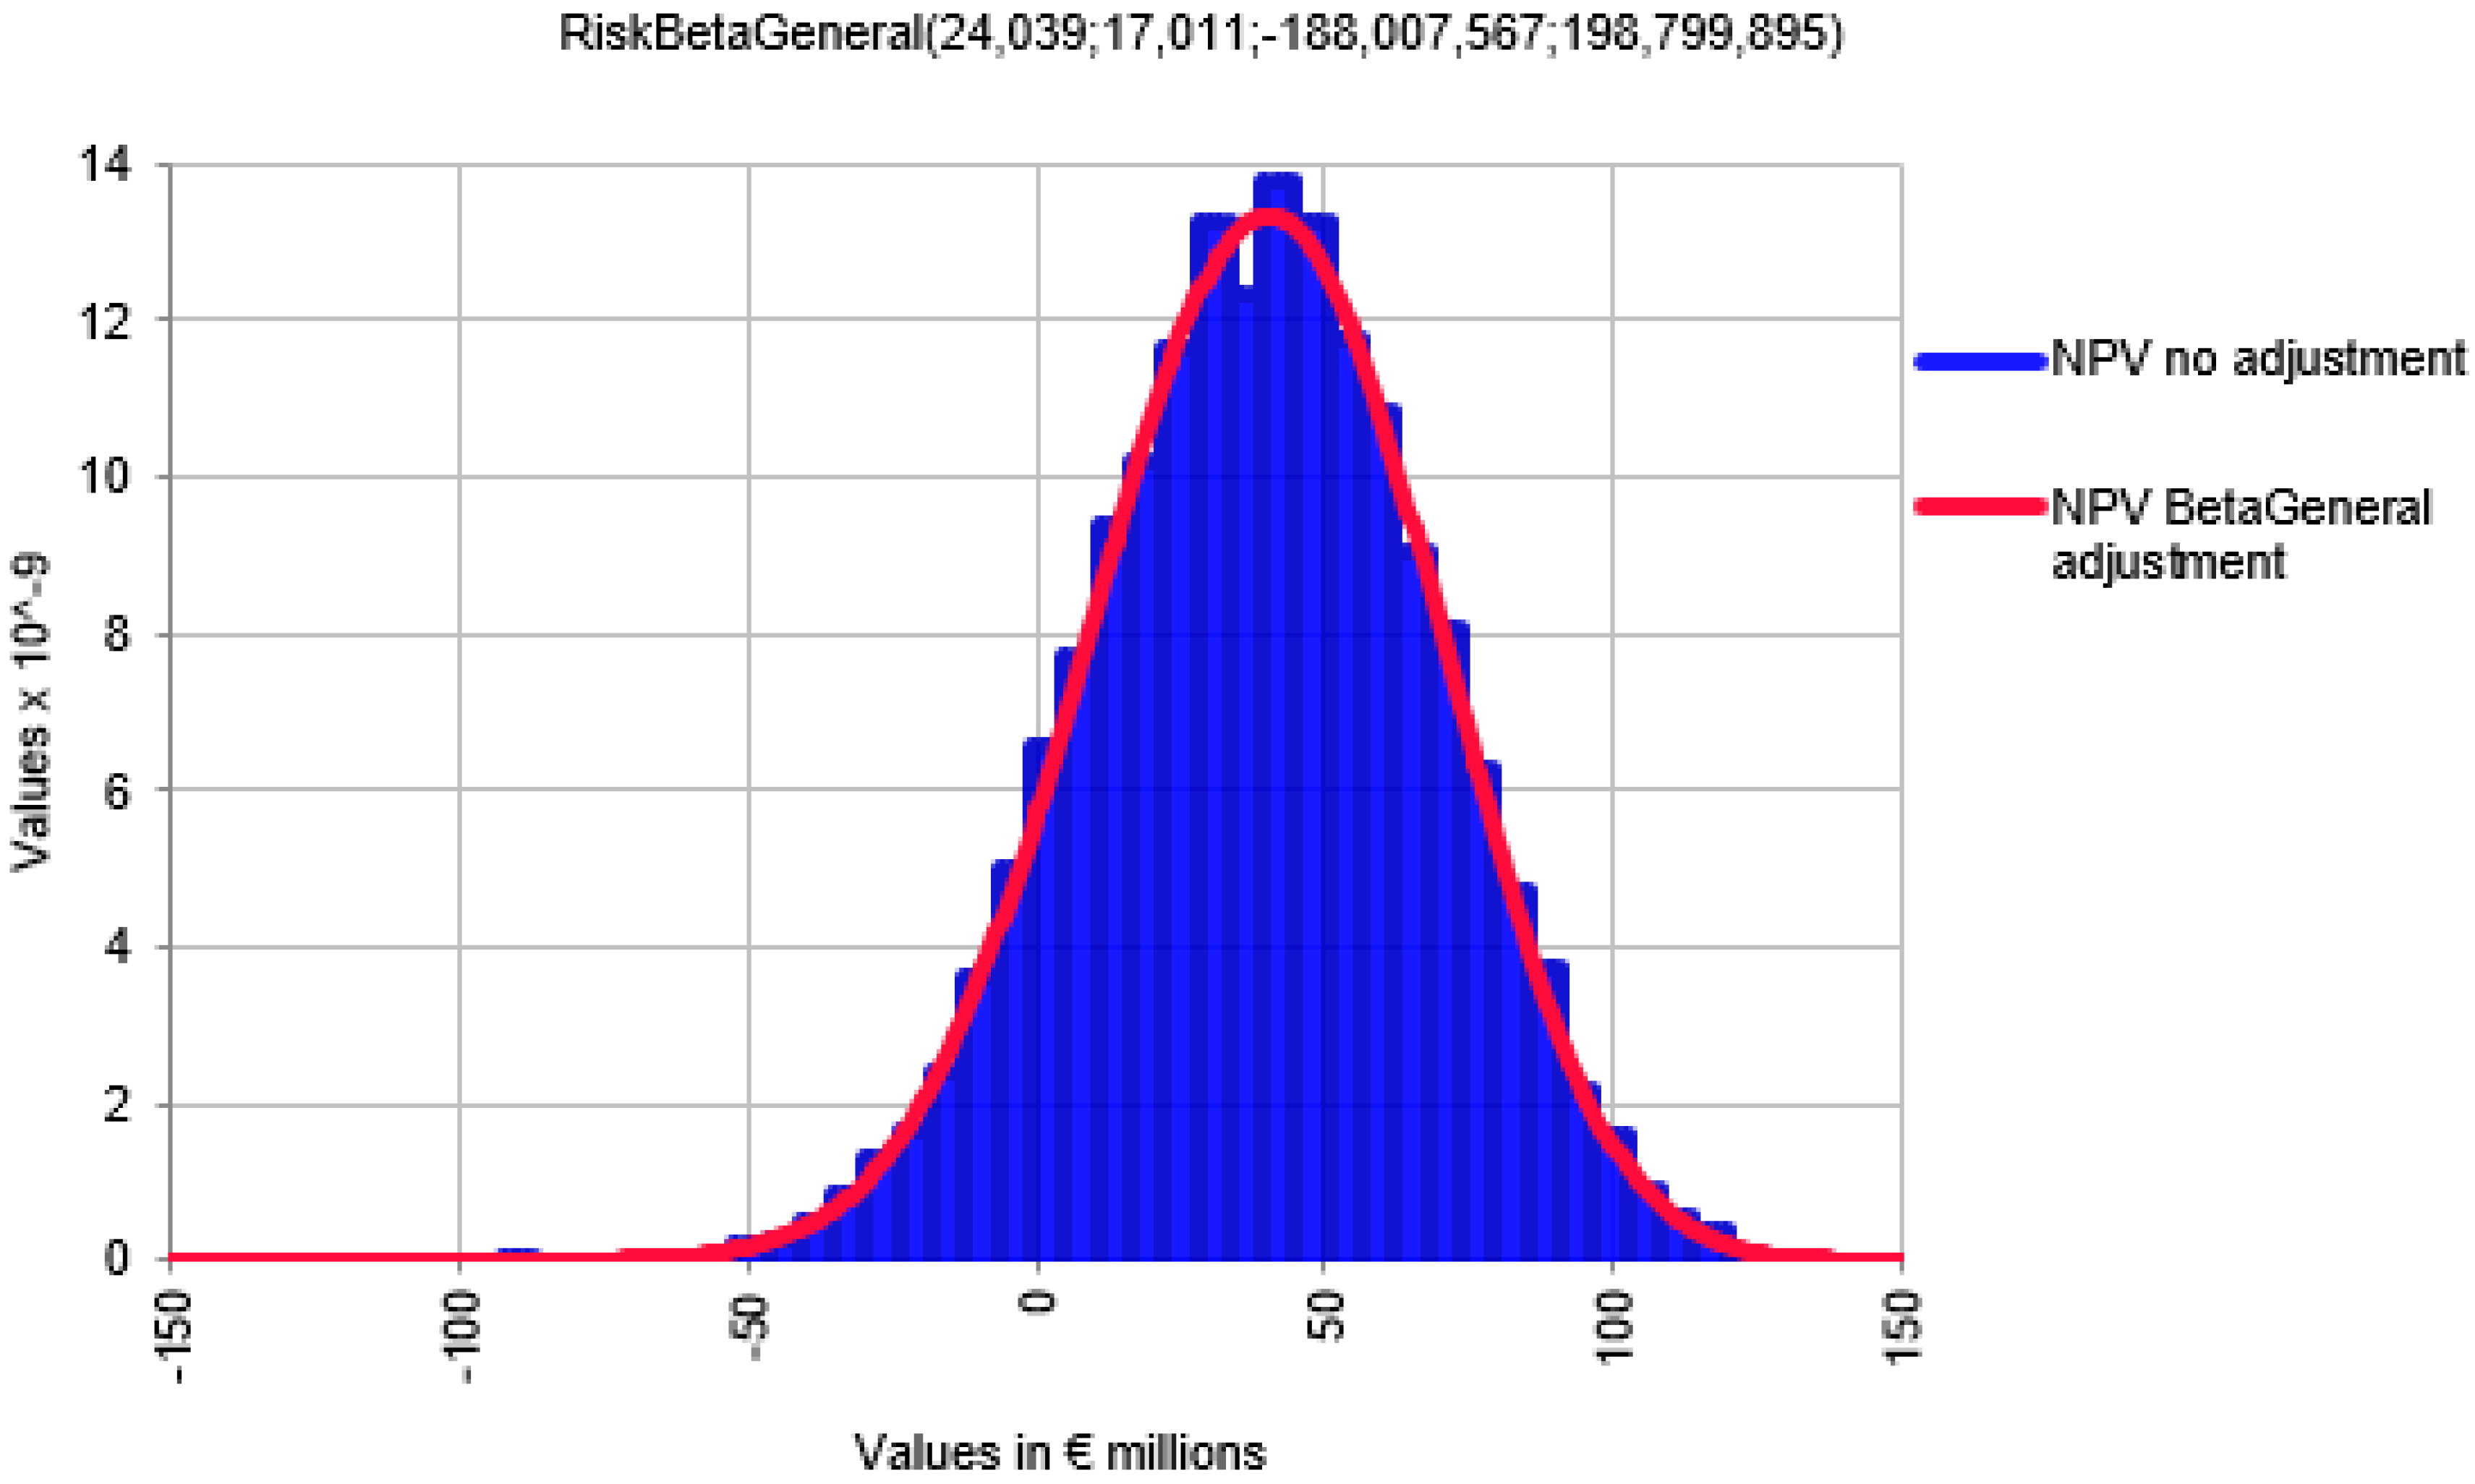
The simulation also allows for determining a range of values for NPV, PB, and IRR with respect to the mode for each identified risk. This range, obtained from the sensitivity analysis, shows the capacity of a given risk to influence each of the economic or temporal items of the project. Thus, the greater the range of values of a parameter with respect to its mode, the more dispersed the function resulting from the simulation, the less predictable its behavior, and, therefore, the more influential the risk, as can be seen in Figure 2 and Figure 3.
In the case of risks affecting only one item, the result obtained will be the result of the influence of the risk on the profitability of the project. In the case of risks affecting more than one item, the results of the simulation for the different items affected by the same risk should be aggregated. To do this, three study scenarios are proposed:
  • SUM: All risks emerge in the project and their effect on the project items is cumulative. The ranges of variation in NPV, PB, and IRR for each item influenced by a given risk are summed. The SUM criterion is suitable for project management team profiles with a high aversion to risk. This criterion penalizes risks that influence one or two items, although, these are decisive risk factors, such as those that directly affect the project’s income.
  • MAXIMUM INTERVAL: All risks emerge in the project, but when this criterion is adopted, the range of values of the items affected by a risk is included within the maximum range for each risk. The main drawback of this criterion is that it does not consider the entire sample of those risks that influence more than one economic item.
  • GEOMETRIC MEAN: All risks emerge in the project, but the geometric mean of the variation intervals is considered to represent the most probable value of a risk’s influence on the parameters of economic analysis. The geometric mean is chosen over the mean or arithmetic average as it is less sensitive to the outliers of the sample. The GEOMETRIC MEAN criterion is suitable for those project management teams that do not believe that “everything could go wrong”. This criterion considers the entire sample and does not discriminate between risks with influence on one item and those with influence on multiple items.
For each of the four previously described scenarios, a final classification of risks will be made according to their influence on the NPV, PB, and IRR, considering both the general framework of the project and the influence of these risks on the cost, time, or scope of the project. Based on this classification, an effective risk response strategy can be planned, along with the tasks that will be undertaken to monitor and control such risks.

3. Case Study

To test the methodology, a real project for the construction of a 250 MW photovoltaic plant was chosen. The plant is located in the province of Murcia, Spain, and, at the time, was in the economic–financial structuring phase, which usually takes place before beginning the construction work.
The general technical features of the project were:
  • Nominal power: 250 MW;
  • Surface occupied by the solar field: 692 Ha;
  • Number of photovoltaic panels: 1,062,600 panels (270 Wp);
  • Photovoltaic panel support structure: structure with a single-axis solar tracker and a single-pole drive system;
  • Current inverter: 180 inverters of 1590 kVA/c.u.;
  • First level of voltage rise: 180 transformers of 1600 kVA/c.u.;
  • Internal underground distribution networks linking the transformation stations for the first rise in voltage level;
  • Park transformer substation: consisting of three 100 MVA/c.u. sites, where the voltage will rise from 30 kV to 132 kV;
  • Overhead 132 kV evacuation line of 12 km in length;
  • Transformer substation for connection to the REE transmission network, which is composed of one 300 MVA site in which the voltage will rise from 132 kV to 400 kV.

3.1. Establishing the Panel of Experts

For the qualitative risk analysis, a risk assessment group was established, which consisted of 10 experts with extensive experience in construction projects using photovoltaic energy.
The experts were selected from professionals who have been involved in the development, design, and construction of photovoltaic solar plants, with the aim of covering the greatest possible number of profiles involved in the development of such plants. The profiles of these experts are described in Table 1.

3.2. Collection of Survey Data and Aggregation of Expert Opinions

Once the group of experts had been established, surveys were designed to gather their opinions about the influence of the identified risks shows in Table 2.
Consequently, for the first phase, a list of economic items (Table 3) and execution periods was obtained (Figure 4), which defines the basic state of the project without the effects of any risk, as well as the rest of the parameters relating to depreciation, financial parameters, variable price updates, gross income, operating expenses, and reinvestment for repowering.
To determine the time taken to develop and execute the project, a schedule was drawn up, which considered the interrelationships between the various items listed in Figure 4. Using the above values, the NPV, PB, and IRR values of the project were calculated in the absence of risk effects, as shown in Table 4, which will serve to evaluate the overall effect of the risks on the project’s profitability.
As a result of the experts’ opinions on which items were affected by each of the identified risks in terms of cost, scope, and time, a triangular distribution was obtained for the variation of each item, by aggregation of the opinions, as displayed in Table 5.

4. Results

To study the influence of risks on the project parameters, we worked with the range of values with respect to the mode, the results of the sensitivity analysis with Monte Carlo simulations conducted with 10,000 iterations for each of the 100 simulations, the basic parameters of economic analysis (NPV, PB, and IRR), and the resulting influence of the identified risks on the investment items. These simulations made it possible to evaluate the combined impact of all risks on the project.
The results of the simulations provided different ranges of values for NPV, PB, and IRR in each simulation. To work with the results of the simulation, it was necessary to work with a single value. Thus, the geometric mean was calculated for each item of the 100 simulations. The geometric mean was chosen in preference to the arithmetic mean or average because it is less sensitive to outliers of the distribution of values. Using all of the above, the NPV, PB, and IRR values of the project were calculated considering the effect of the identified risks.
In the first analysis, as expected, the overall impact of the risks on the project was negative, since NPV was reduced by 54.87%, PB increased by 75.76%, and IRR was reduced by 25.95%, as can be observed in Table 6.
The effects of the risks appeared to be more pronounced for NPV and PB, since these variables have a stronger impact on the cash flow-related items of the project: In Year 1 there was a 34.10% reduction in annual performance. The most significant factor in the reduction in annual performance was total income, which accounted for 49.52% of this reduction. The lower variation in the IRR can be explained by the lower influence of risks on the initial investment in Year 0, which increased by 9.04%.
To plan an adequate risk response strategy, it is necessary to classify the influence of these risks. The sample of risks with the capacity to influence the general framework of the project is not equivalent to the total 55 risks identified, since the experts believed that 2.2.6 “Possibility of the existence of alternative energy generation systems” has no influence on the fundamental economic parameters of this project.
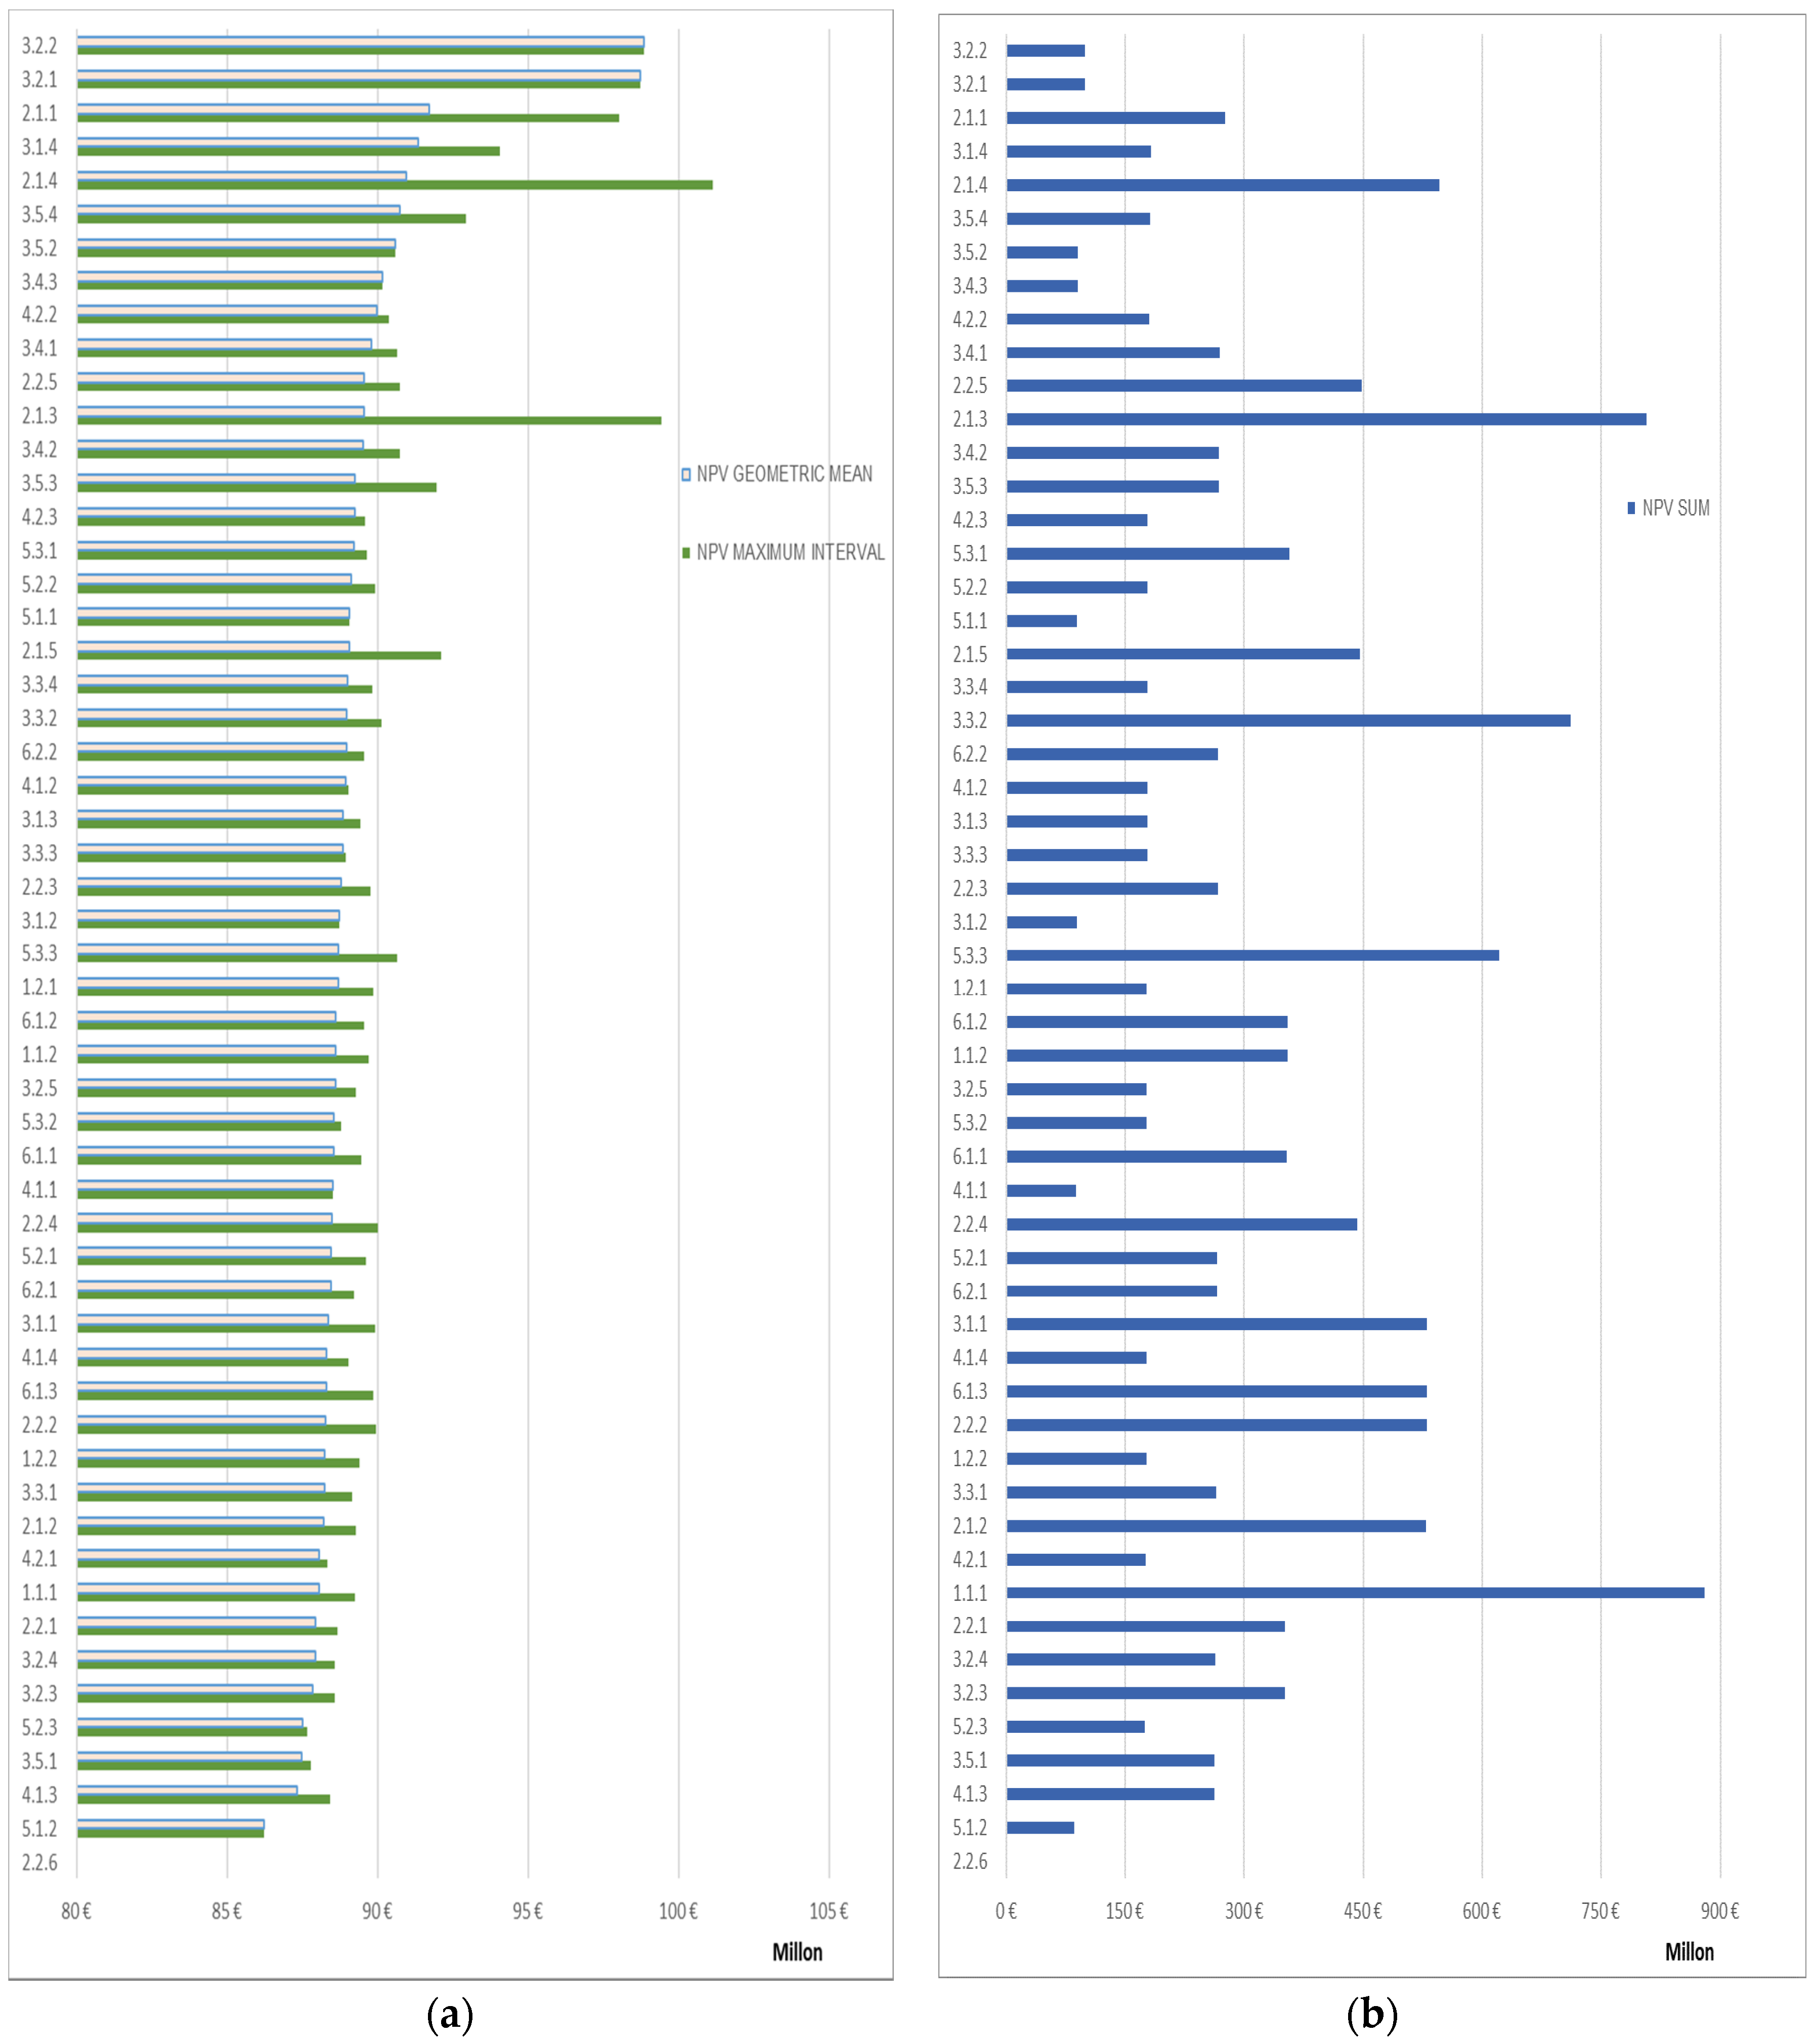
Comparing the value ranges of the NPV for each of the four criteria under study, and ranking these according to the SUM criterion, it appears that the SUM criterion is completely different from the remaining criteria. This is also the case for the value ranges of the PB and the IRR. The MAXIMUM INTERVAL and GEOMETRIC MEAN criteria produced similar rankings for the most influential risks, since, among the 12 most influential risks, 8 of these were shared, among which were the 5 most influential risks for each of the 3 criteria, as shown in Figure 5.
Another effect that should be highlighted is that the range of values obtained following the Monte Carlo simulation did not differ significantly, which explains the fact that with small differences in the value ranges, there were large changes in the position of the ranking with the MAXIMUM INTERVAL criterion and, to a greater extent, with the GEOMETRIC MEAN criterion, since the latter considers the extreme values of the sample. Taking into account the 12 most influential risks for each criterion, for the SUM criterion, ordered by the ranges of values of the NPV, no disparity was observed between the rankings for NPV, PB, or IRR; therefore, it can be concluded that, with the SUM criterion for maximum risk aversion, the risks shown in Table 7 are those for which a more exhaustive response strategy should be planned.
For the MAXIMUM INTERVAL criterion, no disparity was observed between the rankings of NPV, PB, or IRR among the first eight risks. It is thus concluded that, with the MAXIMUM INTERVAL criterion, a combined response strategy can only be planned for the first eight risks in the ranking regarding the three economic parameters.
For the GEOMETRIC MEAN criterion, no disparity was observed between the rankings of NPV, PB, or IRR among the first seven risks. Therefore, as in the case of the MAXIMUM INTERVAL criterion, a combined response strategy can only be planned for the first seven risks of the ranking with regard to the three economic parameters, and the response to the remaining identified risks should be planned independently for each parameter.
The above analysis was conducted for the cost, time, and scope of the project, considering the fact that the number of risks influencing each of these three aspects of the project was decreasing.
Thus, the sample of risks with an influence on the project cost was reduced to 42, ruling out the risks due to delays, certain legal risks, and the risk already mentioned in 2.2.6 “Possibility of the existence of alternative energy generation systems”.
When comparing the variation in ranges of the NPV for each of the three criteria under study, and sorting them according to the SUM criterion, it was established that, as in the assessment of the influence on the overall project framework, the SUM criterion differs considerably from the rest of the criteria. The MAXIMUM INTERVAL and GEOMETRIC MEAN criteria present similar rankings for the most influential risks, since, among the nine most influential risks, seven of these are shared and between the MAXIMUM INTERVAL criterion and the GEOMETRIC MEAN, the five most influential risks are shared.
For the GEOMETRIC MEAN criterion, when sorting according to the variation in ranges of the NPV, no disparity was observed between the ranking by NPV, PB, or IRR among the first three risks, as can be observed in Table 8. Therefore, only a joint response can be planned (with nuances) for the three economic assessment parameters for the first three risks of the ranking, in terms of its influence on the cost, and an independent plan will be required for each parameter in response to the other risks identified in the project.
In the case of project time, the sample of risks was reduced to 32, ruling out 5 technological risks, 12 of the economic risks, some legal risks, and the social risks related to plant operations. The MAXIMUM INTERVAL and GEOMETRIC MEAN criteria present identical rankings for the seven most influential risks and share three risks with the SUM criterion.
Table 9 shows, for the GEOMETRIC MEAN criterion, that there was no disparity between the ranking by NPV, PB, or IRR among the first four risks. Therefore, only a joint response can be planned for the three economic assessment parameters for the first four risks of the ranking.
Finally, the sample of risks with the capacity to influence project scope was reduced to 13, with five technological risks, four economic risks, three legal risks, and one political risk, thus ruling out social risks and risks due to delays.
When comparing the variation in ranges of the NPV, and sorting them according to the SUM criterion, it was found that risk 1.1.1 “Level of political stability” and risk 2.1.3 “Estimation of effective solar radiation” appear among the four most influential risks for the three evaluation criteria. The MAXIMUM INTERVAL and GEOMETRIC MEAN criteria presented similar rankings for the three most influential risks.
For the GEOMETRIC MEAN criterion, a certain disparity was observed between the ranking by NPV, PB, or IRR, primarily for positions 3 and 4 of the ranking. Therefore, only a joint response can be planned (with nuances) for the three economic assessment parameters and the first two risks of the ranking, as can be observed in Table 10.

5. Discussion

This paper presents a methodology that allows for analyzing the effect of risks on the profitability of photovoltaic solar plant construction projects based on probabilistic analyses using Monte Carlo simulation, risk identification, and expert judgment. Based on Monte Carlo simulation and the values of the variation in ranges obtained from the sensitivity analysis, three criteria are proposed for ranking the influence of risks on the general project framework and its cost, time, and scope. Regarding the three study criteria, the following general key points should be considered:
  • The SUM criterion considers the cumulative effect of all the ranges of values of all the items affected by each risk, which is appropriate for project management teams that are highly risk averse. However, it should be borne in mind that this criterion penalizes risks that influence one or two items, although, these are decisive risks, as opposed to those risks that affect multiple items.
  • The MAXIMUM INTERVAL and GEOMETRIC MEAN criteria, by their very definition, generate similar rankings in the various parameters studied.
Analyzing the influence of risks on project profitability assessment parameters on the overall project framework, the following key points should be noted:
  • The SUM criterion has a clear variation in ranges, which allows for defining the rankings. The MAXIMUM INTERVAL and GEOMETRIC MEAN criteria have less defined rankings due to the fact that these are more sensitive to the small variation in the absolute value of the variation ranges obtained from the Monte Carlo simulation.
  • If the intention is to plan a response to the risks that most specifically affect one of the economic assessment parameters, then it should be noted that the SUM criterion of maximum risk aversion is completely different from the other criteria, with the risk 2.1.4 “Earthworks” being the only one that is among the first 12 most influential risks for the three study criteria.
  • If a joint risk response is to be planned for the three economic assessment parameters, the SUM ranking allows for planning a joint response to the top 12 risks in the ranking. The MAXIMUM INTERVAL and GEOMETRIC MEAN criteria, being more sensitive to the small variation in the ranges obtained in the Monte Carlo simulation, present more heterogeneous rankings, implying that a joint response can only be planned for the first eight and seven risks of the ranking, respectively.
When analyzing the influence of risks on project cost profitability assessment parameters, the following points should be noted:
  • In the case of planning a risk response aimed at minimizing the impact of the risks on the project cost by considering the variation in ranges of the NPV, this response will be similar when considering the MAXIMUM INTERVAL and GEOMETRIC MEAN criteria, as was the case for assessment of the impact of risks on the overall project framework.
  • If the intention is to plan a response to the risks that most specifically affect one of the economic assessment parameters, it should be noted that the SUM criterion is completely different from the other criteria, with risk 2.1.3 “ Estimation of effective solar radiation” being the only one that is among the first nine most influential risks for the three study criteria.
  • When planning a joint risk response for the three economic assessment parameters, the SUM ranking allows for planning a joint response to the top nine risks of the ranking, but with nuances, since none of the nine most influential risks share a ranking position for all three parameters. The MAXIMUM INTERVAL criterion allows for the planning of a joint response to the first six risks with some slight nuances for the first three risks, while the GEOMETRIC MEAN criterion only allows for the planning of a joint nuanced response to the risks located in the top three positions of the ranking.
For the risk influence analysis in relation to the impact of profitability assessment parameters on project time, the following points should be noted:
  • Risks, from the point of view of project time, only affect investment items, increasing or decreasing the total investment and therefore investment in year 0, by increasing payment commitments directly related to operating costs. This could explain the low influence of these risks on the IRR. In turn, there is a delay in the start of revenues which directly affects cash flow. This could account for the seemingly greater effect of this risk on NPV and PB.
  • In the case of planning a risk response aimed at minimizing the impact of risks on the project time by considering the NPV variation, this response will be similar when considering the MAXIMUM INTERVAL and GEOMETRIC MEAN criteria.
  • When planning a joint risk response for the three economic assessment parameters, in this case, the SUM and GEOMETRIC MEAN criteria allow for planning a joint response to the first four risks of their respective rankings, while the MAXIMUM INTERVAL criterion allows for planning a joint response to the first five risks.
Finally, for the risk influence analysis regarding the impact of profitability assessment on project scope, the following key points should be considered:
  • Of the identified risks, 23.64 % affect project scope but these also have a considerable impact on economic assessment parameters, since they affect both total income and investment items, so their influence on such evaluation parameters is not negligible.
  • If the intention is to plan a response to risks that specifically affect one of the economic assessment parameters, then it should be noted that the risk list is reduced, and therefore the disparity between the rankings for the three criteria under study is also reduced, with the MAXIMUM INTERVAL and GEOMETRIC MEAN having practically the same rankings.
  • The SUM criterion allows for the planning of a joint response to the first four risks of the respective rankings.

6. Conclusions

The work described in this paper has led to the development of a new methodology for analyzing the effects of risks on the profitability of photovoltaic solar plant construction projects based on probabilistic analyses through Monte Carlo simulation, risk identification, and expert judgment. Three criteria are proposed that allow ranking the impact of various risks on the overall project framework and on the cost, time, and scope of the project.
To test the model, a case study was conducted on a construction project for a 250 MW photovoltaic plant located in Spain, which is currently in the economic/financial structuring phase. Application of the proposed methodology leads to the following conclusions:
  • The SUM, MAXIMUM INTERVAL, and GEOMETRIC MEAN criteria based on Monte Carlo simulation consider all the identified risks that are present in the project.
  • The SUM criterion considers the cumulative effect of the variation in ranges of all items affected by each risk and therefore variations in ranges resulting from Monte Carlo simulation lose their meaning. It should be considered that this criterion penalizes the risks that influence one or two items, even if these are determining risks, as opposed to those risks affecting multiple items.
  • The SUM criterion is the appropriate criterion for project management teams with a high aversion to risk. This is a semiquantitative analysis criterion, since the most influential risks are those that primarily affect the economic items of the project.
  • The MAXIMUM INTERVAL and GEOMETRIC MEAN criteria produce similar results.
  • The variation ranges obtained, when considering the maximum value or the GEOMETRIC MEAN, produce a variation in ranges of the NPV, PB, or IRR with certain values, which makes it possible to construct a ranking that allows for the future planning of a risk response strategy, whilst identifying the maximum and minimum expected values of these parameters for each risk.
  • The choice of criterion depends on the uniformity of the ranges of the obtained values. For items in which the ranges of values are highly dispersed, the GEOMETRIC MEAN criterion is recommended, since it offers a more generalized view by considering the whole sample, whereas for ranges of values that are homogeneous or with a low degree of dispersion, the MAXIMUM INTERVAL criterion is recommended.

Author Contributions

Conceptualization, L.S.-G., J.I.M.-H.; methodology, L.S.-G., J.I.M.-H.; software, L.S.-G.; validation, J.I.M.-H.; formal analysis, L.S.-G., J.I.M.-H.; investigation, L.S.-G.; resources, L.S.-G., J.I.M.-H.; data curation, L.S.-G.; writing—original draft preparation, L.S.-G.; writing—review and editing, J.I.M.-H.; visualization, L.S.-G.; supervision, J.I.M.-H.; project administration, J.I.M.-H.; funding acquisition, J.I.M.-H.; Both authors have read and agreed to the published version of the manuscript.

Funding

This work was partially supported by the Ministry of Science, Innovation and Universities of Spain, under Project RTI2018-096108-A-I00 (MCIU/AEI/FEDER, UE), and by the University of Castilla-La Mancha, under Grant 2020-GRIN-29009.

Conflicts of Interest

The authors declare no conflict of interest.

References

  1. Chang, C.Y. A critical analysis of recent advances in the techniques for the evaluation of renewable energy projects. Int. J. Proj. Manag. 2013, 31, 1057–1067. [Google Scholar] [CrossRef]
  2. Tummala, V.M.R.; Burchett, J.F. Applying a risk management process (RMP) to manage cost risk for an EHV transmission line project. Int. J. Proj. Manag. 1999, 17, 223–235. [Google Scholar] [CrossRef]
  3. Bhattacharya, A.; Kojima, S. Power sector investment risk and renewable energy: A Japanese case study using portfolio risk optimization method. Energy Policy 2012, 40, 69–80. [Google Scholar] [CrossRef]
  4. Fuchs, C.; Marquardt, K.; Kasten, J.; Skau, K. Wind turbines on German farms—An economic analysis. Energies 2019, 12, 1587. [Google Scholar] [CrossRef] [Green Version]
  5. Cheng, M.-Y.; Roy, A.F. Evolutionary fuzzy decision model for cash flow prediction using time-dependent support vector machines. Int. J. Proj. Manag. 2011, 29, 56–65. [Google Scholar] [CrossRef]
  6. Konior, J. Significance risks evaluation of commercial construction projects. Arch. Civ. Eng. 2019, 65, 19–33. [Google Scholar] [CrossRef]
  7. Kumar, V.S.S.; Hanna, A.S.; Adams, T. Assessment of working capital requirements by fuzzy set theory. Eng. Constr. Arch. Manag. 2000, 7, 93–103. [Google Scholar] [CrossRef]
  8. Konior, J. Enterprise’s risk assessment of complex construction projects. Arch. Civ. Eng. 2015, 61, 63–74. [Google Scholar] [CrossRef] [Green Version]
  9. Nieto-Morote, A.; Ruz-Vila, F. A fuzzy approach to construction project risk assessment. Int. J. Proj. Manag. 2011, 29, 220–231. [Google Scholar] [CrossRef] [Green Version]
  10. Li, Y.; Wang, X. Risk assessment for public–private partnership projects: Using a fuzzy analytic hierarchical process method and expert opinion in China. J. Risk Res. 2016, 952–973. [Google Scholar] [CrossRef]
  11. Leśniak, A.; Kubek, D.; Plebankiewicz, E.; Zima, K.; Belniak, S. Fuzzy AHP application for supporting contractors’ bidding decision. Symmetry 2018, 10, 642. [Google Scholar] [CrossRef] [Green Version]
  12. Valipour, A.; Yahaya, N.; Noor, N.; Kildienė, S.; Sarvari, H.; Mardani, A. A fuzzy analytic network process method for risk prioritization in freeway PPP projects: An Iranian case study. J. Civ. Eng. Manag. 2015, 21, 933–947. [Google Scholar] [CrossRef] [Green Version]
  13. Ferreira, A.C.; Franklin, C.-M. Fuzzy inference to risk assessment on nuclear engineering systems. Appl. Soft Comput. 2007, 7, 17–28. [Google Scholar] [CrossRef]
  14. Zavadskas, E.K.; Turskis, Z.; Tamošaitien, J. Risk Assessment of construction projects. J. Civ. Eng. Manag. 2010, 16, 33–46. [Google Scholar] [CrossRef] [Green Version]
  15. Kuo, Y.-C.; Lu, S.-T. Using fuzzy multiple criteria decision making approach to enhance risk assessment for metropolitan construction projects. Int. J. Proj. Manag. 2013, 31, 602–614. [Google Scholar] [CrossRef]
  16. Gatzert, N.; Vogl, N. Evaluating investments in renewable energy under policy risks. Energy Policy 2016, 95, 238–252. [Google Scholar] [CrossRef]
  17. Shafiee, M. A fuzzy analytic network process model to mitigate the risks associated with offshore wind farms. Expert Syst. Appl. 2015, 42, 2143–2152. [Google Scholar] [CrossRef]
  18. Chen, G. Risk Analysis and Evaluation of Wind Electric Farm Construction. In Proceedings of the AASRI International Conference on Industrial Electronics and Applications, London, UK, 27–28 June 2015; pp. 539–543. [Google Scholar]
  19. Liu, Y.; Dai, X.T.; Meng, Q.Z. Research on Risk Assessment of Photovoltaic Building Project by Triangular Fuzzy Number Method. In Proceedings of the International Conference on Education Reform and Modern Management, Hong Kong, China, 19–20 April 2015; pp. 354–358. [Google Scholar]
  20. Jiuping, X.; Huan, Z.; Ziqiang, Z.; Shiyong, W.; Manbin, S. Discrete time–cost–environment trade-off problem for large-scale construction systems with multiple modes under fuzzy uncertainty and its application to Jinping-II Hydroelectric Project. Int. J. Proj. Manag. 2012, 30, 950–966. [Google Scholar] [CrossRef]
  21. Yan, F.; Xu, K.L.; Yao, X.W.; Li, Y. Fuzzy Bayesian network-bow-tie analysis of gas leakage during biomass gasification. PLoS ONE 2016, 11. [Google Scholar] [CrossRef]
  22. Yu, L.; Li, Y.P.; Huang, G.H. A fuzzy-stochastic simulation-optimization model for planning electric power systems with considering peak-electricity demand: A case study of Qingdao, China. Energy 2016, 98, 190–203. [Google Scholar] [CrossRef]
  23. Içen, D.; Demirhan, H. Error measures for fuzzy linear regression: Monte Carlo simulation approach. Appl. Soft Comput. 2016, 46, 104–114. [Google Scholar] [CrossRef]
  24. Aven, T. Risk assessment and risk management: Review of recent advances on their foundation. Eur. J. Oper. Res. 2016, 116, 235–248. [Google Scholar] [CrossRef] [Green Version]
  25. Jinrong, H.; Enyi, Z. Engineering risk management planning in energy performance contracting in China. Syst. Eng. Procedia 2011, 1, 195–205. [Google Scholar] [CrossRef] [Green Version]
  26. Serrano, L.; Muñoz, J.I. Risk Identification in Large Photovoltaic Plants’ Construction Projects. In Proceedings of the 20th International Congress on Project Management and Engineering, Cartagena, Spain, 13–15 July 2016; pp. 1786–1798. [Google Scholar]
  27. Zeng, J.; An, M.; Smith, N.J. Application of a fuzzy based decision making methodology to construction project risk assessment. Int. J. Proj. Manag. 2007, 25, 589–600. [Google Scholar] [CrossRef]
  28. Dubois, D.; Prade, H. Operations on fuzzy numbers. Int. J. Syst. Sci. 1978, 9, 613–626. [Google Scholar] [CrossRef]
  29. Bohlender, G.; Kaufmann, A.; Gupta, M.M. Introduction to Fuzzy Arithmetic: Theory and Application; Van Nostrand Reinhold: New York, NY, USA, 1991. [Google Scholar]
  30. Cucurachi, S.; Borgonovo, E.; Heijungs, R. A Protocol for the global sensitivity analysis of impact assessment models in life cycle assessment. Risk Anal. 2016, 36, 357–377. [Google Scholar] [CrossRef]
Figure 1. Triangular fuzzy number.
Sustainability 12 09127 g001
Figure 2. NPV variation distribution function for low-influence risk.
Sustainability 12 09127 g002
Figure 3. NPV variation distribution function for high-influence risk.
Sustainability 12 09127 g003
Figure 4. Planning of the project tasks.
Sustainability 12 09127 g004
Figure 5. Ranking of risks according to their influence on the NPV in terms of the general project framework. (a) Geometric Mean criterion and Maximum Interval criterion; (b) Sum criterion.
Sustainability 12 09127 g005
Table 1. Profiles of the experts.
ExpertPositionExperience
E1Project ManagerA portfolio of designed and developed worldwide projects exceeding 500 MW
E2O&M DirectorAn international portfolio of more than 2 GW
E3CEOCEO of a multinational company with more than 2 GW of developed projects
E4Public Administration TechnicianForestry Engineer, responsible for the environmental assessment of projects
E5Financial DirectorMore than 14 years’ experience in the promotion and development of photovoltaic solar plants
E6SupervisorSupervisor in the construction of renewable energy projects with 12 years’ experience
E7Industrial EngineerIndustrial Engineer and expert with more than 30 years’ experience in the design and construction of energy evacuation infrastructures in photovoltaic solar plants
E8Inspector–VerifierInspector–Verifier of electrical installations, with 4 years’ experience
E9PMP®Project Manager Professional and expert in the construction of large generation infrastructures
E10Project ManagerProject Manager with more than 12 years’ experience in the construction of photovoltaic and solar thermal plants
All the experts confirmed their participation and gave their written consent to complete the questionnaire.
Table 2. Identified Risk [26].
Risk List
1.1.1.—Level of political stability3.4.1.—Costs due to inadequate PV cell selection
1.1.2.—The change in energy policy3.4.2.—Costs due to inadequate inverter selection
1.2.1.—Approval by the local body3.4.3.—Costs due to lack of consistency in the selection of support panels
1.2.2.—Obtaining the construction license3.5.1.—Bank financing
2.1.1.—Technological climate change adequacy3.5.2.—Changes in power demand
2.1.2.—Flood and storm risks3.5.3.—Inflation
2.1.3.—Estimation of effective solar radiation3.5.4.—Changes in energy prices
2.1.4.—Earthworks4.1.1.—Delays in obtaining administrative approval for the connection infrastructure
2.1.5.—Geotechnical study4.1.2.—Construction delays of the power connection infrastructure
2.2.1.—New PV solar power systems4.1.3.—Delays in obtaining PV plant Start-Up Act
2.2.2.—PV cell selection4.1.4.—Delays in the agreement signature with REE and Comisión Nacional de los Mercados y la Competencia (CNMC)
2.2.3.—Inverters selection4.2.1.—Delays in obtaining the local body approval
2.2.4.—Selection of support panel structure4.2.2.—Delays in obtaining approval of the environmental impact
2.2.5.—Connection to the electric grid4.2.3.—Delays in obtaining the construction license
2.2.6.—Alternative power generation systems5.1.1.—Specific legislation changes
3.1.1.—Plant operation cost5.1.2.—General legislation changes
3.1.2.—Corrective maintenance costs5.2.1.—Legislative changes in the administrative authorization of the power connection infrastructure
3.1.3.—Prevention of maintenance costs5.2.2.—Legislative changes in the Start-Up Act permits
3.1.4.—Performance losses5.2.3.—Obtaining the electrical registration for production facilities
3.2.1.—Errors in estimating the effective solar radiation energy5.3.1.—Legislative changes in the local body approval
3.2.2.—Revenue estimation due to the climate change5.3.2.—Legislative changes in the environmental impact approval
3.2.3.—Earthworks resources5.3.3.—Legislative changes in the construction license
3.2.4.—Flood prevention works6.1.1.—Theft
3.2.5.—Solution of geotechnical problems6.1.2.—Vandalism
3.3.1.—Connection to electric grid costs6.1.3.—Terrorism
3.3.2.—Agreement costs with landowners6.2.1.—Social consequences resulting from land acquisition
3.3.3.—Possibility of constructing the power connection infrastructure6.2.2.—Social acceptance
3.3.4.—Construction license
Table 3. Project investment items.
ConceptCost
Set-up costs3000 €
Purchase of land6,499,900 €
Engineering20,000,000 €
Administrative processing10,582,980 €
Manufacturing costs1,500,000 €
Licenses9,082,980 €
Photovoltaic plant145,983,005 €
Construction works4,586,140 €
Framework30,695,445 €
Photovoltaic panels54,830,160 €
Investors25,000,000 €
Electrical works22,187,710 €
Environmental clearance8,508,550 €
Surveillance/security175,000 €
Electrical substation3,200,000 €
Evacuation line1,400,000 €
Network connection800,000 €
Payment commitments3,777,920 €
Total investment192,246,805 €
Table 4. Profitability parameters of a risk-free project.
Project VariablesValue
NPV86,762,513 €
Payback Period8.13
IRR20.65%
Table 5. Aggregation of opinions and triangular function of items affected by risk 1.1.1 in terms of cost impact.
RiskDescriptionItemsTriangularMinimumProbableMaximum
1.1.1.Level of political stabilityFunding(−0.050; 0; 0.050)−5%0%5%
interest rate(−0.038; 0; 0.088)−3.8%0%8.8%
Table 6. Profitability parameters of a risk-affected project.
Project VariablesValue
NPV39,159,555 €
Payback Period14.29
IRR15.29%
Table 7. Risk ranking for the general project framework using the GEOMETRIC MEAN criterion.
RiskNPVPBIRR
3.2.2121
3.2.1212
2.1.1386
3.1.4453
2.1.4565
3.5.4647
3.5.2734
3.4.383922
4.2.293449
3.4.1102212
2.2.5114727
2.1.312179
Table 8. Risk ranking for project cost using the GEOMETRIC MEAN criterion.
RiskNPVPBIRR
3.2.2121
3.2.1212
3.1.4333
2.1.3464
2.1.15106
3.5.46510
3.5.2745
3.4.383119
3.4.192412
Table 9. Risk ranking for project time using the GEOMETRIC MEAN criterion.
RiskNPVPBIRR
3.2.2121
3.2.1212
3.1.4333
2.1.3464
2.1.15106
3.5.46510
3.5.2745
Table 10. Risk ranking for project scope using the GEOMETRIC MEAN criterion.
RiskNPVPBIRR
2.2.2112
3.3.2221
1.1.1344
2.1.3486
Publisher’s Note: MDPI stays neutral with regard to jurisdictional claims in published maps and institutional affiliations.

