Abstract
Landscape connectivity can largely affect the level of biodiversity and it is a key concern in conservation planning. Considering that protected areas (PAs) may become functionally isolated “islands” under rapid land-use change, there is an urgent need to expand and connect protected areas to prevent further biodiversity loss and improve PAs effectiveness. The Grain-to-Green Project (GTGP) is the largest reforestation program worldwide with the aim of controlling water and soil loss; however, the opportunities for connectivity gains through GTGP have been widely ignored. Here we provided a three-stage hierarchical framework incorporating soil erosion analysis, cropland suitability analysis and network analysis to prioritize agricultural patches for reforestation under the scheme of GTGP. The potential reforestation patches were identified in the first two stages. Then, four different GTGP strategies were designed, and a set of network metrics were used to determine the best strategy and prioritize patches that significantly enhance PAs connectivity. A typical GTGP region, Wanzhou district (Southwest China), was taken as the study area. We found that: (1) the agricultural patches with high reforestation suitability cover an area of c. 40 km2 (1% of the study area); and (2) the efficiency of GTGP strategies varies by species, species with intermediate and high mobility benefit more from a strategy that continuously adds reforestation patches close to PAs, while for species with low dispersal ability, the amount of patches added should also be taken into account to decide the appropriate strategy. We conclude that our framework can provide guidance to restore PAs connectivity with limited land resources in the context of GTGP.
1. Introduction
Worldwide, biodiversity hotspots with rare, threatened or endangered species inhabit have been delimited as protected areas (PAs), aiming to maintain (and/or improve) the biodiversity level and habitat quality against rapid land-use changes [1,2]. However, the effectiveness of PAs in practical biodiversity conservation remains doubtful, due to the excess of conventional “conservation islands” [3,4,5,6]. PAs themselves are likely to suffer from functional isolation and species extinction when the surrounding unprotected areas are disturbed or converted to inhospitable landscape matrix [7,8]. Meanwhile, scholars have also acknowledged the negative effects of landscape fragmentation on biodiversity [9,10,11]. Against this background, PAs should not be viewed as a static and finished product [12]; instead, they require expanding, connecting, and enhancing their relationship with other elements in the landscape [13,14].
On the other hand, the Chinese government has been prompted to take an important ecosystem restoration program, called the Grain-to-Green Program (GTGP), after the serious strike by the massive floods in 1998 [15]. GTGP is the biggest forest ecological construction program worldwide due to its large scale, huge investments and enormous effects [16,17]. Stopping soil and water loss and minimizing the negative impacts of farmland on ecosystems are the ultimate goals of GTGP. Under the scheme of GTGP, farmland on steep slopes are reforested [16].
Recently, most previous research related to GTGP have focused on the relationships between GTGP and farmer subsidies, income, agricultural products as well as food security from the perspective of the social economy. An increasing number of scholars have also discussed the impacts of GTGP on ecosystem health and habitat restoration from the ecological perspective. Notwithstanding that GTGP poses an opportunity for land-use managers intending to enhance PAs connectivity, such an opportunity has been widely ignored in previous studies [18,19].Land-use managers need effective and practical methods to identify agricultural patches where connectivity should be treated as a particularly crucial conservation concern [20]. Setting appropriate priorities for the reforestation to improve PAs connectivity is, therefore, of great importance. There are only a few similar studies that prioritize agricultural patches for reforestation to improve landscape connectivity [20,21]; however, their research goal is to improve the degree of connectivity at the landscape scale instead of enhancing connections among PAs, and they do not specifically propose a prioritization approach under the scheme of GTGP. Considering that GTGP is a multi-facet task, the integration of connectivity analysis with those that inform social and biophysical constraints is essential for achieving an ecologically beneficial and economically feasible selection. To our knowledge, such integration is uncommon; and more importantly, the study designing different GTGP strategies and investigating their performance in enhancing PAs connectivity is even rarer.
Here we proposed a three-stage hierarchical framework, which identifies potential reforestation regions through soil-erosion sensitivity analysis and cropland suitability analysis, and then prioritizes agricultural lands with a high potential of improving PAs connectivity by network analysis. Additionally, we designed four distinct GTGP strategies and investigated which strategy is more efficient. Our attempt was to inform decision makers about the right choice for the GTGP strategy and the right priority sites for updating PAs. To demonstrate the performance of our framework, Wanzhou District (Chongqing, SW China) was chosen as the study area, because it is an excellent representative of GTGP and it is also located in the center of the Three Gorges Reservoir Area (TGRA), water and soil conservation therein has profound implications to the ecological security of the whole Yangtze River Catchment. Besides, the TGRA is one of the richest areas in biodiversity in China [22]. Therefore, studying the ecological benefits of GTGP and improving local PAs connectivity can significantly contribute to local land degradation control, and biodiversity maintenance and improvement.
2. Study Area and Data Preparation
2.1. Study Area
We selected Wanzhou District as a case study area. Wanzhou District (Chongqing city, Southwest China) is located (Figure 1) between 107°55′22″–108°53′25″E and 30°23′23″–31°0′20″N, covering an area of 3456 km2. The predominant local terrain is hilly landform. At present, the proportion of cropland accounts for nearly 35.4%. Affected by regional geological structure and hydrologic feature, Wanzhou’s ecological environment is fragile, suffering frequent landslides, debris flow and other geological disasters. The widespread distribution of steep farmland in this district has caused serious soil erosion. Regional ecosystem restoration confronts many cumbering factors. Multiple national rare species inhabit Wanzhou, for instance, the Reeves’s Pheasant (Syrmaticus reevesii). In addition, natural reserves, national forest parks and scenic resorts are widely distributed in Wanzhou. Considering the increasingly serious situation of the regional environment and the great significance of biodiversity conservation, ecological restoration measures should be enhanced to protect Wanzhou’s ecological safety.
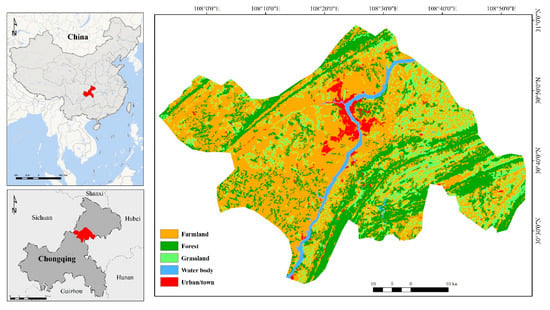
Figure 1.
Location of the study area.
2.2. Data Preparation
Multi-sourced datasets were collected through various methods and then processed (Table 1). Land use, topographic, meteorological and soil datasets were processed by ArcGIS 10.2 (ESRI). Besides, the ENVI platform was utilized to process remote sensing images. The illustration of EN structure and connectivity measurement was performed by Gephi (v0.9.1). MATLAB R2014a was used for EN connectivity analysis as well as strategy designing. All the basic data was unified into the same spatial resolution of 30 m × 30 m in preparation for the subsequent calculation.

Table 1.
Data sources and descriptions.
3. Methods
3.1. Research Framework
An overview of the research framework is displayed in Figure 2. Firstly, soil erosion sensitivity and cropland suitability are evaluated to identify the potential habitat areas (PHAs). Secondly, we designed four different GTGP strategies in which potential habitat patches were added to the core habitat network in different ways to reasonably measure the impacts of newly added patches on the connectivity of the entire network. Thirdly, we evaluated the effects of various GTGP strategies on habitat connectivity, the species’ response with different dispersal ability, and then identified important PHAs that significantly improve habitat connectivity.
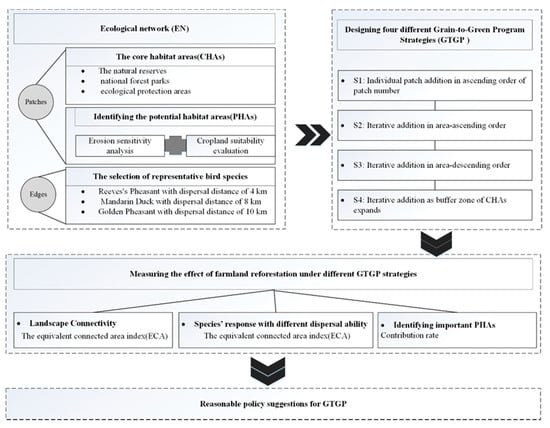
Figure 2.
Illustration of the research framework.
3.2. Erosion Sensitivity Analysis
According to the Revised Universal Soil Loss Equation (RUSLE) proposed by Renard [23], we selected the precipitation factor, soil factor, topographic factor, vegetation coverage factor and soil and water conservation measures factor to assess soil erosion sensitivity:
where is the annual soil loss; is the rainfall erosivity calculated by the annual and monthly rainfall; is the soil erodibility based on the contents of sand, silt, clay and organic carbon; and are the slope length and the slope gradient derived from the topologic data, respectively; is the vegetation coverage based on NDVI (Normalized Difference Vegetation Index); and is the soil and water conservation measures. Given that is closely related to human activities while our study only concentrates on the physical factors that influence the soil erosion degree, was assigned as 1 [24,25]. Please see Supplementary Materials SM1 for the detailed calculation methods of these 5 factors. Here, R, K and C factors were classified to five sensitive grades according to “The Guidelines on the Delineation of Ecological Red Line” published by Ministry of Environmental Protection in P.R.C, while the thresholds of L and S factor were determined by the principle of natural break (Table 2).

Table 2.
The classification of 5 soil erosion evaluation factors.
Next, we calculated the composite soil erosion sensitivity index by integrating the evaluation results of these 5 factors:
where j is the soil erosion sensitivity index on the grid cell , and is the product of 5 factors. Additionally, to unify the classification numbers of soil erosion sensitivity and cropland suitability (introduced later), the composite soil erosion sensitivity was adjusted to four classes (“insensitive”, “mildly sensitive”, “highly sensitive” and “extremely sensitive”) by the natural break method.
3.3. Cropland Suitability Evaluation
Here we took a multi-factor assessment method to constitute a cropland suitability evaluation system. Considering the regional characteristics of Wanzhou district, we chose 12 indices from the perspective of topography, soil, climate, hydrology and proximity conditions. To present the influence of topographic conditions, the elevation, slope gradient and aspect were selected to compose the topographic factors (Table 3). In the aspect of climate conditions, we selected accumulative temperature and rainfall that closely relate to grain yield to reflect their effect on crop growth. In addition, considering that soil properties and nutrition level could play important roles in influencing cropland quality, topsoil texture, organic carbon content, and PH value were incorporated into the analysis. The level of drainage and accessibility to water were taken into account to reveal irrigation condition. The proximity conditions include distance to cities and distance to road, in order to display effects from both social and human factors. All these 12 indices were classified into 10 grades and allotted scores (from 1 to 10, please see the Supplementary Materials SM2) referring to “The Procedures of Farmland Quality Classification” (GBT28407-2012) [26] and “The Soil Nutrition Classification Standard of Second Soil Survey” [27]. Next, by applying the AHP (Analytic Hierarchy Process) and WSM (Weighted Sum Method), each index’s was calculated and the composite cropland suitability was estimated:
where is the composite score on the grid cell ; is the suitability class value of index i; is the weight of index i; and n is the number of indexes. The composite cropland suitability was divided into 4 classes (“highly suitable”, “moderately suitable”, “marginally suitable”, and “unsuitable”, [28]) based on the principle of natural break.

Table 3.
Weights of the cropland suitability evaluation indexes.
3.4. Landscape Graph Approach
A landscape graph (also known as “ecological network”, EN) is constituted of patches and edges. There are two types of patches in this study: (1) the core habitat areas (CHAs), and (2) the potential habitat areas (PHAs) surrounding CHAs to be colonized in case CHAs are disturbed or destroyed by anthropogenic activities. The natural reserves, national forest parks and ecological protection areas were considered as CHAs because they are protected permanently by legally binding regulations and forbidden to be exploited in urban development. Hence, these areas can provide stable and excellent habitats for species. Based on the cropland suitability and soil erosion sensitivity analysis, we selected the cropland which is: (1) not in protected primary farmland zone, (2) of high/extreme soil erosion sensitivity, and (3) of unsuitable/marginal cropland suitability, as the reforestation region. To ensure that habitat patches remain continuous, the parcels of reforestation regions were aggregated within a distance of 100 m. The next step was to identify PHAs. Considering that there is an area requirement for species relatively long-term persistence [29,30], the reforestation cropland patches larger than 0.2 km2 [6] were defined as PHAs.
We chose three local representative bird species listed in the China’s second-grade protected animals, to represent a wide range of species migration distances. They are Reeves’s Pheasant (Syrmaticus reevesii), Mandarin Duck (Aix galericulata) and Golden Pheasant (Chrysolophus pictus). We measured connectivity by using the equivalent connected area index [31] at the landscape scale, rather than the other popular habitat availability index “the Probability of Connectivity (PC)” [32], which has been proven robust to measure connectivity in either landscape scale or local scale [33,34]. One of the biggest advantages of this metric is that it not only measures the connectivity between different patches, but also accounts for the connected area existing within the habitat patches (intra-patch connectivity) and habitat characteristics therein [20,35]. Additionally, it can take account of the stepping-stone effect [36], which is crucial for species long-distance migration and range expansion through habitat networks still widely ignored in many direct dispersal models, by incorporating the maximum probability product between patches. The definition of ECA is the size of single patch which would function the same in enhancing the probability of connectivity as actual habitat pattern in the landscape. ECA can capture and quantify connectivity changes and reflect the ongoing availability in a continuously changing landscape. The ECA index is given by Equation (4):
where is the number of all habitat patches; and represent the area of patch and , respectively; denotes the maximum product probability () of all possible paths between and . The dispersal kernel is an exponential distribution as , in which is the edge-to-edge Euclidean distance between patch and ; (0 << 1) is a species-specific coefficient describing distance-decay effect, so that a of 0.5 corresponds to the median dispersal distance of a given species [32]. The median dispersal distances were estimated by the Sutherland’s model [37] based on species’ body mass and diet types: 4 km for the Reeves’s Pheasant, 8 km for the Mandarin Duck, and 10 km for the Golden Pheasant.
We also calculated the contribution rate (CR) based on the relative variation of ECA and patch area, to detect the connectivity improvement caused by every unit of newly added patch area. CR can capture the position importance of each PHAs in different reforestation strategies. The equation of CR index is as following:
where is the relative variation in ECA, denoting the difference between the former ECA value and that of an updated network after new patches added. is the variation of patch area, calculated by the same algorithms as . To capture the PHAs that cause abrupt jumps in connectivity, we also calculated the standard deviation (SD) of ECA in the consecutive adding process. To ensure the accuracy and the stability of computation result, based on a large number of tests, the SD of ECA was proven to perform best when calculated by every five consecutive added patches. For example, the SD value of patch 56 was calculated from the ECA value of patches 54, 55, 56, 57, and 58.
3.5. Designing Reforestation Strategies
We designed four different GTGP strategies. In strategy 1 (S1), the PHA was individually added (then removed before adding the next) to the PA network in ascending order of patch number. In strategy 2 (S2), we continuously added each patch in ascending order of patch size into the PA network, where all the previous added PHAs still remained. Each newly added patch established certain relations with the already existing PHAs. In strategy 3 (S3), the adding mode was similar to S2 but reversing the additional sequence (i.e., it starts from adding the largest patch in the remaining PHAs). In strategy 4 (S4), we set up a series of buffer zones surrounding CHAs whose width expanded at every 100 m distance. With the buffer zones circles expanding, the PHAs were added into the EN gradually. Comparing S1 with S2, S3, S4, we can identify the crucial patches that contribute to PA connectivity most significantly. The comparison between S2 and S3 can show the difference in connectivity gains between large-area patches and small-area patches when the total added area was equivalent. Meanwhile, the comparison between S4 and S2 (or S3) could measure the differences of connectivity profits between spatial position and patch size. Namely, we could explore which characteristic (spatial position or patch size) is more powerful in improving connectivity. We calculated the SD in S1-S4 to capture the abrupt rises caused by critical PHAs [6].
4. Results
4.1. Identification of the Reforestation Regions
The spatial distribution of soil erosion sensitivity is shown in Figure 3a. Regions of “insensitive”, “mildly sensitive”, “highly sensitive”, and “extremely sensitive” occupy 28.81%, 38.15%, 22.85%, and 10.19% of the study area, respectively. High soil erosion sensitivity regions are mainly situated around the northwestern and southeastern ridgelines area as high mountains and hills are dense here, which caused complex topography and special geological structure. Besides, some urban and rural residential regions exert high vulnerability to serious erosion resulting from poor vegetation coverage. The less sensitive regions distribute mostly in flat terrain around the central-eastern area (Figure 3a).
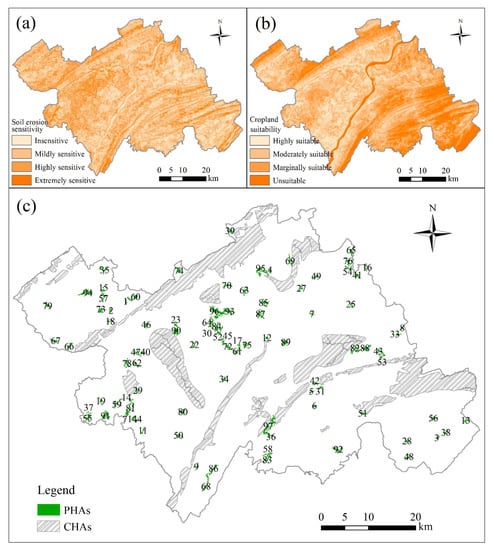
Figure 3.
The spatial distribution of soil erosion sensitivity, cropland suitability and CHAs and PHAs. (a): spatial distribution of soil erosion sensitivity in Wanzhou; (b): spatial distribution of cropland suitability in Wanzhou; (c): spatial distribution of CHAs and PHAs in Wanzhou. 1–97 are serial numbers of PHAs in area ascending order.
The spatial distribution of cropland suitability of Wanzhou is shown in Figure 3b. Regions of “unsuitable”, “marginally suitable”, “moderately suitable”, and “highly suitable” occupy 15.05%, 32.59%, 31.69%, and 20.67% of the study area, respectively. Similar to the characteristics of soil erosion sensitivity, the unsuitable and marginal suitable cropland distribute in the northwestern and southeastern ridgelines area caused by poor cultivation condition. Highly suitable croplands distribute widely near Yangtze River and branching streams with wonderful geographic location or water availability (Figure 3b). Based on the above evaluation results, the PHAs were obtained (Figure 3c).
4.2. Connectivity Variations and Species’ Response in Different Reforestation Strategies
When PHAs were added, in S1, the ECA values increased significantly when Nos. 7, 42, 78, and 95 entered into PAs (Figure 4a). In S2, the gradient of “ECA lines” became steeper with larger-sized PHAs orderly added (Figure 4c). Rapid enhancements and remarkable jumps of ECA and SD values occurred at PHA Nos. 7, 42, 57, 62, 78, 87, and 97 (Figure 4d). In S3, the upward trend was obvious at the beginning, followed by less steep gradient when smaller-sized PHAs were added into PAs consecutively. The unexpected noticeable enhancements of ECA appeared when PHAs Nos. 7, 18, 41, 42, 45, 52, 62, 73, and 78 joined (Figure 4e). The SD value fluctuated, and reached regional peaks at PHA Nos. 42 and 95 as in S2 (Figure 4f). S4 was similar to S3 in terms of the trend characteristics. PHAs Nos. 42, 45, 47, 83, and 88 resulted in the significant enhancement of connectivity (Figure 4g). By contrast, patches Nos. 7, 40, 42, 45, 46, 47, 52, 78, and 95 triggered abrupt jumps of SD values (Figure 4h). Patches near to the CHAs contributed remarkably to the connectivity (Figure 4).
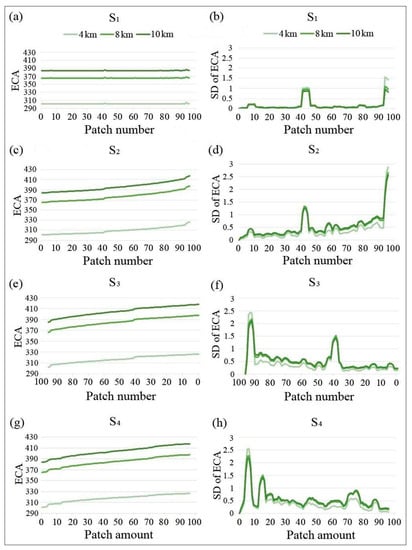
Figure 4.
The variation of ECA (a,c,e,g) and SD (b,d,f,h) with Nos. 1–97 PHAs added into the CHA network in four deforestation strategies. S1, S2, S3 and S4 are individual patch addition, iterative addition in area-ascending order, iterative addition in area-descending order and iterative addition as buffer zone expands, respectively. The horizontal coordinates represent the Nos. 1-97 of PHA in a-f, while it is the amount of added PHAs as buffer zone expands in g and h. The vertical coordinates represent the ECA and SD of ECA value. These four green trend lines with different shades (from light to dark) represent bird species with 4, 8 and 10 km median migration distance, respectively.
Under 4 and 8 km dispersal conditions, the SD values of some key PHAs (e.g., Nos. 42, 78, and 95 in S1 and Nos. 42, 45 and 95 in S2 and Nos.40, 41, 42 and 95 in S3) were higher than that of other migration abilities. This proves that species with 4 and 8 km migration distance were more sensitive to PHAs that could fundamentally increase the connections between patches, and gain more connectivity profits from them. Uniformly, the SD value of S2–S4 reached regional maximum at PHA No. 42 under 8 km dispersal condition and it was the same at PHAs Nos. 92–95 for 4 km migration distance species. This phenomenon suggested that species with short or intermediate migration ability (4 and 8 km) could gain more benefit from those large-sized patches.
For species with dispersal distances of 4, 8 and 10 km, S3 and S4 exerted an almost similar greatest influence on the connectivity improvement, followed by S2. With the total area of added patches increasing, S2 underwent a turning point when the total area of added patches reached approximately 16 km2. Before the turning point, the differences between S2 and S3/S4 changed from slight to great, and then from great to small after that. The connectivity profits of S3 were greater than S4 before 30 km2 under the dispersal condition of 8 and 10 km, while the threshold is 22 km2 under 4 km. All these trend lines attained coincidence until the total area of added PHAs exceeded approximately 38 km2.
4.3. Important PHAs Analysis in Alternative GTGP Strategies
To explore the spatial importance of PHAs, we calculated CR to capture key patches with high CR value. In S1, patches Nos. 7, 42, and 95 caused CR value to reach regional highest (Figure 5a and Figure 6a), while in S2, they are patches Nos. 7, 31, 42, 46, 57, 62, 78, 95, and 97 (Figure 5b and Figure 6b). In S3, PHAs with high CR values were 7, 12, 18, 40, 42, 45, 46, 52, 78, and 95 (Figure 5c and Figure 6c). In S4, the CR value exhibited unobvious variations initially, while it was still capable to identify key patches in the following stage. High CR appeared when patches Nos. 7, 40, 42, 45, 46, 47, 52, 78, and 95 were added into the PAs (Figure 5d and Figure 6d). Interestingly, the “CR lines” in four strategies reached peak at patch No. 42 and jumped significantly at patches Nos. 7 and 95 uniformly.
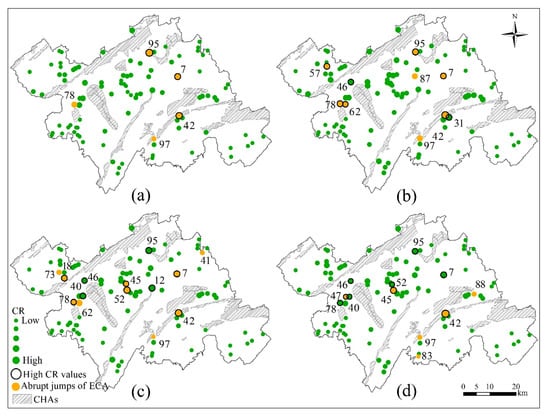
Figure 5.
The spatial distribution of important PHAs that resulted EC value increasing abruptly and dramatically and exhibited high CR values in S1-S4 (a–d). The solid green circles represent PHAs and their sizes were determined in the same proportion with their CR values. The orange solid circles represent prominent PHAs that caused abrupt and significant rise in ECA. The hollow black circles symbolize PHAs with high values.
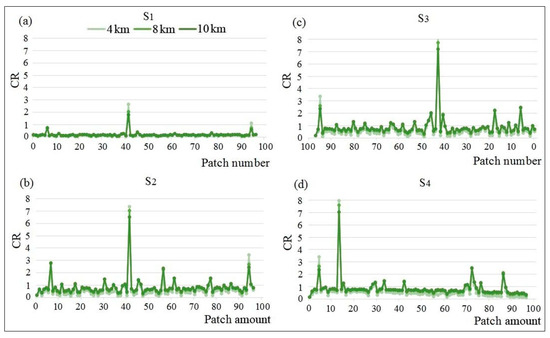
Figure 6.
The variations of CR with Nos. 1-97 PHAs added into the CHA network in four deforestation strategies (a–d corresponding to S1–S4). The horizontal coordinates represent the Nos. 1–97 of PHA in a–c, while it is the amount of added PHAs with buffer zone expanding in d. The vertical coordinates represent CR value. These four green trend lines with different shades (from light to dark) represent bird species with 4, 8 and 10 km median migration distance, respectively.
5. Discussion & Conclusions
Improving landscape connectivity is one of the most effective approaches for conserving biodiversity [11,38,39]. Prioritizing reforestation regions to improve landscape connectivity should thus be treated as the primary concern in the implementation of GTGP. The graph-based theory proved to be practical and effective in landscape planning and ecological resource management [40,41,42], especially when integrated with patch addition or removal process [43]. In this context, we identified the potential reforestation patches by integrating soil erosion sensitivity analysis with cropland suitability evaluation, and we revealed the effect of reforestation patches outside the protected area on improving habitat connectivity, and analyzed species’ response with various dispersal distances under different reforestation strategies, rather than focusing on existing PAs as previous studies did. Lastly, we further identified key PHAs in alterative GTGP strategies, which could provide reasonable guidance for farmland reforestation and help government in decision-making.
The suitable allocation of land use is conducive to agriculture intensification and ecological conservation [44]. The GTGP is one of the ecological restoration policies devoted to achieving environmental improvement by land use adjustment. In this context, an overview of regional environment conditions based on multi-aspect assessments is essential in investigating the spatial location of reforestation patches, which can assist in determining how necessary the management measure is. The top-down hierarchical assessment framework considering multiple aspects can not only reflect the relationship between them in detail, but also provide the feasibility of diverse factors (e.g., ecological services) integration in the future planning, and most importantly, it is cost-saving under limited resources. In the initial stage of identifying target sites of GTGP, we primarily evaluated soil erosion sensitivity and cropland suitability, as mitigating soil erosion and ensuring food supply are the commonly concerned issues in GTGP [45,46]. The results can help decision-makers better understand the ecological deterioration and cultivation conditions. Hence, the spatial overlap of soil erosion sensitivity and cropland suitability can facilitate the accuracy and efficiency of the selection of priority sites to a large extent. The conversion from cropland to forest reveals the trade-off between ecological protection and agriculture development. In this context, scientific management and appropriate spatial allocation are necessary to promote sustainable development. What managers should do first is taking actions to protect the unsuitable/marginally suitable and extremely/highly sensitive regions, that is, change their use for an ecological or environmental purpose. While the cropland of high quality or located in insensitive level is suggested to be invested into more (e.g., infrastructure improvement) for cultivation purpose as these areas can ensure considerable agricultural productivity, which will guarantee regional food security [47].
The findings of connectivity variation disclosed that the efficiency of each GTGP strategy in enhancing network connectivity varies aiming at species with different dispersal abilities. On the whole, habitat connectivity in all GTGP strategies present a kind of upward trend with the increase of dispersal distance, but S2 (continuously adding the smallest patch remaining in the PHAs) has the lowest efficiency regardless of the difference in species among all GTGP strategies. For species with high or intermediate mobility (long or intermediate dispersers), S3 and S4 exerted almost similar greatest influence on the connectivity improvement, in which S3 is slightly better than S4. Therefore, it indicates that only S3 and S4 in all GTGP strategies can shape a more connected habitat network for them (Figure 7b,c). This could be explained by the fact that the PHAs with large sizes and adjacent to protected areas could create more new links among the CHAs, or even bridge the gap between CHAs to generate a larger habitat. Therefore, in the progress of farmland reforestation, decision-makers should firstly consider change the farmland with large sizes or next to protected areas into forest land when targeting species with long and intermediate dispersal abilities, such as the Golden Pheasant (Chrysolophus pictus) and the Mandarin Duck (Aix galericulata) here. However, some scholars argued that, in a landscape where habitats comprise less than 30% of the total land cover, the spatial configuration of habitats is more important for species dispersal and landscape connectivity than the habitat amount [9,48,49,50]. Our results for long and intermediate dispersers showed a slight difference from the previous opinion. On the whole, with the increase of the area of farmland reforestation, the effect of spatial configuration of habitats on landscape connectivity (S4) is really becoming more obvious. Nevertheless, when the area of farmland reforestation is less than 28 km2, the habitat size (intra-patch connectivity, S3) has a better performance in enhancing habitat connectivity. Moreover, for short dispersers, like the Reeves’s Pheasant (Syrmaticus reevesii), when the area of allocated PHAs to the habitat network is less than 6 km2 or is between 22 and 28 km2 (Figure 7a), the habitat size (intra-patch connectivity) seems to be the dominant factor compared with the topological position, which is contradictory to the findings in the former studies. These results indicates that, the importance of spatial configuration is determined not only by the proportion of habitats, but the species dispersal ability and the area of allocated PHAs [38], especially for short dispersers in a landscape with sparse habitats. Therefore, in the progress of reforestation, if conversation objectives in the area are species with comparatively low dispersal abilities, decision-makers should comprehensively analyze the landscape pattern, the habitat area and the possible adding habitat amount to decide which strategy is better.
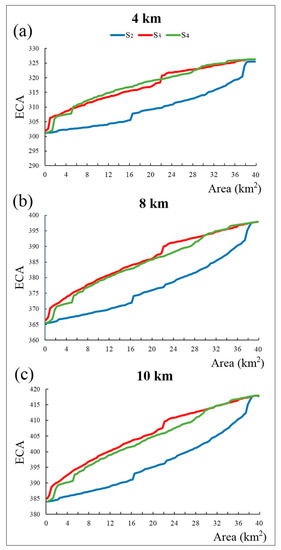
Figure 7.
The variations in ECA as the total area of added PHAs increases under three dispersal ability of 4, 8 and 10 km (a–c). The colorful trend lines (the blue line, the red line and the green line) represent three designed reforestation strategies, respectively. These strategies include iterative addition in area-ascending order (S2), iterative addition in area-descending order (S3) and iterative addition as buffer zone expands (S4).
Generally, it has been found that the ability of PHAs to improve landscape connectivity exists obvious differences. Only a few patches, such as Nos. 7, 42, and 95 in S1, Nos. 7, 42, 57, and 95 in S2, Nos. 7, 18, 42, 45, and 95 in S3 and Nos. 7, 42, 52, 78, and 95 in S4, can significantly improve the overall network connectivity. For instance, PHA No. 42, which has a high CR value (Figure 6) and is very close to three CHAs, can largely enhance overall network connectivity through acting as a stepping stone among them (Figure 5). Such a patch mainly contributes to the inter-patch connectivity due to its important topological position in the network. On the other hand, PHAs Nos. 95, 96, and 97, the top 3 largest PHA patches, may mainly contribute to intra-patch connectivity due to the fact that their size can enlarge the existing protected areas to some extent. Therefore, when planners and decision makers designate regions available for reforestation, they should take account of both the area and the spatial configuration of them comprehensively. For these prioritized PHAs, it is better to encourage to change their use from farmland to forest land in order to improve habitat connectivity and achieve greater ecological benefits.
Our research has some limitations though. First, we identified the reforestation regions only by concentrating on ecological (soil erosion) and agricultural goals (food security), which did not fully cover all the influence factors relevant to GTGP. GTGP is not only an ecological problem, but also a socioeconomic one [51]. The social and economic benefits brought at local scale can largely influence the success of GTGP [52,53]. Additionally, we only used the patch size to represent habitat characteristics in connectivity evaluation. Nevertheless, the realistic living space of target species may be smaller than the actual patch size due to the edge effect caused by human disturbances [6]. Therefore, the future work will be devoted to the improvement of the method through integrating economic and social factors into the identification of reforestation regions. Meanwhile, incorporating habitat quality to weight the patch size that could better delineate habitat features, is of our greatest interest in the future study.
To conclude, prioritizing patches outside the protected areas (PAs) is of great significance for maintaining landscape connectivity under rapid land-use change. Here we provided a three-stage hierarchical framework with four different GTGP strategies to prioritize agricultural patches for reforestation under the scheme of GTGP. It suggests that species with different migration abilities vary greatly in connectivity gains under different GTGP strategies. Our framework in association with GTGP strategies can provide guidance to restore PAs connectivity with limited land resources.
Supplementary Materials
The following are available online at https://www.mdpi.com/2071-1050/12/21/9128/s1, Figure S1: Spatial distribution of single soil erosion sensitivity factor, Table S1: Grades of the cropland suitability evaluation indexes, Figure S2: Spatial grades distribution of single cropland suitability evaluation index.
Author Contributions
Conceptualization, J.H. and Q.Y.; methodology, Z.R., J.H., Q.Y. and W.Z.; validation, W.Z.; investigation, Z.R. and W.Z.; resources, Z.R.; data curation, W.Z.; writing—original draft preparation, Z.R.; writing—review and editing, J.H. and Q.Y.; visualization, W.Z.; All authors have read and agreed to the published version of the manuscript.
Funding
This research was funded by the National Natural Science Foundation of China, grant number 41871301.
Conflicts of Interest
The authors declare no conflict of interest.
References
- Margules, C.R.; Pressey, R.L. Systematic conservation planning. Nature 2000, 405, 243–253. [Google Scholar] [CrossRef]
- Joppa, L.N.; Loarie, S.R.; Pimm, S.L. On the protection of “protected areas”. Proc. Nat. Acad. Sci. USA 2008, 105, 6673–6678. [Google Scholar] [CrossRef] [PubMed]
- Hoekstra, J.M.; Boucher, T.M.; Ricketts, T.H.; Roberts, C. Confronting a biome crisis: Global disparities of habitat loss and protection. Ecol. Lett. 2005, 8, 23–29. [Google Scholar] [CrossRef]
- MacArthur, R.H.; Wilson, E.O. The Theory of Island Biogeography; Princeton University Press: Princeton, NJ, USA, 1967. [Google Scholar]
- De Montis, A.; Caschili, S.; Mulas, M.; Modica, G.; Ganciu, A.; Bardi, A.; Ledda, A.; Dessena, L.; Laudari, L.; Fichera, C.R. Urban-rural ecological networks for landscape planning. Land Use Policy 2016, 50, 312–327. [Google Scholar] [CrossRef]
- Xun, B.; Yu, D.; Wang, X. Prioritizing habitat conservation outside protected areas in rapidly urbanizing landscapes: A patch network approach. Landsc. Urb. Plann. 2017, 157, 532–541. [Google Scholar] [CrossRef]
- Laurance, W.F.; Useche, D.C.; Rendeiro, J.; Kalka, M.; Bradshaw, C.J.A.; Sloan, S.P.; Laurance, S.G.; Campbell, M.; Abernethy, K.; Alvarez, P.; et al. Averting biodiversity collapse in tropical forest protected areas. Nature 2012, 489, 290–294. [Google Scholar] [CrossRef]
- Newmark, W.D. Isolation of African protected areas. Front. Ecol. Environ. 2008, 6, 321–328. [Google Scholar] [CrossRef]
- Andersson, E.; Bodin, Ö. Practical tool for landscape planning? An empirical investigation of network based models of habitat fragmentation. Ecography 2009, 32, 123–132. [Google Scholar] [CrossRef]
- Crooks, K.R.; Burdett, C.L.; Theobald, D.M.; King, S.R.B.; di Marco, M.; Rondinini, C.; Boitani, L. Quantification of habitat fragmentation reveals extinction risk in terrestrial mammals. Proc. Nat. Acad. Sci. USA 2017, 114, 7635–7640. [Google Scholar] [CrossRef]
- Taylor, P.D.; Fahrig, L.; Henein, K.; Merriam, G. Connectivity is a vital element of landscape structure. Oikos 1993, 68, 571–573. [Google Scholar] [CrossRef]
- Rubio, L.; Bodin, Ö.; Brotons, L.; Saura, S. Connectivity conservation priorities for individual patches evaluated in the present landscape: How durable and effective are they in the long term? Ecography 2015, 38, 782–791. [Google Scholar] [CrossRef]
- Dickson, B.G.; Albano, C.M.; McRae, B.H.; Anderson, J.J.; Theobald, D.M.; Zachmann, L.J.; Dombeck, M.P. Informing strategic efforts to expand and connect protected areas using a model of ecological flow, with application to the western United States. Conserv. Lett. 2017, 10, 564–571. [Google Scholar] [CrossRef]
- He, J.; Huang, J.; Liu, D.; Wang, H.; Li, C. Updating the habitat conservation institution by prioritizing important connectivity and resilience providers outside. Ecol. Indic. 2018, 88, 219–231. [Google Scholar] [CrossRef]
- Ouyang, Z.; Zheng, H.; Xiao, Y.; Polasky, S.; Liu, J.; Xu, W.; Wang, Q.; Zhang, L.; Xiao, Y.; Rao, E.; et al. Improvements in ecosystem services from investments in natural capital. Science 2016, 352, 1455–1459. [Google Scholar] [CrossRef]
- Liu, J.G.; Li, S.X.; Ouyang, Z.Y.; Tam, C.; Chen, X.D. Ecological and socioeconomic effects of China’s policies for ecosystem services. Proc. Nat. Acad. Sci. USA 2008, 105, 9477–9482. [Google Scholar] [CrossRef]
- Delang, C.O. China’s Grain for Green Program: A Review of the Largest Ecological Restoration and Rural Development Program in the World; Springer International Publishing: Cham, Swizerland, 2015. [Google Scholar]
- Wang, X.H.; Lu, C.H.; Fang, J.F.; Shen, Y.C. Implications for development of grain-for-green policy based on cropland suitability evaluation in desertification-affected north China. Land Use Policy 2007, 24, 417–424. [Google Scholar] [CrossRef]
- Long, H.L.; Heilig, G.K.; Wang, J.; Li, X.B.; Luo, M.; Wu, X.Q.; Zhang, M. Land use and soil erosion in the upper reaches of the Yangtze River: Some socio-economic considerations on China’s grain-for-green programme. Land Degrad. Dev. 2006, 17, 589–603. [Google Scholar] [CrossRef]
- García-Feced, C.; Saura, S.; Elena-Rosselló, R. Improving landscape connectivity in forest districts: A two-stage process for prioritizing agricultural patches for reforestation. For. Ecol. Manag. 2011, 261, 154–161. [Google Scholar] [CrossRef]
- Li, W.; Clauzel, C.; Dai, Y.; Wu, G.; Giraudoux, P.; Li, L. Improving landscape connectivity for the Yunnan snub-nosed monkey through cropland reforestation using graph theory. J. Nat. Conserv. 2017, 38, 46–55. [Google Scholar] [CrossRef]
- Wu, J.G.; Huang, J.H.; Han, X.G.; Xie, Z.Q.; Gao, X.M. Three-gorges dam-experiment in habitat fragmentation? Science 2003, 300, 1239–1240. [Google Scholar] [CrossRef]
- Renard, K.G. Predicting soil erosion by water: A guide to conservation planning with the Revised Universal Soil Loss equation (RUSLE). In Agriculture Handbook No. 703; U.S. Department of Agriculture: Washington, DC, USA, 1997. [Google Scholar]
- Ganasri, B.P.; Ramesh, H. Assessment of soil erosion by RUSLE model using remote sensing and GIS-A case study of Nethravathi Basin. Geosci. Front. 2016, 7, 953–961. [Google Scholar] [CrossRef]
- Batista, P.V.G.; Silva, M.L.N.; Curi, N.; Bueno, I.T.; Júnior, F.W.A.; Davies, J.; Quinton, J. Modelling spatially distributed soil losses and sediment yield in the upper Grande River Basin-Brazil. Catena 2017, 157, 139–150. [Google Scholar] [CrossRef]
- General Administration of Quality Supervision, Inspection and Quarantine of the People’s Repulic of China; National Standardization Management Committee of the People’s Repulic of China. The Quality of Agricultural Land Grading Procedures, GB/T 28407-2012; Standards Press of China: Beijing, China, 2012. [Google Scholar]
- National Soil Survey Office. Soils of China; China Agricultural Machinery Press: Beijing, China, 1998. [Google Scholar]
- A Framework for Land Evaluation. Soils Bulletin No. 32; Food and Agriculture Organization of United Nations: Rome, Italy, 1976.
- Bélisle, M. Measuring landscape connectivity: The challenge of behavioral landscape ecology. Ecology 2005, 86, 1988–1995. [Google Scholar] [CrossRef]
- Rudd, H.; Vala, J.; Schaefer, V. Importance of backyard habitat in a comprehensive biodiversity conservation strategy: A connectivity analysis of urban green spaces. Restor. Ecol. 2010, 10, 368–375. [Google Scholar] [CrossRef]
- Saura, S.; Estreguil, C.; Mouton, C.; Rodríguez-Freire, M. Network analysis to assess landscape connectivity trends: Application to European forests (1990–2000). Ecol. Ind. 2011, 11, 407–416. [Google Scholar] [CrossRef]
- Saura, S.; Pascual-Hortal, L. A new habitat availability index to integrate connectivity in landscape conservation planning: Comparison with existing indices and application to a case study. Landsc. Urb. Plann. 2007, 83, 91–103. [Google Scholar] [CrossRef]
- Engelhard, S.L.; Huijbers, C.M.; Stewart-Koster, B.; Olds, A.D.; Schlacher, T.A.; Connolly, R.M. Prioritising seascape connectivity in conservation using network analysis. J. Appl. Ecol. 2017, 54, 1130–1141. [Google Scholar] [CrossRef]
- Pérez-Hernández, C.G.; Vergara, P.M.; Saura, S.; Hernández, J. Do corridors promote connectivity for bird-dispersed trees? The case of Persea lingue in Chilean fragmented landscapes. Landsc. Ecol. 2015, 30, 77–90. [Google Scholar]
- Hodgson, J.A.; Thomas, C.D.; Wintle, B.A.; Moilanen, A. Climate change, connectivity and conservation decision making: Back to basics. J. Appl. Ecol. 2009, 46, 964–969. [Google Scholar] [CrossRef]
- Saura, S.; Bodin, O.; Fortin, M.J. Stepping stones are crucial for species’ long-distance dispersal and range expansion through habitat networks. J. Appl. Ecol. 2014, 51, 171–182. [Google Scholar] [CrossRef]
- Sutherland, G.D.; Harestad, A.S.; Price, K.; Lertzman, K. Scaling of natal dispersal distances in terrestrial birds and mammals. Ecol. Soc. 2000, 4. Available online: https://www.ecologyandsociety.org/vol4/iss1/art16/ (accessed on 3 November 2020). [CrossRef]
- Taylor, P.D.; Fahrig, M.; With, K.A. Landscape Connectivity: A Return to the Basics; Cambridge University Press: New York, NY, USA, 2016; pp. 29–43. [Google Scholar]
- Urban, D.; Keitt, T. Landscape connectivity: A graph-theoretic perspective. Ecology 2001, 82, 1205–1218. [Google Scholar] [CrossRef]
- Bunn, A.G.; Urban, D.L.; Keitt, T.H.; Clarke, K.; Parks, B.; Crane, M. Landscape connectivity: A conservation application of graph theory. J. Environ. Manag. 2000, 59, 265–278. [Google Scholar] [CrossRef]
- Calabrese, J.M.; Fagan, W.F. A comparison-shopper’s guide to connectivity metrics. Front. Ecol. Environ. 2004, 2, 529–536. [Google Scholar] [CrossRef]
- Ferrari, J.R.; Lookingbill, T.R.; Neel, M.C. Two measures of landscape-graph connectivity: Assessment across gradients in area and configuration. Landsc. Ecol. 2007, 22, 1315–1323. [Google Scholar] [CrossRef]
- Foltête, J.C.; Girardet, X.; Clauzel, C. A methodological framework for the use of landscape graphs in land-use planning. Landsc. Urb. Plann. 2014, 124, 140–150. [Google Scholar] [CrossRef]
- Quan, B.; Zhu, H.J.; Chen, S.L.; Römkens, M.J.M.; Bi-Cheng, L.I. land suitability assessment and land use change in Fujian Province, China. Pedosphere 2007, 17, 493–504. [Google Scholar] [CrossRef]
- Zhou, D.; Zhao, S.; Liu, S.; Zhang, L. Modeling the effects of the sloping land conversion program on terrestrial ecosystem carbon dynamics in the Loess Plateau: A case study with Ansai County, Shaanxi province, China. Ecol. Modell. 2014, 288, 47–54. [Google Scholar] [CrossRef]
- Wang, X.; Shen, J.; Wei, Z. Emergy evaluation of agricultural sustainability of Northwest China before and after the grain-for-green policy. Energy Policy 2014, 67, 508–516. [Google Scholar] [CrossRef]
- Feng, Z.; Yang, Y.; Zhang, Y.; Zhang, P.; Li, Y. Grain-for-green policy and its impacts on grain supply in West China. Land Use Policy 2005, 22, 301–312. [Google Scholar] [CrossRef]
- Andren, H. Effects of habitat fragmentation on birds and mammals in landscapes with different proportions of suitable habitat-A review. Oikos 1994, 71, 355–366. [Google Scholar] [CrossRef]
- Fahrig, L. How much habitat is enough? Biol. Conserv. 2001, 100, 65–74. [Google Scholar] [CrossRef]
- Rubio, L.; Saura, S. Assessing the importance of individual habitat patches as irreplaceable connecting elements: An analysis of simulated and real landscape data. Ecol. Complex. 2012, 11, 28–37. [Google Scholar] [CrossRef]
- Feng, L.; Xu, J. Farmers’ willingness to participate in the next-stage grain-for-green project in the Three Gorges Reservoir Area, China. Environ. Manag. 2015, 56, 505–518. [Google Scholar] [CrossRef]
- Xu, W.; Yin, Y.; Zhou, S. Social and economic impacts of carbon sequestration and land use change on peasant households in rural China: A case study of Liping, Guizhou Province. J. Environ. Manag. 2007, 85, 736–745. [Google Scholar] [CrossRef]
- Cao, S. Why large-scale afforestation efforts in China have failed to solve the desertification problem. Environ. Sci. Technol. 2008, 42, 1826–1831. [Google Scholar] [CrossRef]
Publisher’s Note: MDPI stays neutral with regard to jurisdictional claims in published maps and institutional affiliations. |
© 2020 by the authors. Licensee MDPI, Basel, Switzerland. This article is an open access article distributed under the terms and conditions of the Creative Commons Attribution (CC BY) license (http://creativecommons.org/licenses/by/4.0/).