Abstract
This study aims to explore the connection between the potential effects of energy consumption and technological innovation on economic growth in China from 1980 to 2018. The Non-Linear Autoregressive Distributive Lag (NARDL) econometric approach reveals an asymmetric connection between technological innovation, energy consumption, and economic growth in China from 1980 to 2018. The empirical results also reveal that a 1% decrease in energy consumption would imperatively decline economic growth by 12.5%. Moreover, a 1% upsurge in trademark applications improves economic growth by 8.2%. For the case of China, this study reveals that a large portion of the energy was used by families, which is regarded as a non-contributing element to the economy of China. This study suggests that the promotion and production of energy-efficient processes and products is necessary in order to make a more significant step toward sustainable development. The empirical findings also suggest that the Chinese government should regulate suitable policies aimed at promoting energy efficiency and the control of inefficient energy uses.
1. Introduction
The empirical literature has found that energy use is the main driving force for economic growth [1]. Several studies have revealed that energy usage is a significant economic determinant, mostly in middle- and upper-income-earning countries [2,3]. Since economic systems depend on the consumption of energy, its depletion would hinder the growth of the economy [4]. It is assumed that energy use is one of the essential inputs to the manufacturing cycle that, in turn, affects the scale and pace of growth because the continuity of energy use is expressed positively in the high output volume and quality of production [5,6]. A reduction in energy use can alter production, reducing the economically active population (Ea), which indirectly affects economic growth. Numerous previous studies have shown the existence of energy-saving techniques without slowing the speed of economic growth [7,8]. This argument contrasts with the growth hypothesis, which indicates that restrictive energy use policies are harmful to economic development [9]. Gross energy consumption in China was seven times greater than in Europe as it grew to over three million tons, representing 23% of overall energy consumption in the world. Some experts claim that technological innovations can increase energy efficiency and thus reduce energy use [10]. Technological innovation is providing new and better ways to manufacture goods that can contribute to the growth of the economy [11]. However, technological innovation only improves the productivity of labor, capital, and other resources [4]. Recent research has focused on the influence that energy use exerts on the development of economic systems, without considering the technical factors [12,13]. This is directly reflected in the growth of the economy. Further, less importance has been given to how the demand for energy and development of the economy is influenced by technological change and progress [14,15]. Figure 1 reflects the proportionality between resident patents and trademark applications (Ta) that can drive economic growth in China. Trademarks provide economic potential and could be used to raise income levels, value, and surplus in the Chinese economy. Therefore, trademark protection systems can play a dynamic role in the smooth economic development of a country.
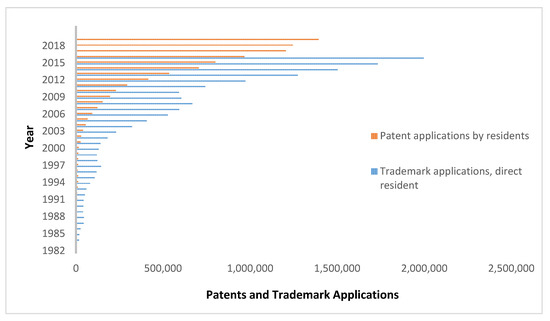
Figure 1.
China’s patent applications by residents and Ta (trademark applications by direct residents). Source: Authors’ work. Based on https://data.worldbank.org/indicator/IP.PAT.RESD?locations=CN&view=chart.
Figure 2 presents the evolution of total energy consumption by manufacturing, transport, and farming. It demonstrates that the industrial sector is the leading energy consumer in China, followed by the agriculture and transport sectors. This substantiates that China is mainly an industrialized country and shows the size of the contribution of each industry.
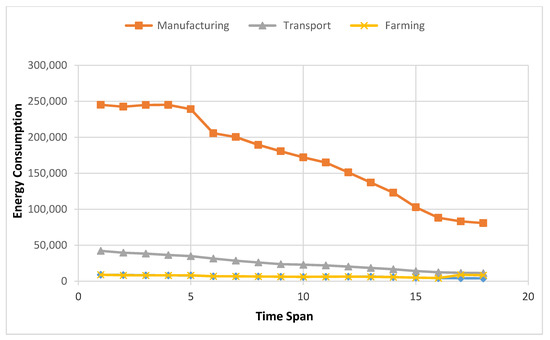
Figure 2.
Total energy consumption by manufacturing, transport, and farming (10,000 tons). Source: Authors’ work. Based on http://www.stats.gov.cn/tjsj/ndsj/2019/indexeh.htm.
Figure 3 shows that energy consumption in coastal cities is more significant than in the west because coastal areas are considered more productive. In the same context, Figure 3 also reflects the volume of production of new materials in different regions of China. These are the same areas that consume the largest volume of energy, which crosses the consumption of regions exporting new materials, explaining its major contribution to the growth of the Chinese economy.
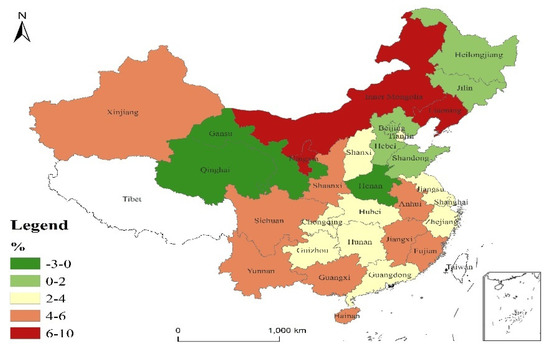
Figure 3.
Energy consumption rate per CNY 10,000 gross domestic product (GDP) by region in 2019. Source: Authors’ work. Based on http://www.stats.gov.cn/english/PressRelease/202008/t20200812_1782399.
As depicted in Figure 4, we observe that in 2019, both the eastern and the southern regions generated large volumes of revenue from the sale of new and innovative products. This process reflects the volume of innovations in both regions, which in turn reflects the volume of the added value provided by the sale of new products, i.e., CNY 2,194,749,187.
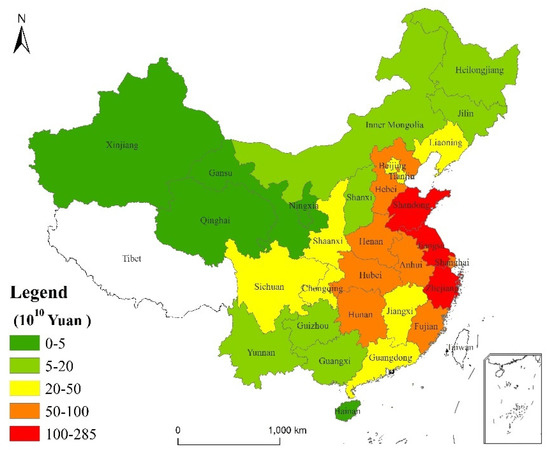
Figure 4.
China’s sales revenue of new products by region in 2019. Source: Authors’ work. Based on http://www.stats.gov.cn/tjsj/ndsj/2019/indexeh.htm.
Figure 5 illustrates the volume of newly innovated products. It reveals that newly invented materials have an added value in the Chinese economy and play a significant role in its growth. We noted that the eastern and southern regions have the largest export volume, estimated at CNY 343,180,877, and the rest of the regions export products worth CNY 61,911,916. The volume of exports of innovative and new products is reflected in the total volume of exports, which is one of the pillars of economic growth in China.
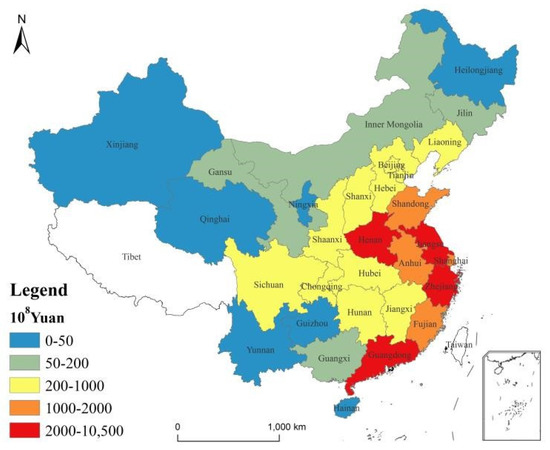
Figure 5.
China’s export of new products by region in 2019. Source: Authors’ work. Based on http://www.stats.gov.cn/tjsj/ndsj/2019/indexeh.htm.
This study aims to investigate the long- and short-run asymmetric impact of energy use and technological innovation and their influence on Chinese economic growth from 1980 to 2018. For this purpose, we employed the Non-Linear Autoregressive Distributive Lag (NARDL) method to check co-integration and long-run elasticities. This study is a groundbreaking analysis focused on the effects of energy use and technological innovations on economic growth. It investigates whether the utilization of energy and advancement in technology are the drivers of economic growth in China. This study also includes an additional socio-economic variable, i.e., the economically active population. Furthermore, the timeline used is longer and modified, and the range of variables differs from previous studies. This study applies the Non-Linear Autoregressive Distributed Lag (NARDL) model, which helps us to explore the effects of various positive and negative shocks in energy consumption and technological innovations on the economic development of China. This study contributes to the empirical literature by offering a new series of public policy recommendations aimed at improving energy supply as well as the management of technology promotion. It also adds to the literature on the effects of energy usage and technological advancement, as we used trademark applications and resident patents as proxy variables for technological innovation in Chinese economic growth. The investigation answered the following questions: First, does energy use have a positive impact on economic growth? Second, do positive or negative shocks in technological innovations improve economic growth in China? Finally, does energy consumption have an asymmetric impact on the GDP of China? The rest of this study is arranged as follows: Section 2 includes a literature review. Section 3 outlines the methods utilized in the analysis. Section 4 defines the results and discussions, and Section 5 addresses empirical conclusions and policy discussion. The report is outlined in Section 6.
2. Literature Review
This paper summarizes the literature in three sections: (1) economic growth and energy consumption, (2) technological innovation and energy consumption, and (3) the examination of the effects of technological innovation on energy demand rate and economic growth [16]. The study proposed by [17] suggested reducing the use of non-renewable energy sources and enhancing the innovation of technology that is energy efficient. It was argued in [18] that Granger’s technological innovation triggers electricity usage and adversely affects Malaysian electricity use. The use of electricity as a more environmentally sustainable green energy source to encourage environmental change was suggested as an alternative to direct fossil fuels. These studies concluded that technological innovation using non-renewable energies encourages various forms of recycling in different countries [19]. The study done by [20] found that the Chinese economy’s constant growth has a long-term dependency on energy demand and that energy has a significant effect on China’s economic development [21]. These studies also used the Granger causality test. The research found a bidirectional causality of energy use in the economic growth of China [11]. For eastern and western China as a whole, there is no long-term causal connection between energy use and economic development. In addition to this, there is a short-term causal two-way interaction in the central zone. Some studies also showed signs of bidirectional causalities between the use of energy and economic growth that support the feedback hypothesis [21]. The fourth set of studies suggested that only income or the growth of the economy would be affected by energy use, suggesting that these studies found a short causality between economic growth and energy use, a hypothesis that affirms energy neutrality, which they considered independent variables for economic growth [22,23] following the cutting-edge output of references [24]. The investigation done by [25] stated that the energy used in the agriculture sector has a positive connection with environmental quality in Pakistan. The investigation of [26] established that technology boosts agriculture production in Pakistan.
The study done by [27] ascertained the impact of social, economic, and environmental elements on energy consumption. The study stated that GDP, greenhouse gas emanations, labor development, and populace have a direct influence on both primary and final energy consumption. However, energy tariffs and health expenditures revealed an inverse association with both primary and secondary energy consumption. Moreover, the examination of [28] documented the association between energy price, technological development, energy consumption, and GDP in Demark. The investigation found that technological development and the price of energy have an indirect and significant connection to energy consumption. In addition, the study reported that GDP and the use of energy are not correlated. However, the price of energy and technology development Granger cause energy use. The study by [29] investigated the impact of government spending in terms of technology on the economic growth of Malaysia. The investigation stated that technological innovations and economic growth have a robust connection with each other. Moreover, the GDP revealed the most substantial influence of government spending in terms of technological development. The study by [30] discussed the three-angle relationship between economic growth, technology, and tourism development. The study informed that technological innovations bring international tourists to China, leading to an increase in China’s per capita GDP. Moreover, the research by [31] mentioned that ICT plays a leading role in economic growth, while also increasing greenhouse gas emissions. This literature states that technological innovation and energy use have a crucial impact on the economy of a nation. Hence, as per the authors’ best knowledge, it is the first investigation that reveals the renowned nexus between energy use, technological innovation, and economic growth for the nation of China.
3. Materials and Methods
This section focuses on the study’s framework and the data for the methodology. Data collected annually from 1980 to 2018 was utilized to achieve the study’s objective. The data was extracted from the World Development Indicator (WDI) 2020 database. Variables included energy use (kg of oil equivalent per capita) as a proxy that interpreted energy use (Eu) collected from the National Bureau of Statistics of China, GDP (considered constant at the 2005 price) as a proxy for economic growth in China, the total number of resident patent applications (Pa), collected from the global economy, trademark applications (Ta), and the active economic population (Ea) rate (10,000 people) in the period of the study collected from the China Central Statistics Office. The other data series were transformed into natural logarithms.
However, economic growth is not significantly affected by energy use in the long run [32,33]. The increase in the economically active population will result in a rise in demand for energy and thus lead to an expected increase in the growth of the economy [32]. The use of trademark applications is growing, with improvements in the creative industry and economic growth. It impacts three indicators: patents, trademarks, and economic growth [32,33]. The technique used in this section was the asymmetric integration test developed by [21]. The asymmetric responses of the variables to the development of the economy were examined using the Non-Linear Autoregressive Distributed Lag (NARDL) model [34,35,36]. The model specification of the present paper examined the asymmetric effect of technological innovation and China’s energy use on economic development from 1980 to 2018. The functional framework for this study was specified, and the implicit form is as follows:
GDP = f (Eu, Ta, Pa, Ea)
Here GDP specifies the gross domestic product in China, while Eu indicates the energy used. In addition, Ta, Pa, and Ea designate the trademark applications, patent applications, and economically active population, respectively. Based on Table 1, the number of patents, the commercial operation population, and the usage of trademarks and resources was found to have higher mean values. This result implies that the economy is in a state of growth, as the factors are related explicitly to GDP. Distribution of the residuals was usually carried out after the Jarque–Bera statistics dismissed the null hypothesis. The empirical framework of this study can be articulated as follows:

Table 1.
Descriptive statistics.
The NARDL model can be used to derive the asymmetries of both long- and short-run dynamics and variables included in the NARDL model [11,21,37,38]. The NARDL-bound check can also have reliable estimates in the presence of a limited sample size [17]. It can also be applied irrespective of the order of integration but does not have to involve the sequence at second difference I(2) [17]. The emphasis of this study was on the asymmetric effect of technological advancement (Pa, Ta) and energy use (Eu) on economic growth in China. Appropriations given in Equation (2) set a linear frame with a long-run portion. However, the study examined non-linearity as follows:
In Equation (3), the model’s long-run parameters are the models . These implement all positive and negative improvements suggested by the respective () and examine whether the asymmetric impact of technological innovation and energy consumption on economic growth (measured by GDP) can extract the results of the factors in the short run and long run. This can be redrafted as [39,40]
where βt is decomposed as a long-run V1 regressor vector, and
where are the independent variables divided into a partial negative integer. Are these promising developments? The asymmetric impact of technological innovation and energy consumption on economic growth is computed by the addition of positive Eu+, Ta+, Pa+ changes and negative Eu−, Ta−, Pa− changes as
If we are thinking primarily about the asymmetric impact of technological innovation and energy consumption on economic growth, then if we replace positive changes in Eu+, Ta+, Pa+ and negative changes in Eu−, Ta−, Pa−, [41,42] can be applied to Equation (9) as follows:
When measuring Equation (9), we can determine whether technological innovation and energy consumption have a symmetric or asymmetric impact on China’s economic development. The same partial size and signature coefficients suggest that advancement in technology and energy use influence economic growth, if not asymmetrically. If the impulses of order I(1) or I(0) are integrated, incorporating vector I(2) will nevertheless produce dubious results [43,44]. To determine the stationary properties of the model variables, we carried out an enhanced augmented Dickey–Fuller (ADF) unit root study compared with [45].
A few pre-tests were required before the NARDL techniques could be calculated. If the impulses of order 0 or 1 were integrated, using vector I(2) would yield dubious results [46,47,48]. Determining the stationary properties of the variables used in the model, we performed an ADF unit root check. Compared with the Zivot–Andrews test and against [11], the ADF test led to the finding, which was rendered as biased, of the presence of unknown structural breaks. We employed Zivot–Andrews to tackle the issue of a structural test for separation [49].
4. Empirical Model
In this section, we analyze the relationship between energy use, technological advancement, and economic development in China using annual data from 1980 to 2018 by utilizing the non-linear approach. The NARDL approach is used to analyze asymmetric co-integration, asymmetric elasticities, and dynamic impact when checking for structural splits. In our study, we present some drawbacks before continuing to the policy debate. Non-linear ARDL models have been shown to escape bias with endogenous regressors and missing variables [21]; the approach typically needs a broader dataset. In comparison, there are other systemic break experiments, such as [50].
The NARDL integration approach is appropriate irrespective of whether the model variables are I(0) or I(1). Stationary measures to determine the absence of the I(2) part of the model were also needed [51].
In a first step, we checked the selected variables’ stationary properties through the ADF unit root tests. Table 2 displays the effects of the unit root test to determine stationarity at the level and first difference. The results of the ADF analysis suggested that the study variables are stationary at I(0) and I(1). Hence, the NARDL model was suitable for this study. Eu t-statistics were deemed statistically meaningless at the stage (Augmented Dickey Fuller (ADF) = −2, 043326, Phillip Perron (PP) = −2, 04332) but critical at the first difference (ADF = −5, 532,918, PP = −5, 51,193 at 5%). At that moment, Pa’s t-statistics were not statistically insignificant (ADF = 1.346344, PP = 1.052668) but were significant at first difference (ADF = −4.664734, PP = −4.66566 at 1%). The t-statistics for Ta were already deemed statistically trivial at this stage (ADF = 6.656549, PP = −2, 69351), although they were significant at the first difference (ADF = 0.409641, PP = −4, 51,578 at 1%). The Ea t-statistics were established as small at the first point (ADF = −4.354776, PP = −4.21527); however, at first differential, they were significant (ADF = −3.783461, PP = −3.77840 at 5%). The results revealed that GDP and Ta were non-stationary at the level but stationary after the first level I(1), allowing for the introduction of the NARDL model. The specification of the lag order and pattern consistency parameters is considered a pre-requisite for further analysis. The overall lag order was chosen as the model specification along with the NARDL (1, 0, 1, and 0), based on the AIC findings reported in Table 1 and Table 3, (1, 0), and as the model layout of NARDL (1, 0, 1, and 0).

Table 2.
Unit root test results.

Table 3.
Unit root and structural break and Zivot–Andrews tests.
Conventional stationary tests such as ADF or PP disappoint the variables to be implemented in order one or two if one or more breaks occur in the sequence [52]. In this regard, we conducted a Zivot–Andrews structural break check [53] to test data break(s) and verify the I(2) variable’s exclusion. Table 3 presents the Zivot–Andrews test results. The Zivot–Andrews unit root test confirmed time breaks in the data, confirming that none of the variables in the model are I(2) [21]. The breaks found in the data are widely related to incidents that occurred internationally as well as domestically. The structural split for GDP, Eu, Pa, Ta, and Ea occurred respectively in 1998, 2008, and 2013. Checking for stationarity remains critical until co-integration experiments are conducted. Single time series such as regression analysis results in false findings after a while [34]. The time series of the natural logarithm of GDP, the population active in the economy, and the natural logarithm of resident patents remarket the time break point (1998) both in the intercept and the trend; furthermore, energy consumption has a break point (1998) at the intercept (2003) where the repercussions of the financial crisis in the countries of Asia had implications for the innovation sector in China in the years 1997 and 1998.
The applicability of the Brock, Dechert, and Scheinkman (BDS) test requires the use of time intervals in data evaluation [54]. The BDS analysis revealed a non-linear interaction from the time sequence. The specifics from the BDS study are listed in Table 4. The BDS approach bans the principle of I(0) (independent and identically distributed) of multidimensional residuals [39,55]. These results are strongly related to the non-linearity of the sequence and imply the applicability of the popularized NARDL by [56]. The next move was to evaluate the co-integration among the variables employed in this study. If the estimated value of the F-test model is greater than the upper critical bound then the null hypothesis of no co-integration is rejected. The average statistical significance in our case was 45.84105, which was greater than the upper limit, suggesting that co-integration exists in the study factors (Table 5).

Table 4.
Brock, Dechert, and Scheinkman (BDS) test.

Table 5.
The NARDL model’s bound test results.
5. Empirical Results and Discussion
The long-run estimation of the NARDL model demonstrates precision in both the positive and negative elements. For energy use, China’s economic growth elasticity values were −1.242007 (increase) and −0.441104 (decrease), which implies that a 1% increase (decrease) in energy use causes an upsurge (decrease) in Chinese economic growth by −12.4% (−0.44%). The long-term energy use coefficient was negative and statistically significant at 10%, whereas the positive component was statistically significant at 1%. The negative portion of energy use has been described as statistically negligible depending on the specific statistical importance and severity of the measured elasticity. Fluctuations in energy use showed an asymmetric impact on long-term industrialization in China. Positive energy use shocks in the long term reflect a significant positive effect on the GDP in China. However, negative and positive shocks in patent applications (Pa) reveal an inconsequential impact on economic growth in China. From the empirical results (Table 6), the trademark application elasticity values were 0.829725 (increase) and 0.113232 (decrease) and significant at 10% and 5%, respectively. The economically active population (Ea) was also negligible and had no long-term impact on China’s economic growth.

Table 6.
The NARDL model’s long run.
Technological innovation plays a crucial role in driving the Fourth Industrial Revolution and is also a significant factor in the future of China’s economic growth [50]. Invention and innovation are one of the most important pillars of the Fourth Industrial Revolution, as are trademark applications, which work to create new products that contribute to economic growth [54]. China is working to be one of the pioneers of the Fourth Industrial Revolution by supporting and expanding technological innovation. China is also providing contributions to and assistance with trademark applications, which is one of the commercial aspects of technological production. Furthermore, China is also working to increase trademark and patent contributions to the national growth of the economy. According to one forecast, in order for China to reach its annual GDP growth target of 5.5% to 6.5% over the next five years, multifactor productivity growth should contribute as much as 35% to 50% of total GDP growth or two to three percentage points per annum. China will henceforth have to rely heavily on increasing its workforce and investing in fuel for growth. China’s five main opportunities for transformation to a productivity-based economic growth model are identified in the study. Nearly every sector will be influenced by the Fourth Industrial Revolution [57]. There are undeniable advantages considering that traditional industrial companies use modern technology to develop new business with creative innovations [58].
Conversely, there could be a lack of innovation potential in the fall-down of firms or sectors. Consequently, the whole economy would need to be restructured. The development of new companies funded by network, big data, and e-commerce innovations in China are considerably rapid [59]. The emergence of the Fourth Industrial Revolution will further the transition of economic growth into a new age—that is, the pattern of growth in technological activity, growth powered by innovation, resource regenerative growth, and growth in connotation production [60]. The Fourth Industrial Revolution will also create and revolutionize new technologies that rationalize energy consumption and produce tools and machines with less energy consumption, while preventing both people and industrial institutions from wasting energy through massive data operations. This facilitates building effective strategies in public monitoring of energy consumption. Figure 6a–e indicate the impact of negative and positive shock on the study variables. The outcomes confirmed the asymmetric impact of energy use and technological innovation on the economic growth of China.
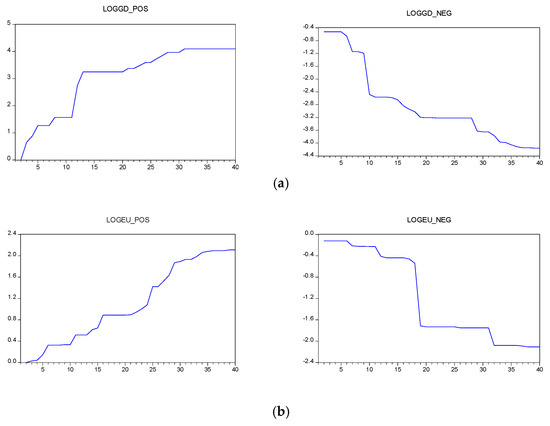
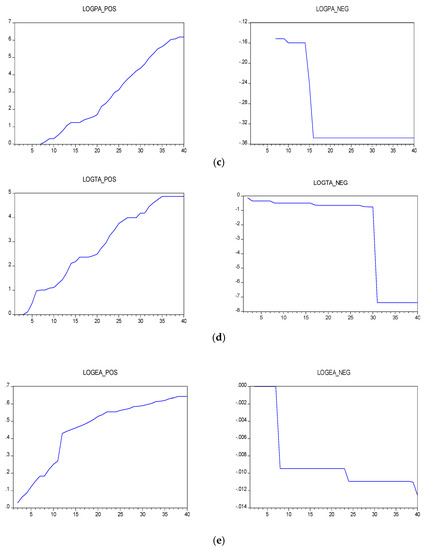
Figure 6.
Positive and negative graphs.
In addition, the short-run NARDL test (Table 7) shows the acceptability of both positive and negative elements. (a) Positive and negative graphs of GDP. The energy use (Eu) elasticity values for economic growth were −0.78979 (increase) and −0.863097 (decrease), indicating that a 1% boost (decrease) in energy use will lead to a growth in China’s economy of −6.78% (−0.86). (b) Positive and negative graphs of Eu. Furthermore, the trademark application (Ta) elasticity ratios of China’s economic development were 1.309284 (increase) and −0.0190 (decrease), a 1% growth in China’s economy (decrease) in the same sense. (d) Positive and negative graphs of Ta. The patent application (Pa) elasticity values against economic growth were 0.573774 (increase) and −1.51160 (decrease), indicating that the economy grew by 1%. (c) Positive and negative graphs of Pa. The active population (Ea) elasticity values 9.968609 (increase) and −0.0190 (decrease) impacted China’s economic development. (e) Positive and negative graphs of Ea. The term error-correction with a negative coefficient is important. This evidence also reinforces the interaction between the variables over the long term. The investigation showed that the disequilibrium in economic growth that occurred last year would be corrected at the speed of 89% in the current year. Table 8 exhibits that the study variables have asymmetric long- and short-term impacts on the Chinese economy. Hence, NARDL was a suitable model for this study.

Table 7.
The NARDL model’s short run.

Table 8.
Wald test results.
In short, the results of the NARDL approach showed that a positive shock in energy use had a significant effect on economic growth while a positive shock in trademark applications would increase the GDP by 0.82% in China and 11% with negative shocks. Although energy use and trademark applications showed a favorable impact in the short term, they also revealed a detrimental influence in the short term. These findings are correlated with the growing energy consumption hypothesis for China, evidencing that the Chinese economy is growing. Furthermore, the study stated that economic growth is mostly affected by energy use and also the number of patents of the Ta. It showed there is a direct link with productivity reflected in the volume of production and an increase in the speed of growth of the Chinese economy. The Chinese government should also produce campaigns aimed at educating families and raising their awareness on how to optimally use energy and avoid waste. This would ensure household energy consumption is considered sterile consumption, which is reflected in economic growth [61].
Table 9 exposes the outcomes of serial correlation and the Heteroskedasticity model [62]. The results stated that there was no serial correlation or Heteroskedasticity in the residuals of the NARDL model. Moreover, Figure 7 presents the findings of cumulative sum of recursive residuals (CUSUM) and its square (CUSUMSQ) tests. As the cumulative sum of recursive residuals and cumulative sum of the square of recursive residuals, both were within the critical bounds at a 5% significance level. Figure 7 reveals that our model is stable and trustworthy to estimate short-run and long-run coefficients.

Table 9.
Diagnostics test results.
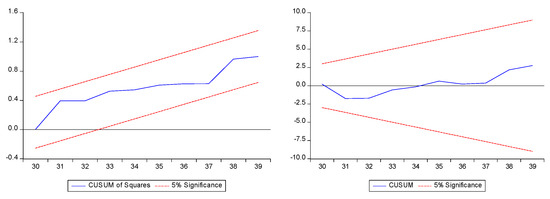
Figure 7.
CUSUM and CUSUMSQ tests graphs. Source: Authors’ calculations.
6. Conclusions and Policy Implications
The main objective of this study was to validate the existence of an asymmetric effect of technological innovation and energy consumption on economic growth in China. For this purpose, this study used the Non-Linear Autoregressive Distributed Lag methodology to confirm the asymmetric impact of energy consumption, patent applications, trademark applications, and the economically active population on economic growth in China during the period between 1980 and 2018. To check the stationary properties of the selected variables, we used the Phillip Perron and augmented Dickey–Fuller unit root tests. The results confirmed that all the series were stationary at the level I(0) and the first difference I(1), concluding that no one series is stationary at the second difference I(2). The econometric results reveal a long-run negative connection between energy use and economic growth. This study validates the existence of asymmetric behavior between energy consumption and economic growth, both long term and short term, based on the Wald test. Moreover, the trademark applications (as a proxy of technological innovations) present a positive, and asymmetric, connection with the economic growth in both the long- and short-term estimations. The resident patent applications were significant in revealing a short-term positive effect. We found that the relationship between energy consumption and economic growth was negative. In consequence, our results suggest that both energy use and trademark applications can be considered essential determinants of economic growth in the case of China. Additionally, our results recommend redesigning energy protocols and regulations in order to avoid overexploitation of fossil sources and inefficient energy uses, allowing the government to compensate for economic losses from the irrational use of energy. In addition, Chinese policymakers should encourage investment in the renewable energy industry, which will lead to a reduction in the negative impact of inefficient energy consumption, reducing pollution pressure on the environment and improving public health in China. Furthermore, the government should establish an efficient energy system through which the energy consumed by industrial producers and family sectors can be monitored. The Chinese government should also build a new pricing system that would encourage the efficient use of energy and reduce wasteful energy consumption. Although China overall is achieving significant progress and development in the field of technological innovation, this sector still faces some difficulties, in regard to which we present some suggestions. First, the government and decision-makers in the Chinese government should adopt an economic system whereby excessive administrative bureaucracy stimulates the entry of innovations and inventions. Second, the government should provide the materials and moral support for trademark applications to accelerate their introduction into operation and production, which will benefit the economy and accelerate the process of economic growth.
Author Contributions
Conceptualization, A.Z.; data curation, A.Z.; formal analysis, A.Z.; investigation, A.Z.; methodology, K.S.; project administration, D.B.-L.; software, K.S.; supervision, D.B.-L.; writing—original draft, A.Z. All authors have read and agreed to the published version of the manuscript.
Funding
This research received no external funding.
Acknowledgments
We are thankful to two anonymous reviewers and an editor for guiding us to make this article superior.
Conflicts of Interest
The authors declare no conflict of interest.
References
- Bosah, P.C.; Li, S.; Ampofo, G.K.M.; Asante, D.A.; Wang, Z. The nexus between electricity consumption, economic growth, and CO2 emission: An asymmetric analysis using nonlinear ARDL and nonparametric causality approach. Energies 2020, 13, 1258. [Google Scholar] [CrossRef]
- Bejan, A.; Errera, M.R.; Gunes, U. Energy theory of periodic economic growth. Int. J. Energy Res. 2020, 44, 5231–5242. [Google Scholar] [CrossRef]
- Hossain, M.A.; Chen, S. Decoupling of energy-related CO2 emissions from economic growth: A case study of Bangladesh. Environ. Sci. Pollut. Res. 2020, 27, 20844–20860. [Google Scholar] [CrossRef] [PubMed]
- Cao, Y.; Wan, N.; Zhang, H.; Zhang, X.; Zhou, Q. Linking environmental regulation and economic growth through technological innovation and resource consumption: Analysis of spatial interaction patterns of urban agglomerations. Ecol. Indic. 2020, 112, 106062. [Google Scholar] [CrossRef]
- Rashid Khan, H.U.; Islam, T.; Yousaf, S.U.; Zaman, K.; Shoukry, A.M.; Sharkawy, M.A.; Gani, S.; Aamir, A.; Hishan, S.S. The impact of financial development indicators on natural resource markets: Evidence from two-step GMM estimator. Resour. Policy 2019, 62, 240–255. [Google Scholar] [CrossRef]
- Shan, Y.; Guan, D.; Hubacek, K.; Zheng, B.; Davis, S.J.; Jia, L.; Liu, J.; Liu, Z.; Fromer, N.; Mi, Z.; et al. City-level climate change mitigation in China. Sci. Adv. 2018, 4, eaaq0390. [Google Scholar] [CrossRef]
- Huseynov, F.; Sardarli, S.; Zhang, W. Does index addition affect corporate tax avoidance? J. Corp. Financ. 2017, 43, 241–259. [Google Scholar] [CrossRef]
- Wang, T.; Wen, Y.; Lin, B. Energy consumption and the influencing factors in China: A nonlinear perspective. J. Clean. Prod. 2020, 249, 119375. [Google Scholar] [CrossRef]
- Ike, G.N.; Usman, O.; Sarkodie, S.A. Fiscal policy and CO2 emissions from heterogeneous fuel sources in Thailand: Evidence from multiple structural breaks cointegration test. Sci. Total Environ. 2020, 702, 134711. [Google Scholar] [CrossRef]
- Bao, C.; Xu, M. Cause and effect of renewable energy consumption on urbanization and economic growth in China’s provinces and regions. J. Clean. Prod. 2019, 231, 483–493. [Google Scholar] [CrossRef]
- Wang, M.C.; Kuo, P.L.; Chen, C.S.; Chiu, C.L.; Chang, T. Yield spread and economic policy uncertainty: Evidence from Japan. Sustainability 2020, 12, 4302. [Google Scholar] [CrossRef]
- Irandoust, M. The renewable energy-growth nexus with carbon emissions and technological innovation: Evidence from the Nordic countries. Ecol. Indic. 2016, 69, 118–125. [Google Scholar] [CrossRef]
- Álvarez-Ayuso, I.C.; Kao, C.; Romero-Jordán, D. Long run effect of public grants and tax credits on R&D investment: A non-stationary panel data approach. Econ. Model. 2018, 75, 93–104. [Google Scholar] [CrossRef]
- Begum, R.A.; Sohag, K.; Abdullah, S.M.S.; Jaafar, M. CO2 emissions, energy consumption, economic and population growth in Malaysia. Renew. Sustain. Energy Rev. 2015, 41, 594–601. [Google Scholar] [CrossRef]
- Duan, F.; Ji, Q.; Liu, B.Y.; Fan, Y. Energy investment risk assessment for nations along China’s Belt & Road Initiative. J. Clean. Prod. 2018, 170, 535–547. [Google Scholar] [CrossRef]
- Prihawantoro, S. Technological Progress and Economic Growth in Indonesia: A Regional Perspective. Int. J. Recent Sci. Res. 2016, 7, 14033–14039. [Google Scholar]
- Nguyen, H.M.; Bui, N.H.; Vo, D.H.; McAleer, M. Energy consumption and economic growth: Evidence from Vietnam. J. Rev. Glob. Econ. 2019, 8, 350–361. [Google Scholar] [CrossRef]
- Shao, Z. On electricity consumption and economic growth in China. Renew. Sustain. Energy Rev. 2017, 76, 353–368. [Google Scholar] [CrossRef]
- Shimbar, A.; Ebrahimi, S.B. Political risk and valuation of renewable energy investments in developing countries. Renew. Energy 2020, 145, 1325–1333. [Google Scholar] [CrossRef]
- Benny, V. The Impact of Patent, Trademark and Industrial Design Applications in Indian Economy. Gedrag Organ. Rev. 2020, 33, 2399–2411. [Google Scholar] [CrossRef]
- Khan, Z.; Hussain, M.; Shahbaz, M.; Yang, S.; Jiao, Z. Natural resource abundance, technological innovation, and human capital nexus with financial development: A case study of China. Resour. Policy 2020, 65, 101585. [Google Scholar] [CrossRef]
- Liu, Y.; Chen, B.; Wei, W.; Shao, L.; Li, Z.; Jiang, W.; Chen, G. Global water use associated with energy supply, demand and international trade of China. Appl. Energy 2020, 257, 113992. [Google Scholar] [CrossRef]
- Ahmad, M.; Khan, Z.; Rahman, Z.U.; Khattak, S.I.; Khan, Z.U. Can innovation shocks determine CO2 emissions (CO2e) in the OECD economies? A new perspective. Econ. Innov. New Technol. 2019, 1–21. [Google Scholar] [CrossRef]
- Liu, X.; Sun, T.; Feng, Q.; Zhang, D. Dynamic nonlinear influence of urbanization on China’s electricity consumption: Evidence from dynamic economic growth threshold effect. Energy 2020, 196. [Google Scholar] [CrossRef]
- Chandio, A.A.; Jiang, Y.; Rauf, A.; Mirani, A.A.; Shar, R.U.; Ahmad, F.; Shehzad, K. Does Energy-Growth and Environment Quality Matter for Agriculture Sector in Pakistan or not? An Application of Cointegration Approach. Energies 2019, 12, 1879. [Google Scholar] [CrossRef]
- Chandio, A.A.; Jiang, Y.; Rauf, A.; Ahmad, F.; Amin, W.; Shehzad, K. Assessment of formal credit and climate change impact on agricultural production in Pakistan: A time series ARDL modeling approach. Sustainability 2020, 12, 5241. [Google Scholar] [CrossRef]
- Zaharia, A.; Diaconeasa, M.C.; Brad, L.; Lădaru, G.R.; Ioanăs, C. Factors influencing energy consumption in the context of sustainable development. Sustainability 2019, 11, 4147. [Google Scholar] [CrossRef]
- Murad, M.W.; Alam, M.M.; Noman, A.H.M.; Ozturk, I. Dynamics of technological innovation, energy consumption, energy price and economic growth in Denmark. Environ. Prog. Sustain. Energy 2019. [Google Scholar] [CrossRef]
- Yen, P.S.; Wei, P.S. Modelling the Economic Cycle between GDP and Government Spending on Technological Innovation. Soc. Sci. Humanit. 2017, 25, 22–45. [Google Scholar]
- Shehzad, K.; Liu, X.; Rauf, A.; Arif, M.; Sohail, N.; Amin, W. Revolutionising tourism development in China: An effective role of ICT and Western Silk Road project Revolutionising tourism development in China: An e ff ective role of ICT and Western Silk Road project. Asia Pac. J. Tour. Res. 2019, 1665. [Google Scholar] [CrossRef]
- Shehzad, K.; Xiaoxing, L.; Sarfraz, M.; Zulfiqar, M. Signifying the imperative nexus between climate change and information and communication technology development: A case from Pakistan. Environ. Sci. Pollut. Res. 2020. [Google Scholar] [CrossRef] [PubMed]
- Meo, M.S.; Nathaniel, S.P.; Khan, M.M.; Nisar, Q.A.; Fatima, T. Does Temperature Contribute to Environment Degradation? Pakistani Experience Based on Nonlinear Bounds Testing Approach. Glob. Bus. Rev. 2020, 1–15. [Google Scholar] [CrossRef]
- Azam, M. Energy and economic growth in developing Asian economies. J. Asia Pacific Econ. 2020, 25, 447–471. [Google Scholar] [CrossRef]
- Carrion-I-Silvestre, J.L.; Kim, D.; Perron, P. GLS-based unit root tests with multiple structural breaks under both the null and the alternative hypotheses. Econom. Theory 2009, 25, 1754–1792. [Google Scholar] [CrossRef]
- Bildirici, M.; Türkmen, C. The Chaotic Relationship between Oil Return, Gold, Silver and Copper Returns in TURKEY: Non-Linear ARDL and Augmented Non-linear Granger Causality. Procedia Soc. Behav. Sci. 2015, 210, 397–407. [Google Scholar] [CrossRef]
- Tou, Y.; Watanabe, C.; Moriya, K.; Naveed, N.; Vurpillat, V.; Neittaanmäki, P. The transformation of R&D into neo open innovation- a new concept in R&D endeavor triggered by amazon. Technol. Soc. 2019, 58. [Google Scholar] [CrossRef]
- Apergis, N.; Cooray, A. The dynamics of Greek public debt – evidence from simultaneous and structural VAR models. Appl. Econ. 2015, 47, 967–980. [Google Scholar] [CrossRef]
- Van Hoang, T.H.; Lahiani, A.; Heller, D. Is gold a hedge against inflation? New evidence from a nonlinear ARDL approach. Econ. Model. 2016, 54, 54–66. [Google Scholar] [CrossRef]
- Baz, K.; Xu, D.; Ali, H.; Ali, I.; Khan, I.; Khan, M.M.; Cheng, J. Asymmetric impact of energy consumption and economic growth on ecological footprint: Using asymmetric and nonlinear approach. Sci. Total Environ. 2020, 718, 137364. [Google Scholar] [CrossRef]
- Greenwood, C.J.; Youssef, G.J.; Betts, K.S.; Letcher, P.; Mcintosh, J.; Spry, E.; Hutchinson, D.M.; Macdonald, J.A.; Hagg, L.J.; Sanson, A.; et al. A comparison of longitudinal modelling approaches: Alcohol and cannabis use from adolescence to young adulthood. Drug Alcohol Depend. 2019, 201, 58–64. [Google Scholar] [CrossRef]
- Sarfraz, M.; Shehzad, K. Gauging the air quality of New York: A non-linear Nexus between COVID-19 and nitrogen dioxide emission. Air Qual. Atmos. Health 2020, 13, 1135–1145. [Google Scholar] [CrossRef]
- Shehzad, K.; Xiaoxing, L.; Arif, M.; Rehman, K.U. Investigating the Psychology of Financial Markets During COVID-19 Era: A Case Study of the US and European Markets. Front. Psychol. 2020, 11, 1–13. [Google Scholar] [CrossRef]
- Narayan, P.K.; Popp, S. A new unit root test with two structural breaks in level and slope at unknown time. J. Appl. Stat. 2010, 37, 1425–1438. [Google Scholar] [CrossRef]
- Vendrell-Herrero, F.; Bustinza, O.F.; Opazo-Basaez, M. Information technologies and product-service innovation: The moderating role of service R&D team structure. J. Bus. Res. 2020, 1–15. [Google Scholar] [CrossRef]
- Zivot, E.; Andrews, D.W.K. Further evidence on the great crash, the oil-price shock, and the unit-root hypothesis. J. Bus. Econ. Stat. 1992, 10, 251–270. [Google Scholar] [CrossRef]
- Bano, S.; Zhao, Y.; Ahmad, A.; Wang, S.; Liu, Y. Why Did FDI Inflows of Pakistan Decline? From the Perspective of Terrorism, Energy Shortage, Financial Instability, and Political Instability. Emerg. Mark. Financ. Trade 2019, 55, 90–104. [Google Scholar] [CrossRef]
- Zheng, X.; Lu, Y.; Yuan, J.; Baninla, Y.; Zhang, S.; Stenseth, N.C.; Hessen, D.O.; Tian, H.; Obersteiner, M.; Chen, D. Drivers of change in China’s energy-related CO2 emissions. Proc. Natl. Acad. Sci. USA 2020, 117, 29–36. [Google Scholar] [CrossRef]
- Narayan, P.K.; Narayan, S. Carbon dioxide emissions and economic growth: Panel data evidence from developing countries. Energy Policy 2010, 38, 661–666. [Google Scholar] [CrossRef]
- Chimbo, B. Information and communication technology and electricity consumption in transitional economies. Int. J. Energy Econ. Policy 2020, 10, 296–302. [Google Scholar] [CrossRef]
- Kumar, N.; Kumar, R.R.; Kumar, R.; Stauvermann, P.J. Is the tourism–growth relationship asymmetric in the Cook Islands? Evidence from NARDL cointegration and causality tests. Tour. Econ. 2020, 26, 658–681. [Google Scholar] [CrossRef]
- Ha, N.M.; Ngoc, B.H. Revisiting the relationship between energy consumption and economic growth nexus in Vietnam: New evidence by asymmetric ARDL cointegration. Appl. Econ. Lett. 2020, 1–7. [Google Scholar] [CrossRef]
- Zafeiriou, E.; Mallidis, I.; Galanopoulos, K.; Arabatzis, G. Greenhouse gas emissions and economic performance in EU agriculture: An empirical study in a non-linear framework. Sustainability 2018, 10, 3837. [Google Scholar] [CrossRef]
- Dong, F.; Liu, Y. Policy evolution and effect evaluation of new-energy vehicle industry in China. Resour. Policy 2020, 67, 101655. [Google Scholar] [CrossRef]
- Petti, C.; Tang, Y.; Margherita, A. Technological innovation vs technological backwardness patterns in latecomer firms: An absorptive capacity perspective. J. Eng. Technol. Manag. 2019, 51, 10–20. [Google Scholar] [CrossRef]
- Schut, M.; Klerkx, L.; Sartas, M.; Lamers, D.; Campbell, M.M.C.; Ogbonna, I.; Kaushik, P.; Atta-Krah, K.; Leeuwis, C. Innovation platforms: Experiences with their institutional embedding in agricultural research for development. Exp. Agric. 2016, 52, 537–561. [Google Scholar] [CrossRef]
- Shin, Y.; Yu, B.; Greenwood-Nimmo, M. Modelling Asymmetric Cointegration and Dynamic Multipliers in a Nonlinear ARDL Framework. In Festschrift in Honor of Peter Schmidt; Springer: New York, NY, USA, 2014; pp. 281–314. [Google Scholar]
- Sima, V.; Gheorghe, I.G.; Subić, J.; Nancu, D. Influences of the industry 4.0 revolution on the human capital development and consumer behavior: A systematic review. Sustainability 2020, 12, 4035. [Google Scholar] [CrossRef]
- Calabrese, A.; Levialdi Ghiron, N.; Tiburzi, L. ‘Evolutions’ and ‘revolutions’ in manufacturers’ implementation of industry 4.0: A literature review, a multiple case study, and a conceptual framework. Prod. Plan. Control 2020, 1–15. [Google Scholar] [CrossRef]
- Oke, A.; Fernandes, F.A.P. Innovations in teaching and learning: Exploring the perceptions of the education sector on the 4th industrial revolution (4IR). J. Open Innov. Technol. Mark. Complex. 2020, 6, 31. [Google Scholar] [CrossRef]
- Bongomin, O.; Nganyi, E.O.; Abswaidi, M.R.; Hitiyise, E.; Tumusiime, G. Sustainable and Dynamic Competitiveness towards Technological Leadership of Industry 4.0: Implications for East African Community. PLoS ONE 2020, 15, e0239410. [Google Scholar] [CrossRef]
- Le, H.P.; Ozturk, I. The impacts of globalization, financial development, government expenditures, and institutional quality on CO2 emissions in the presence of environmental Kuznets curve. Environ. Sci. Pollut. Res. 2020, 27, 22680–22697. [Google Scholar] [CrossRef]
- Breusch, T.S.; Pagan, A.R. A Simple Test for Heteroscedasticity and Random Coefficient Variation. Econometrica 2006. [Google Scholar] [CrossRef]
Publisher’s Note: MDPI stays neutral with regard to jurisdictional claims in published maps and institutional affiliations. |
© 2020 by the authors. Licensee MDPI, Basel, Switzerland. This article is an open access article distributed under the terms and conditions of the Creative Commons Attribution (CC BY) license (http://creativecommons.org/licenses/by/4.0/).