1. Introduction
The Sustainable Development Goals (SDGs) adopted by the United Nations General Assembly in 2015, follow and expand on the Millennium Development Goals (MDGs). Incorporating social, economic, environmental and governance aspects of sustainable development, the SDGs have much broader scope than the MDGs, which focused only on social issues [
1,
2,
3]. This updated universal set of common global priorities integrates diverse issues such as addressing hunger, strengthening gender equality and switching towards clean energy. It is intended to guide policies in all UN member states until 2030.
The 2030 agenda stresses the presence of inter-linkages and interactions among the SDGs, and the importance of implementing them as one integrated, coherent and ‘indivisible’ framework [
4,
5]. The ‘indivisibility’ of the agenda suggests that there are dependencies among the goals, which collectively support a development scheme that covers all dimensions of sustainability [
6]. However, as countries move towards reaching some SDGs, they may simultaneously lose out on others. Importantly, action to further progress towards one goal may have unintended consequences on others if goals are pursued separately. Understanding the interactive nature of the SDG agenda is fundamental for ensuring that progress in one direction does not threaten progress in others [
7,
8].
While there is a common understanding of the indivisibility of the global SDG agenda, specific synergies and potential trade-offs between the various goals are still poorly understood. An important challenge remains how to empirically investigate the multidimensional set of 17 goals. With in total 230 indicators, progress towards reaching the SDGs and interactions between them are difficult to map.
In this paper, we aim to contribute to a better understanding of the trade-offs and synergies among the SDGs and present a novel approach to studying their interactive nature. We contribute to the burgeoning literature on SDG interactions by applying principal component analysis (PCA), a novel methodological approach in this context that allows us to efficiently summarise each goal and identify trends, synergies and trade-offs, while using the available data on indicators. Specifically, PCA permits us to analyse goal-level trends and interactions using the principal components for each SDG based on the full range of indicators available and reduce arbitrary decisions for how to simplify the goals’ multidimensional nature. Using data for all countries globally since 2000, our analysis captures synergies and trade-offs in three different dimensions: (1) across indicators within each SDG, (2) across all 17 SDGs and the SDG agenda, and (3) with respect to over time change across SDGs in the past 10 years.
Naturally, this approach is not without limitations. Among others, the analysis does not allow us to make any inferences about causal relationships that could indicate which of the goals should be prioritised in investments in specific countries. Careful context-specific analysis is needed to provide such evidence. However, our approach allows us to investigate whether the level of goal attainment tends to go together across the SDG. Overall, our results indicate that this is indeed the case. In particular, SDG 1–8 and 11, which mostly capture key features of socioeconomic development, correlate strongly and positively, pointing to synergies between reaching these goals. An important exception is SDG 10, ‘Reduced inequalities’, that correlates negatively with most other goals.
2. Existing Approaches to Measuring SDG Interactions
The United Nations member states have agreed on the SDG agenda as a set of common priorities that are by design interdependent. Yet, if pursuing goals in silos, countries may miss out on synergies and while focusing on some goals, they may even jeopardise progress on others [
7]. Understanding interactions is thus crucial for an effective implementation of the SDG agenda; and empirical research is needed for evidence-based policy integration across sectors and goals. Addressing these knowledge needs, scholarly research has started taking on the challenge to conceptualise and empirically assess how the SDGs interact (for a recent review, see [
9]). However, not only are there as many as 17 SDGs, but each is broken down into a total of 169 targets and 230 indicators. Given this complexity, the analysis of systemic properties and interactions of the multidimensional agenda remains a daunting task. (In what follows, we will use ‘SDG’ and ‘goal’ interchangeably to refer to the Sustainable Development Goals.)
Most earlier work has approached this challenge by limiting the analysis to a reduced set of goals or targets allowing for a more in-depth analysis, such as juxtaposing social and environmental SDGs [
10], or analysing how progress towards clean energy (SDG 7) will impact the delivery of the whole agenda [
11,
12]. As one of the first studies spanning a wider set of issues, Ref. [
13] focuses on the six SDGs that were selected for review at the 2017 High-Level Political Forum (goals 1, 2, 3, 5, 9 and 14). According to Nilsson, positive interactions significantly outweigh negative ones for these six goals. For SDG 5 on gender equality, no negative interactions were identified. In SDG 14 on sustainable oceans, however, there were some apparently significant negative interactions [
13]. Building on the work of [
7], the International Council for Science introduces a guide to SDG interactions [
2]. The guide presents a qualitative framework for characterising the range of positive and negative interactions between the various SDGs and testing this approach by applying it to an initial set of four SDGs: goals 2, 3, 5 and 14. This analysis suggests that these goals mostly display synergies with the other SDGs. The assessment outlines 316 target-level interactions overall, of which 238 are positive, 66 are negative, and 12 are neutral [
2,
14]. Similarly limiting the scope of their work, Ref. [
15] select 9 indicators representing different SDGs and explore how alternative policy pathways affect progress towards reaching these using integrated assessment models.
An alternative approach to the study of SDG interactions has been to limit the empirical scope to single countries or regions. Along these lines, Ref. [
16] include targets for all SDGs using Sweden as a test case. In line with earlier work, they find that targets are predominantly reinforcing each other. Targets within SDG 1–5, 8–10, 12, 14, and 16 all have neutral or positive influence on each other. Targets 7.2 (renewable energy), 13.2 (climate change policy and planning), and 17.11 (exports from developing countries) are the targets least consistent with the others [
16]. Similarly, Ref. [
17] focus an integrated simulation assessment of three SDGs (3, 4 and 7) in Tanzania by using one indicator for each goal.
The implementation and interactions of the SDGs are shaped by the local and regional context, such as resource endowments and income levels, which make country or regional analyses invaluable [
9]. Yet, only a global analysis can assess general relationships and the systemic properties of the SDG agenda. A handful recent studies indeed aim to capture the full set of interactions in the agenda at the global level [
8,
18,
19]. These ambitious empirical analyses aggregate indicator relationships to the goals by estimating the share of positively interacting indicators within a goal [
8,
18], alternatively using network analysis to infer goal- and target-level interactions [
19]. While indicator-focused studies are important steps forward, the 17 goals are at the core of the originally adopted agenda by the United Nations and individual indicators and data sources are still discussed and developed [
20,
21]. The analysis of goal-level interactions better captures the systemic characteristics of the agenda and facilitates communication of results. Moreover, there are numerous operationalization and measurement issues at the indicator level. In this paper, we apply PCA as a method to summarize the indicators that together constitute each goal. By doing so, we obtain a more robust measure of SDG attainment than in previous studies, based on all the information available at the indicator level, that allows a systematic analysis of interactions and trends at the level of goals. Below, we show that our results are broadly consistent with the results of the network analysis by [
19], despite the differences in approaches.
3. Material and Methods
Principal component analysis (PCA) has been applied to a wide range of issues across the natural and social sciences for a long time. For example, it has been used to compose indices measuring the sustainability of industries [
22], to examine the relationship of different measures of state fragility [
23] and in the study of genomes [
24]. The idea behind this statistical technique is to simplify high-dimensional data while retaining trends and patterns [
25,
26,
27].
If the SDGs are well-defined unitary goals, and the indicators capture them well, a PCA for each SDG is a good way to capture the essence of each goal. PCA reduces the correlated observed variables to a smaller and conceptually more coherent set of independent composite variables, while discarding as little information as possible [
27]. Using PCA for each goal enables us to map correlations between SDGs based on the full set of up-to-date available indicators. Even for homogenous SDGs, the use of multiple indicators for each of them reduces measurement error as the occasional inaccurate scores on one indicator are offset by more precise scores on others.
Specifically, PCA linearly transforms the data based on the indicators included so that a maximal proportion of the variance loads on the first principal component (PC), and then a maximal proportion of the remaining variance loads on the second etc. The derived variables—the principal components—are uncorrelated, normalised linear combinations of the original variables in the data and represent as much possible of the information in the original set of variables [
27]. PCA allows us to summarise each SDG by extracting one or several principal components based on the underlying indicators. At the same time, the analysis yields insights into whether each SDG, and the agenda as a whole, is unitary or subsumes a multitude of dimensions. If the original data capture several dimensions that are not correlated, they should also be more difficult to summarise in one single principal component.
Using the PC for each goal allows us to study for each country whether goal attainment tends to go together. While we cannot examine whether attainment on one goal causes a decrease or increase of attainment of other goals, strong pair-wise correlations are indicative of synergies and trade-offs. If two goals correlate positively attaining them at the same time is indeed likely. Positive correlations also point to potential synergies so that attaining one goal increases the chance the other on is reached. Conversely, negative correlations point to likely trade-offs (cf. [
8]).
Applying Principal Component Analysis to the SDGs
Before applying PCA, we compile indicators for each SDG, measured in levels for each country and year and fill in for missing values. Like other recent studies [
19], we use data from the section of the World Development Indicators (WDI) [
28] designed to monitor the Sustainable Development Goals (SDGs). The period 2000 to 2016 is the time scope of our study, with a country-year unit of analysis (see a list of available indicators for each goal in the
Appendix A.2). Work on the Global SDG Indicators Database is currently led by the United Nations Statistics Division (UNSD), and includes a list of official indicators on which general agreement has been reached. We rely on WDI data rather than the UNSD platform since it has fewer missing values. The principal component analysis requires complete data, and the multiple imputation procedure we use would not be reliable when a high share of observations are missing. The WDI data exhibits only few missing values, less than 10%. We expand on our imputation procedure in the
Appendix A.1.
Next, we follow an established procedure of conducting PCA [
27,
29]. We adapt the indicators to make sure that a one-unit increase for each indicator contributes to the achievement of the goal. This entails reversing the sign of some indicators relative to the original source. For example, we reverse the indicator of undernourishment—the more extensive undernourishment is, the lower the attainment of SDG 2. Reversing the sign does not change the correlation between indicators or affect the extracted component, but ensures that the correlation plots we produce have a straightforward interpretation. We then prepare the data for dimensionality reduction by ensuring that all features are on the same scale. To that end, we standardise all indicators by subtracting the mean and dividing by the standard deviation. PCA is always performed on a symmetric correlation matrix based on standardised data [
27,
30]. A feature value
x is standardized using the following formula:
where
is the mean of the feature column and
is the corresponding sample variance. This results in the features values having a mean of 0 and a standard deviation of 1, therefore having the same parameters as a normal distribution.
After standardising, we calculate the covariance matrix for the features in the dataset, which measures the degree to which two features covary with each other. The covariance between two feature vectors
and
is calculated using the following equation:
Now that the feature columns have been standardised and therefore each have a mean of zero, the covariance matrix
W is calculated by the following:
where
is the transpose of
X. In the next step, we choose the number of components to be extracted. To determine how many meaningful components should be retained for interpretation, we employ two widely-used criteria [
29]—the eigenvalue-one criterion [
31] and the scree test criterion [
32]. With the first approach, we retain any component with an eigenvalue greater than 1.00. The eigenvectors represent the principal components of the covariance matrix. The eigenvalues are their corresponding magnitude. The eigenvector that has the largest corresponding eigenvalue represents the amount of maximum variance, carried in each Principal Component. An eigenvector satisfies the following condition:
where
W is the covariance matrix,
v the eigenvector, and
the eigenvalue. Since each variable contributes one unit of variance to the total variance in the data set, any component with a value greater than 1.00 is expected to account for a greater amount of variance than one variable [
31]. With the scree test, we look for a big difference between the components with relatively large eigenvalues and those with small eigenvalues. The components that appear before the big drop in value are assumed to be meaningful [
32]. The scree test is recommended as a complementary criterion to the eigenvalue one as the first approach could at times be an arbitrary solution (e.g., when component 1 has an eigenvalue of 1.001, and component 2 has an eigenvalue of 0.998) [
29]. In some cases all eigenvalues will be above 1.00, but if the first one exhibits a much higher value (e.g., component 1 has an eigenvalue of 3.05 and component 2—an eigenvalue of 1.5), we retain only one component as it then accounts for a much larger amount of variance in the data set.
After extracting the necessary components per goal, we continue with the established PCA procedure and form a matrix of vectors, the feature vector [
27,
29]. The feature vector is simply a matrix that has as columns the eigenvectors of the components that we decide to keep to reduce dimensionality. In a final step, we use the feature vector to reorient the data from the original axes to the ones represented by the principal components. This is done by multiplying the transpose of the original data set by the transpose of the feature vector, which completes the PCA [
29,
30]. When interpreting component structure, including our results illustrated below, each of the indicators included is linearly related to each of the other indicators. The strength of this relationship is contained in the respective component loading. This loading can be interpreted as a standardised regression coefficient indicating the linear relationship of the two indicators.
4. Results
Table 1 shows the eigenvalues of the principal components (PC) for each SDG, indicating whether an SDG can be effectively summarised by one PC. The table also shows the trade-offs between indicators within each goal and within the whole agenda. (With ‘trade-offs’ we mean an indicator that is negatively correlated with the extracted principal component.) Based on the size of the eigenvalue, we note that one principal component is sufficient to adequately capture the dimensions of indicators within each goal. Specifically, for each SDG we find that one eigenvalue is much larger than the rest or that the largest eigenvalue is above 1. For SDGs with multiple indicators this is one indication that they indeed represent one common goal and do not subsume multiple uncorrelated dimensions.
Examining the eigenvalues of the PC allows us to make inferences about the dimensions of the goals, but not specific trade-offs. For examining trade-offs and synergies, we need to consider whether indicators negatively/positively correlate with the extracted PC of the SDG. Among all the eleven SDGs that are represented by more than two indicators, five do not have any trade-offs (‘No poverty’, ‘Clean water’, ‘Decent work and economic growth’, ‘Life below water’, and ‘Peace and strong institutions’). For the SDGs represented by only two indicators, both are positively correlated, indicating no clear within-goal trade-offs.
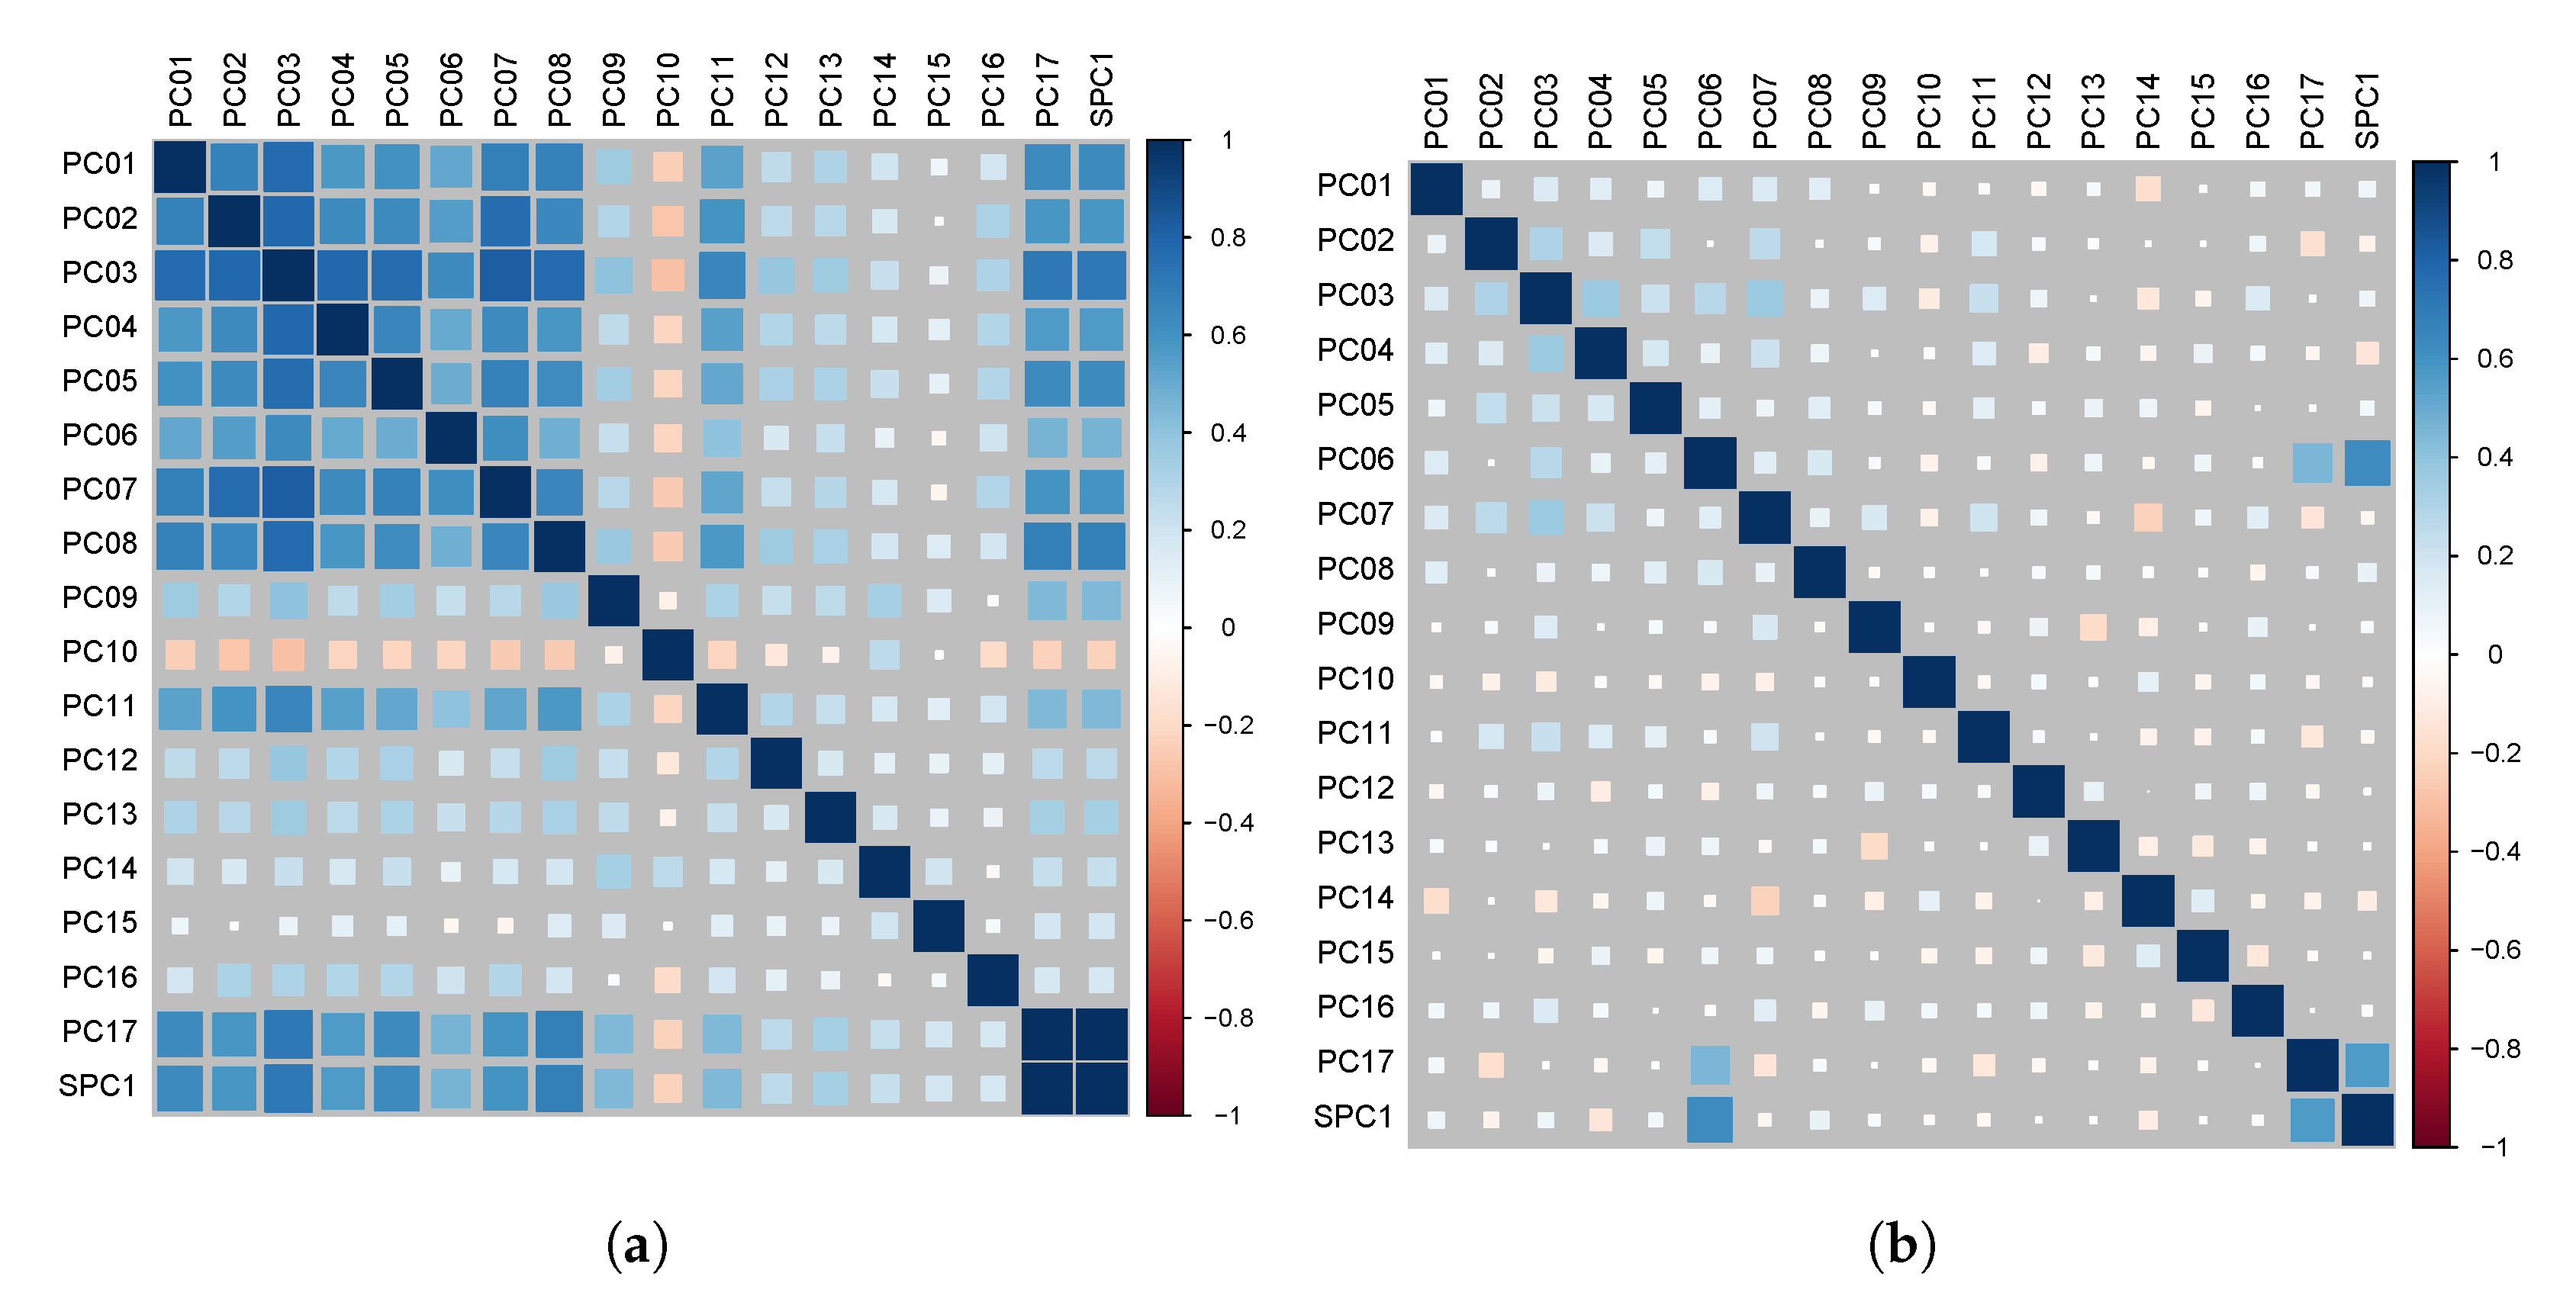
Finally, we explore the heterogeneity of the SDG agenda as a whole by conducting a PCA on the PCs extracted for each individual goal. This analysis suggests that the agenda can be effectively represented by only one super-principal component, SPC1. The 17 PCs can be reduced to one single component with an eigenvalue significantly higher than 1, indicating the unitary character of the agenda. Importantly, we also find few clear trade-offs. Specifically, only SDG 10 ‘Reduced inequalities’ is negatively correlated with SPC1. We return to between-SDG synergies below.
Following this brief overview of key results, we exemplify in detail the principal component analysis for SDG 2, 7 and 10. The PCA analysis for the other SDGs, summarised in
Table 1, are presented in detail in the
Appendix A.3. We have marked the description of the indicators we reverse relative to the original in red colour in the tables below the figures. The strength of the correlation is reflected by the colour and size of squares—darker and bigger squares represent stronger correlation. Blue colour indicates a positive correlation, red a negative correlation.
4.1. Illustrating the Principal-Component Analysis Using SDGs 2, 7 and 10
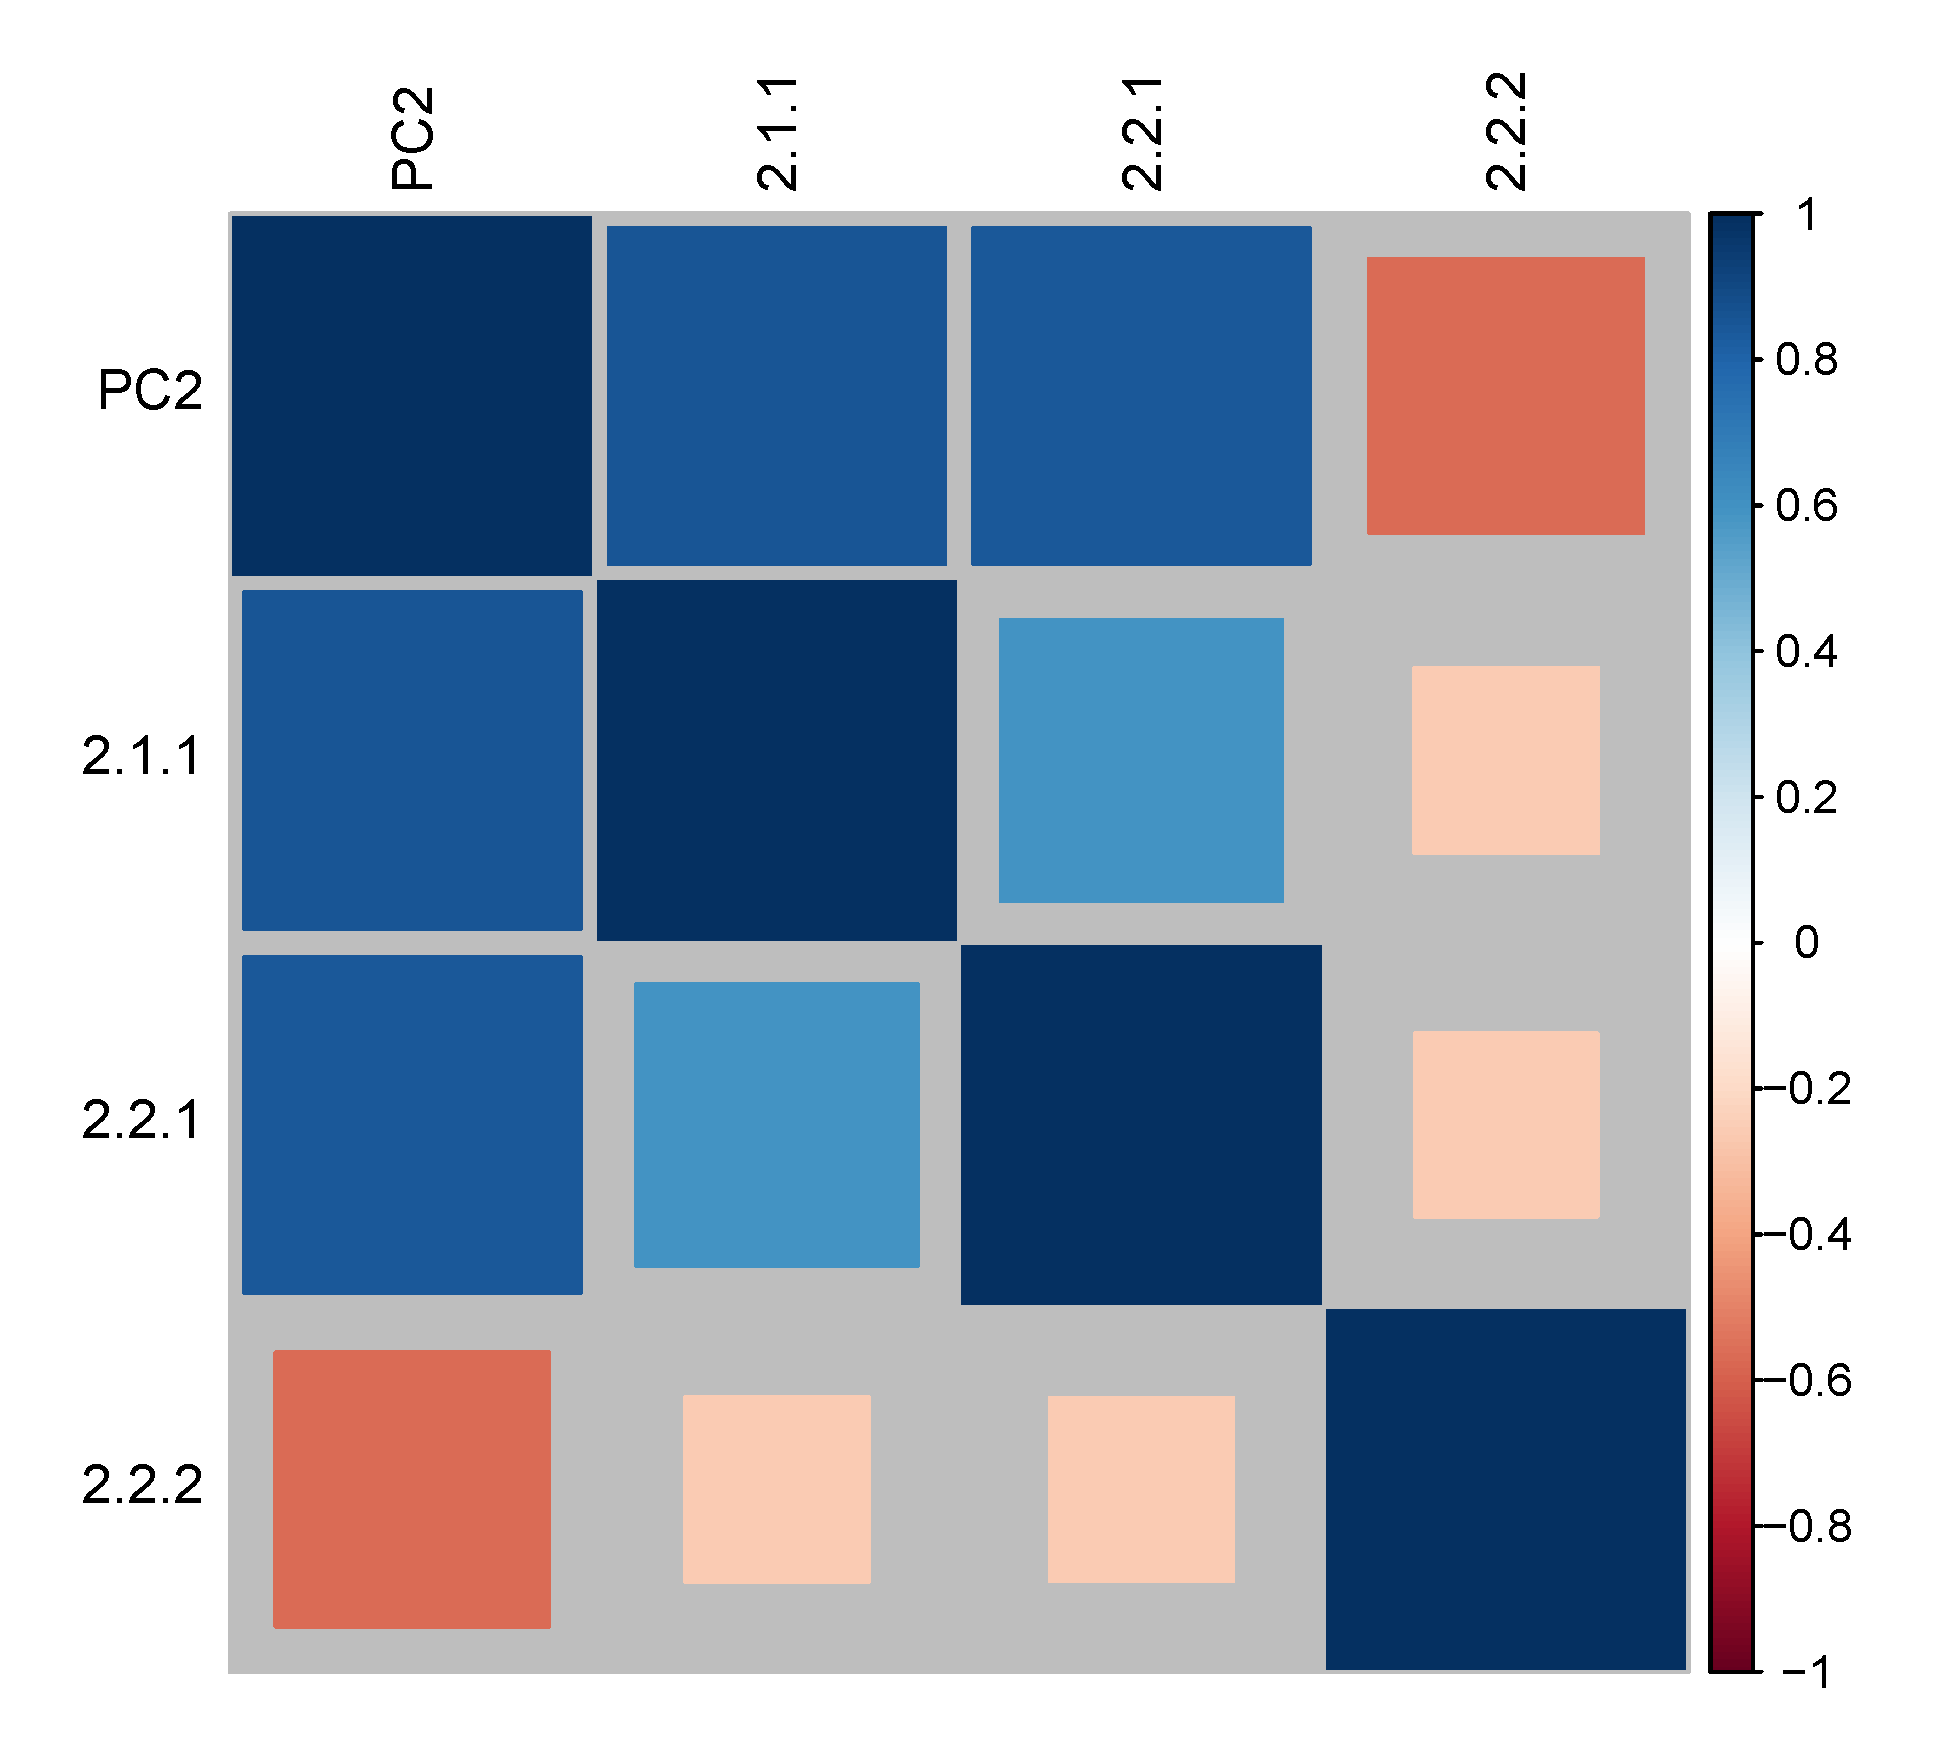
4.1.1. SDG 2: ‘Zero Hunger’
The ‘Zero hunger’ goal has a series of targets that support the interrelated components of the goal: ending hunger, achieving food security and improved nutrition, as well as promoting sustainable agriculture. The three available indicators designed to monitor these targets are listed in
Figure 1.
The eigenvalues in
Table 1 suggest extracting one PC. All the indicators are reversed relative to the original—the prevalence of undernourishment, stunting and malnutrition clearly represent the opposite of the goal, so we in reality measure the absence of the three. The high loadings of undernourishment and stunting on the PC suggest that it indeed represents well the goal of ‘Zero hunger’. Somewhat counter-intuitively, absence of malnutrition is negatively correlated with SDG2. This is most likely because indicator 2.2.2 combines information on wasting and on overweight. The latter form of malnutrition is more common in countries that have no hunger than in countries with severe undernourishment [
33]. Overweight seems to be more important than wasting for this indicator.
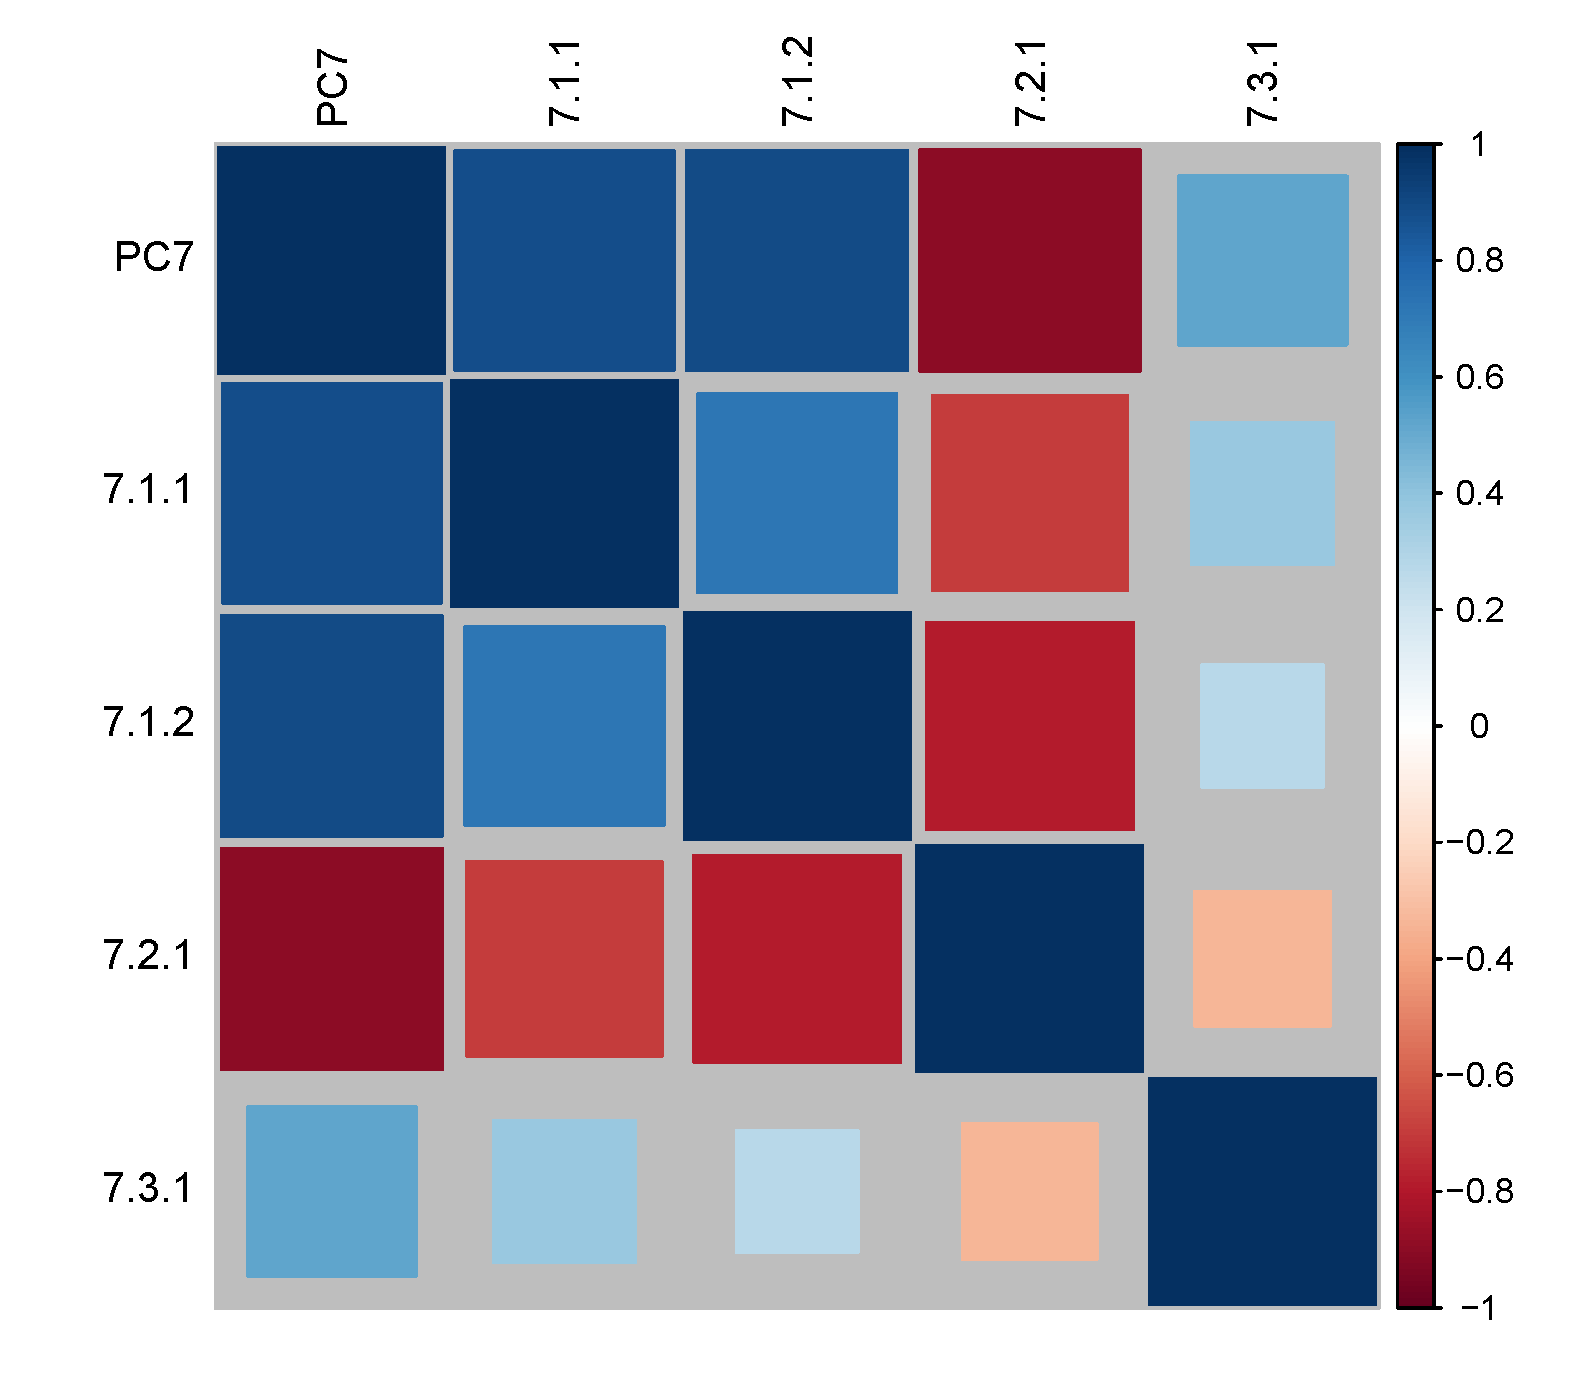
4.1.2. SDG 7: ‘Affordable and Clean Energy’
Access to affordable, reliable, sustainable and modern energy is the focus of SDG 7. It composes three targets: ensuring universal access to energy services (7.1), increasing the share of renewables in the energy mix (7.2), and improving energy efficiency (7.3). There are some positive and negative inter-linkages between the indicators. As seen in
Figure 2, the two access to energy indicators (7.1.1, 7.1.2) are positively correlated with the principal component we extract, as well as the energy intensity measure (7.3.1). The renewable energy share indicator (7.2.1), on the other hand, correlates negatively and strongly with the main component as well as the other indicators. Countries where a high proportion of the population has access to electricity have, on average, a low share of renewables in the energy mixture. This finding is in line with earlier research [
16].
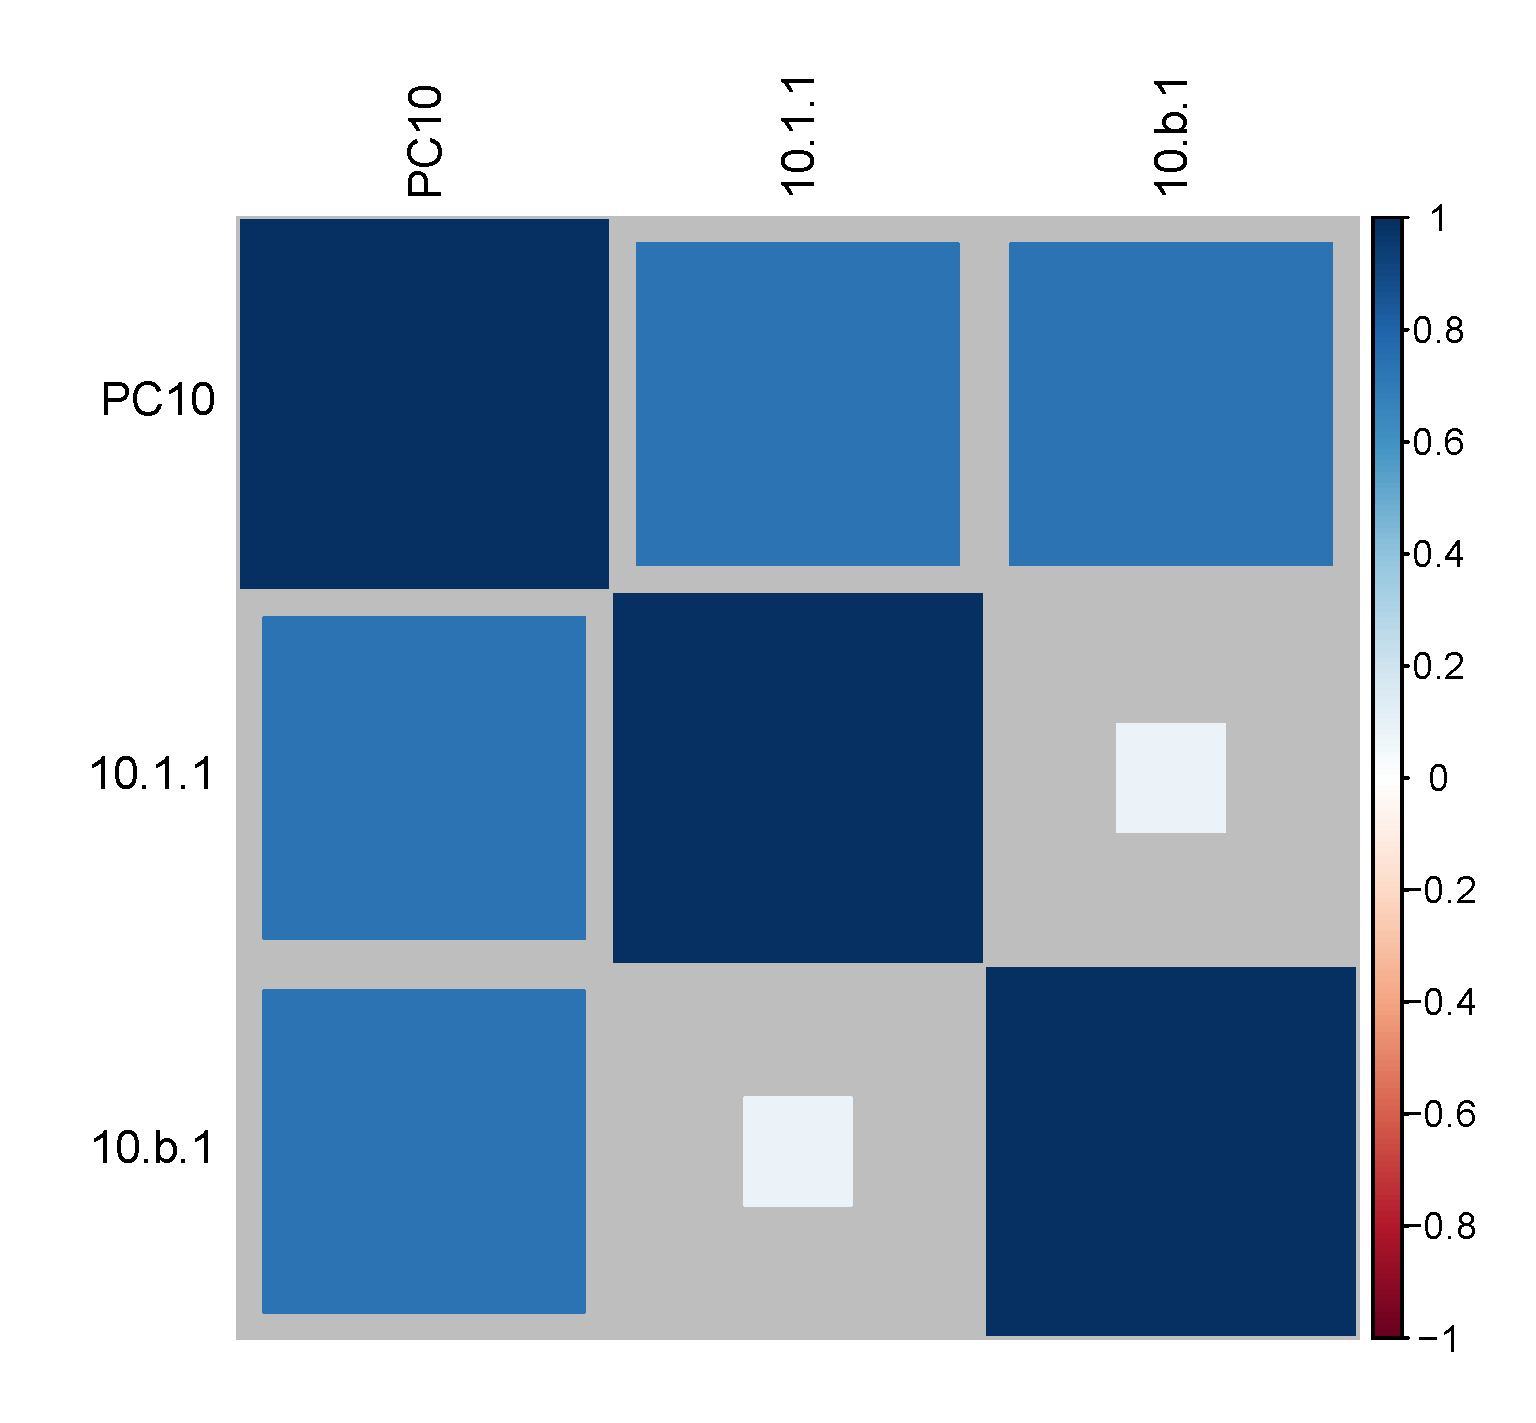
4.1.3. SDG 10: ‘Reduced Inequalities’
SDG 10 captures the aim to reduce inequalities within and among countries (
Figure 3). Only two indicators for SDG 10 are available, 10.1.1 concerning growth rates of household expenditure among the poorest share of the population and 10.b.1, development aid flows into the country. We extract one PC of these two weakly positively correlated indicators. While the underlying data are limited, with indicator 10.1.1 a measure for improvements for those worse off in society is included, which is arguably key to the reduction of within-country inequalities.
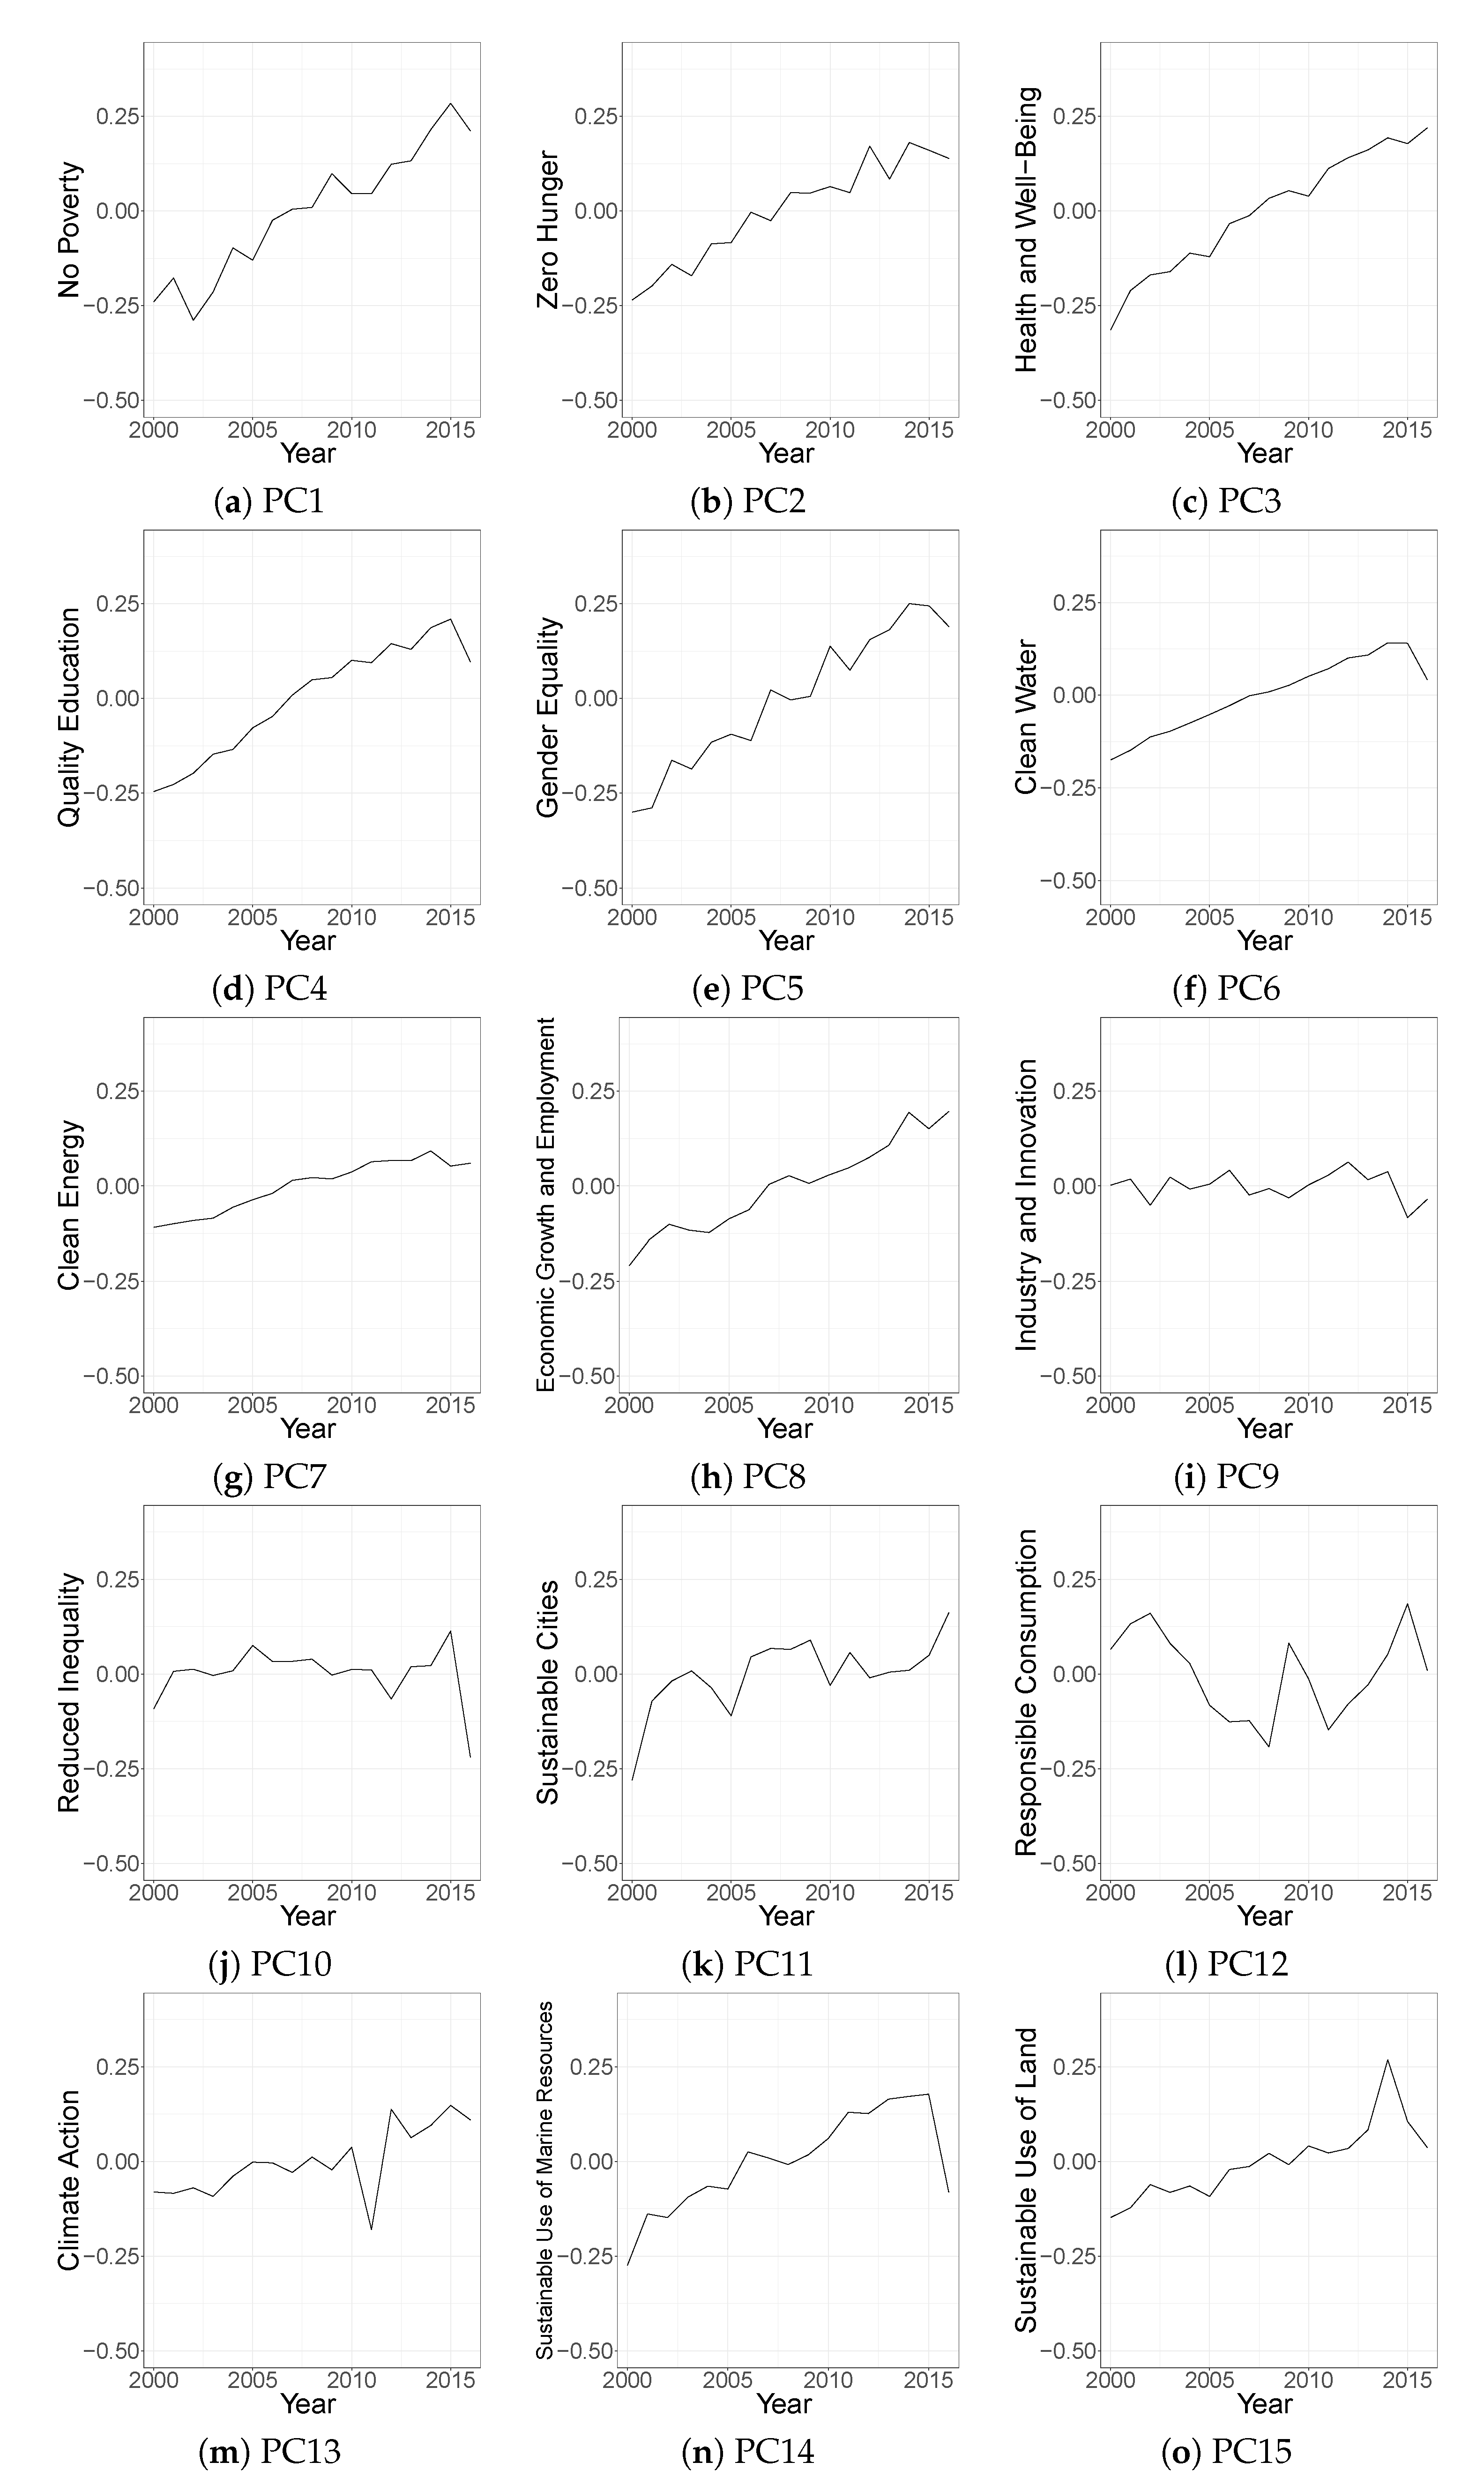
4.2. Global Change over Time in the SDG Components
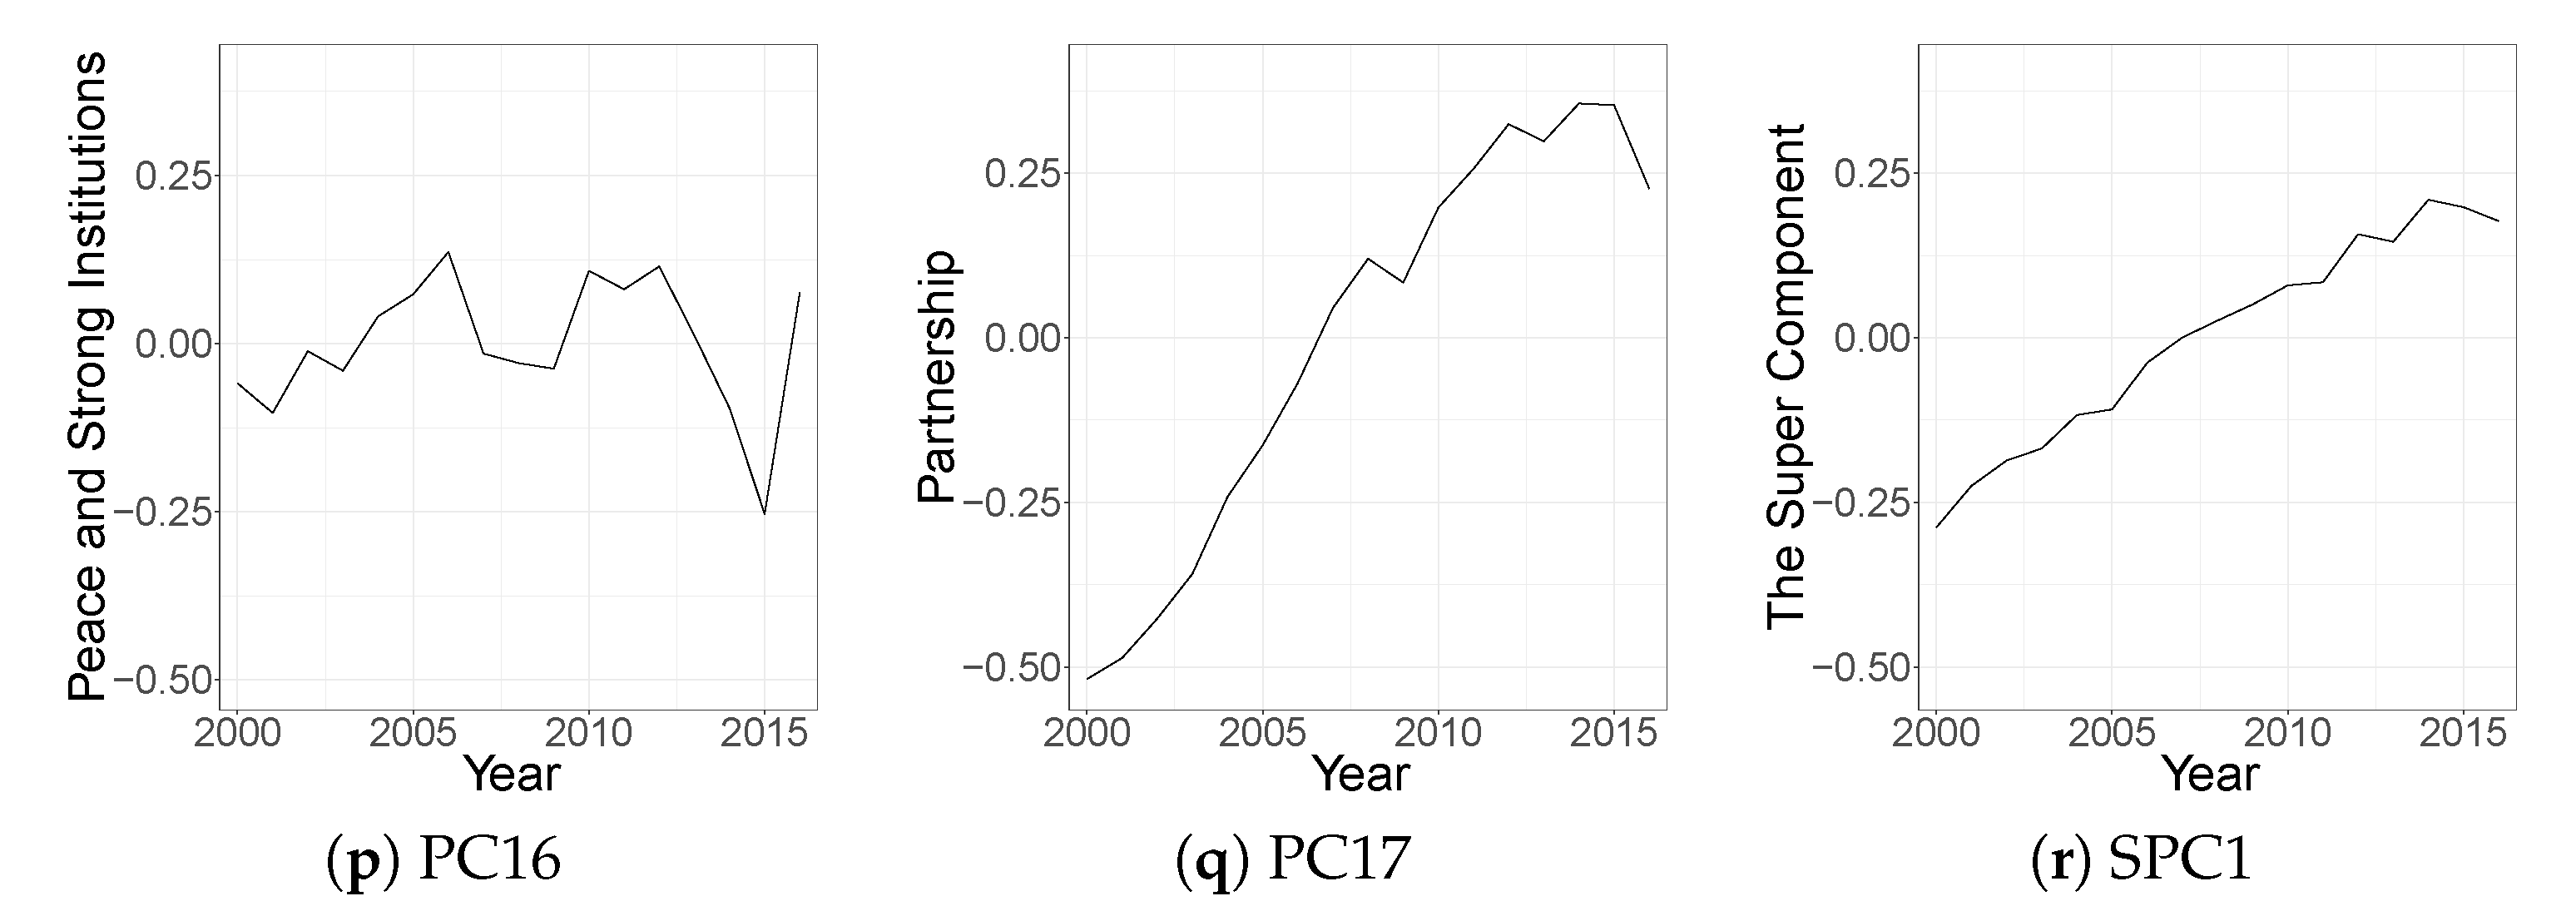
After summarising each SDG based on its indicators, we turn to examining trends in progress towards the SDGs using the extracted PCs. We refer to the components as PCs to distinguish them from the underlying SDGs, but use the same numbering as for the goals they represent.
Figure 4 shows the change in the global means for each extracted component from 2000 to 2016. All plotted principal components are standardised, varying from −0.5 to 0.4 on the
y axes.
Our analysis shows that the world has made considerable progress with respect to most of these indicators. Some exceptions exist, though: PC 9 (‘Industry, innovation, and infrastructure’), PC10 (‘Reduced inequalities’), PC12 (‘Responsible consumption’), and PC16 (‘Peace, justice, and strong institutions’) have not improved since the turn of the century. Also, it is notable that many PCs, including the super-component representing the overall agenda, show a dip in the final years covered. This suggests that continuous global progress cannot not be taken for granted. (It should be noted that the analysis shows trends in progress, but not the size of the gap to the attainment of the goal. The 2019 report on SDG achievement notes that, on average, countries score lowest on indicators related to achieving SDG 13 (‘Climate Action’), SDG 14 (‘Life Below Water’) and SDG 15 (Life on Land’) [
34].)
4.3. Correlations Across SDGs
We now turn to synergies and trade-offs between the 17 sustainable development goals.
Figure 5a shows how the components we have extracted to represent each SDG and the SPC1 correlate with each other. PCs 1–8, 11, 17 and the main super-component (SPC1) have consistently positive and strong correlations. Components 9, 12–14, and 16 are also positively correlated with this block, but less clearly than the others. PC10 representing ’Reduced inequalities’ is the only PC that clearly deviates from the others. This PC is positively correlated only with PC14–‘Life below water’—given the indicators we have.
Figure 5b shows the correlations in terms of change over the 2000–2016 period levels of goal achievements. Correlations in terms of change are much weaker than those in terms of level discussed above. The correlation pattern in terms of change seems somewhat different. Change in PC1–8, 11, 17 and the main super component (SPC1) are mostly positively correlated as we saw for levels—we will refer to this as the ‘health’ block. The health block PCs tend to move in the same direction as PC16 (‘Peace and inclusive societies’), but change in PC1 (‘No poverty’) is much less clearly linked to change in the health block than was the case for levels. Change in PC10 (‘Reduced inequalities’) is negatively correlated with change in the health block, similar to what we saw for levels.
This result could be capturing a global improvement in many socio-economic indicators, accompanied, though, by overall widening economic inequalities. Indeed, within-country income inequality has increased in all world regions in the last decade [
35]. Yet, it is also notable that SDG 14 ‘Life below water’ correlates negatively in terms of over time progress with other SDGs and in particular poverty (SDG 1) and energy-related goals (SDG 7). This result may partly reflect the environmental footprint of economic development (cf. [
10]). The strong synergies within the ’health block’—in particular between reductions in poverty, food security, education, economic development, but also gender equality—is well-documented elsewhere using different approaches and data [
36,
37]. Similarly, the links between this block and SDG 16 is consistent with the commonly acknowledged adverse impact of armed conflict on health and development outcomes [
38,
39].
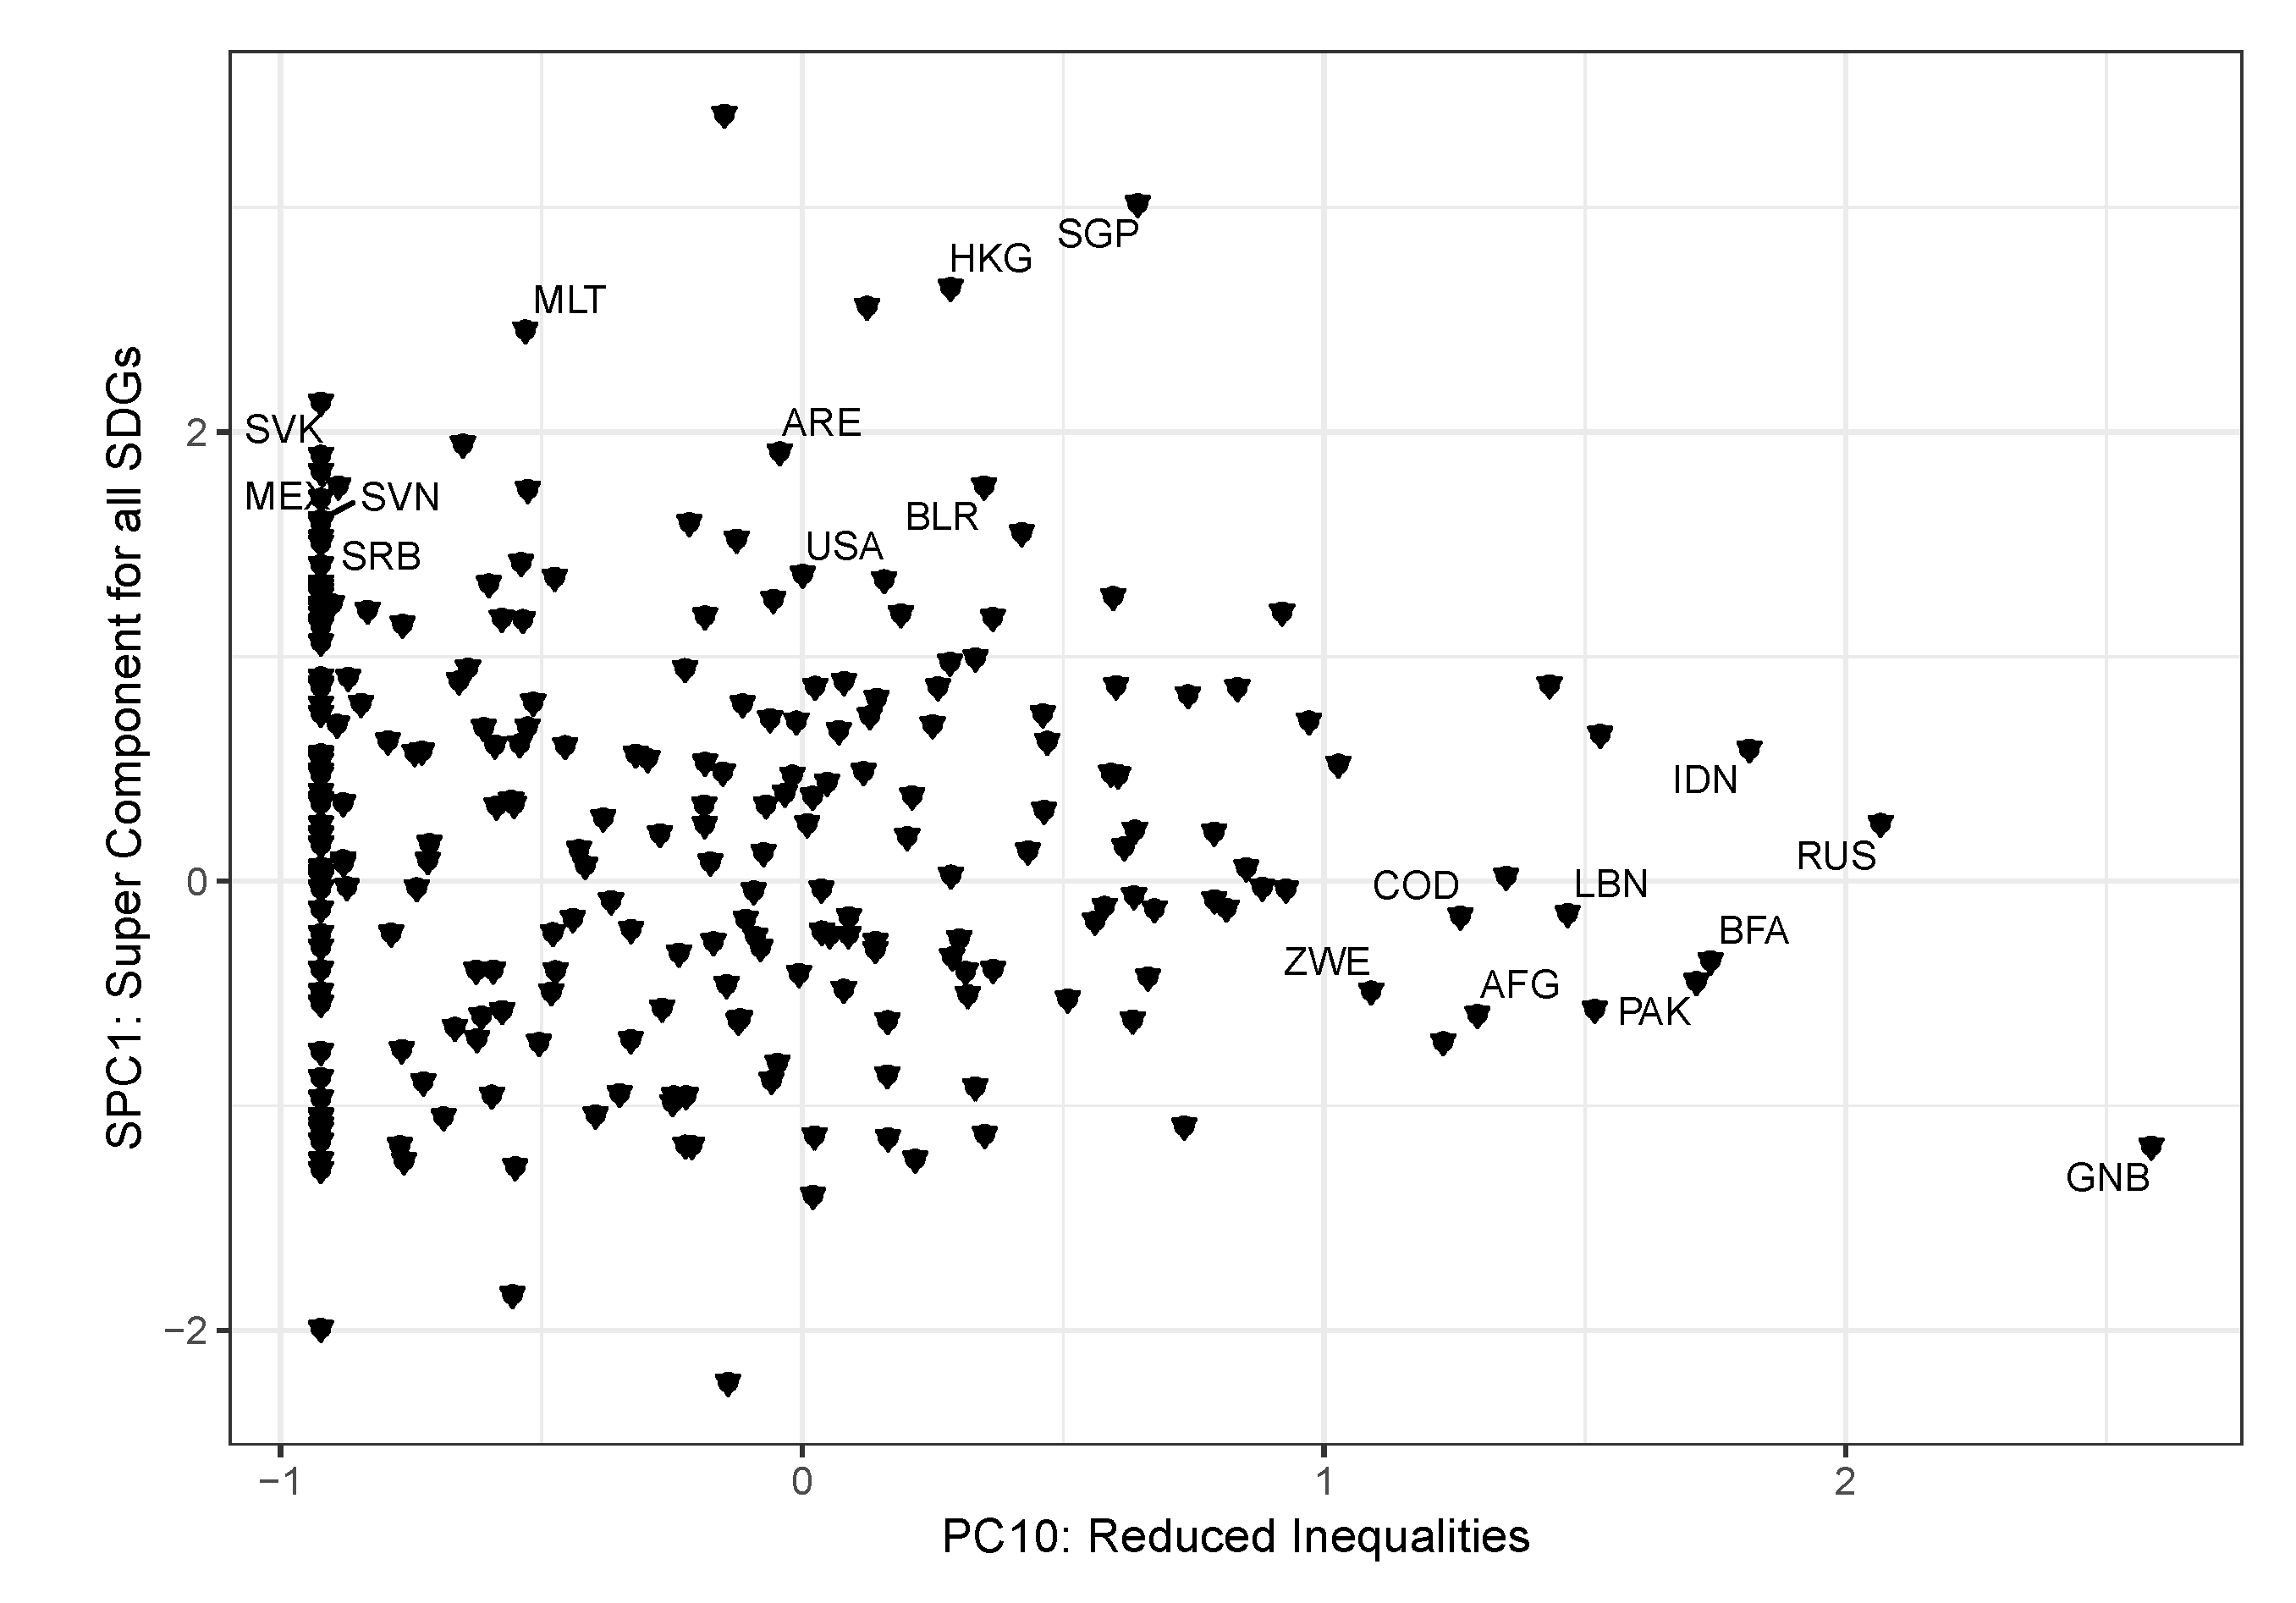
‘Reduced inequalities’ stood out in our analysis as a trade-off with the super-PC of the agenda and most goals. In
Figure 6, we plot PC10 against the super-component in levels in order to unpack variation across countries. We see that the negative correlation between the two extracted components is partly driven by countries such as Guinea-Bissau (GNB), Pakistan (PAK), and Zimbabwe (ZWE) which exhibit high scores on ‘Reducing inequalities’ but fare poorly in terms of the super-component capturing the overall agenda. Other countries score high on the super-component but have clearly not reduced inequalities—such as the Slovak republic (SVK), Mexico (MEX), and Serbia (SRB).
5. Discussion and Conclusions
Global empirical analyses of SDG interactions are crucial for an effective implementation of the 2030 agenda. In this paper, we have sought to advance the understanding of the interactive nature of the SDGs focusing on intra- and inter-goal interactions. SDG progress is measured through about 70 different indicators in total across the 17 goals. The large number of indicators is good for many reasons, but makes the interpretation of the measures challenging. As a novel approach to investigating SDG interactions, we used principal component analysis to reduce the multidimensional character of each goal, while taking into account the information contained in the full range of indicators. Specifically, we have extracted summary measures (principal components) for each goal, documented historical progress in goal attainment and mapped correlations between all goals based on these measures.
What conclusions can we draw on synergies and trade-offs? We observe that SDGs are largely compatible in the sense that for each country the level of attainment in one SDG tends to be correlated with the level of attainment in the SDG agenda as a whole. This is visible in the correlation between each goal and the super-component, but also in bivariate SDG correlations. In particular, components 1–8, 11 and 17 are predominantly strongly and positively correlated with each other. These consistent goals regard human development in the form of no poverty, zero hunger, good health, and education, but also include gender equality, sustainable cities and partnerships for the goals. In contrast, the PC for SDG 10 is negatively correlated with most of the other principal components. Overall, our findings suggest that most SDGs can be jointly reached.
This conclusion is consistent with [
19], who infer from a network analysis of SDG indicators that most SDGs are mutually reinforcing. Just as we do, they find a trade-off with respect to SDG 10 ‘Reduce inequalities’, which they find to be ‘antagonistic’ to the rest, at least for high-income countries. In addition, they conclude that SDG 12 ‘Responsible consumption’ and 13 ‘Climate action’ also work against the other goals for high-income countries. Our results for these two SDGs are much weaker. As we note in the
Appendix, however, the data available for these goals are very sparse.
It is less clear how our analysis relates to other global studies at indicator or target levels e.g., [
8,
18]. As we noted above, some indicators such as absence of malnutrition are operationalized in ways that sit uneasily with the overall goal of ‘Zero hunger’, despite their conceptual relevance. The simplification achieved using PCA helps us avoid over-emphasizing these indicators and associated targets. Such measurement issues may lay behind the conclusion in [
19] that the patterns at the target level do not scale up to the goal level.
We should note that the findings from our analysis as well as similar ones rest on the assumption that the available data on indicators are able to jointly capture important aspects of progress. Out of the around 230 indicators agreed on, still relatively few are available with good data coverage. Discussion on how to improve measurement of the SDGs are still ongoing [
20,
21]. If important trade-offs with regards to goal achievement are not captured due to weak coverage at the indicator level, the synergies we find may be artificially inflated. For example, it is clearly insufficient to measure SDG 13 (‘Climate action’) based exclusively on the available natural disaster-related indicators. This potential sensitivity of the analysis to missing data underlines the importance of systematic data collection for reliably monitoring progress towards reaching the SDG. As more and more indicators become available and the SDG agenda dimensions expand using PCA will become an even more valid, but also an even more relevant, approach for capturing goal level trends and interactions.
What do these results mean for the prospect to reaching the 2030 agenda? It is important to consider that our analysis on interactions and trends rely on historical data. The Corona pandemic hitting the world unprepared in 2020 resulted in a setback on several goals and may jeopardise the continuation of the progress in sustainable development documented in this article and elsewhere [
40]. These caveats notwithstanding, we believe that our analysis documenting the prevailing compatibility of goals gives reason to be optimistic about the world’s ability to simultaneously reach a considerable number of the 17 sustainable development goals.
Looking forward, there are a number of possible avenues for further research. First, while we are using a global scope matching the global ambition of the agenda, our analysis conceals heterogeneity between countries that is relevant to account for when developing specific policies. Studying progress and causal relationships in select regions with a more similar baseline level of development would be valuable for informing context-sensitive strategies to achieve the SDGs, see e.g., [
16,
41]. Further research is also needed to understand the impact of different forms of interventions and policies targeting one goal specifically, such as development investments in specific sectors and peacekeeping missions, across a wider set of SDGs, see e.g., [
42,
43]. Last but not least, countries do not develop in isolation. A fruitful next step would be to investigate spillovers of positive trends in SDG attainment—but also backlashes, such as the outbreak of war—across borders. The measurement and analytical approach that we develop in this study could help implementing such analysis at the level of goals.
Author Contributions
Authors are listed in alphabetical order, equal authorship applies. Conceptualization, methodology, software, validation, original draft preparation, and review and editing, H.H., K.P., and N.v.U.; formal analysis, investigation, data curation, and visualization, K.P.; supervision, project administration and funding acquisition, H.H. and N.v.U. All authors have read and agreed to the published version of the manuscript.
Funding
The research was funded by the Mistra Geopolitics program and the European Research Council, project H2020-ERC-2015-AdG 694640 (ViEWS;
http://views.pcr.uu.se), and the Research Council of Norway grant no. 268135. The imputed variables were computed on resources provided by the Swedish National Infrastructure for Computing (SNIC) at Uppsala Multidisciplinary Center for Advanced Computational Science (UPPMAX).
Acknowledgments
The authors would like to thank Henrik Carlsen, Karl Hallding, Måns Nilsson and Kristian Skånberg for comments, and Frederick Hoyles for programming assistance.
Conflicts of Interest
The authors declare no conflict of interest.
Abbreviations
The following abbreviations are used in this manuscript:
| SDG | Sustainable Development Goal[s] |
| PCA | Principal Component Analysis |
| PC | Principal Component |
Appendix A. Electronic Supplementary Material: Synergies and Trade-Offs in Reaching the Sustainable Development Goals
Appendix A.1. Imputation of Missing Data
The data on SDG indicators from the World Development Indicators used in this study have around 10 percent missing data on available indicators. As the Principal component analysis (PCA) we employ requires complete data we employ multiple imputations (MI) to fill in missing data.
MI involves replacing each missing cell with multiple values based on information in the observed portion of the full dataset, in this case all available data on SDG indicators [
44]. The procedure involves three stages. First,
x number of values are imputed for each cell, varying across values in order to reflect uncertainty about the correct imputation model. Imputed values constitute independent draws from a posterior distribution of the missing data conditional on the observed data. In the second stage, each of the
x number of complete datasets are analysed and quantities of interest are estimated. Finally, the
x number of separate point estimates are combined into one using the so-called ‘Rubin combination rules’ [
45]. The rules entail that the pooled point estimate is the same as the average of the
xnumber of separate estimates. According to [
44], MI also reflects uncertainty about imputed values and thus yields valid estimates of standard errors, preserving key features of the existing data.
We use the Amelia II package in R, which performs multiple imputations and generates 10 datasets to reduce the uncertainty associated with filling in missing values with artificial data points [
46]. We combine these multiple datasets by averaging across imputed values per indicator and compile one ‘complete’ panel dataset.
Data coverage is much better for the past five years than for preceding decades, but generally indicators are measured well back to 2000. After compiling one data set, missing values for each available indicator are imputed for the period of 2000–2016 and separately for the period of 2012–2016 (with higher data coverage for all identified indicators). The purpose of this exercise is to compare the results from the two imputation procedures and ensure that imputing missing values for an extended period of time do not yield misleading results. Since the two imputed data sets return similar results, we use the period of 2000 to 2016 as a time scope of our study. We then proceed with the principal component analysis.
Appendix A.2. List of Available Indicators
Table A1.
Overview of available indicators from the World Development Indicators data set included in the analysis.
Table A1.
Overview of available indicators from the World Development Indicators data set included in the analysis.
| SDG | Available Indicators |
|---|
| Goal 1 | 1.1.1, 1.2.1, 1.3.1 |
| Goal 2 | 2.1.1, 2.2.1, 2.2.2 |
| Goal 3 | 3.1.1, 3.1.2, 3.2.1, 3.2.2, 3.3.1, 3.3.2, 3.3.3, 3.3.4, 3.4.2, 3.5.2, 3.6.1, 3.7.1, 3.7.2, 3.c.1, 3.a.1 |
| Goal 4 | 4.5.1, 4.6.1 |
| Goal 5 | 5.2.2, 5.3.1, 5.3.2, 5.5.1, 5.5.2, 5.b.1 |
| Goal 6 | 6.1.1, 6.2.1, 6.4.2 |
| Goal 7 | 7.1.1, 7.1.2, 7.2.1, 7.3.1 |
| Goal 8 | 8.1.1, 8.2.1, 8.3.1, 8.5.2, 8.6.1, 8.7.1, 8.10.1, 8.10.2 |
| Goal 9 | 9.2.1, 9.4.1, 9.5.1, 9.5.2 |
| Goal 10 | 10.1.1, 10.b.1 |
| Goal 11 | 11.1.1, 11.6.2 |
| Goal 12 | 12.2.2 |
| Goal 13 | 13.1.3 |
| Goal 14 | 14.4.1, 14.5.1 |
| Goal 15 | 15.1.1, 15.1.2 |
| Goal 16 | 16.1.1, 16.1.2, 16.9.1 |
| Goal 17 | 17.2.1, 17.3.1, 17.3.2, 17.4.1, 17.8.1, 17.10.1, 17.11.1, 17.19.1 |
Appendix A.3. PCA and Correlation Plots for SDG 1, 3–6, 7–9, 11–17
Appendix A.3.1. SDG 1: ‘No Poverty’
Sustainable development goal 1—ending poverty in all its forms everywhere—entails attention to both completely eliminating extreme poverty while also considering other key socio-economic, political and environmental dimensions (
Figure A1). Successful elimination of extreme poverty requires both the provision of basic income and social protection to eliminate extreme poverty, and effective processes of wealth distribution, employment and insurance [
6].
Figure A1.
SDG 1: No Poverty. Indicators: PC1—‘No Poverty’—Principal Component for SDG 1; 1.1.1—Poverty headcount ratio at $1.90 a day (2011 PPP) (% of population) (reversed); 1.2.1—Poverty headcount ratio at national poverty lines (% of population) (reversed); 1.3.1—Coverage of social insurance programs (% of population).
Correlations between indicators for SDG 1 are shown in plot form in
Figure A1. Blue colour indicates positive correlation, red negative correlation, whereas the strength of the correlation is reflected by the colour and size of squares—darker and bigger squares represent stronger correlation. Under the plot we list the three indicators available for SDG and the principal component we extracted. The eigenvalues shown in
Table 1 suggest that one component is sufficient to capture the essence in the SDG1 indicators. The two first indicators are reversed relative to the original (we have retained the original variable label but marked it red): low poverty headcounts are consistent with the goal. The indicator ‘coverage of social insurance programs’ has the right sign in original form. All three are positively correlated with the goal of ‘no poverty’—none of the indicators representing the goal indicate any trade-offs.
Figure A2.
SDG 3: Good health and well-being. Indicators: PC3—‘Good health and well-being’ component for SDG 3; 3.1.1—Maternal mortality ratio (modelled estimate, per 100,000 live births) (reversed); 3.1.2—Births attended by skilled health staff (% of total); 3.2.1—Mortality rate, under-5 (per 1000 live births) (reversed); 3.2.2—Mortality rate, neonatal (per 1000 live births) (reversed); 3.3.1—Number of new HIV infections per 1,000 uninfected population (reversed); 3.3.2—Tuberculosis incidence per 100,000 population (reversed); 3.3.3—Malaria incidence per 1000 population (reversed); 3.3.4—Hepatitis B incidence per 100,000 population (reversed); 3.4.2—Suicide mortality rate (reversed); 3.5.2—Harmful use of alcohol, defined according to the national context as alcohol per capita consumption (aged 15 years and older) (reversed); 3.6.1—Death rate due to road traffic injuries (reversed); 3.7.1—Proportion of women of reproductive age (aged 15–49 years) who have their need for family planning satisfied with modern methods; 3.7.2—Adolescent fertility rate (births per 1000 women ages 15–19) (reversed); 3.a.1—Smoking prevalence(% of adults) (reversed); 3.c.1—Health worker density and distribution.

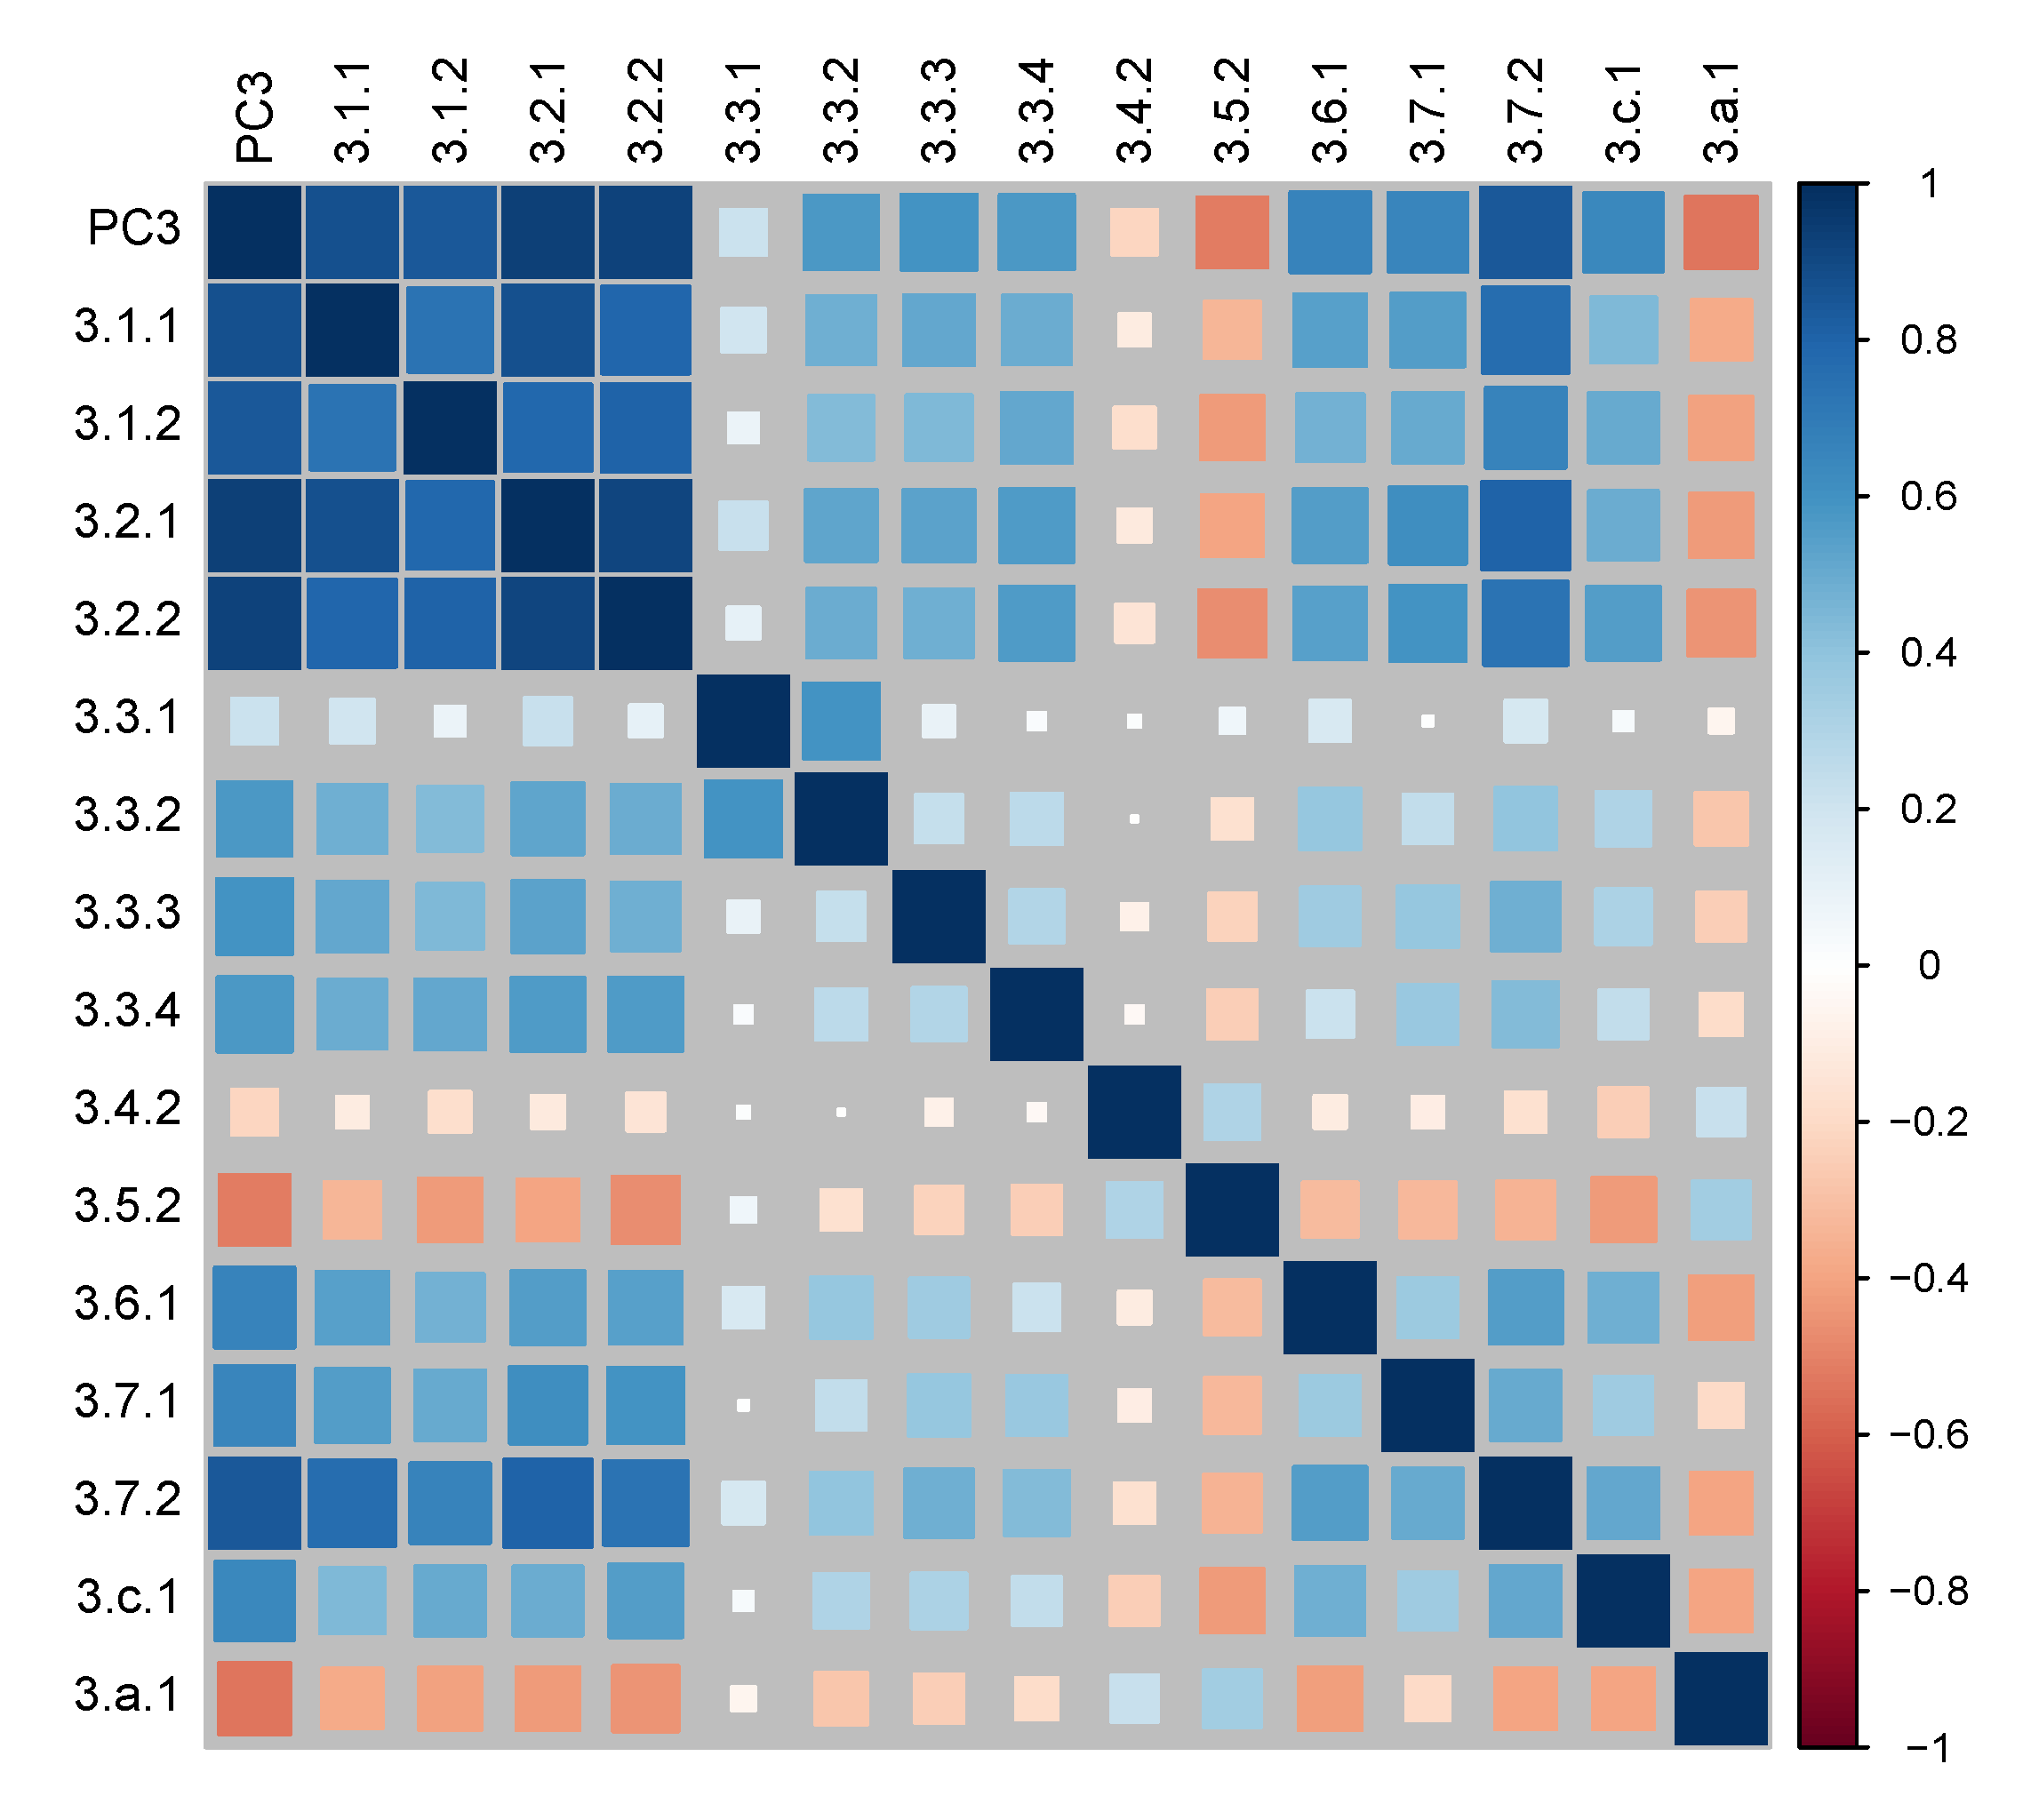
Appendix A.3.2. SDG 3: ‘Good Health and Well-Being’
SDG 3 captures the aim to promote well-being, i.e., reducing global maternal mortality ratio, preventing deaths of newly born and children, ending epidemics, strengthening the prevention and treatment of substance abuses, and ensuring universal health care coverage [
40]. After extracting one principal component (see
Table 1 in the main manuscript), we obtain a correlation matrix of all indicators and PC3 plotted in
Figure A2. The indicators that are most strongly and positively correlated with the principal component of good health and therefore capture the concept best include indicators 3.1.1, 3.1.2, 3.2.1, 3.2.2 and 3.7.2—low child and maternal mortality rates as well as low fertility rates. On the other hand, harmful use of alcohol (3.5.2) and prevalence of smoking (3.a.1) appear to be negatively correlated with PC3—these health-degrading habits typically increase as populations increase their purchasing power [
47,
48].
Appendix A.3.3. SDG 4: ‘Quality Education’
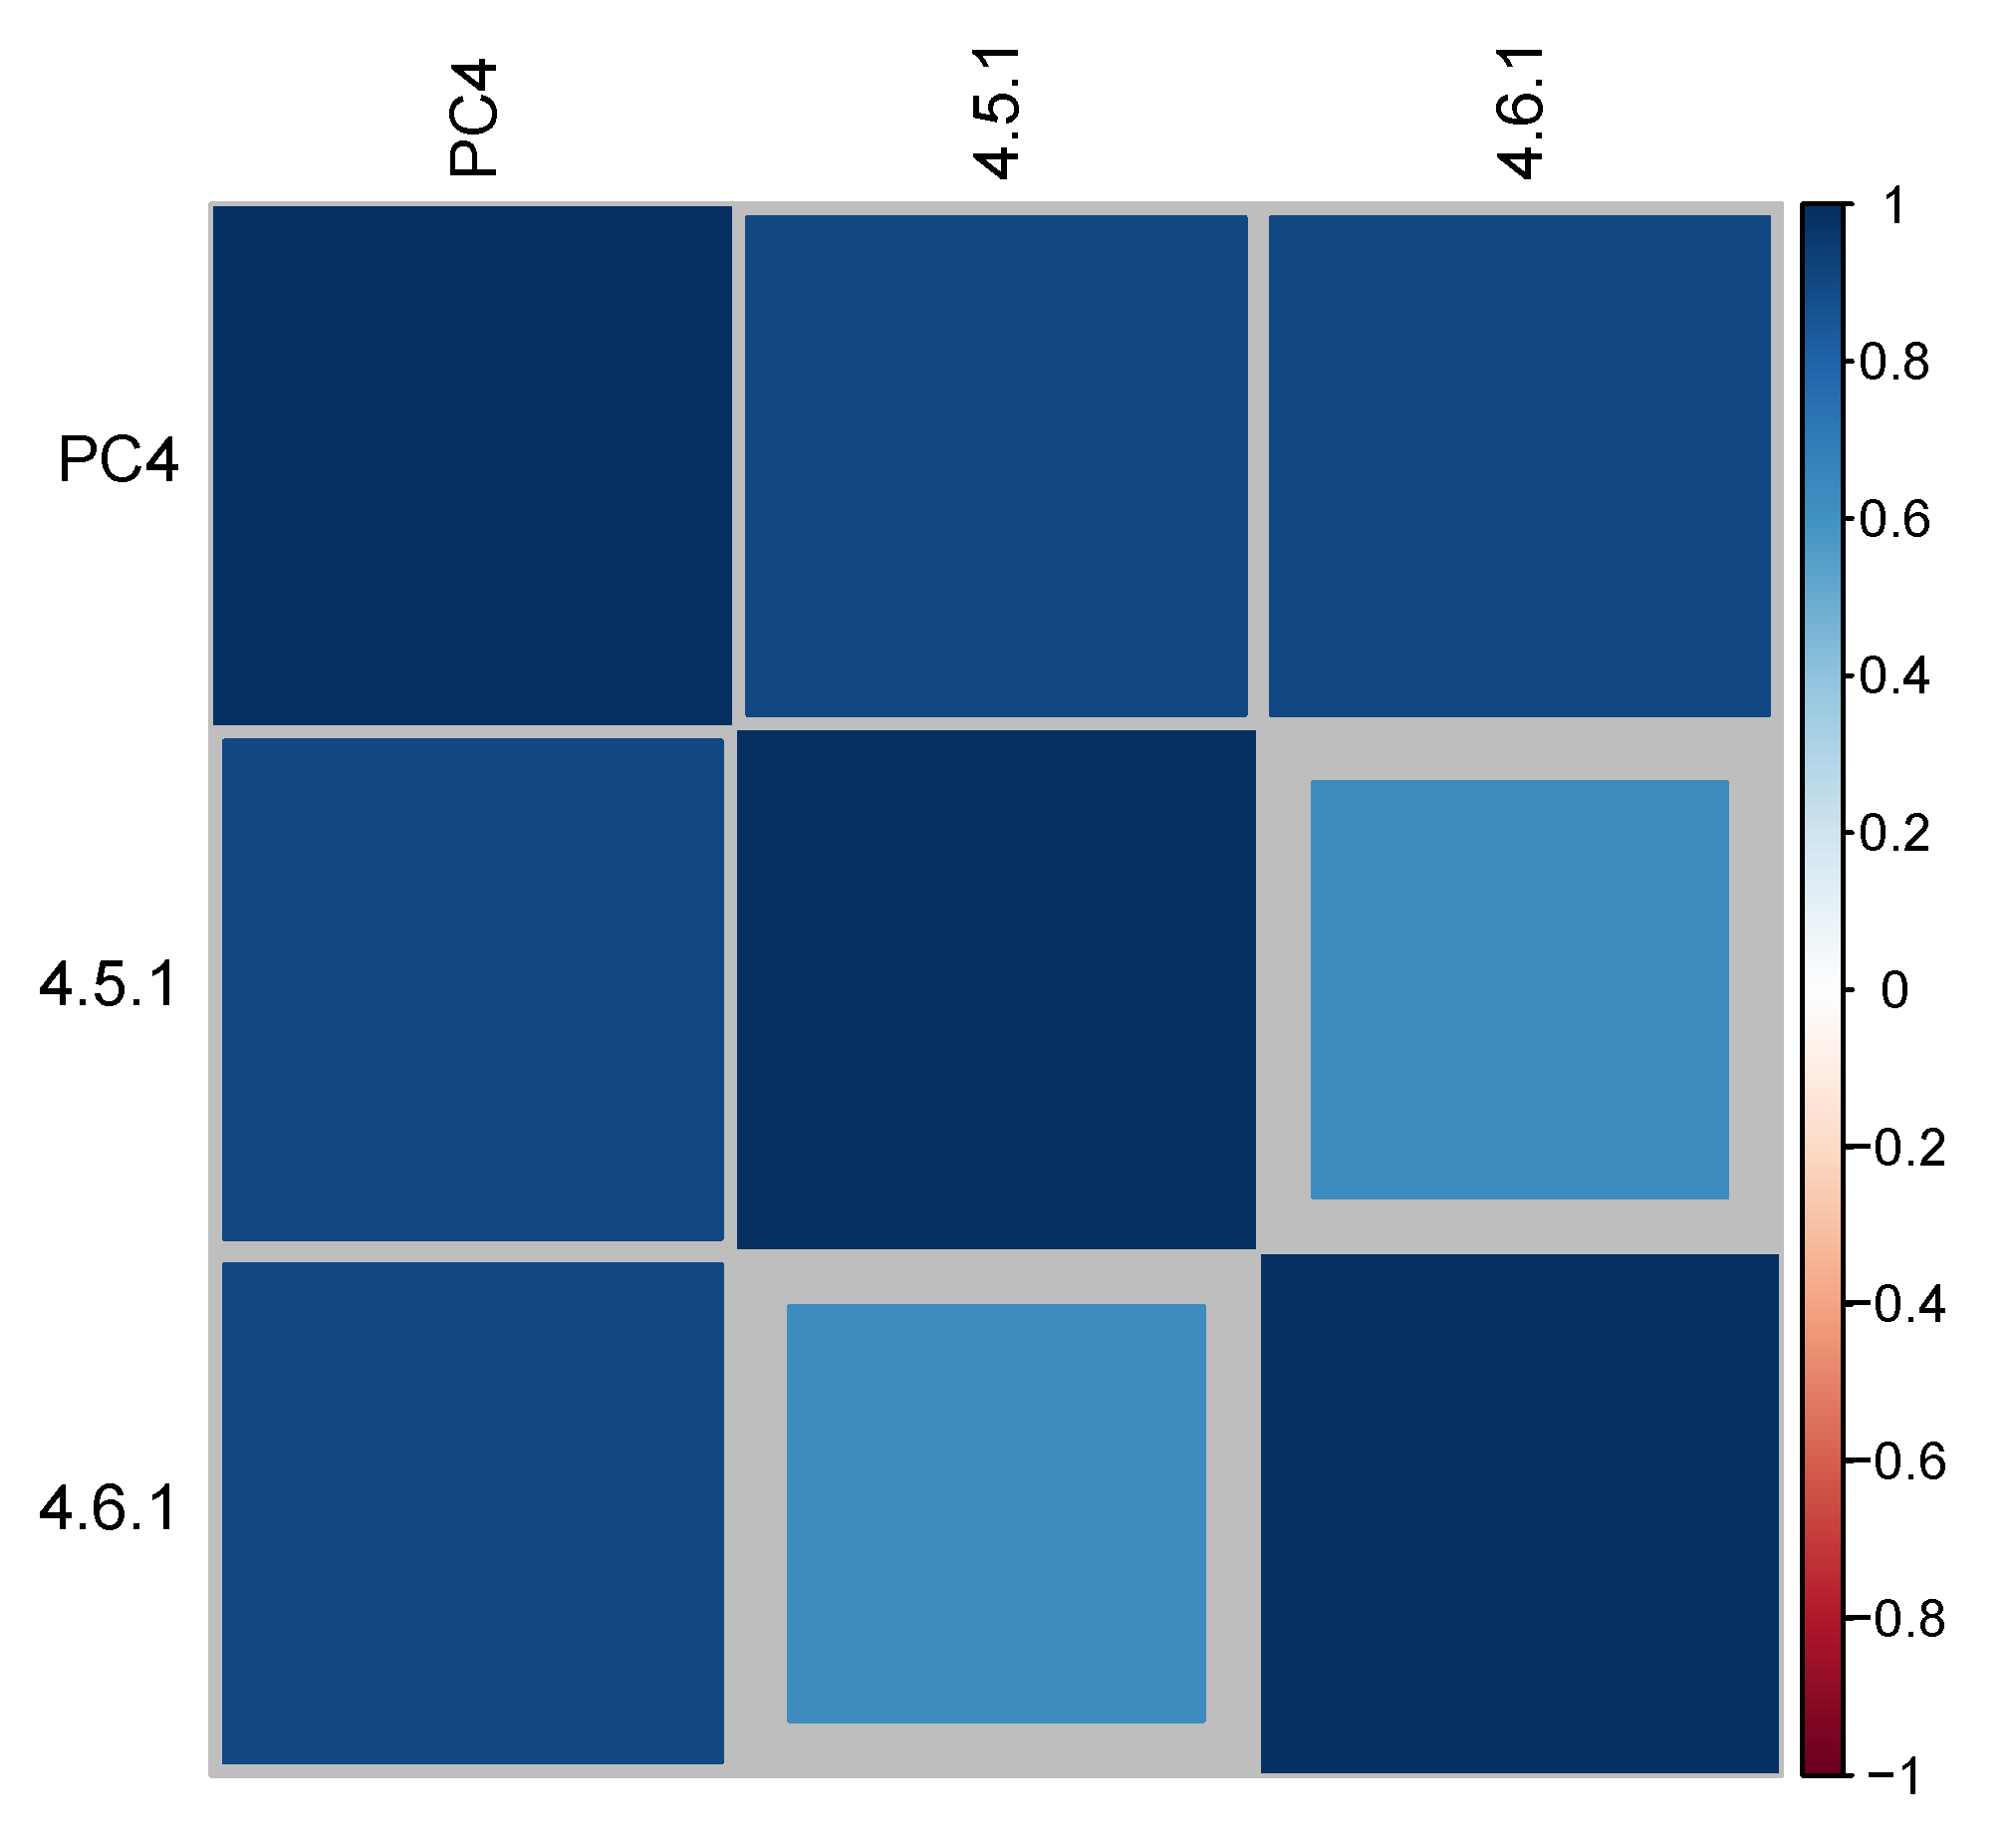
The ’Quality education’ goal has the purpose of ensuring inclusive and equitable quality education and promoting learning opportunities. The WDI has only two available indicators, capturing achieved literacy and numeracy as well as various parity indices for education. These two are positively correlated and yield a clear single PC.
Figure A3.
SDG 4: Quality Education. Indicators: PC4—‘Quality Education’ component for SDG 4; 4.5.1—Parity indices (female/male, rural/urban, bottom/top wealth quintile and others such as disability status, indigenous peoples and conflict-affected, as data become available) for all education indicators on this list that can be disaggregated; 4.6.1—Proportion of population in a given age group achieving at least a fixed level of proficiency in functional (a) literacy and (b) numeracy skills.
Appendix A.3.4. SDG 5: ‘Gender Equality’
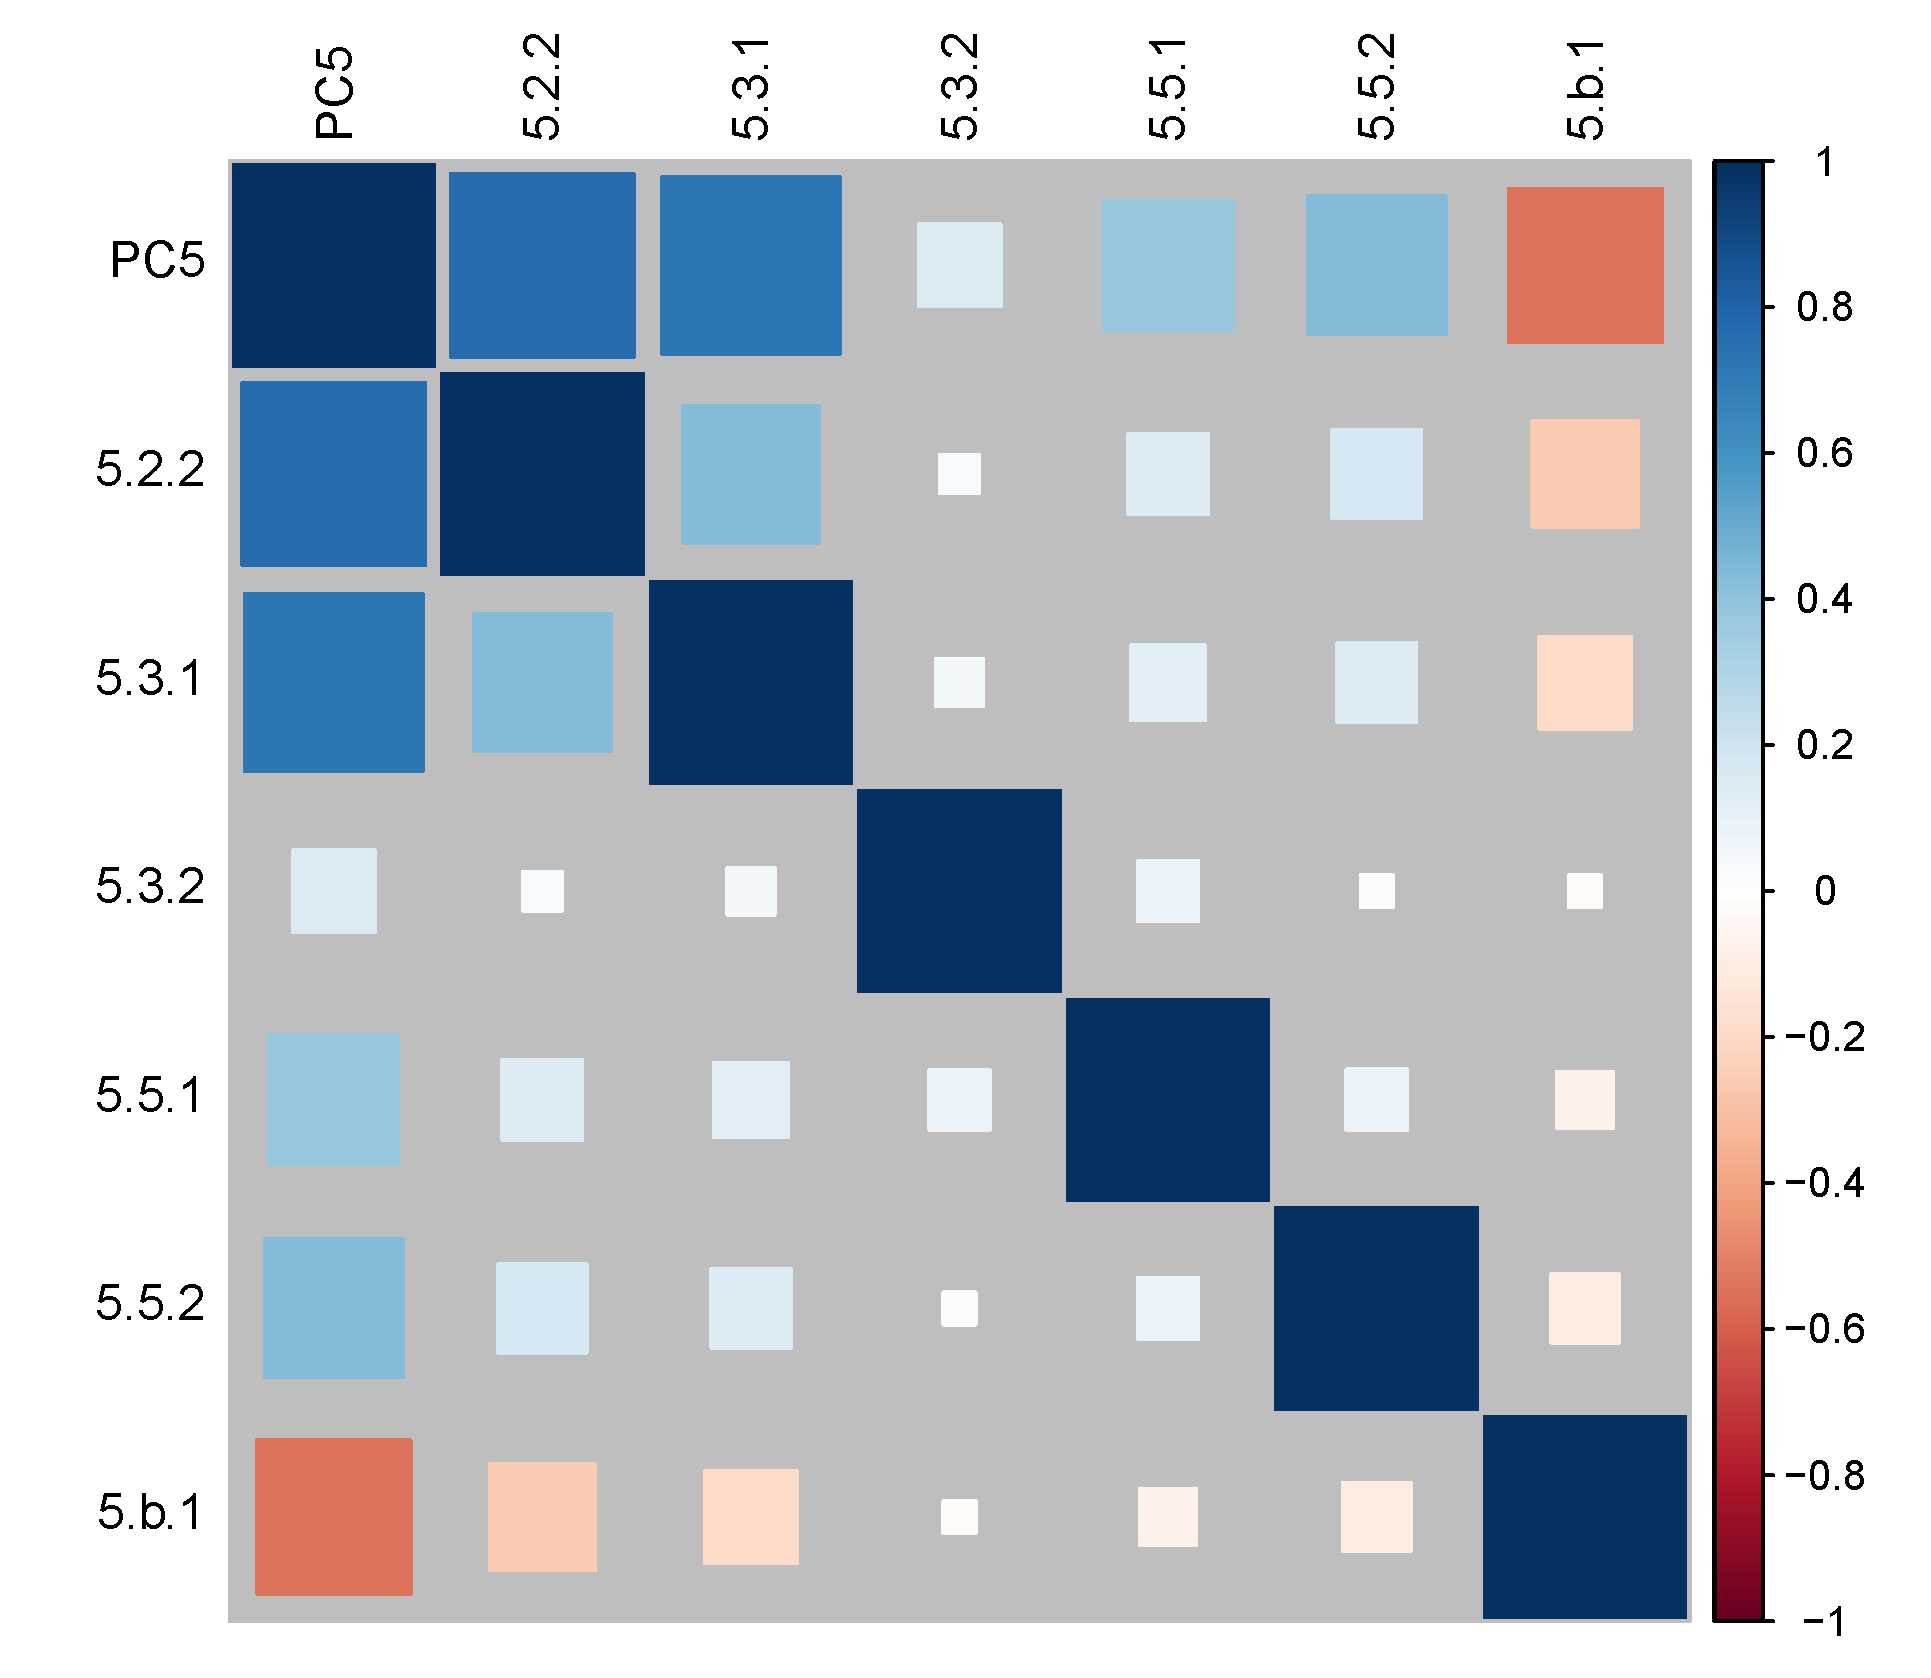
SDG 5 reflects the aim to achieve gender equality and empower all women and girls. The six indicators for the SDG yield a single PC. The PC is positively correlated with the revers of the proportion of women subjected to physical and/or sexual violence in the last 12 months (5.2.2), the reverse of the proportion of women married by age 18 (5.3.1), the proportion of seats held by women in national parliaments (5.5.1), and the female share of employment in senior and middle management (5.5.2). Absence of female genital mutilation prevalence (5.3.2) appears to be more weakly correlated to PC5, arguably because the practice applies only to a limited number of countries [
49]. The proportion of females that own a mobile telephone is negatively correlated with the main PC.
Figure A4.
SDG 5: Gender Equality. Indicators: PC5—‘Gender Equality’ component for SDG 5; 5.2.2—Proportion of women and girls aged 15 years and older subjected to sexual violence by persons other than an intimate partner in the previous 12 months; 5.3.1—Proportion of women aged 20–24 years who were married or in a union before age 15; 5.3.2—Proportion of girls and women aged 15–49 years who have undergone female genital mutilation/cutting; 5.5.1—Proportion of seats held by women in national parliaments (%); 5.5.2—Proportion of women in managerial positions; 5.b.1—Proportion of individuals who own a mobile telephone.
Appendix A.3.5. SDG 6: ‘Clean Water and Sanitation’
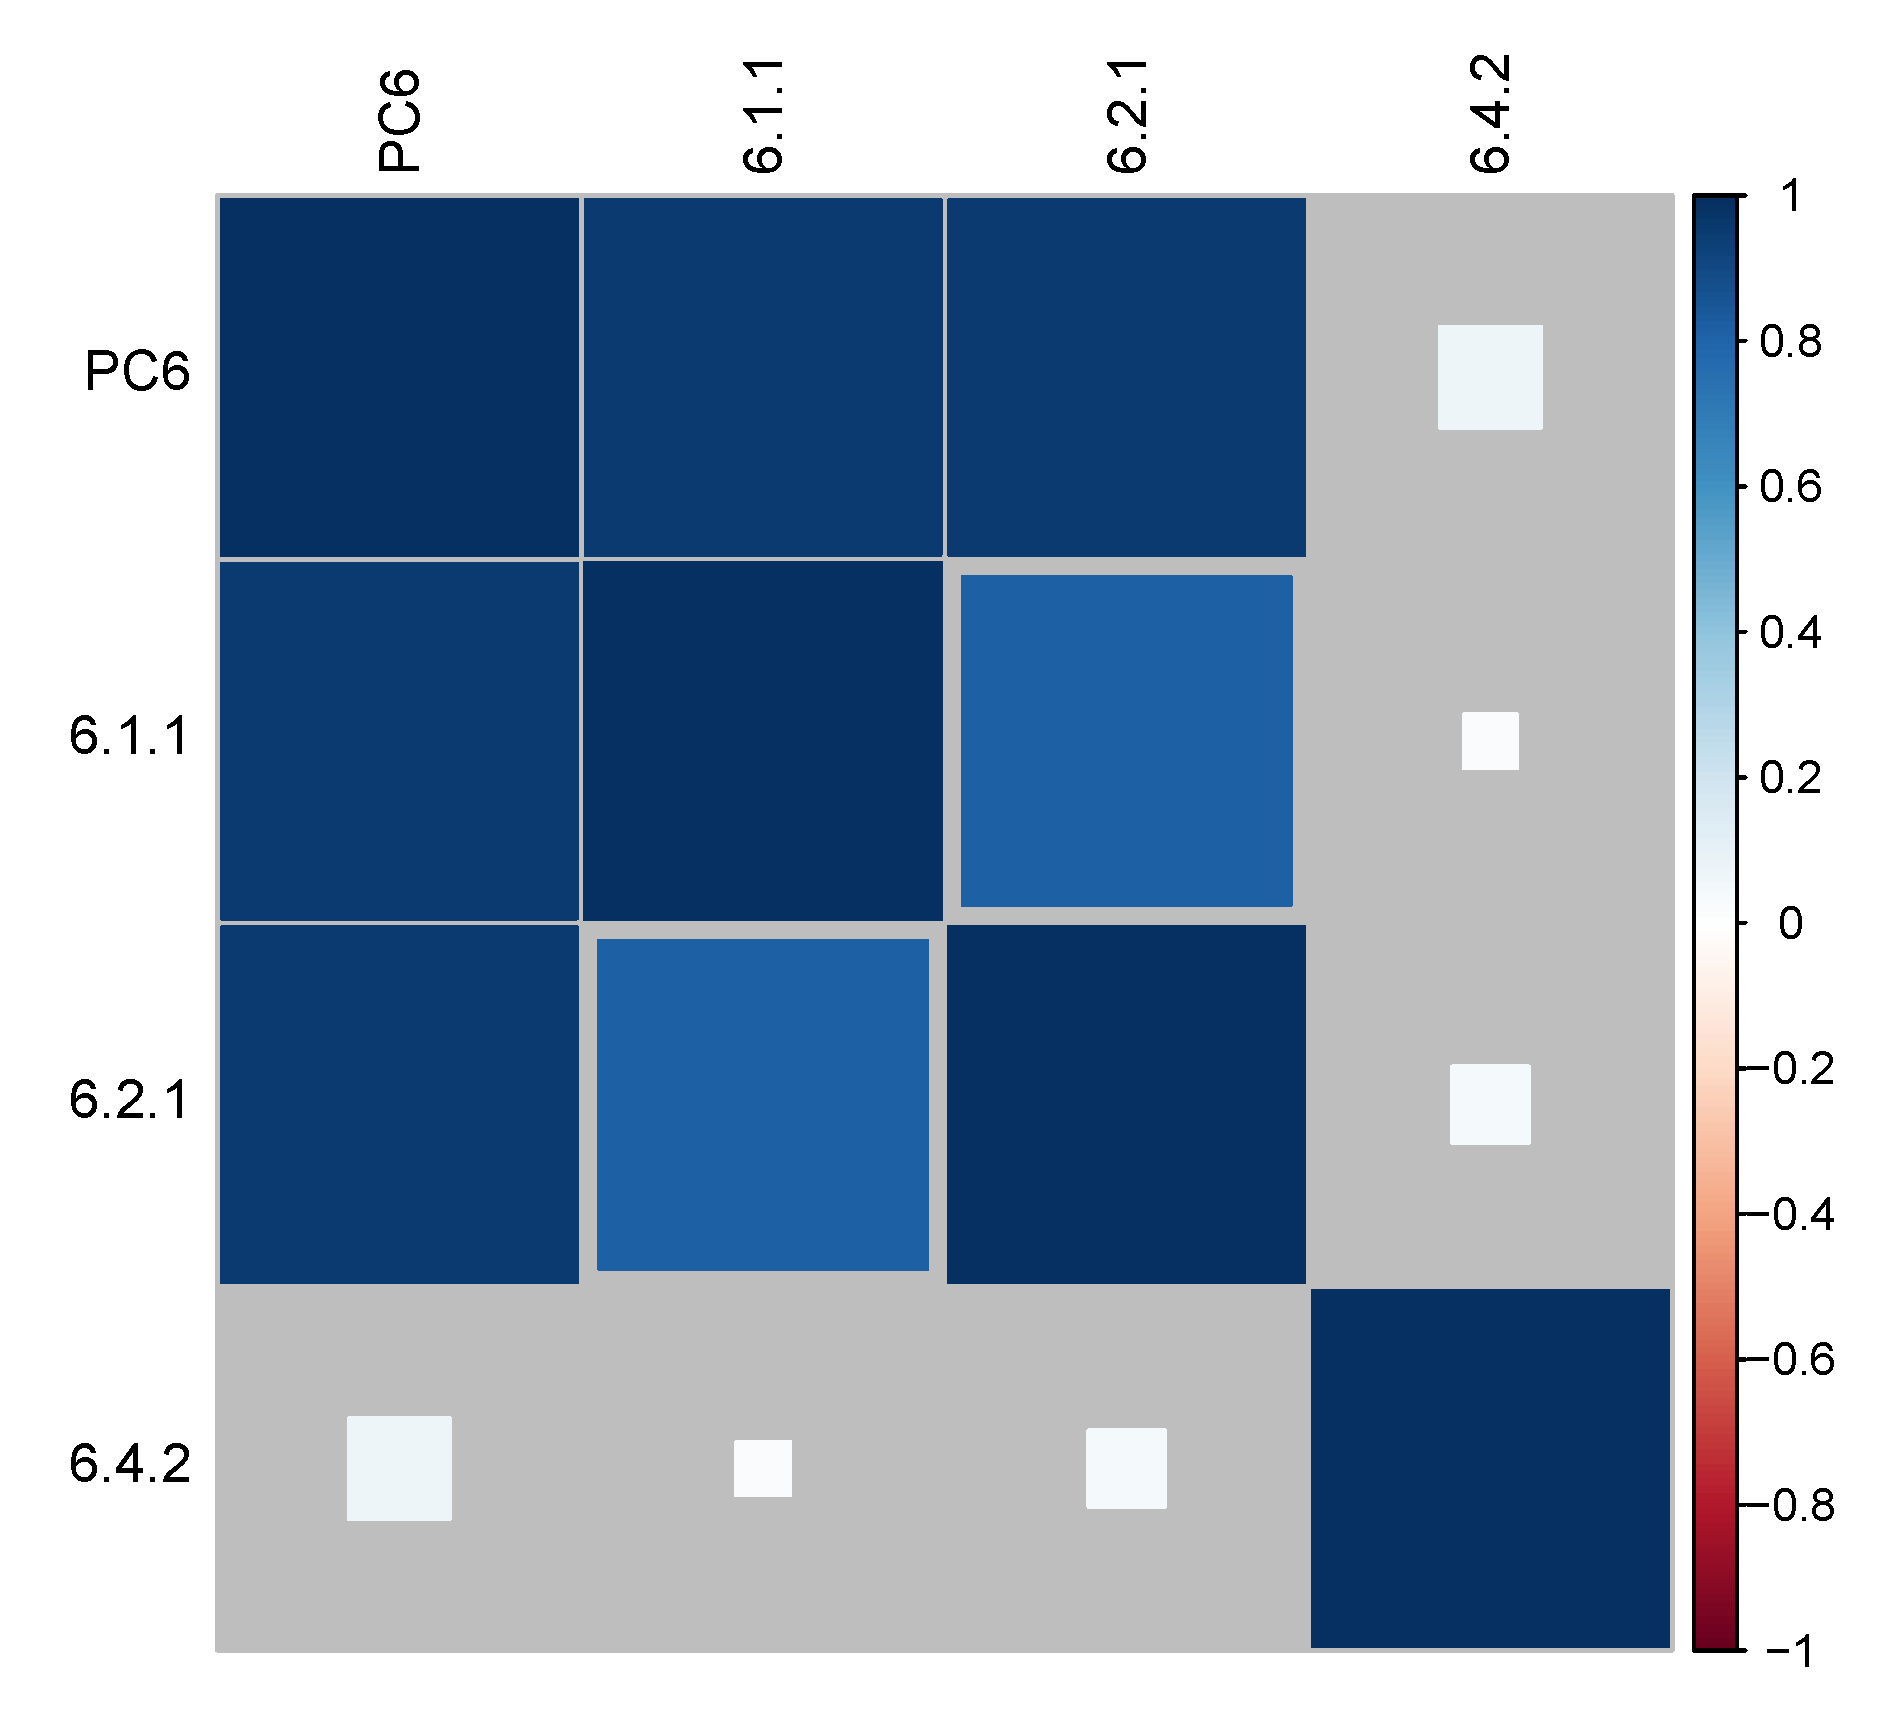
The ‘Clean water and sanitation’ goal aims to achieve availability and sustainable management of water and sanitation for all.
Figure A5 shows that two indicators contribute strongly to the main component: proportion of population using safely managed drinking water services (6.1.1) and sanitation services (6.2.1). The indicator showing change in water-use efficiency over time (6.4.2) is less clearly associated with the main PC.
Figure A5.
SDG 6: Clean Water and Sanitation. Indicators: PC6—‘Clean water’ component for SDG 6; 6.1.1—Proportion of population using safely managed drinking water services. 6.2.1—Proportion of population using safely managed sanitation services, including a hand-washing facility with soap and water; 6.4.2—Change in water-use efficiency over time.
Appendix A.3.6. SDG 8: ‘Decent Work and Economic Growth’
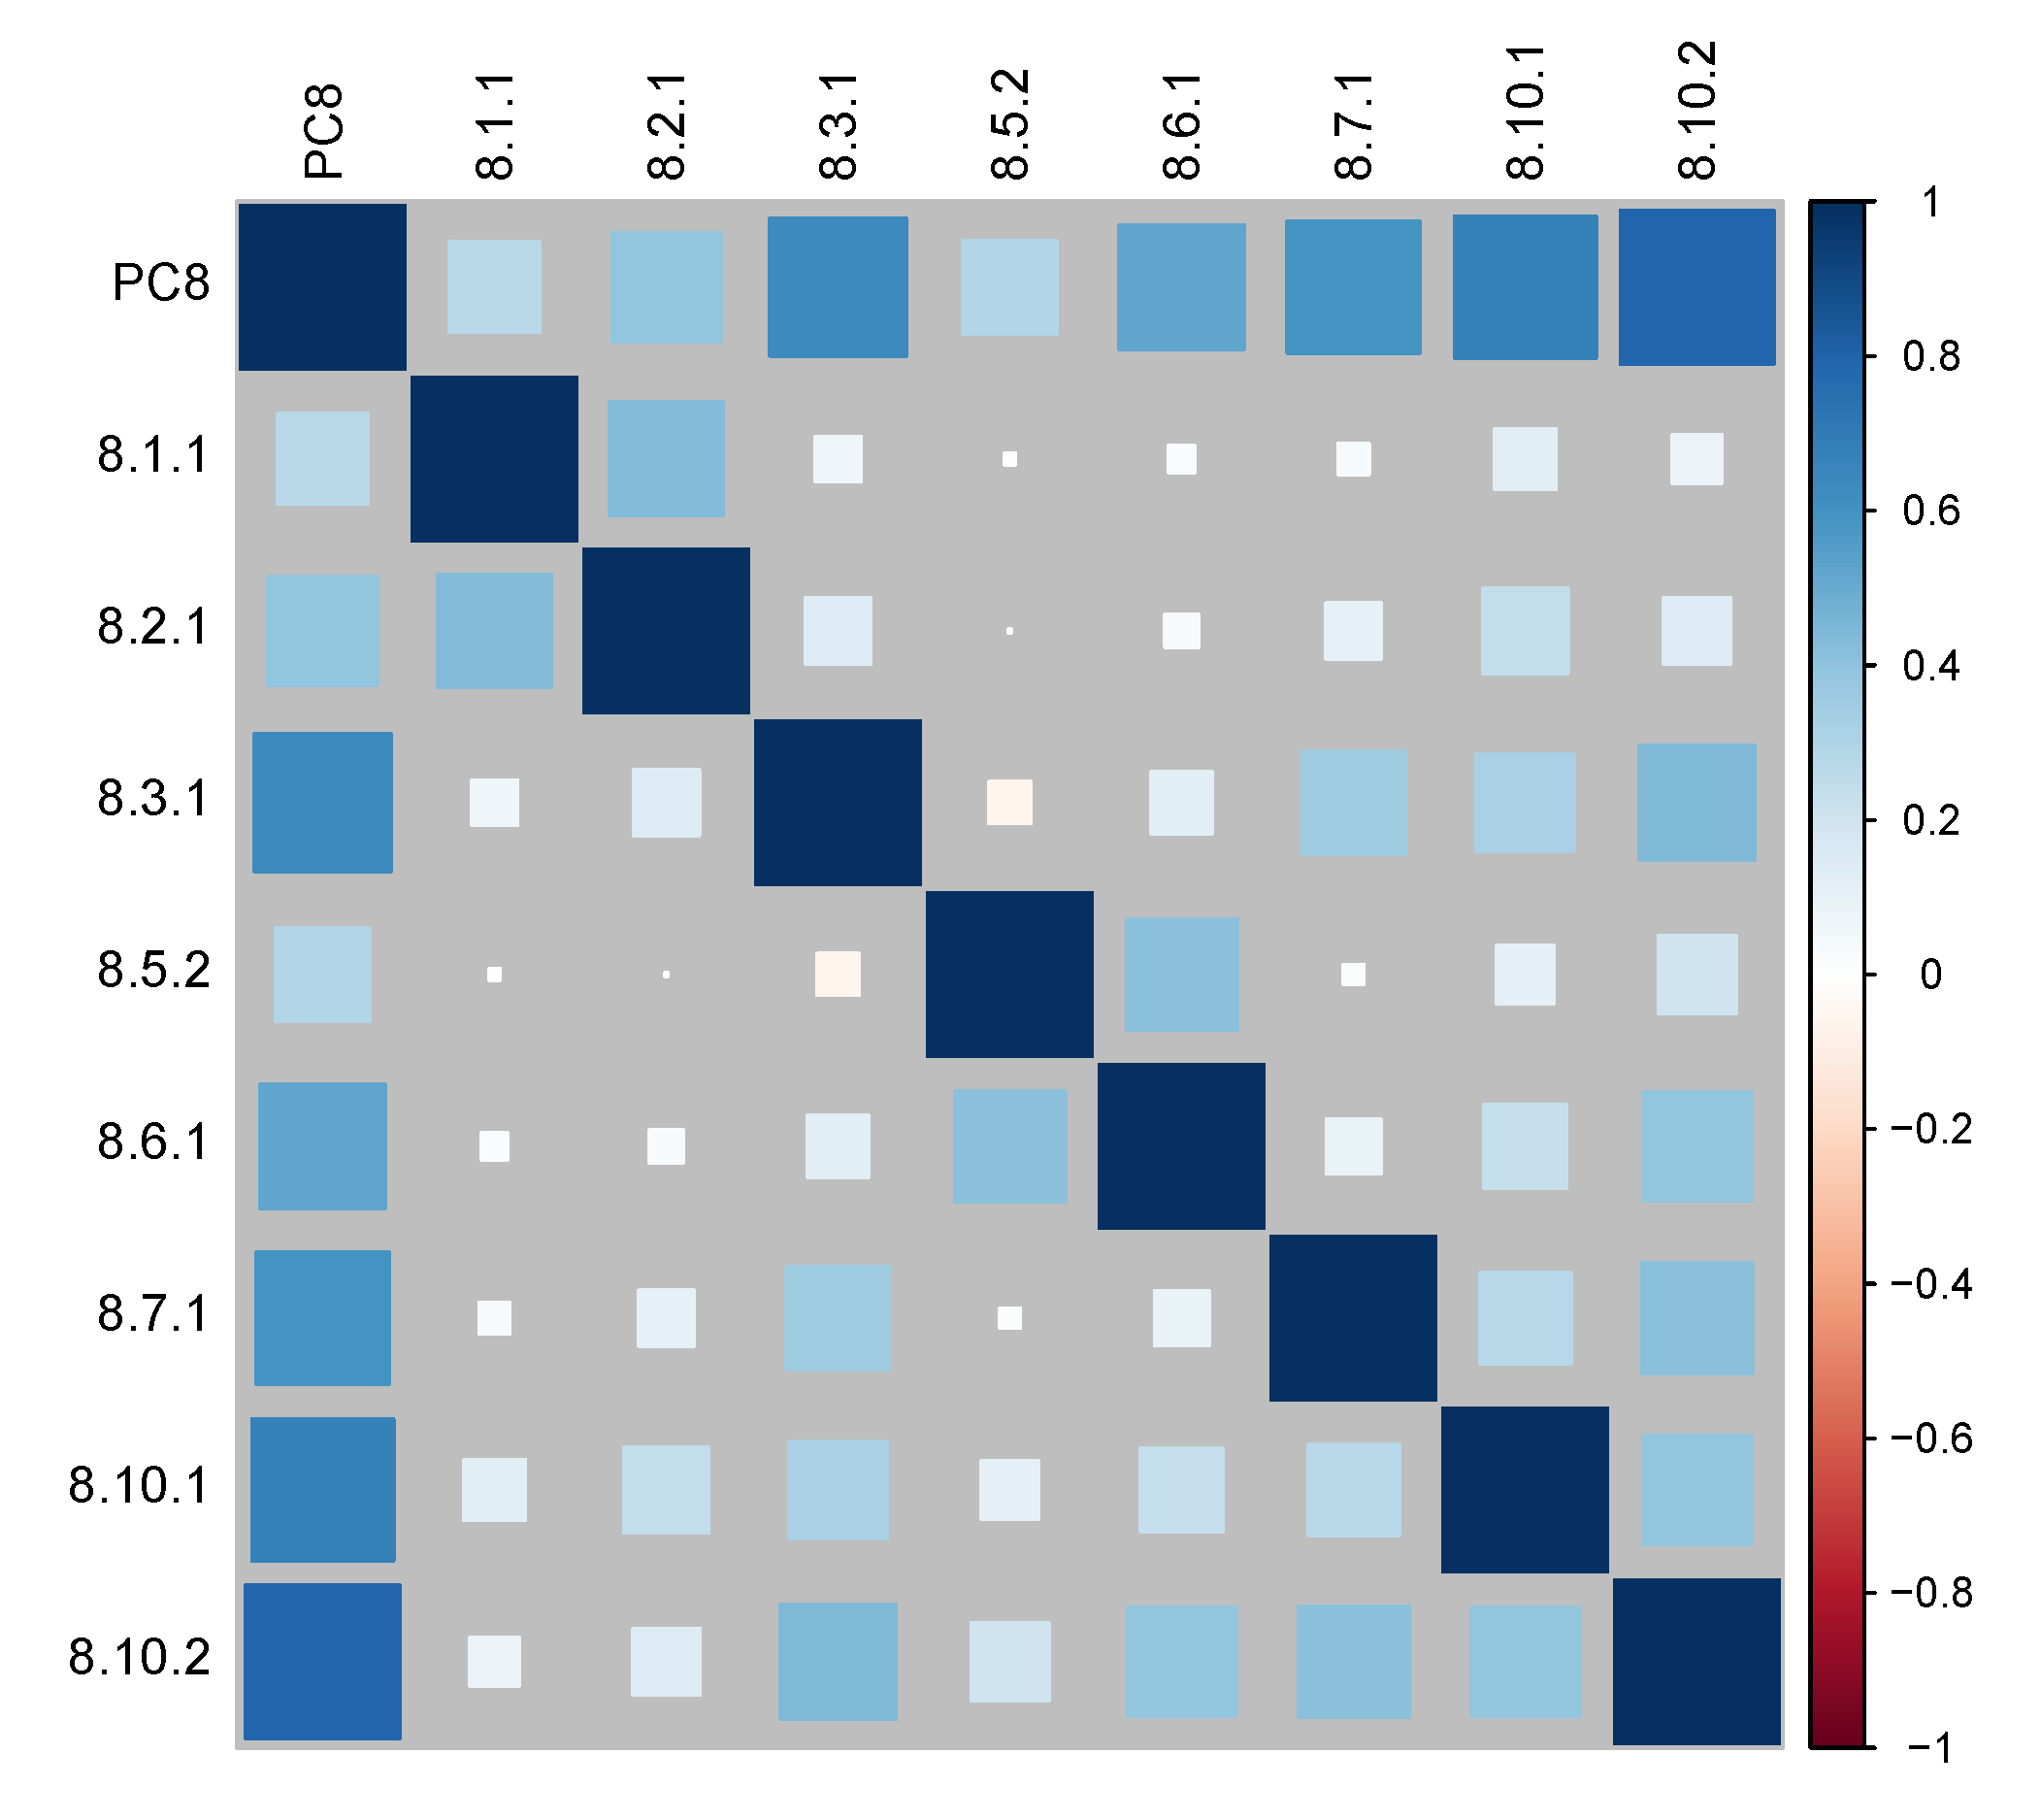
Sustained, inclusive and sustainable economic growth, productive employment and decent work for all are the aims of SDG 8. Again, eigenvalues suggest that a single component can be extracted. All the eight indicators we have are positively correlated with the PC, although correlations between the indicators themselves are often quite weak. Most clearly related to the PC are the two indicators that capture how widespread banking services are (8.10.1, 8.10.2), the reverse of the proportion of informal employment (8.3.1, 8.6.1), and absence of child labour. Growth rates and unemployment rate indicators are positively correlated with PC8 but not as strongly as the others.
Figure A6.
SDG 8: Decent work and economic growth. Indicators: PC8—‘Economic growth and employment’ component for SDG8; 8.1.1—Annual growth rate of real GDP per capita; 8.2.1—Annual growth rate of real GDP per employed person; 8.3.1—Proportion of informal employment in non-agriculture employment (reversed); 8.5.2—Unemployment rate, by sex, age and persons with disabilities (reversed); 8.6.1—Proportion of youth (aged 15–24 years) not in education, employment or training (reversed); 8.7.1—Proportion and number of children aged 5–17 years engaged in child labour (reversed); 8.10.1—(a) Number of commercial bank branches per 100,000 adults and (b) number of automated teller machines (ATMs) per 100,000 adults.
Appendix A.3.7. SDG 9: ‘Industry, Innovation and Infrastructure’
Striving for SDG 9 means building resilient infrastructure, promoting sustainable industrialisation and fostering innovation. Following respective eigenvalues, we extract one principal component for four SDG 9 indicators. Most closely related to the extracted component is researchers per million people (9.5.2), with manufacturing as % of GDP (9.2.1) and research and development expenditure (9.5.1) close behind. Low rates of CO
emission per unit of value added are negatively associated with the PC, which may be due to cleaner production in high-income countries and a higher degree of ‘decoupling’ of economic growth from carbon emissions growth purchasing power [
50].
Figure A7.
SDG 9: Industry, innovation and infrastructure. Indicators: PC9—‘Industry, innovation and infrastructure’ component for SDG9; 9.2.1—Manufacturing value added as a proportion of GDP; 9.4.1—CO2 emission per unit of value added (reversed); 9.5.1—Research and development expenditure as a proportion of GDP; 9.5.2—Researchers (in full-time equivalent) per million
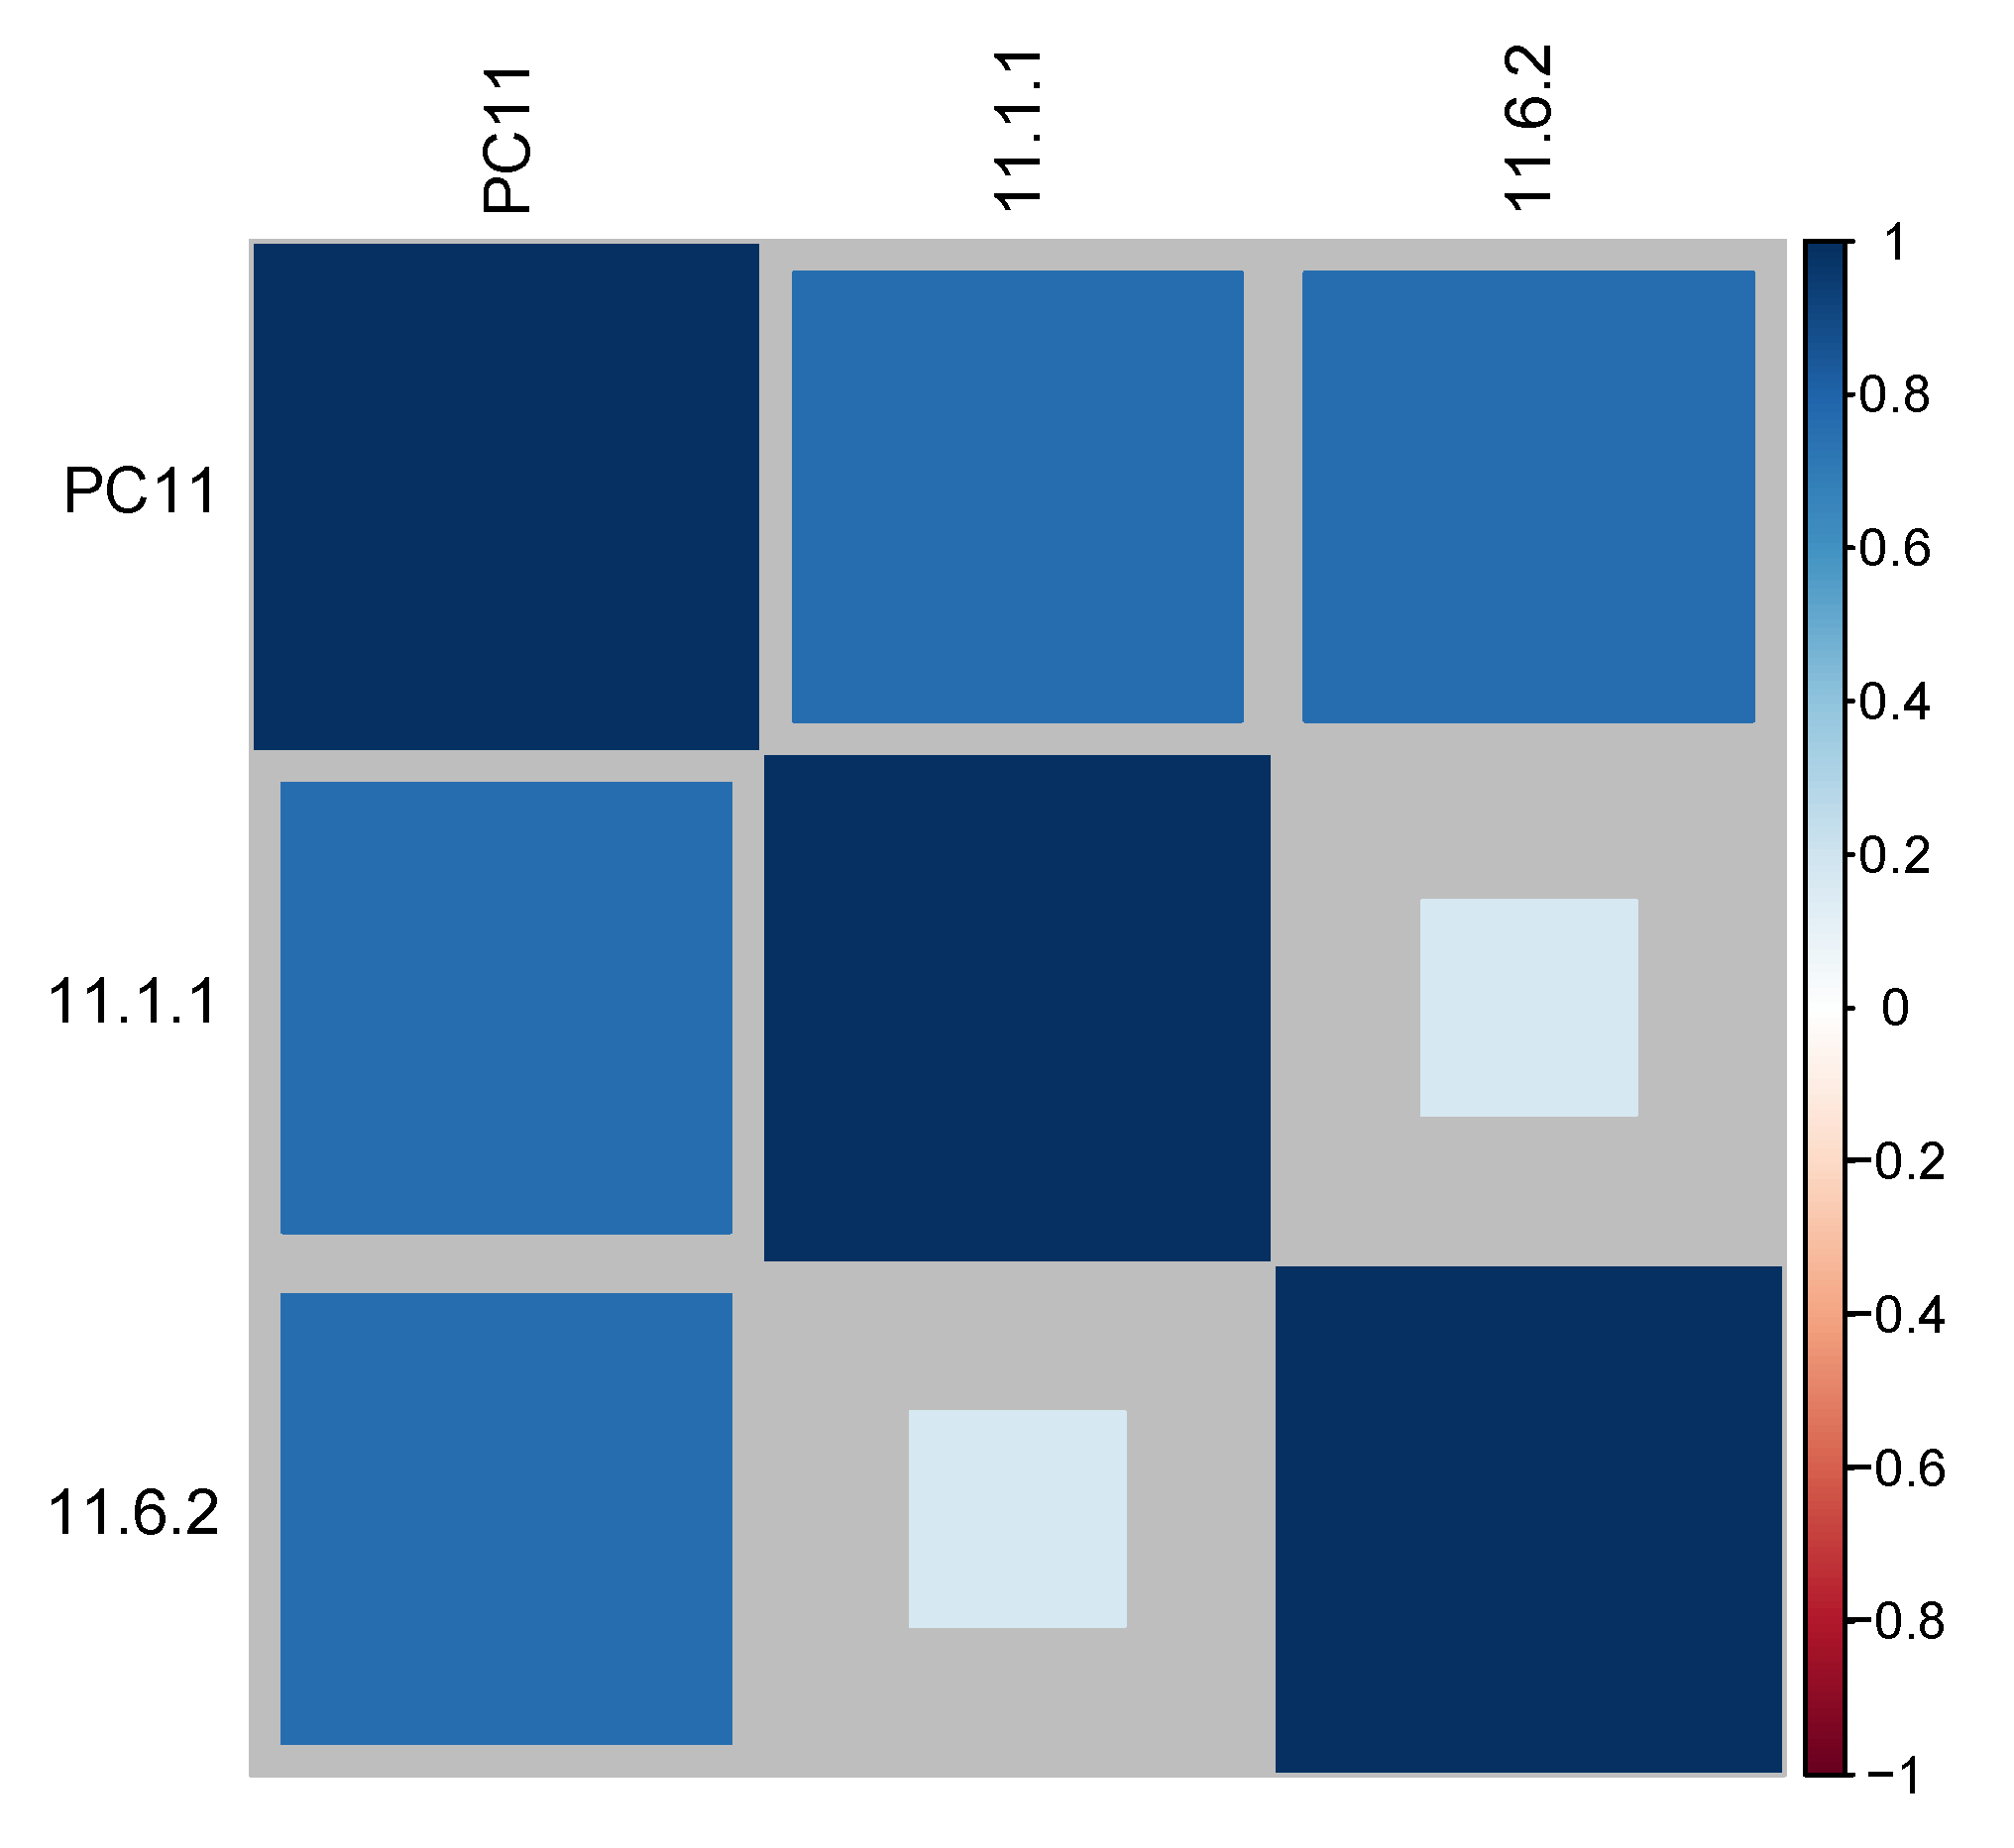
Appendix A.3.8. SDG 11: ‘Sustainable Cities and Communities’
Inclusive, safe, resilient and sustainable cities and human settlements is the aim of SDG 11. The two indicators 11.1.1 (proportion of population living in slums) and 11.6.2 (mean level of fine particulate matter) are positively correlated.
Figure A8.
SDG 11: Sustainable cities and communities. Indicators: PC11—‘Sustainable cities and communities’ component for SDG11; 11.1.1—Proportion of urban population living in slums, informal settlements or inadequate housing (reversed); 11.6.2—Annual mean levels of fine particulate matter (e.g., PM2.5 and PM10) in cities (population weighted) (reversed).
Appendix A.3.9. SDG 12: ‘Responsible Consumption’
Goal 12 aims to ensure sustainable consumption and production patterns. The currently only available indicator is domestic material consumption (12.2.2). Given the current absence of other indicators, 12.2.2 is the one included as a main component for SDG 12 with reverse direction sign, with no need for correlation matrix.
Appendix A.3.10. SDG 13: ‘Climate Action’
Goal 13 urges to take immediate action to mitigate climate change and its impacts. The currently existing indicators that contribute to this main component also only include one indicator—13.1.1: Number of deaths, missing persons and directly affected persons attributed to disasters per 100,000 population.
Appendix A.3.11. SDG 14: ‘Life Below Water’
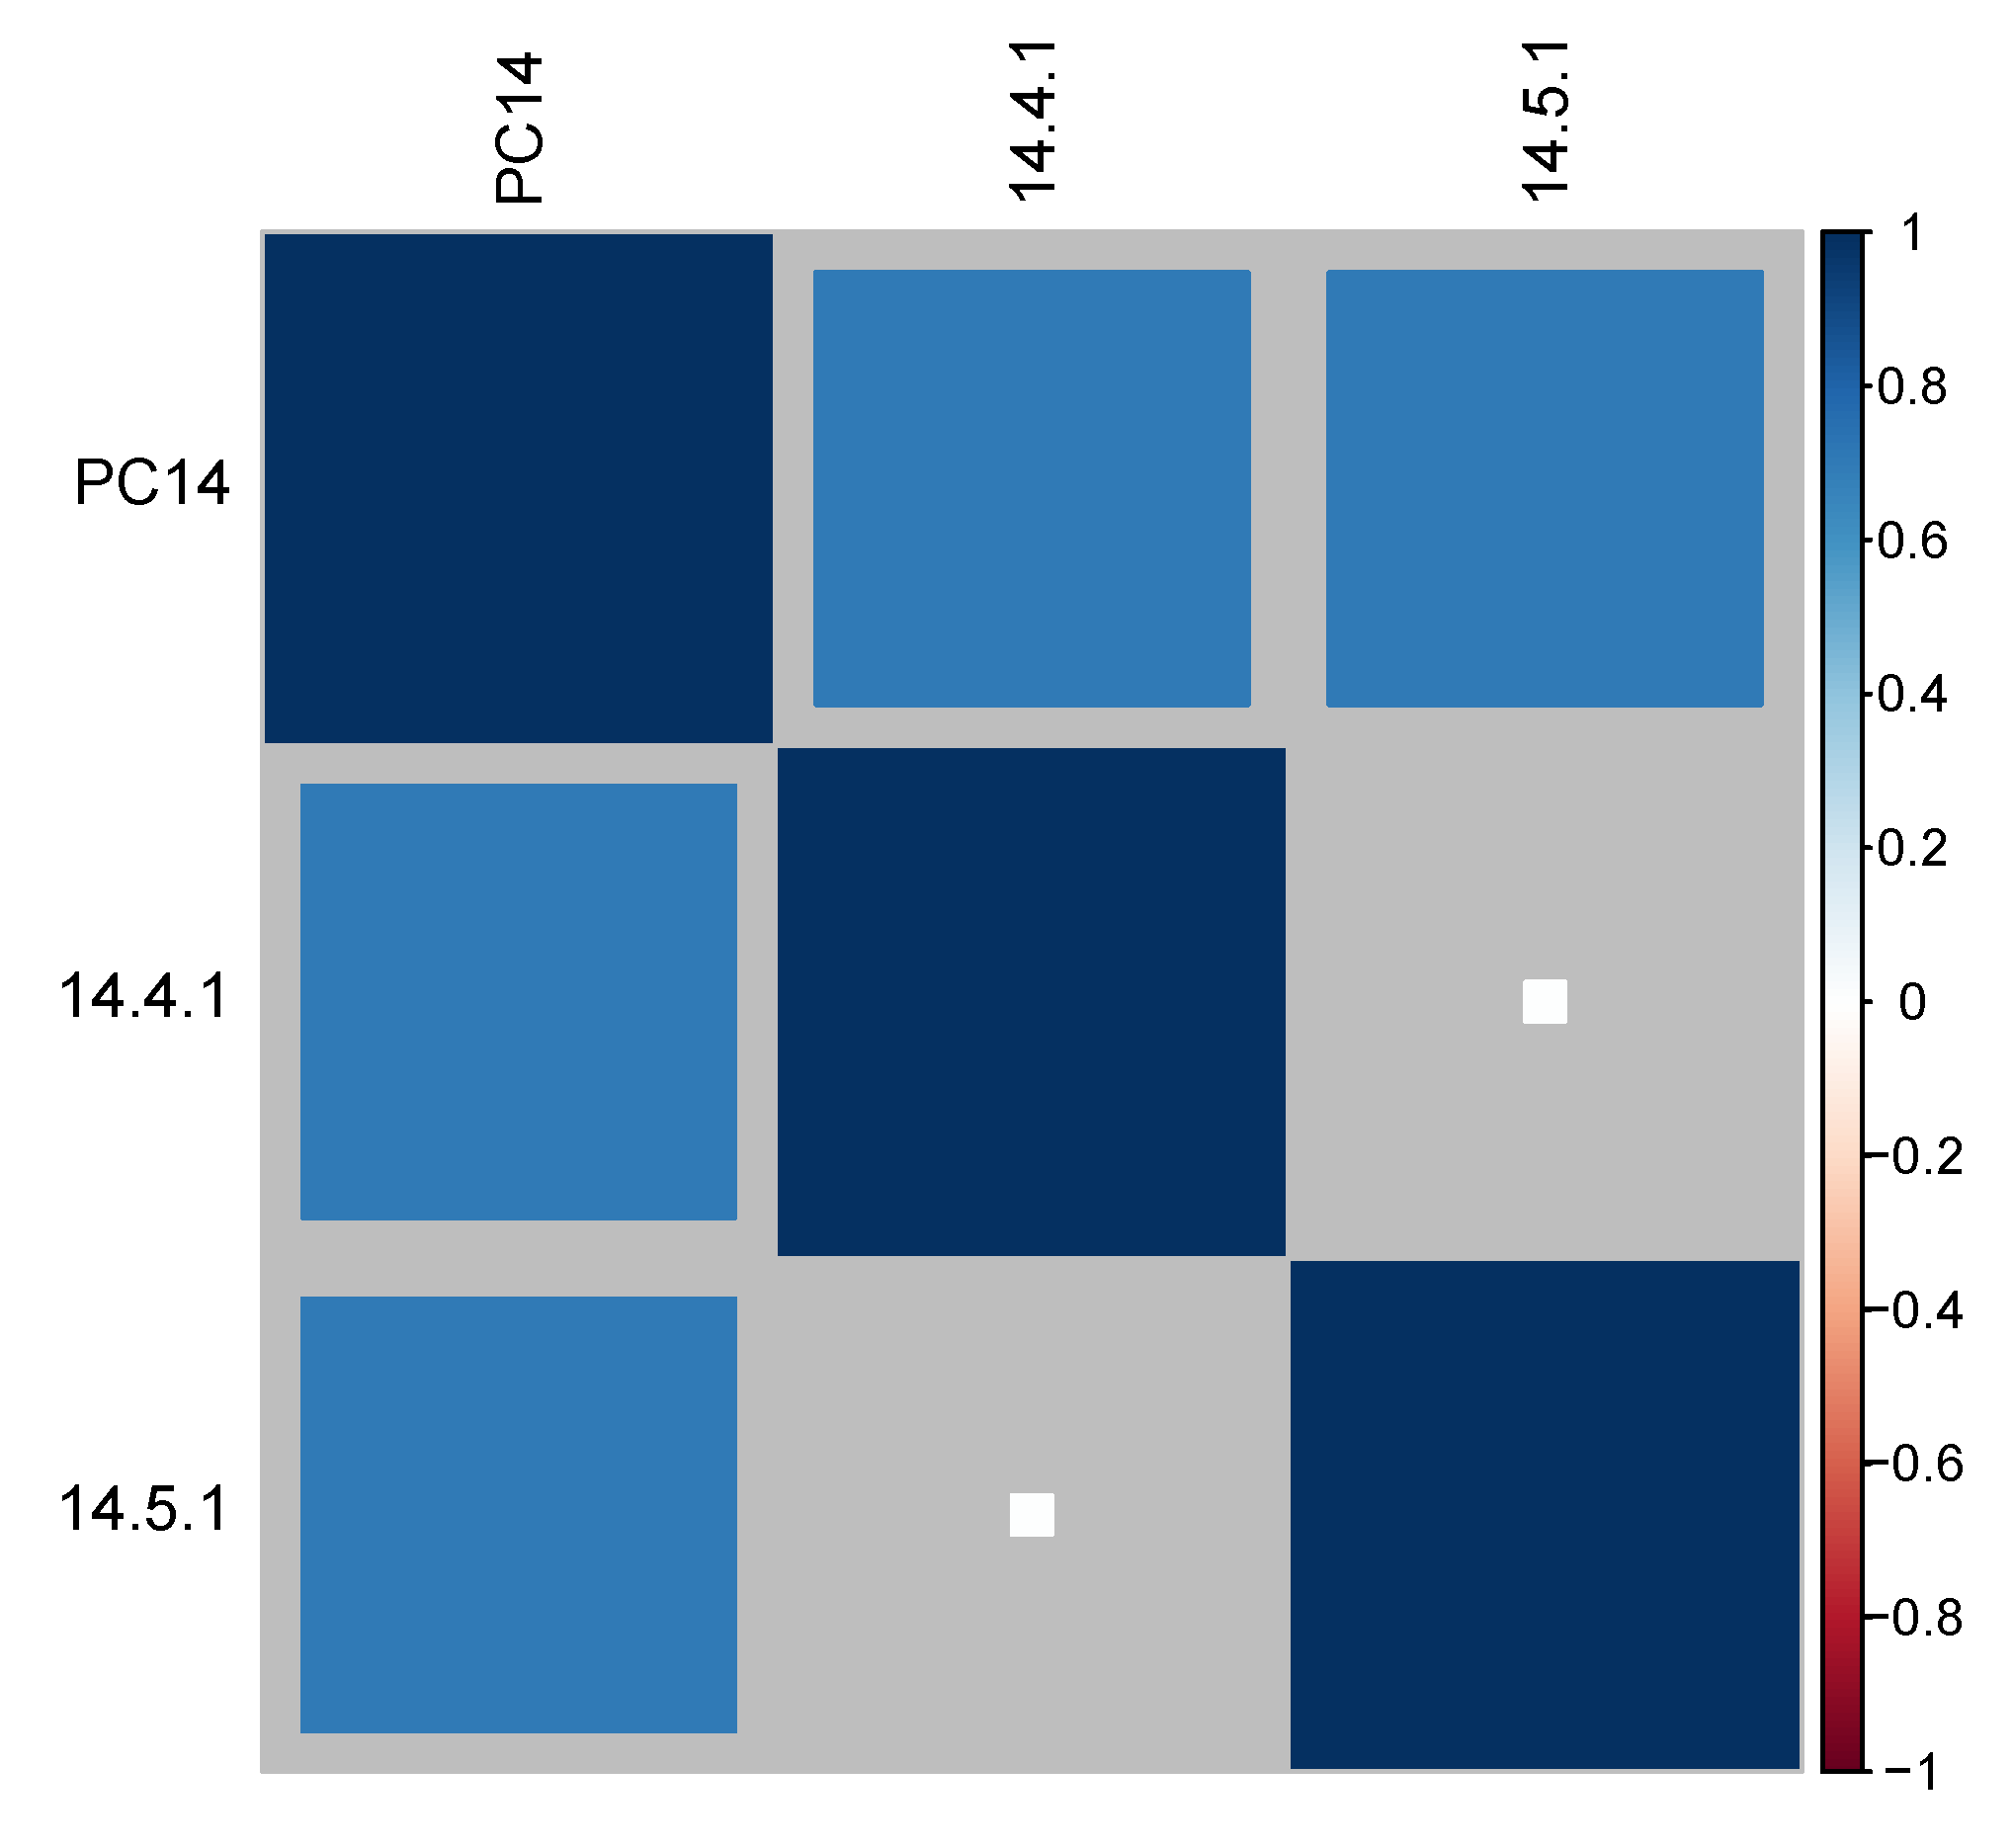
Goal 14 represents the aim to conserve and sustainably use the oceans, seas and marine resources for sustainable development. The only available indicators so far are 14.4.1 (proportion of biologically sustained fish stocks) and 14.5.1 (coverage of protected areas in relation to marine areas). When executing a PCA using only two indicators, both load strongly on the main component for the goal despite not being correlated with each other in this case.
Figure A9.
SDG 14: Life below water. Indicators: PC14—‘Life below water’ component for SDG 14; 14.4.1—Proportion of fish stocks within biologically sustainable levels; 14.5.1—Coverage of protected areas in relation to marine areas.
Figure A9.
SDG 14: Life below water. Indicators: PC14—‘Life below water’ component for SDG 14; 14.4.1—Proportion of fish stocks within biologically sustainable levels; 14.5.1—Coverage of protected areas in relation to marine areas.
Appendix A.3.12. SDG 15: ‘Life on Land’
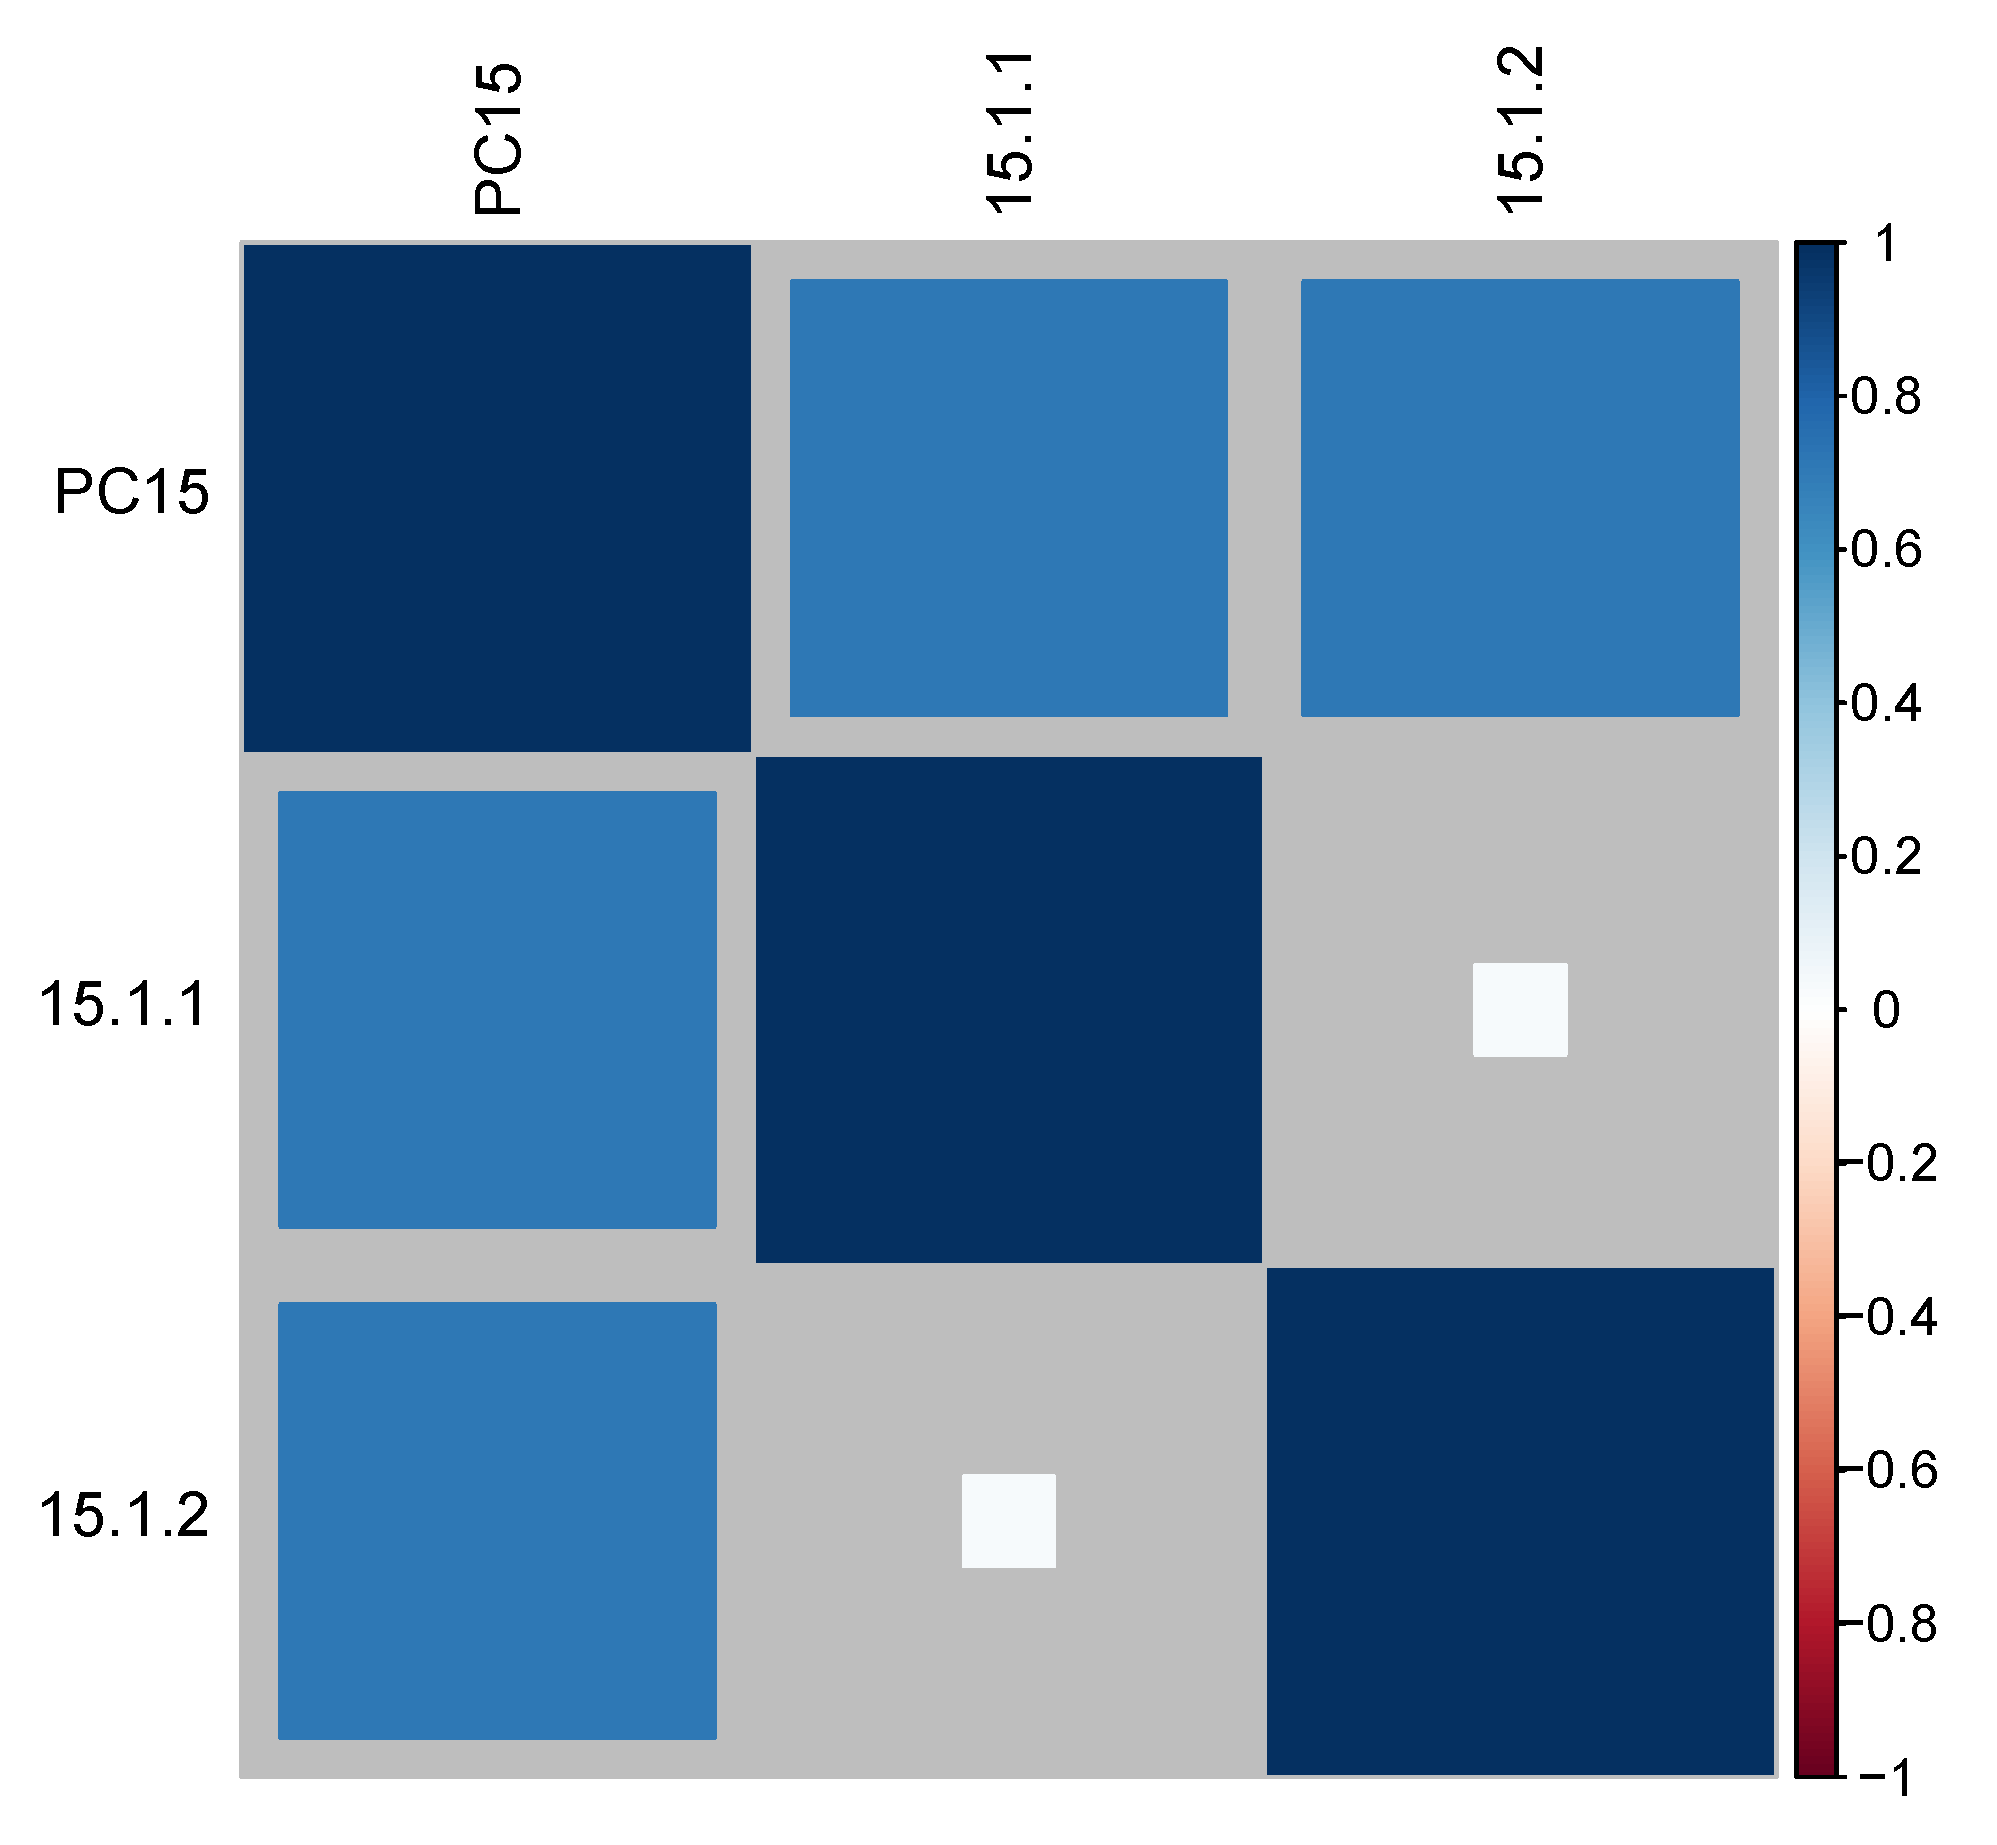
The purpose of goal 15 entails protecting, restoring and promoting sustainable use of terrestrial ecosystems, sustainably managing forests, combating desertification, and reversing land degradation. Again, there are only two available indicators 15.1.1 (forest area as proportion of land area) and 15.1.2 (proportion of important sites, covered by protected areas). They are positively correlated and contribute equally to the extracted PC.
Figure A10.
SDG 15: Life on land. Indicators: PC15—‘Life on land’ component for SDG15; 15.1.1—Forest area as a proportion of total land area; 15.1.2—Proportion of important sites for terrestrial and freshwater biodiversity that are covered by protected areas, by ecosystem type.
Figure A10.
SDG 15: Life on land. Indicators: PC15—‘Life on land’ component for SDG15; 15.1.1—Forest area as a proportion of total land area; 15.1.2—Proportion of important sites for terrestrial and freshwater biodiversity that are covered by protected areas, by ecosystem type.
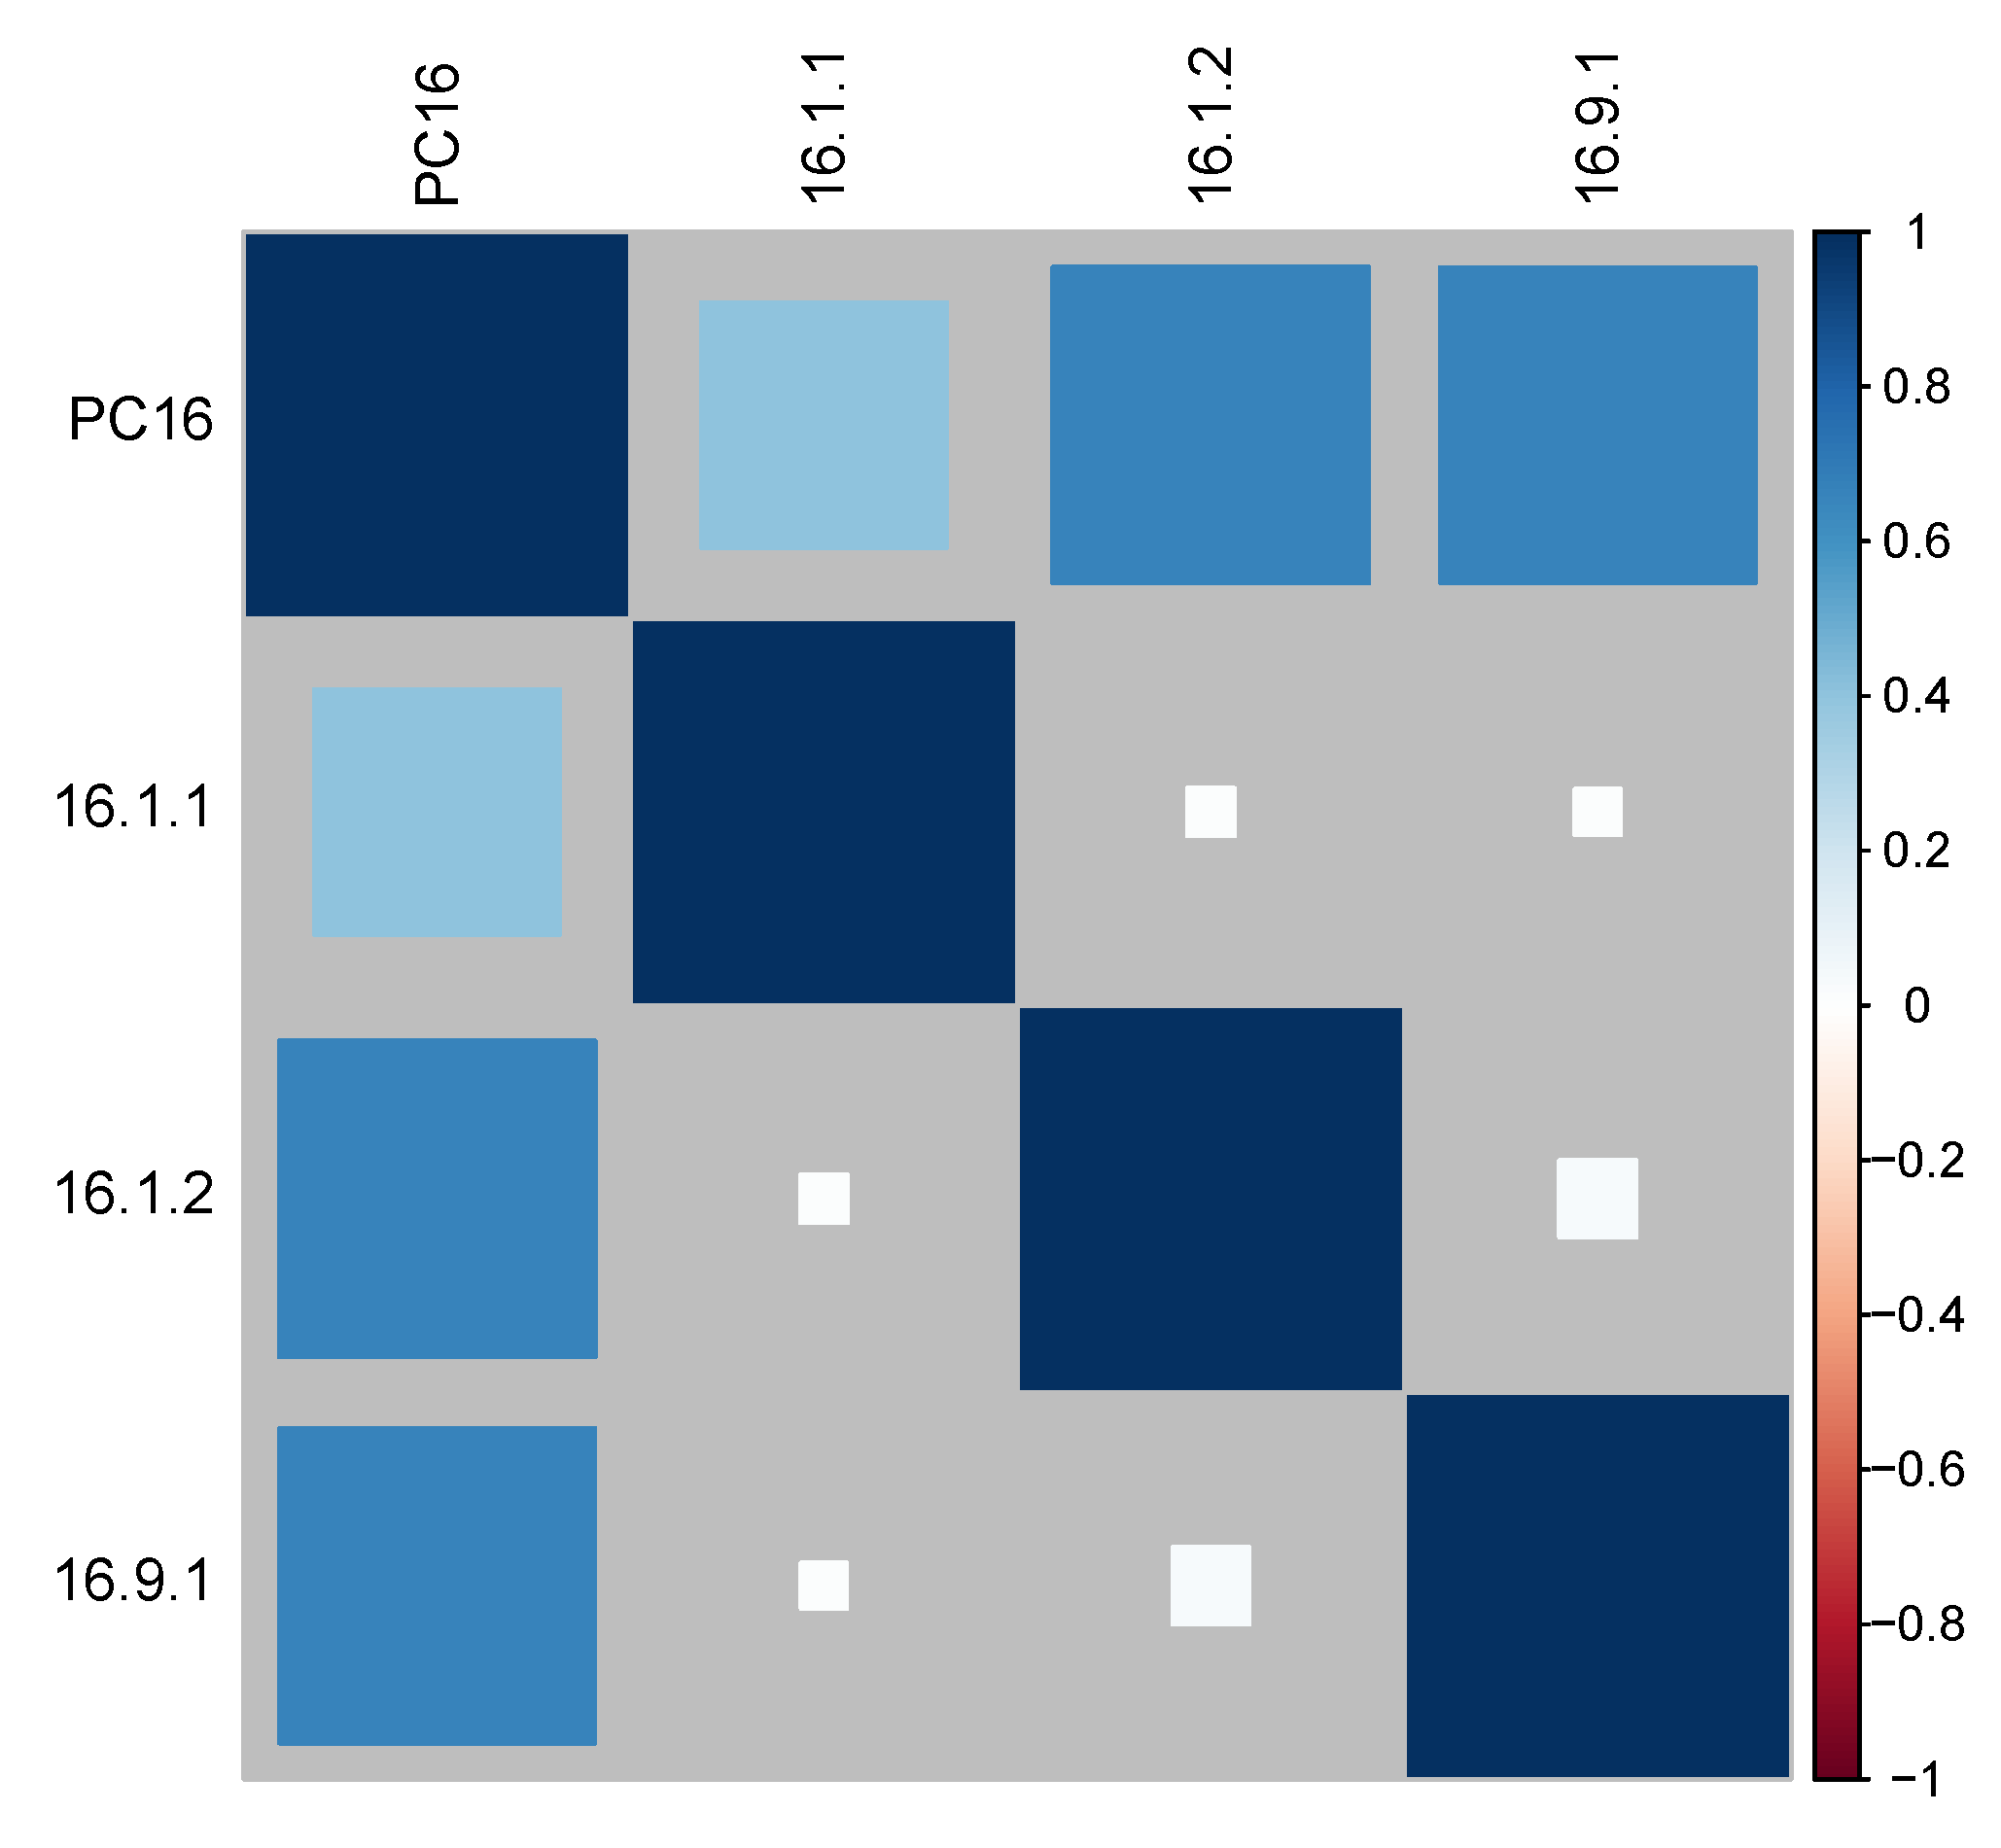
Appendix A.3.13. SDG 16: ‘Peace, Justice, and Strong Institutions’
Goal 16 concerns three elements: peace, just and inclusive societies, and effective, accountable and inclusive institutions. The three WDI indicators for SDG 16 are all correlated in the expected direction. Completeness of birth registration records (16.9.1) contributes the most to the extracted principal component, but absence of homicides (6.1.1) and battle-related deaths (6.1.2) are also positively related.
Figure A11.
SDG 16: Peace, justice and strong institutions. Indicators: PC16—‘Peace, justice and strong institutions’ component for SDG16; 16.1.1— Number of victims of intentional homicide per 100,000 population (reversed); 16.1.2—Conflict-related deaths per 100,000 population (reversed); 16.9.1—Proportion of children under 5 years of age whose births have been registered with a civil authority.
Appendix A.3.14. SDG 17: ‘Partnership for the Goals’
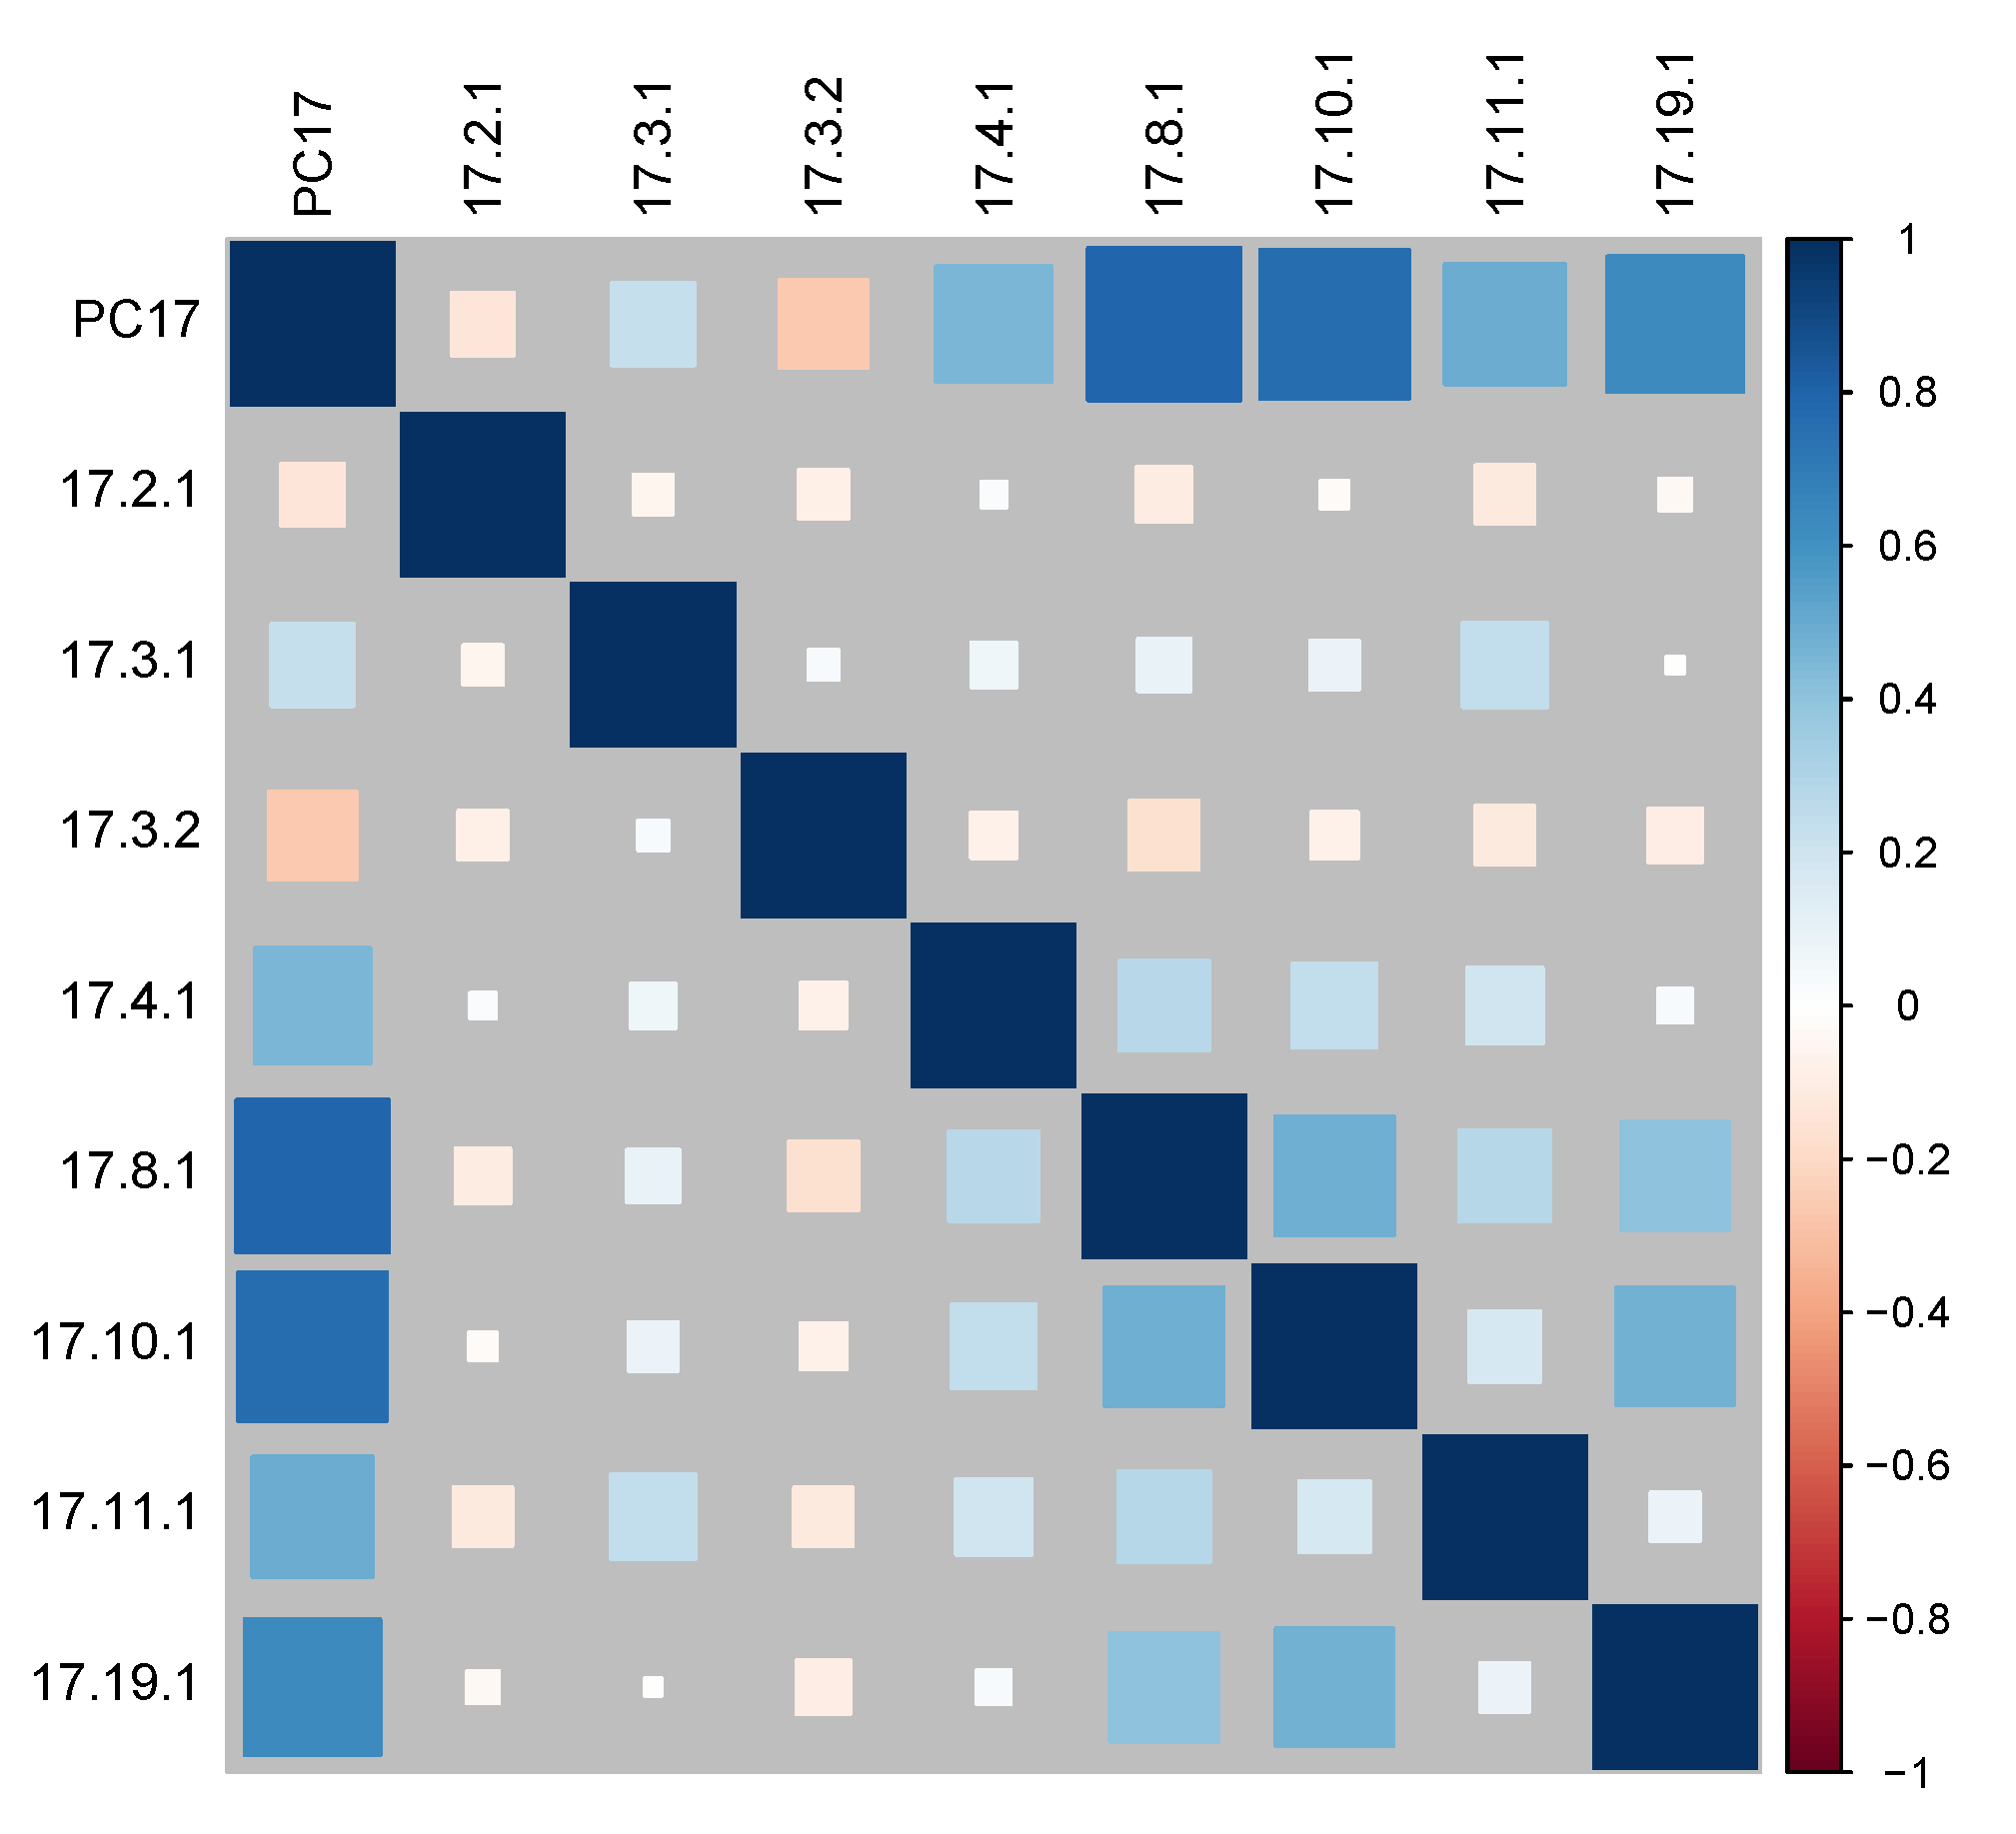
SDG 17 captures the aim to implement the Sustainable Development Goals through joint international efforts. Out of the eight indicators, 17.8.1 (internet usage), 17.10.1 (absence of tariffs) and 17.19.1 (statistical capacity) load most strongly on the extracted component. Low debt service (17.4.1), developing countries’ share of exports (17.11.1), and foreign direct investment are also positively correlated with the extracted PC. Official development assistance (17.2.1) and remittances (17.3.2) are negatively correlated with the main factor extracted.
Figure A12.
SDG 17: Partnerships for the goals. Indicators: PC17—‘Partnership’ component for SDG17; 17.2.1—Net official development assistance, total and to least developed countries, as a proportion of the Organisation for Economic Cooperation and Development (OECD) Development Assistance Committee donors’ gross national income (GNI); 17.3.1—Foreign direct investment (FDI), official development assistance and South-South cooperation as a proportion of total domestic budget; 17.3.2—Volume of remittances (in United States dollars) as a proportion of total GDP; 17.4.1—Debt service as a proportion of exports of goods and services (reversed); 17.8.1—Proportion of individuals using the internet; 17.10.1—Worldwide weighted tariff-average (reversed); 17.11.1—Developing countries’ and least developed countries’ share of global exports; 17.19.1—Dollar value of all resources made available to strengthen statistical capacity.
References
- Sachs, J.D. From millennium development goals to Sustainable Development Goals. Lancet 2012, 379, 2206–2211. [Google Scholar] [CrossRef]
- Griggs, D.J.; Nilsson, M.; McCollum, D. A Guide to SDG Interactions: From Science to Implementation; International Council for Science (ICSU): Paris, France, 2017. [Google Scholar]
- Allen, C.; Nejdawi, R.; El-Baba, J.; Hamati, K.; Metternicht, G.; Wiedmann, T. Indicator-based assessments of progress towards the sustainable development goals (SDGs): A case study from the Arab region. Sustain. Sci. 2017, 12, 975–989. [Google Scholar] [CrossRef]
- International Resource Panel. Policy Coherence of the Sustainable Development Goals: A Natural Resource Perspective; UN Environment Programme: Nairobi, Kenya, 2015. [Google Scholar]
- United Nations. The Millennium Development Goals Report 2015; Technical Report; United Nations: New York, NY, USA, 2015. [Google Scholar]
- International Council for Science. Review of the Sustainable Development Goals: The Science Perspective; International Council for Science (ICSU): Paris, France, 2015. [Google Scholar]
- Nilsson, M.; Griggs, D.; Visbeck, M. Map the interactions between Sustainable Development Goals. Nature 2016, 534, 320–322. [Google Scholar] [CrossRef]
- Pradhan, P.; Costa, L.; Rybski, D.; Kropp, J.P. A Systematic Study of sustainable Development Goal (SDG) Interaction. Earth’s Future 2017, 5, 1169–1179. [Google Scholar] [CrossRef]
- Breuer, A.; Janetschek, H.; Malerba, D. Translating Sustainable Development Goal (SDG) Interdependencies into Policy Advice. Sustainability 2019, 11, 2092. [Google Scholar] [CrossRef]
- Scherer, L.; Behrens, P.; de Koning, A.; Heijungs, R.; Sprecher, B.; Tukker, A. Trade-offs between social and environmental Sustainable Development Goals. Environ. Sci. Policy 2018, 90, 65–72. [Google Scholar] [CrossRef]
- Fuso Nerini, F.; Tomei, J.; To, L.S.; Bisaga, I.; Parikh, P.; Black, M.; Borrion, A.; Spataru, C.; Castán Broto, V.; Anandarajah, G.; et al. Mapping synergies and trade-offs between energy and the Sustainable Development Goals. Nat. Energy 2018, 3, 10–15. [Google Scholar] [CrossRef]
- McCollum, D.L.; Echeverri, L.G.; Busch, S.; Pachauri, S.; Parkinson, S.; Rogelj, J.; Krey, V.; Minx, J.C.; Nilsson, M.; Stevance, A.S.; et al. Connecting the sustainable development goals by their energy inter-linkages. Environ. Res. Lett. 2018, 13, 033006. [Google Scholar] [CrossRef]
- Nilsson, M. Important interactions among the Sustainable Development Goals under Review at the High-Level Political Forum 2017; Working Paper No. 2017-06; Stockholm Environment Institute: Stockholm, Sweden, 2017. [Google Scholar]
- Nilsson, M.; Chisholm, E.; Griggs, D.; Howden-Chapman, P.; McCollum, D.; Messerli, P.; Neumann, B.; Stevance, A.S.; Visbeck, M.; Stafford-Smith, M. Mapping interactions between the sustainable development goals: Lessons learned and ways forward. Sustain. Sci. 2018, 13, 1489–1503. [Google Scholar] [CrossRef]
- Moyer, J.D.; Bohl, D.K. Alternative pathways to human development: Assessing trade-offs and synergies in achieving the Sustainable Development Goals. Futures 2019, 105, 199–210. [Google Scholar] [CrossRef]
- Weitz, N.; Carlsen, H.; Nilsson, M.; Skånberg, K. Towards systemic and contextual priority setting for implementing the 2030 Agenda. Sustain. Sci. 2018, 13, 531–548. [Google Scholar] [CrossRef] [PubMed]
- Collste, D.; Pedercini, M.; Cornell, S.E. Policy coherence to achieve the SDGs: Using integrated simulation models to assess effective policies. Sustain. Sci. 2017, 12, 921–931. [Google Scholar] [CrossRef] [PubMed]
- Kroll, C.; Warchold, A.; Pradhan, P. Sustainable Development Goals (SDGs): Are we successful in turning trade-offs into synergies? Palgrave Commun. 2019, 5, 140. [Google Scholar] [CrossRef]
- Lusseau, D.; Mancini, F. Income-based variation in Sustainable Development Goal interaction networks. Nat. Sustain. 2019, 2, 242–247. [Google Scholar] [CrossRef]
- MacFeely, S. The Big (data) Bang: Opportunities and Challenges for Compiling SDG Indicators. Glob. Policy 2019, 10, 121–133. [Google Scholar] [CrossRef]
- Guppy, L.; Mehta, P.; Qadir, M. Sustainable development goal 6: Two gaps in the race for indicators. Sustain. Sci. 2019, 14, 501–513. [Google Scholar] [CrossRef]
- Li, T.; Zhang, H.; Yuan, C.; Liu, Z.; Fan, C. A PCA-based method for construction of composite sustainability indicators. Int. J. Life Cycle Assess. 2012, 17, 593–603. [Google Scholar] [CrossRef]
- Ziaja, S. What do fragility indices measure? Z. Für Vgl. Polit. 2012, 6, 39–64. [Google Scholar] [CrossRef]
- Ringnér, M. What is principal component analysis? Nat. Biotechnol. 2008, 26, 303–304. [Google Scholar] [CrossRef]
- Lever, J.; Krzywinski, M.; Altman, N. Principal component analysis. Nat. Methods 2017, 14, 641–642. [Google Scholar] [CrossRef]
- Abdi, H.; Williams, L.J. Principal component analysis. WIREs Comput. Stat. 2010, 2, 433–459. [Google Scholar] [CrossRef]
- Dunteman, G. Principal Components Analysis; SAGE Publications: Thousand Oaks, CA, USA, 1989. [Google Scholar]
- World Bank Group. World Development Indicators; World Bank: Washington, DC, USA, 2019. [Google Scholar]
- Stevens, J. Applied Multivariate Statistics for the Social Sciences; Lawrence Erlbaum Associates: Hillsdale, NJ, USA, 1986. [Google Scholar]
- Jolliffe, I.T. Principal Component Analysis, 2nd ed.; Springer: Berlin/Heidelberg, Germany, 2002. [Google Scholar]
- Kaiser, H.F. The application of electronic computers to factor analysis. Educ. Psychol. Meas. 1960, 20, 141–151. [Google Scholar] [CrossRef]
- Cattell, R.B. The scree test for the number of factors. Multivar. Behav. Res. 1966, 1, 245–276. [Google Scholar] [CrossRef] [PubMed]
- Ng, M.; Fleming, T.; Robinson, M.; Thomson, B.; Graetz, N.; Margono, C.; Mullany, E.C.; Biryukov, S.; Abbafati, C.; Abera, S.F.; et al. Global, regional, and national prevalence of overweight and obesity in children and adults during 1980–2013: A systematic analysis for the Global Burden of Disease Study 2013. Lancet 2014, 384, 766–781. [Google Scholar] [CrossRef]
- Sachs, J.; Schmidt-Traub, G.; Kroll, C.; Lafortune, G.; Fuller, G. Sustainable Development Report 2019; Bertelsmann Stiftung and Sustainable Development Solutions Network (SDSN): New York, NY, USA, 2019. [Google Scholar]
- Alvaredo, F.; Chancel, L.; Piketty, T.; Saez, E.; Zucman, G. Global Inequality Dynamics: New Findings from WID.world. Am. Econ. Rev. 2017, 107, 404–409. [Google Scholar] [CrossRef]
- Banerjee, A.V.; Duflo, E. Poor Economics: A Radical Rethinking of the Way to Fight Global Poverty; Public Affairs: New York, NY, USA, 2011. [Google Scholar]
- Duflo, E. Women Empowerment and Economic Development. J. Econ. Lit. 2012, 50, 1051–1079. [Google Scholar] [CrossRef]
- Gates, S.; Hegre, H.; Nygård, H.M.; Strand, H. Development Consequences of Armed Conflict. World Dev. 2012, 40, 1713–1722. [Google Scholar] [CrossRef]
- Kotsadam, A.; Østby, G. Armed conflict and maternal mortality: A micro-level analysis of sub-Saharan Africa, 1989–2013. Soc. Sci. Med. 2019, 239, 112526. [Google Scholar] [CrossRef]
- United Nations. The Sustainable Development Goals Report 2020; United Nations: New York, NY, USA, 2020. [Google Scholar]
- Skvarciany, V.; Jurevičienė, D.; Volskytė, G. Assessment of Sustainable Socioeconomic Development in European Union Countries. Sustainability 2020, 12, 1986. [Google Scholar] [CrossRef]
- Lapinskaite, I.; Skvarciany, V.; Janulevicius, P. Impact of Investment Sources for Sustainability on a Country’s Sustainable Development: Evidence from the EU. Sustainability 2020, 12, 2421. [Google Scholar] [CrossRef]
- Gizelis, T.I.; Cao, X. A security dividend: Peacekeeping and maternal health outcomes and access. J. Peace Res. 2020. [Google Scholar] [CrossRef]
- Lall, R. How Multiple Imputation Makes a Difference. Political Anal. 2016, 24, 414–433. [Google Scholar] [CrossRef]
- Rubin, D.B. Inference and missing data. Biometrika 1976, 63, 581–592. [Google Scholar] [CrossRef]
- Honaker, J.; King, G.; Blackwell, M. AMELIA II: A Program for Missing Data; R Package Version 1.7.5; R Package Vignette: Madison, WI, USA, 2018. [Google Scholar]
- Islami, F.; Torre, L.A.; Jemal, A. Global trends of lung cancer mortality and smoking prevalence. Transl. Lung Cancer Res. 2015, 4, 327–338. [Google Scholar] [CrossRef]
- Rehm, J.; Eschmann, S. Global monitoring of average volume of alcohol consumption. Soz. Präv. 2002, 47, 48–58. [Google Scholar] [CrossRef]
- Bosch, X. Female genital mutilation in developed countries. Lancet 2001, 358, 1177–1179. [Google Scholar] [CrossRef]
- Shuai, C.; Chen, X.; Wu, Y.; Zhang, Y.; Tan, Y. A three-step strategy for decoupling economic growth from carbon emission: Empirical evidences from 133 countries. Sci. Total Environ. 2019, 646, 524–543. [Google Scholar] [CrossRef]
Figure 1.
Principal Component Analysis for SDG 2: Zero Hunger. Indicators: PC2—‘Zero Hunger’ Principal Component for SDG 2; 2.1.1—Prevalence of undernourishment (reversed); 2.2.1—Prevalence of stunting (height for age less than 2 standard deviation from the median of the World Health Organization (WHO) Child Growth Standards) among children under 5 years of age (reversed); 2.2.2—Prevalence of malnutrition (weight for height more than 2 or less than −2 standard deviation from the median of the WHO Child Growth Standards) among children under 5 years of age, by type (wasting and overweight) (reversed).
Figure 2.
Principal Component Analysis for SDG 7: Affordable and Clean Energy. Indicators: PC 7—‘Affordable and Clean Energy’ Principal Component for SDG 7; 7.1.1—Proportion of population with access to electricity; 7.1.2—Proportion of population with primary reliance on clean fuels and technology; 7.2.1—Renewable energy share in the total final energy consumption; 7.3.1—Energy intensity measured in terms of primary energy and GDP.
Figure 3.
Principal Component Analysis for SDG 10: Reduced inequalities. Indicators: PC 10—‘Reduced inequalities’ component for SDG 10; 10.1.1—Growth rates of household expenditure or income per capita among the bottom 40 per cent of the population; 10.b.1—Total resource flows for development, by recipient and donor countries and type of flow (e.g., official development assistance, foreign direct investment and other flows).
Figure 4.
Change over time in the sustainable development goal components (PC), 2000–2016.
Figure 4.
Change over time in the sustainable development goal components (PC), 2000–2016.
Figure 5.
SDGs: Correlations between extracted principal components in levels (a) and change (b). (a) Correlation Matrix for all SDGs, (b) Correlation for 2000–2016 period of time change for all SDGs.
Figure 5.
SDGs: Correlations between extracted principal components in levels (a) and change (b). (a) Correlation Matrix for all SDGs, (b) Correlation for 2000–2016 period of time change for all SDGs.
Figure 6.
PC10: Reduced Inequalities versus SPC1: Super-component for all SDGs, globally for 2016; GNB—Guinea-Bissau, RUS—Russia, IDN—Indonesia, BFA—Burkina Faso, PAK—Pakistan, LBN—Lebanon, AFG—Afghanistan, COD—Democratic Republic of Congo, ZWE—Zimbabwe, SGP—Singapore, HKG—Hong Kong, MLT—Malta, ARE—United Arab Emirates, SVK—Slovak Republic, BLR—Belarus, SVN—Slovenia, MEX- Mexico, SRB—Serbia, USA—United States.
Table 1.
Dimensions and trade-offs within each SDG (SDGs 1–17) as well as within the entire SDG agenda (SPC1).
Table 1.
Dimensions and trade-offs within each SDG (SDGs 1–17) as well as within the entire SDG agenda (SPC1).
| SDG | Eigenvalues | Trade-Offs |
|---|
| SDG 1: No poverty | 1.73; 0.76; 0.49 | None |
| SDG 2: Ending hunger | 1.76; 0.83; 0.40 | 2.2.2 vs. PC2 |
| SDG 3: Good health and well-being | 6.86; 1.52; 1.24 | 43.5.2 and 3.a.1 vs. PC3 |
| SDG 4: Quality education | 1.63; 0.37 | None |
| SDG 5: Gender equality | 1.76; 1.03; 0.92 | 5.b.1 vs. PC5 |
| SDG 6: Clean water and sanitation | 1.81; 0.99; 0.19 | None |
| SDG 7: Affordable and Clean Energy | 2.67; 0.82; 0.31 | 7.2.1 vs. PC7 |
| SDG 8: Decent work and economic growth | 2.43; 1.43; 1.25 | None |
| SDG 9: Industry, innovation and infrastructure | 1.39; 0.99; 0.76 | 9.4.1 vs. PC9 |
| SDG 10: Reduced inequalities | 1.08; 0.91 | None |
| SDG 11: Sustainable cities and communities | 1.17; 0.83 | None |
| SDG 12: Responsible consumption | | None |
| SDG 13: Climate action | | None |
| SDG 14: Life below water | 1.73; 0.76; 0.49 | None |
| SDG 15: Life on land | 1.03; 0.97 | None |
| SDG 16: Peace and strong institutions | 1.05; 0.99; 0.96 | None |
| SDG 17: Partnership for the goals | 2.22; 1.23; 1.08 | 17.2.1, 17.3.2 vs. PC17 |
| SPC1: Super-component extracted from all 17 SDGs | 7.41; 1.09; 1.06 | SDG 10 vs. SPC1 |
| Publisher’s Note: MDPI stays neutral with regard to jurisdictional claims in published maps and institutional affiliations. |
© 2020 by the authors. Licensee MDPI, Basel, Switzerland. This article is an open access article distributed under the terms and conditions of the Creative Commons Attribution (CC BY) license (http://creativecommons.org/licenses/by/4.0/).


