Key Indicators for Linguistic Action Perspective in the Last Planner® System


Abstract
1. Introduction
1.1. Context
1.2. Need and Relevance of Research
1.3. State of the Art and Practice
1.4. Research Purpose and Why It Is New Knowledge
2. Research Method
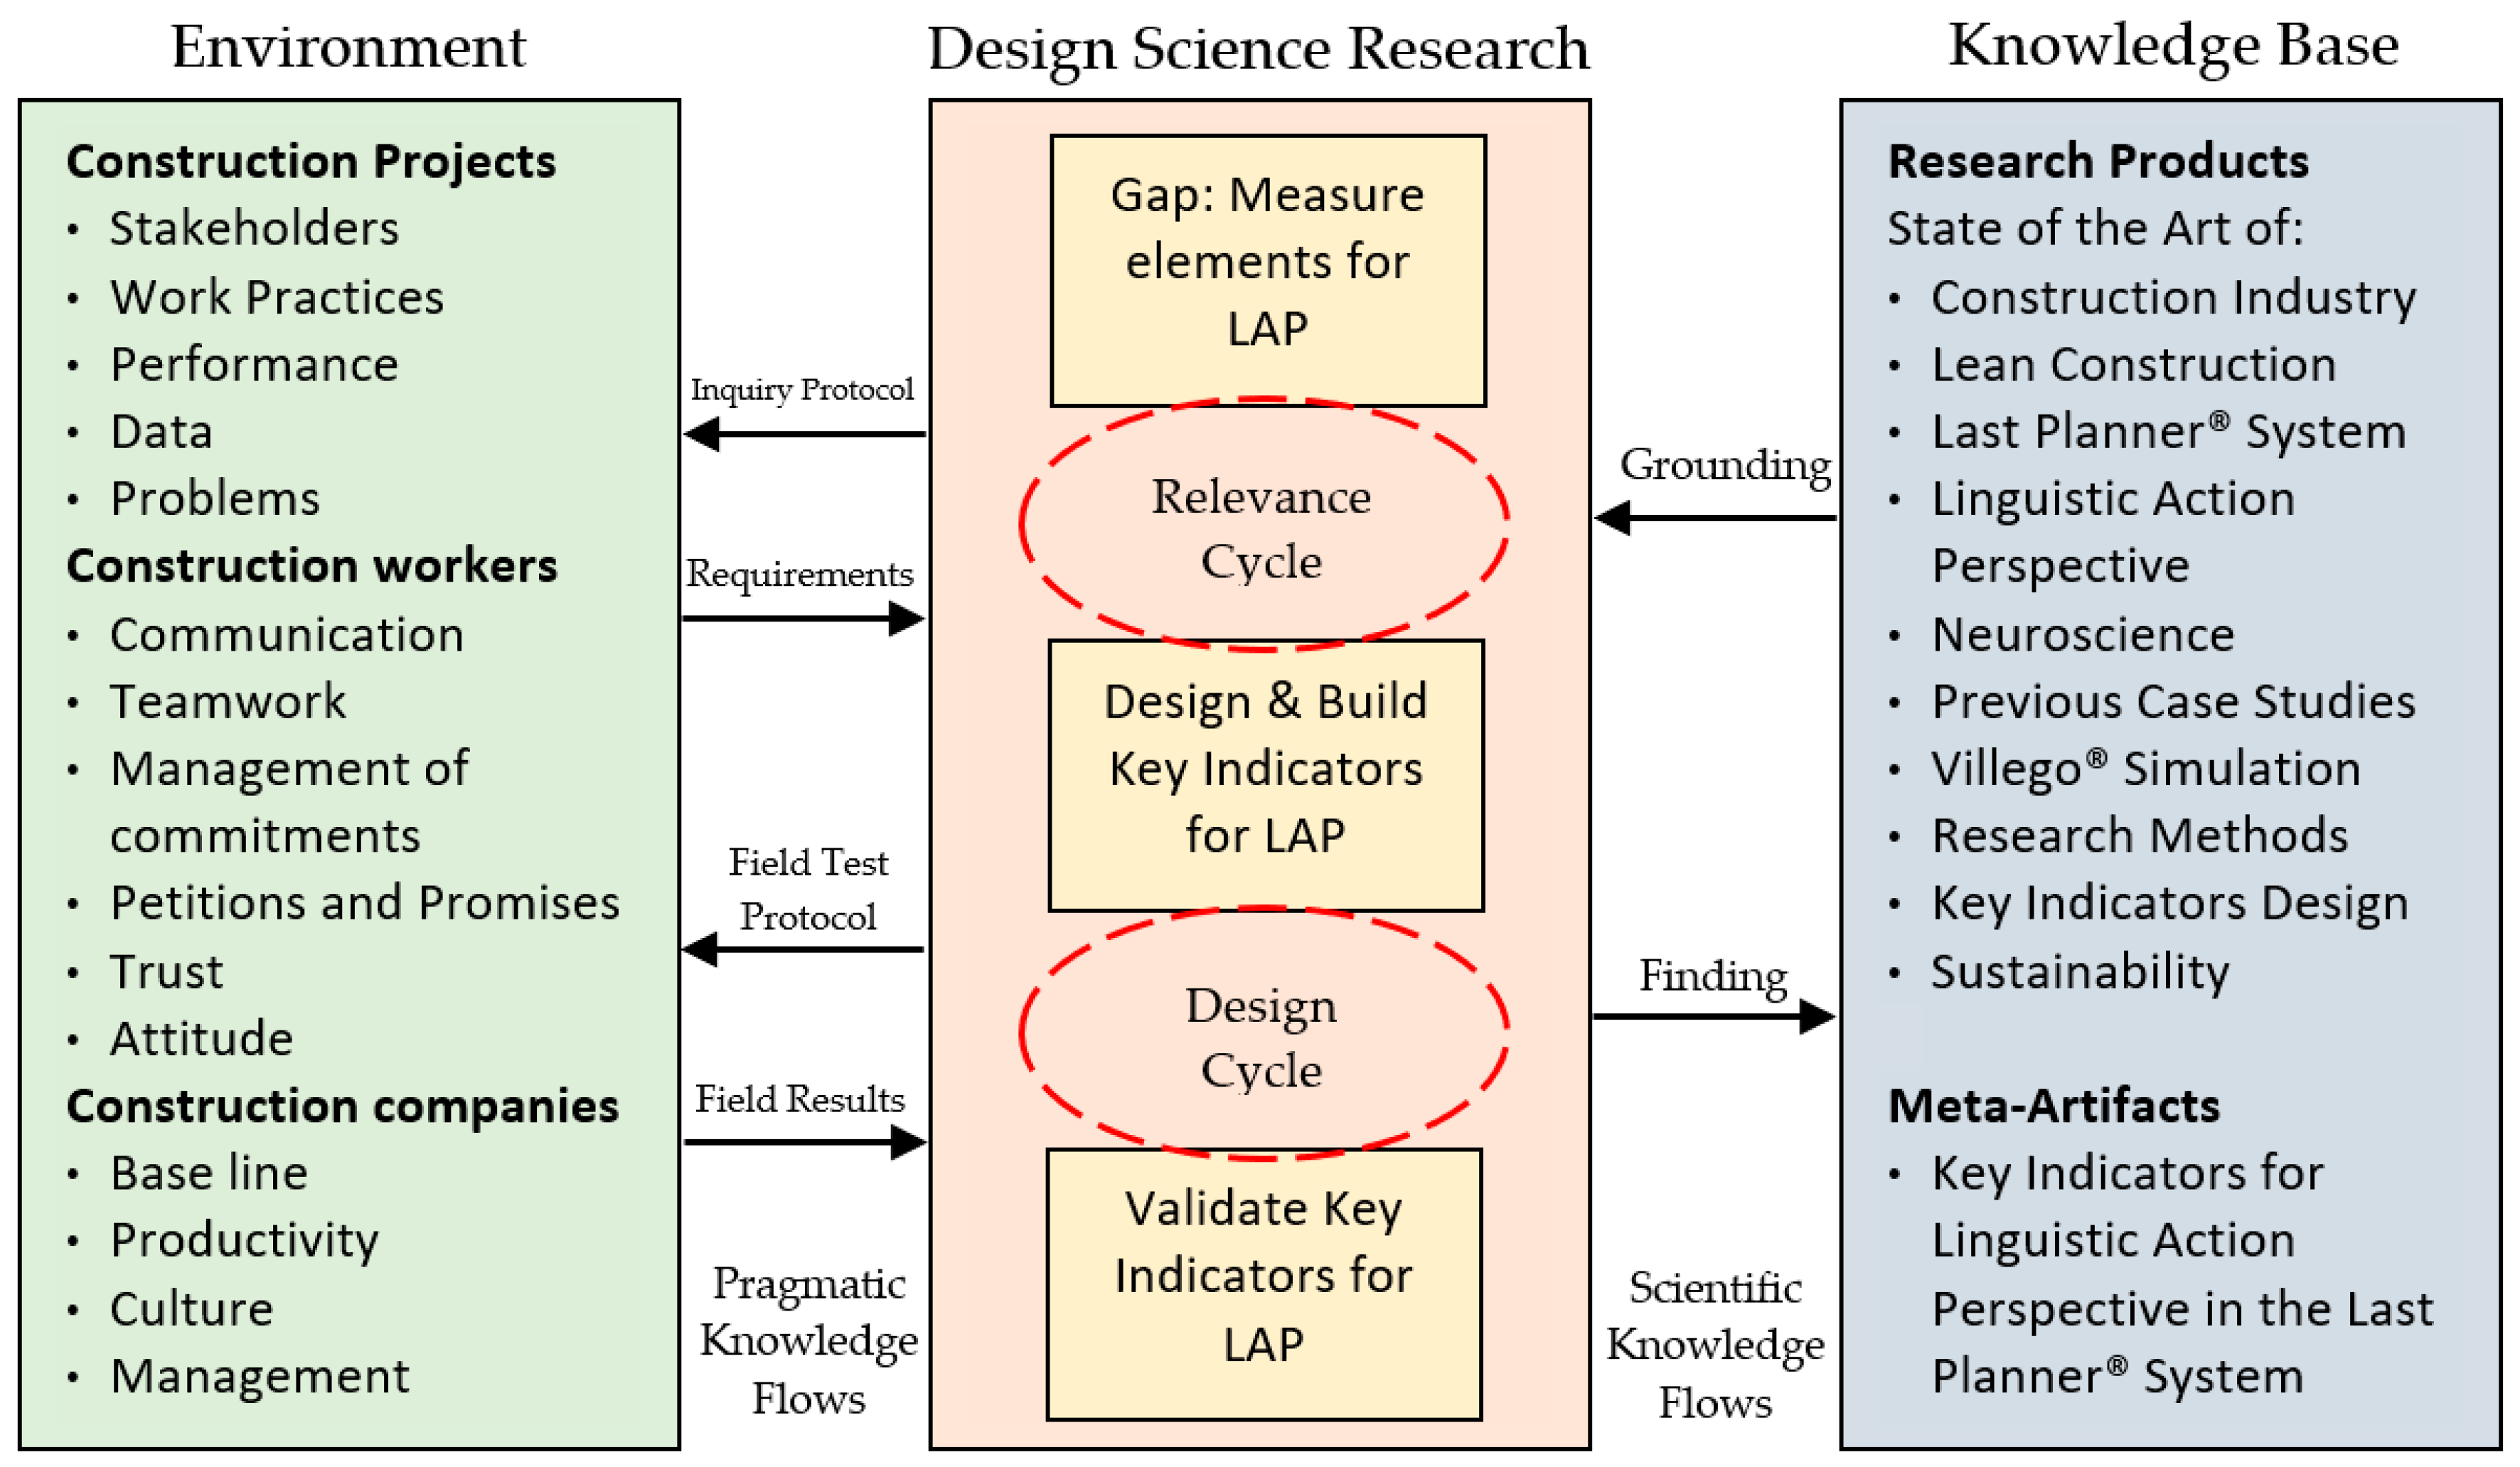
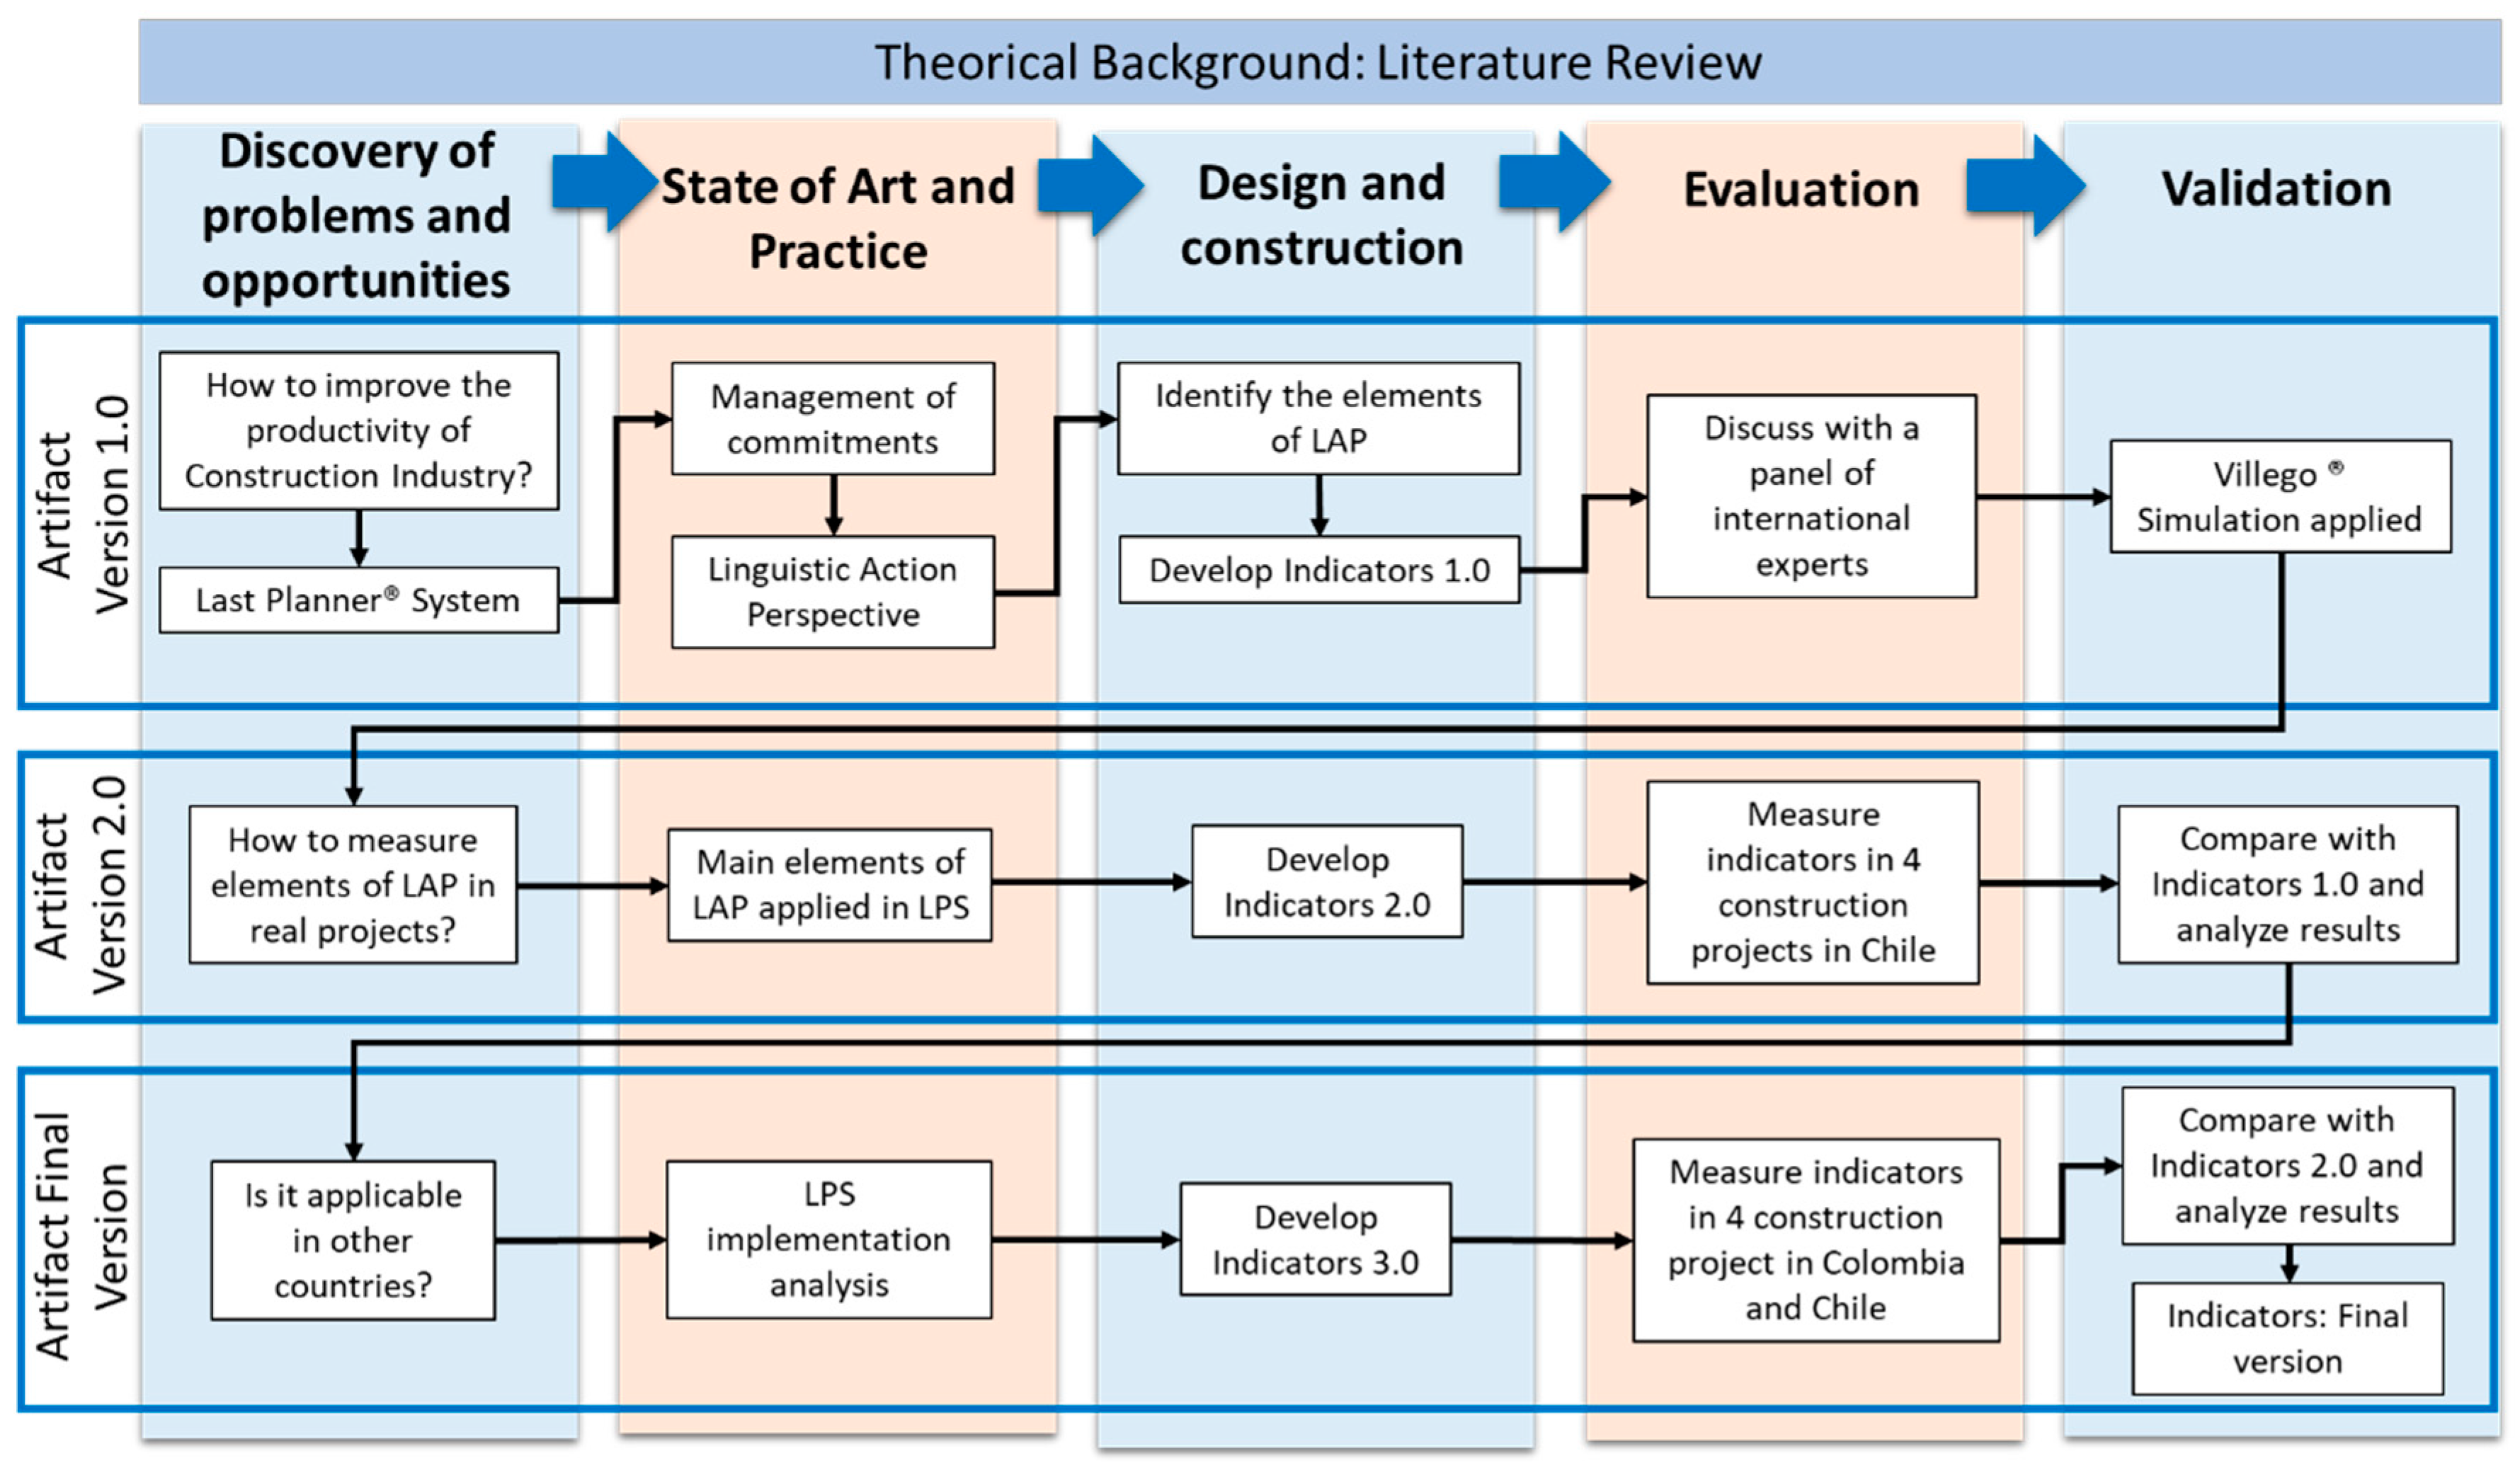
2.1. Design Science Research
- Discovery of problems and opportunities, through exhaustive analysis of the context.
- Deep understanding of the subject, state of the art and practice.
- Design and construction of artifact (indicators system), through constant iteration.
- Evaluation of the solution to find a satisfactory solution (which fulfills its function).
- Validation of artifact, through practical application and analysis of results.
2.2. Identification of the Problem
2.3. Creation of Indicators: Version 1.0
- To study the Linguistic Action Perspective, to generate a knowledge base, based mainly on Flores [25].
- To identify the elements of this perspective that were potentially quantifiable, creating a list of concepts and data to be measured. Mainly aspects of the commitments, requests, promises and foundations of trust.
- To discuss with a panel of international experts (Linguistic Action in Last Planner System Group) the feasibility of measuring and controlling these indicators, which allows improving the initial design. This panel consisted of academics from University of California-Berkeley, PhD students, a Master with a degree in linguistics, and Senior Lean consultants.
- To validate proposed indicators, verifying the feasibility of observing these indicators utilizing a Villego® Simulation applied to a group of students as a pilot test to validate them through the Environment in a controlled situation.
2.4. Pilot Application-Villego® Simulation
2.4.1. First Round Villego® Simulation
2.4.2. Second Round Villego® Simulation
2.5. Indicators Validation: Version 1.0
2.6. Creation of Indicators: Version 2.0
- Identify the main elements of this Perspective that could be quantifiable and applied in LPS, taking the Indicators 1.0 as reference.
- Develop Indicators System 2.0 from the improvement of version 1.0 through the Design Science Research.
- Measure the proposed indicators in four construction projects in Chile to evaluate them through the Environment in a typical construction situation. Researchers recorder analyzed videotapes of weekly meetings and interviewed participants when necessary to assess each commitment for each proposed indicator.
- Validate the proposed Indicators System, comparing with version 1.0, and analyzing the results.
- 1.
- Proposal to eliminate indicators:
- The authors proposed not to measure the percentage of verification of the availability of performers in execution because most of the foremen verify the availability of their workers after the weekly meeting and in the field huddle, and these indicators are designed to be measured exclusively in weekly planning meetings.
- We proposed to eliminate the percentage of incomplete requests and promises because it is confusing to measure it in the field.
- Finally, we proposed to eliminate the percentage of compliance of the performer’s competence because it is associated with the worker’s curriculum vitae, and it is not possible to measure in the weekly meeting. It can only be associated with the correct fulfillment of each commitment or PPC (Percent Plan Complete).
- 2.
- Proposal to change the indicators:
- The authors proposed modifying the percentage of declaration of the importance of each commitment because they consider it more appropriate to use the word “priority,” so the indicator should be renamed as percentage of declaration of the priority of commitment. This change is proposed because it is necessary to deepen the conditions of satisfaction of the most relevant commitments. For more details, see Table 2, which borrows the Indicators System found in Salazar et al. 2019 [36].
- Further, we proposed modification of the percentage of reliability compliance because we found a point of confusion in the formula of the indicator regarding the concept of counteroffers since counteroffers occur in the same meeting, whereas the concept after the meeting is “renegotiation.” Additionally, we add “cancel” a commitment. See Table 2.
- 3.
- Measurement of original indicators:
- Table 2 shows the average results of the indicators in the four projects measured during three weeks, which incorporate the changes that we mentioned in version 1.0.
- 4.
- Newly proposed indicators:
2.7. Application in Construction Projects
2.8. Indicators Validation: Version 2.0
2.9. Creation of Indicators: Final Version
- Deepen the analysis of the implementation of the Last Planner® System and the Linguistic Action Perspective to generate a Knowledge Base.
- Identify the key elements of this Perspective and which ones are redundant, taking the Indicators of version 2.0 as a reference.
- Develop Indicators System 3.0 from the improvements of version 2.0 through the Design Science Research.
- Measure the proposed indicators in four construction projects, two in Chile (a project of 24 houses and 22-story building) and two in Colombia (a 21-story building and a 23-story building), to evaluate them through the different construction Environment. For the above, the authors recorded and then analyzed videotapes of weekly meetings and interviewed participants when necessary to evaluate each commitment for each proposed indicator.
- Validate the proposed Indicators System, comparing with version 2.0, and analyzing the results.
- 1.
- Proposal to eliminate indicators:
- The authors propose not to measure the percentage of definition of roles and responsibilities of the performers because we realized that the roles (Who) are intrinsically established in the LPS weekly meeting structure. Concerning the responsibilities (What), this should be part of the correct fulfillment of the request, so it is incorporated into the % of fulfillment of a request.
- Plus, we propose to eliminate the percentage of fulfillment of roles and responsibilities of performers, where the performer and not another one fulfills the promise and declares compliance to the client, because it is not possible to measure it directly. In general, in construction works, the performer does not commit, the one who commits is the head of the performer (foreman) [36].
- Finally, we propose to eliminate the percentage of verification of the availability of performers in agreements because this verification should be carried out in the stage of negotiation and agreements. The client must request the agenda of the executor (workers) form the foreman. Therefore, it is incorporated into percentage of compliance negotiations and agreements.
- 2.
- Proposal to expand indicators:
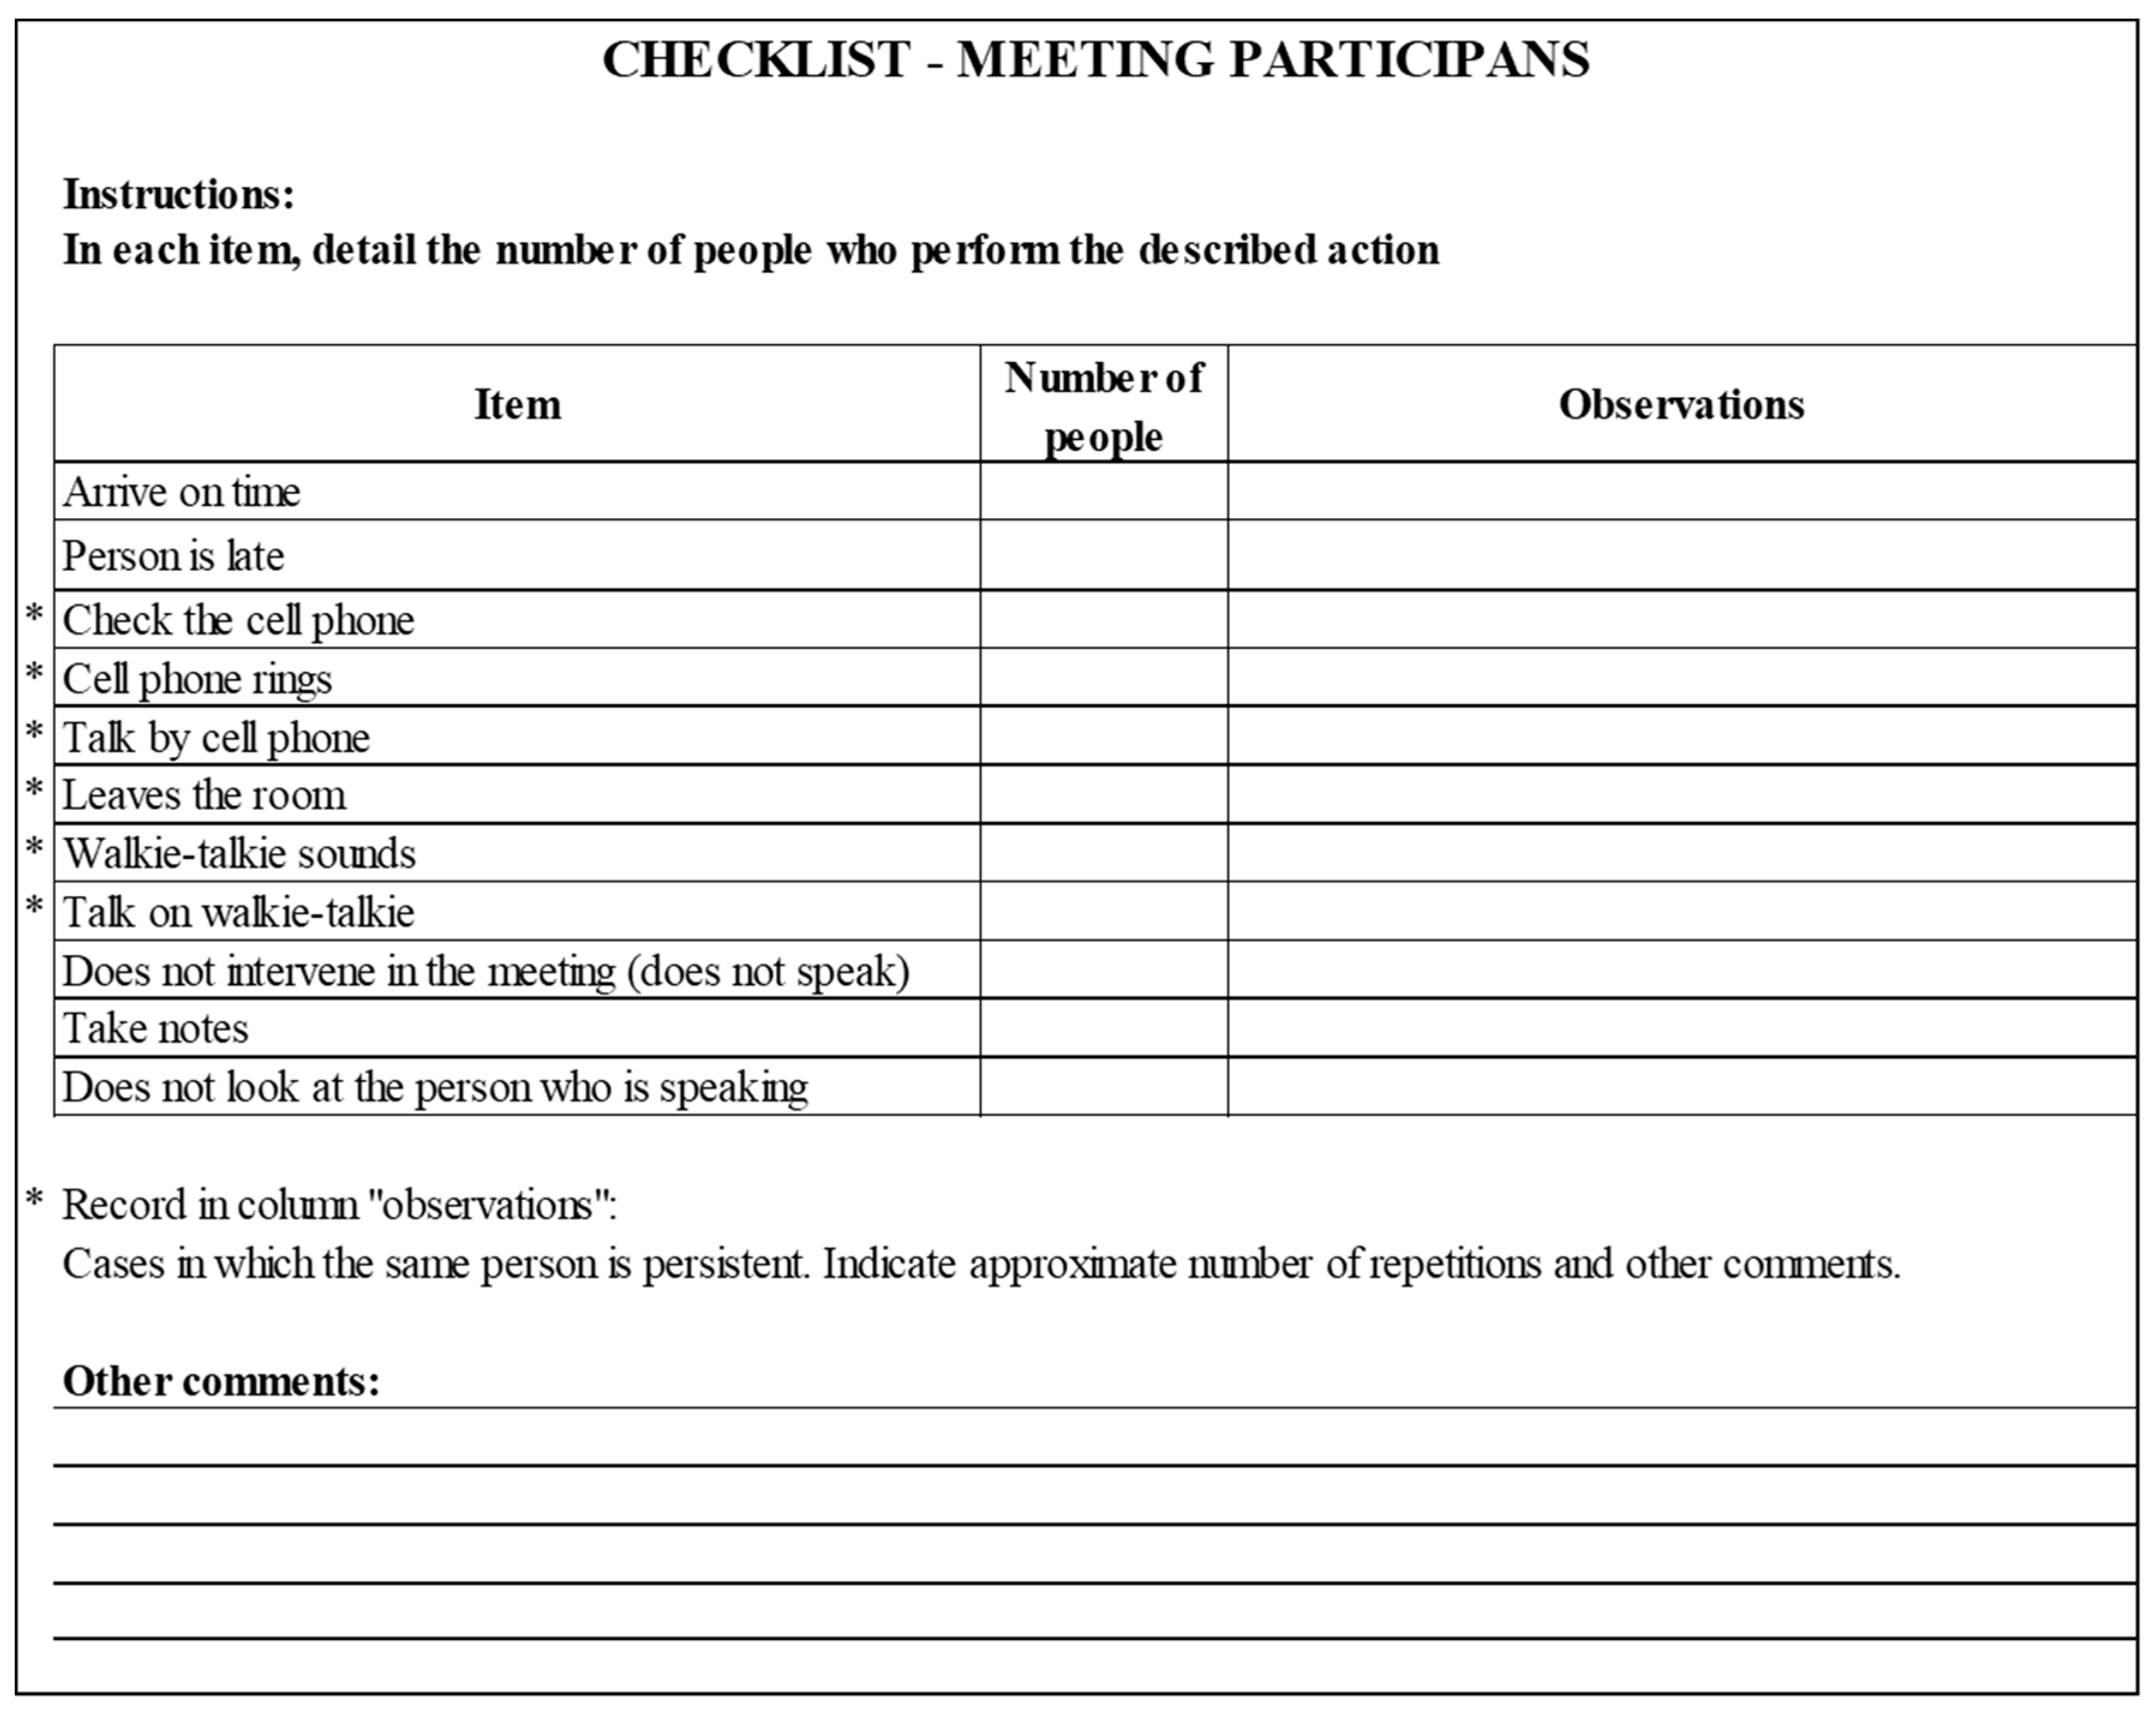
- The authors propose to clarify the indicator percentage of engaged participants, providing that in the previous publications it was not defined precisely what would be considered as “engaged.” Thence, we want to mention the key aspects to consider in this indicator, participants must:
- ○
- Arrive on time (maximum 5 min late);
- ○
- Avoid interaction with the cell phone (do not check, speak or ring the cell phone);
- ○
- Remain in the room;
- ○
- Avoid interacting with a walkie-talkie (not talking, hopefully off or at a volume that does not interrupt others);
- ○
- Intervene in the meeting;
- ○
- Take notes;
- ○
- Look at the person who is speaking.
2.10. Application in Another Country
- 25% of compliance network or chain of commitments: (1) The preparation of the petition is observed. (2) Although a negotiation process is observed, it must be improved. (3) There is a declaration of compliance although it must be measured in the field. (4) The declaration of satisfaction must be worked out by the team.
- 93% of fulfillment of a request: In general, roles are defined intrinsically: client requests and performers agree. Regarding responsibilities, the scope of the commitment is not always clearly established.
- 55% of compliance negotiation and agreements: The generation of agreements must be strengthened and the imposition by the client avoided. Currently, the performer assumes the order established by the client. We did not delve into the fact that the client must consult the executor’s (workers) agenda with the foreman.
- 66% of declarations of compliance with the commitment: Before each weekly meeting, the investigators verified that there was a considerable percentage of declaration of compliance with commitments, through several questions to the clients and performers. However, there were performers who did not inform clients that they had finished with the assigned task.
- 48% of fulfillment declaration of satisfaction: We consider that work should be done on this indicator, since we observed that in general, it only indicated if the commitment was fulfilled or not, without giving feedback to the performer.
- 6% of declaration of the priority of commitment: In general, the priority of the commitments was not declared. This must be worked on to allow the foremen to carry out adequate planning regarding the order of execution of the assumed commitments.
- 20% of compliance with priority commitments: We consider this result exceptional because it is very important to comply with the commitments declared as priorities. In this case, what happened was that a contractor did not comply with the commitments, despite the fact that they had been informed as priorities (a contractor who presented delays throughout the project and had problems with the management). It is very important to note that we expect this percentage to always be close to 100%.
- 66% of specified deadlines: In general, only the date is specified, but not if it will be completed in the morning or in the afternoon.
- 0% of unnecessary requests: No unnecessary requests on the meetings. According to the workers, the foremen often make unnecessary requests on the field.
- 68% of reliability compliance: This indicator complements the PPC with additional movements, which occur after the initial deal. In this case we consider that there is important room for improvement.
- 0% of revoked commitments: No commitments revoked after the weekly meetings.
- 1% of renegotiated commitments: Practically no renegotiation of commitments after the weekly meetings.
- 0% of canceled commitments: No commitments cancelled after the weekly meetings.
- 61% of engaged participants: Regarding this indicator, we can detail by the average percentages obtained with the Check List—Meeting participants (see Appendix A): 75% of the participants arrived on time, 18% checked the cell phone, 2% of them had their walkie-talkie make sounds, 19% left the meeting room, 22% did not intervene, 50% made notes and 100% looked at the person who was speaking.
2.11. Indicators Validation: Final Version
3. Analysis of Results
4. Discussion
4.1. Comments on the Results Obtained
4.2. Lessons Learned from the Methodology Used
4.3. Scope of the Research
5. Conclusions
5.1. Summary
5.2. Contributions
5.3. Limitations
5.4. Future Research
Author Contributions
Funding
Acknowledgments
Conflicts of Interest
Appendix A

Appendix B

References
- Koskela, L. An Exploration towards a Production Theory and its Application to Construction; Helsinki University of Technology: Espoo, Finland, 2000. [Google Scholar]
- Kapelko, M.; Abbott, M. Productivity Growth and Business Cycles: Case Study of the Spanish Construction Industry. J. Constr. Eng. Manag. 2017, 143, 05016026. [Google Scholar] [CrossRef]
- World Economic Forum Shaping the Future of Construction: A Breakthrough in Mindset and Technology. Available online: http://www3.weforum.org/docs/WEF_Shaping_the_Future_of_Construction_full_report__.pdf (accessed on 16 October 2020).
- González, V.; Alarcón, L.F.; Maturana, S.; Mundaca, F.; Bustamante, J. Improving planning reliability and project performance using the reliable commitment model. J. Constr. Eng. Manag. 2010, 136, 1129–1139. [Google Scholar] [CrossRef]
- Womack, J.P.; Jones, D.T. Lean Thinking: Banish Waste and Create Wealth in your Corporation; Free Press: New York, NY, USA, 2003. [Google Scholar]
- Koskela, L. Application of the New Production Philosophy to Construction; Stanford University: Stanford, CA, USA, 1992; Volume 72. [Google Scholar]
- World Commission on Environment and Development (WCED). Our Common Future; Oxford University: Oxford, UK, 1987; ISBN 9780192820808. [Google Scholar]
- Department of Economic and Social Affairs. United Nations Goal 12. Available online: https://sdgs.un.org/goals/goal12 (accessed on 14 October 2020).
- Arroyo, P.; Tommelein, I.D.; Ballard, G. Comparing Multi-Criteria Decision-Making Methods to Select Sustainable Alternatives in the AEC Industry. In Proceedings of the International Conference on Sustainable Design, Engineering, and Construction 2012, Fort Worth, TX, USA, 7–9 November 2012; pp. 869–876. [Google Scholar]
- Tasdemir, C.; Gazo, R. A Systematic Literature Review for Better Understanding of Lean Driven Sustainability. Sustainability 2018, 10, 2544. [Google Scholar] [CrossRef]
- de Carvalho, A.; Granja, A.; da Silva, V. A Systematic Literature Review on Integrative Lean and Sustainability Synergies over a Building’s Lifecycle. Sustainability 2017, 9, 1156. [Google Scholar] [CrossRef]
- Zhang, B.; Niu, Z.; Liu, C. Lean Tools, Knowledge Management, and Lean Sustainability: The Moderating Effects of Study Conventions. Sustainability 2020, 12, 956. [Google Scholar] [CrossRef]
- Salem, O.; Solomon, J.; Genaidy, A.; Minkarah, I. Lean construction: From theory to implementation. J. Manag. Eng. 2006, 22, 168–175. [Google Scholar] [CrossRef]
- Ballard, G.; Howell, G.A. Toward construction JIT. In Lean Construction; Alarcón, L., Ed.; Balkema Publishers: Rotterdam, The Netherlands, 1997; pp. 291–300. ISBN 9054106484. [Google Scholar]
- Ballard, G.; Howell, G.A. An Update on Last Planner. In Proceedings of the 11th Annual Conference of the International Group for Lean Construction, Blacksburg, VA, USA, 22–24 July 2003; pp. 1–13. [Google Scholar]
- Daniel, E.I.; Pasquire, C.; Dickens, G. Exploring the implementation of the last planner® system through iglc community: Twenty one years of experience. In Proceedings of the IGLC 23rd Annual Conference of the International Group for Lean Construction, Perth, Australia, 29–31 July 2015; pp. 153–162. [Google Scholar]
- Ballard, G. The Last Planner. In Proceedings of the Northern California Construction Institute Spring Conference, Monterey, CA, USA, 26–28 July 1994. [Google Scholar]
- Ballard, G.; Tommelein, I. Current Process Benchmark for the Last Planner(R) System. Lean Constr. J. 2016, 89, 57–89. [Google Scholar]
- Goldratt, E.M.; Cox, J. La meta, un Proceso de Mejora Continua; Ediciones Granica, S.A., Ed.; Tercera: Mexico, 2013; ISBN 9789506418069. [Google Scholar]
- O’Brien, W.J.; Formoso, C.T.; Vrijhoef, R.; London, K.A. Construction Supply Chain Management Handbook; CRC Press: Boca Raton, FL, USA, 2008. [Google Scholar]
- Alves, T.C.L.; Tommelein, I.D. Buffering and batching practices in the HVAC industry. In Proceedings of the 11th Annual Conference of the International Group for Lean Construction (IGLC), Blacksburg, VA, USA, 22–24 July 2003. [Google Scholar]
- Rodríguez, A.D.; Alarcón, L.F.; Pellicer, E. La gestión de la obra desde la perspectiva del último planificador. Rev. Obras Públicas 2011, 158, 35–44. [Google Scholar]
- Howell, G.A.; Macomber, H.; Koskela, L.; Draper, J. Leadership and Project Management: Time for a Shift from Fayol to Flores. In Proceedings of the 12th Annual Conference of the International Group for Lean Construction, Helsingør, Denmark, 3–5 August 2004. [Google Scholar]
- Salazar, L.A.; Ballard, G.; Arroyo, P.; Alarcón, L.F. Indicators for Observing Elements of Linguistic Action Perspective in Last Planner® System. In Proceedings of the 26th Annual Conference of the International. Group for Lean Construction (IGLC), Chennai, India, 18–20 July 2018; pp. 402–411. [Google Scholar]
- Flores, F. Conversaciones Para la Acción: Inculcando una Cultura de Compromiso en Nuestras Relaciones de Trabajo (Conversations for Action and Collected Essays: Instilling a Culture of Commitment in Working Relationships); Flores, M., Ed.; Primera; Lemoine Editores: Bogotá, Colombia, 2015; ISBN 978-958-98664-9-8. [Google Scholar]
- Austin, J.L. How to Do Things with Words, 2nd ed.; Oxford University Press: New York, NY, USA, 1975; ISBN 9780198245537. [Google Scholar]
- Searle, J.R. Speech Acts: An Essay in the Philosophy of Language; Cambridge University Press: Cambridge, UK, 1969; Volume 626. [Google Scholar]
- Searle, J.R. A Taxonomy of Illocutionary Acts; University Minnesota Press: Minneapolis, MN, USA, 1975; Volume 7, pp. 344–369. [Google Scholar]
- Shahhoseiny, H. Differences between language and linguistic in the ELT classroom. Theory Pract. Lang. Stud. 2013, 3, 2234–2239. [Google Scholar] [CrossRef]
- Isatto, E.L.; Azambuja, M.; Formoso, C.T. The Role of Commitments in the Management of Construction Make-to-Order Supply Chains. J. Manag. Eng. 2015, 31, 04014053. [Google Scholar] [CrossRef]
- Viana, D.D.; Formoso, C.T.; Isatto, E.L. Understanding the theory behind the Last Planner System using the Language-Action Perspective: Two case studies. Prod. Plan. Control 2017, 28, 177–189. [Google Scholar] [CrossRef]
- Zegarra, O.; Alarcon, L.F. Variability propagation in the production planning and control mechanism of construction projects. Prod. Plan. Control 2017, 28, 707–726. [Google Scholar] [CrossRef]
- Macomber, H.; Howell, G.A. Linguistic Action: Contributing to the theory of lean construction. In Proceedings of the 11th Annual Meeting of the International Group for Lean Construction, Blacksburg, VA, USA, 22–24 July 2003. [Google Scholar]
- Viana, D.D.; Formoso, C.T.; Isatto, E.L. Modelling the network of commitments in the last planner system. In Proceedings of the 19th Annual Conference of the International Group for Lean Construction, Lean Construction Institute, Lima, Peru, 13–15 July 2011; Volume 2011. [Google Scholar]
- Vrijhoef, R.; Koskela, L.; Howell, G.A. Understanding construction supply chains: An alternative interpretation. In Proceedings of the 9th Annual Conference of the International Group for Lean Construction, Singapore, 6–8 August 2001; pp. 1–15. [Google Scholar]
- Salazar, L.A.; Retamal, F.; Ballard, G.; Arroyo, P.; Alarcón, L.F. Results of indicators from the Linguistic Action Perspective in the Last Planner(r) System. In Proceedings of the 27th Annual Conference of the International Group for Lean Construction (IGLC), Dublin, Ireland, 3–5 July 2019; pp. 1241–1250. [Google Scholar]
- Nunes, M.; Abreu, A. Applying Social Network Analysis to Identify Project Critical Success Factors. Sustainability 2020, 12, 1503. [Google Scholar] [CrossRef]
- Winograd, T.; Flores, F. Understanding Computers and Cognition: A New Foundation for Design; Intellect Books: Bristol, UK, 1986. [Google Scholar]
- Francis, A.; Thomas, A. Exploring the relationship between lean construction and environmental sustainability: A review of existing literature to decipher broader dimensions. J. Clean. Prod. 2020, 252, 119913. [Google Scholar] [CrossRef]
- Zarta Ávila, P. La sustentabilidad o sostenibilidad: Un concepto poderoso para la humanidad. Tabula Rasa 2018, 28, 409–423. [Google Scholar] [CrossRef]
- Arroyo, P.; Gonzalez, V. Rethinking Waste Definition to Account for Environmental and Social Impacts. In Proceedings of the 24th Annual Conference of the International Group for Lean Construction, Boston, MA, USA, 20–22 July 2016. [Google Scholar]
- Holmström, J.; Ketokivi, M.; Hameri, A.-P. Bridging Practice and Theory: A Design Science Approach. Decis. Sci. 2009, 40, 65–87. [Google Scholar] [CrossRef]
- Peffers, K.; Tuunanen, T.; Rothenberger, M.A.; Chatterjee, S. A Design Science Research Methodology for Information Systems Research. J. Manag. Inf. Syst. 2007, 24, 45–77. [Google Scholar] [CrossRef]
- Lukka, K. The constructive research approach. In Case Study Research in Logistics; Ojala, L., Hilmola, O.-P., Eds.; Publications of the Turku School of Economics and Business Administration: Turku, Finland, 2003; pp. 83–101. [Google Scholar]
- Hevner, A. A Three Cycle View of Design Science Research. Scand. J. Inf. Syst. 2007, 19, 87–92. [Google Scholar]
- Briggs, R.O.; Schwabe, G. On Expanding the Scope of Design Science in IS Research. In Proceedings of the Service-Oriented Perspectives in Design Science Research, Milwaukee, WI, USA, 5–6 May 2011; Jain, H., Sinha, A.P., Vitharana, P., Eds.; Springer: Berlin/Heidelberg, Germany, 2011; pp. 92–106. [Google Scholar]
- Ballard, H.G. The Last Planner System of Production Control. Ph.D. Thesis, The University of Birmingham, Birmingham, UK, 2000. [Google Scholar]
- Alarcón, L.F.; Diethelm, S.; Rojo, Ó. Collaborative implementation of lean planning systems in Chilean construction companies. In Proceedings of the 10th Annual Conference of the International Group for Lean Construction, Gramado, Brazil, 6–8 August 2002. [Google Scholar]
- Flyvbjerg, B. Five Misunderstandings About Case-Study Research. Qual. Inq. 2006, 12, 219–245. [Google Scholar] [CrossRef]
- Hernandez Sampieri, R.; Fernández, C.; Baptista, P. Capítulo 4. Estudios de caso (Centro de recursos en línea). In Metodología de la Investigación; 2014; p. 31. ISBN 9781456223960. Available online: https://www.researchgate.net/publication/308385754_Robert_K_Yin_2014_Case_Study_Research_Design_and_Methods_5th_ed_Thousand_Oaks_CA_Sage_282_pages (accessed on 15 October 2020).
- Yin, R.K. Case Study Research: Design and Methods. In Applied Social Research Methods, 3rd ed.; SAGE: Thousand Oaks, CA, USA, 2003; Volume 5. [Google Scholar]
- Lagos, C.; Salazar, L.A.; Alarcón, L.F. Análisis de la relación entre el nivel de implementación de Last Planner System(R) y el desempeño de proyectos de construcción. In Proceedings of the 1er Congreso Latinoamericano de Ingeniería, Entre Ríos, Argentina, 13–15 September 2017. [Google Scholar]
- Popper, K.R. The Logic of Scientific Discovery; ISSR library Routledge: Abingdon, UK, 2002; ISBN 9780415278447. [Google Scholar]
- Frank, U. Die Konstruktion möglicher Welten als Chance und Herausforderung der Wirtschaftsinformatik. In Wissenschaftstheorie und Gestaltungsorientierte Wirtschaftsinformatik; Physica-Verlag HD: Heidleburg, Germany, 2009; pp. 161–173. [Google Scholar] [CrossRef]
- Schwabe, G.; Krcmar, H. Piloting a SocioTechnical Innovation. In Proceedings of the 8th European Conference on Information Systems ECIS, Wienna, Austria, 3–5 July 2000; pp. 132–139. [Google Scholar]


| Aim | Measure Name | Description | Formula | Means of Verification |
|---|---|---|---|---|
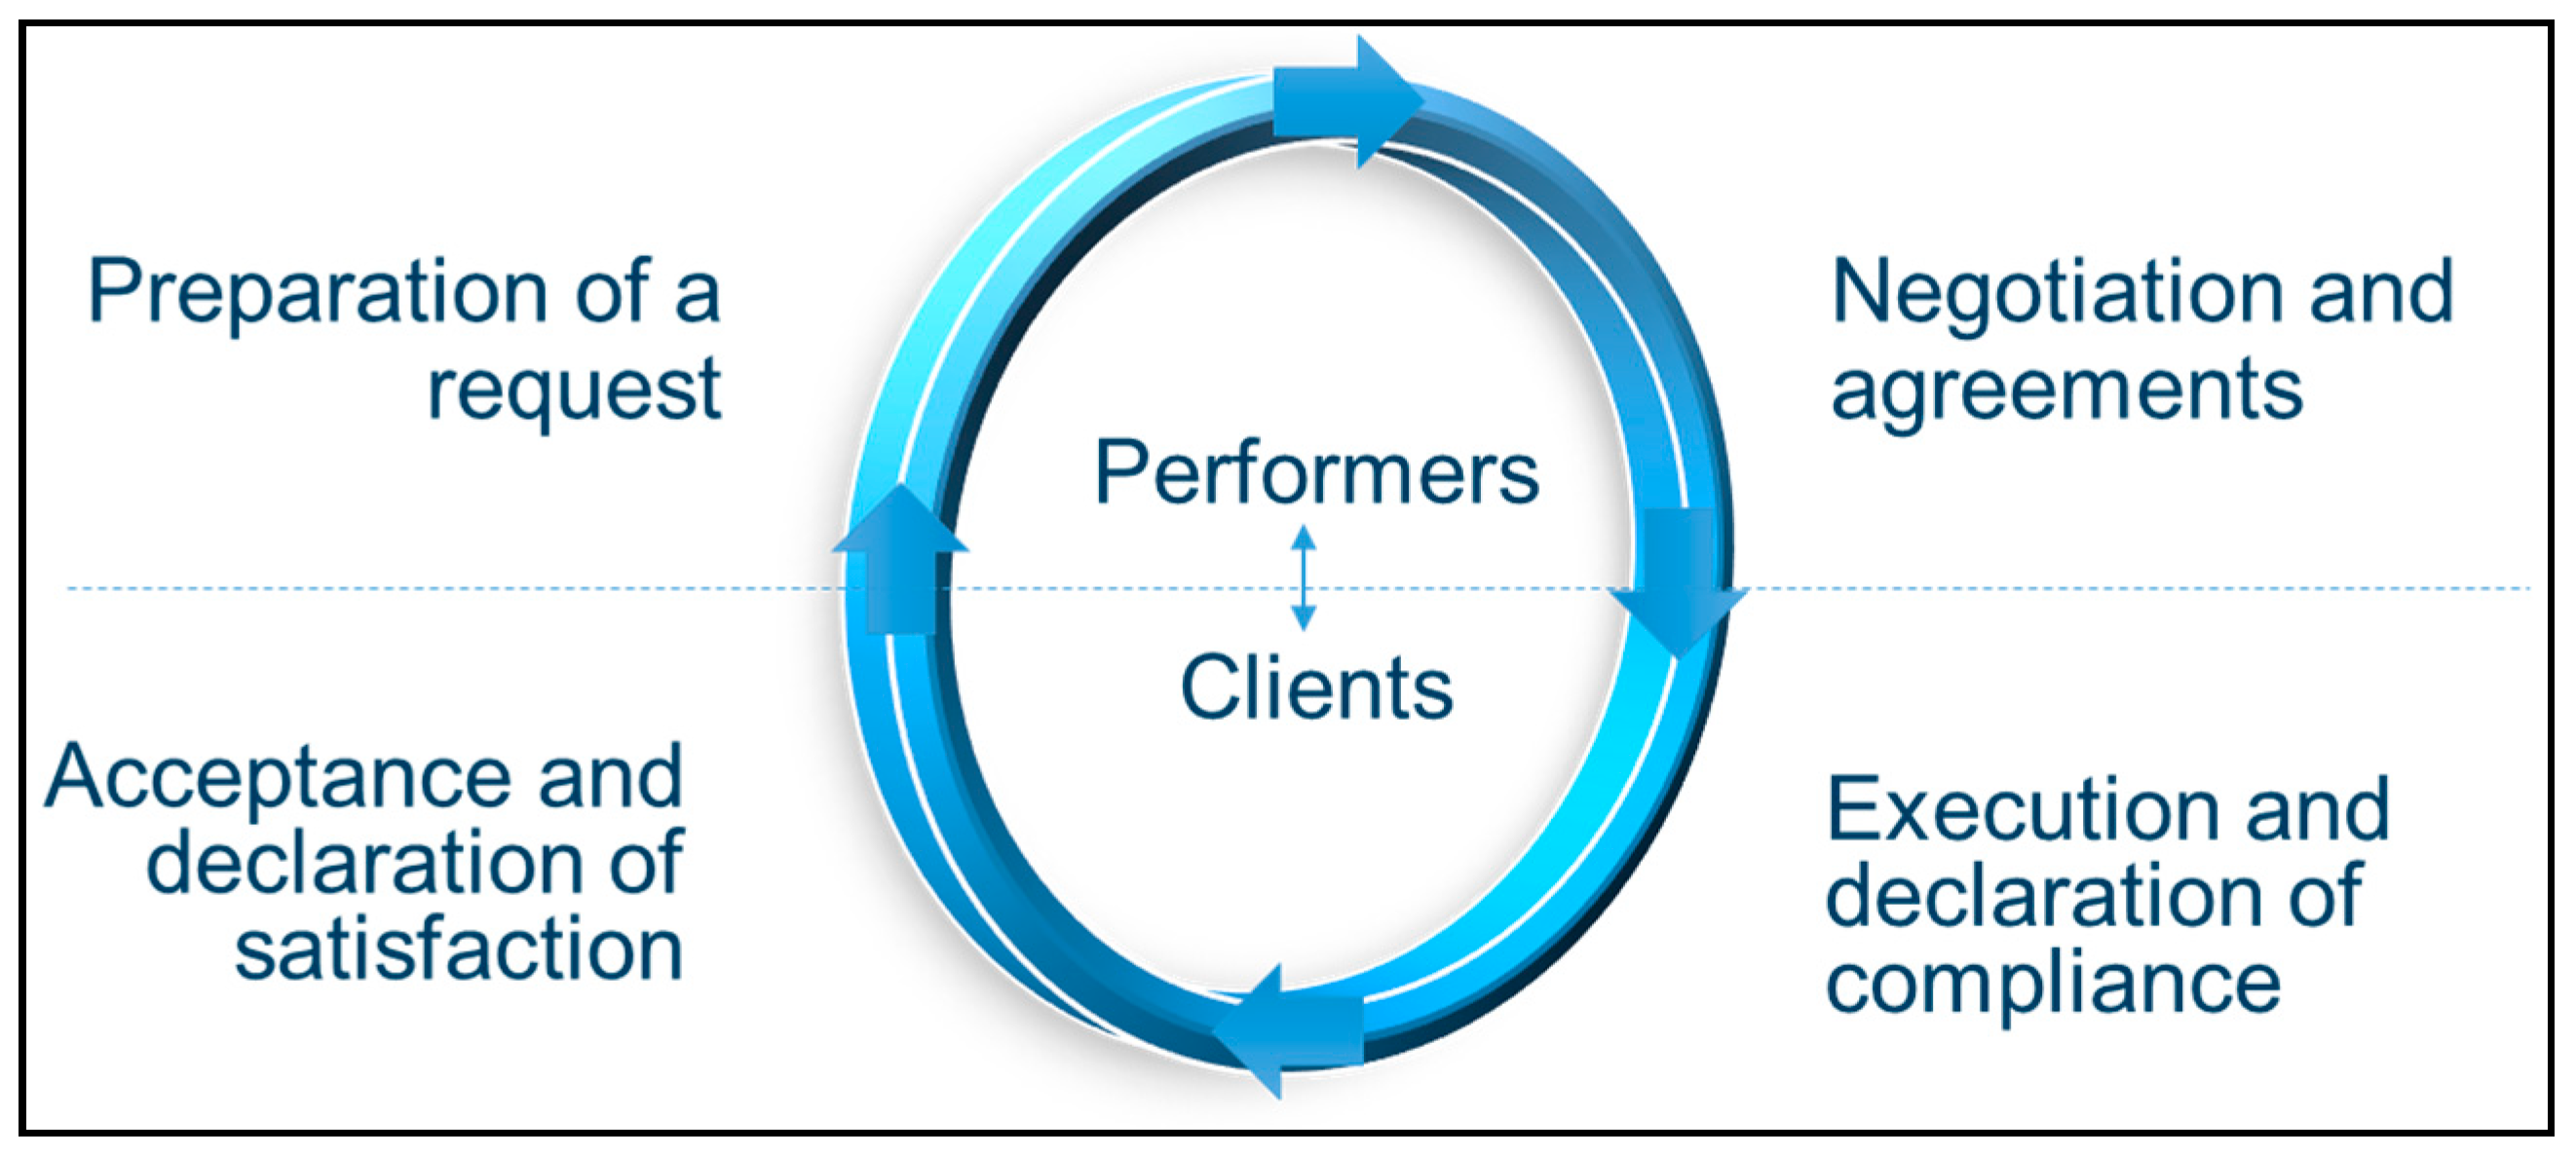
| Measurement and Control of Commitments | % of compliance network or chain of commitments | KPI measures the percentage of compliance with the chain of commitments; that is to say, that the 4 movements for the coordination are fulfilled | (Number of commitments in which the 4 movements for coordination are fulfilled)/(Total number of commitments) × 100 | That the 4 movements for coordination (LAP movements presented in Figure 1) are fulfilled |
| % of definition of roles and responsibilities of the performers | KPI measures the percentage of commitments that define roles and responsibilities of performers | (Number of commitments with defined roles and responsibilities)/(Total number of commitments) × 100 | Roles (Who): Client and Performer Responsibilities (What): Definition of the promise of which the performer takes charge | |
| % of fulfillment of roles and responsibilities of performers | KPI measures the percentage of commitments in which the roles and responsibilities of previously defined performers are met | (Number of commitments that fulfilled previously defined roles and responsibilities)/(Total number of commitments) × 100 | That the performer (not another) fulfills the promise and declares compliance to the client | |
| % of declaration of the importance of commitment | KPI measures the percentage of commitments that declare the importance (priority) of this, explicitly | (Number of commitments declaring importance)/(Total number of commitments) × 100 | Declare the importance (priority) of commitment in the first 2 movements for coordination (LAP movements presented in Figure 1) | |
| % of compliance with priority commitments | KPI measures the percentage of commitments that were declared important (priority) and that are effectively met | (Number of priority commitments fulfilled)/(Total number of priority commitments) × 100 | Review of priority commitment agreed previously | |
| % of verification of availability of performers in agreements | KPI measures the percentage of commitments that verify the availability of performers in the negotiation stage and agreements | (Number of commitments that verify availability of performers in agreements)/(Total number of commitments) × 100 | Verification of the availability of performers in the negotiation stage and agreements. The executor’s (workers) agenda can be requested from the foreman | |
| % of verification of availability of performers in execution | KPI measures the percentage of commitments that verify the availability of performers in the execution stage | (Number of commitments that verify availability of performers in execution)/(Total number of commitments) × 100 | Compliance with the verification of the availability of performers in the execution stage | |
| Measurement and Control of Petitions and Promises | % of specified deadlines | KPI measures the percentage of commitments that specify the deadline | (Number of commitments that specify the deadline)/(Total number of commitments) × 100 | Specific deadline: date and time (AM, PM) |
| % of unnecessary requests | KPI measures the percentage of commitments that make unnecessary requests | (Number of commitments that make unnecessary requests)/(Total number of commitments) × 100 | When the client declares that the deadline specified in the request does not correspond to the last responsible moment and/or requested something that was not necessary (does not add value) | |
| % of incomplete requests and promises | KPI measures the percentage of requests and promises that do not comply with explicit conditions of satisfaction, background of obviousness and/or specific term | (Number of commitments that make requests and incomplete promises)/(Total number of commitments) × 100 | Explicit conditions of satisfaction, background of obviousness and specific deadline | |
| Measurement and Control of Fundamentals of Trust | % of compliance of the performer’s competence | KPI measures the percentage of commitments where the performer is able to perform in the required domain | (Number of commitments where performer is competent)/(Total number of commitments) × 100 | Performer is able to perform in the required domain (recurring performance according to accepted standards) |
| % of reliability compliance (complementary to PPC) | KPI measures the percentage of commitments where the performer is able to perform reliably and timely in the required domain | (Number of commitments fulfilled + number of commitments revoked + number of counteroffers)/(Total number of commitments) × 100 | Performer keeps his promises on time (PPC), counteroffer or revokes | |
| % of engaged participants | KPI measures the percentage of meeting participants who are engaged to it | (Number of participants engaged to the meeting)/(Total number of attendees) × 100 | Participant attends the meeting, arrives at the time and remains in an attitude that suggests concentration (does not interact with the cell phone, looks at the speaker, takes notes, etc.). (Failing to comply with any previous aspect, justify it before or during) |
| Aim | Measure Name | Description | Formula | Results | General Comments |
|---|---|---|---|---|---|
| Measurement and Control of Commitments | % of compliance network or chain of commitments | KPI measures the percentage of compliance with the chain of commitments; that is to say, that the 4 movements for the coordination are fulfilled | (Number of commitments in which the 4 movements for coordination are fulfilled)/(Total number of commitments) × 100 | 0% |
|
| % of definition of roles and responsibilities of the performers | KPI measures the percentage of commitments that define roles and responsibilities of performers | (Number of commitments with defined roles and responsibilities)/(Total number of commitments) × 100 | 83% |
| |
| % of fulfillment of roles and responsibilities of performers | KPI measures the percentage of commitments in which the roles and responsibilities of previously defined performers are met | (Number of commitments that fulfilled previously defined roles and responsibilities)/(Total number of completed commitments) × 100 | 15% |
| |
| % of declaration of the priority of commitment | KPI measures the percentage of commitments that declare the priority (importance) of this, explicitly | (Number of commitments declaring priority)/(Total number of commitments) × 100 | 10% |
| |
| % of compliance with priority commitments | KPI measures the percentage of commitments that were declared priority and that are effectively met | (Number of priority commitments fulfilled)/(Total number of priority commitments) × 100 | 100% |
| |
| % of verification of availability of performers in agreements | KPI measures the percentage of commitments that verify the availability of performers in the negotiation stage and agreements | (Number of commitments that verify availability of performers in agreements)/(Total number of commitments) × 100 | 18% |
| |
| + M. and C. PP | % of specified deadlines | KPI measures the percentage of commitments that specify the deadline | (Number of commitments that specify the deadline)/(Total number of commitments) × 100 | 10% |
|
| % of unnecessary requests | KPI measures the percentage of commitments that make unnecessary requests | (Number of commitments that make unnecessary requests)/(Total number of commitments) × 100 | 3% |
| |
| Measurement and Control of Fundamentals of Trust | % of reliability compliance (complementary to PPC) | KPI measures the percentage of commitments where the performer is able to perform reliably and timely in the required domain | (Number of commitments fulfilled + number of commitments revoked + number of counteroffers)/(Total number of commitments) × 100 | 81% |
|
| % of engaged participants | KPI measures the percentage of meeting participants who are engaged in it | (Number of participants engaged to the meeting)/(Total number of attendees) × 100 | 48% |
|
| Aim | Measure Name | Description | Formula | Results | General Comments |
|---|---|---|---|---|---|
| Measurement and Control of Commitments | % of fulfillment of a request | KPI measures the compliance percentage of the first movement; preparation of a request by the client | (Number of commitments in which the petition is prepared)/(Total number of commitments) × 100 | 100% |
|
| % of compliance negotiation and agreements | KPI measures the compliance percentage of the second movement; negotiation and agreements | (Number of commitments in which a negotiation and agreement is made)/(Total number of commitments) × 100 | 20% |
| |
| % of declaration of compliance with the commitment | KPI measures the percentage compliance of the third movement; execution and declaration of compliance with the commitment by the performer | (Number of commitments in which compliance is declared)/(Total number of commitments completed) × 100 | 78% |
| |
| % of fulfillment declaration of satisfaction | KPI measures the percentage of compliance of the fourth movement; acceptance and declaration of satisfaction by the client | (Number of commitments in which satisfaction is accepted and declared)/(Total number of commitments completed) × 100 | 5% |
| |
| ++ M. and C. FT | % of revoked commitments | KPI measures the percentage of commitments revoked | (Number of commitments revoked)/(Total number of commitments) × 100 | 4% |
|
| % of renegotiated commitments | KPI measures the percentage of renegotiated commitments | (Number of renegotiated commitments)/(Total number of commitments) × 100 | 2% |
| |
| % of canceled commitments | KPI measures the percentage of canceled commitments | (Number of canceled commitments)/(Total number of commitments) × 100 | 1% |
|
| Aim | Measure Name | Description | Formula | Means of Verification |
|---|---|---|---|---|
| Measurement and Control of Commitments | % of compliance network or chain of commitments | KPI measures the percentage of compliance with the chain of commitments; that is to say, that the 4 movements for the coordination are fulfilled | (Number of commitments in which the 4 movements for coordination are fulfilled)/(Total number of commitments) × 100 | That the 4 movements for coordination are fulfilled |
| % of fulfillment of a request | KPI measures the compliance percentage of the first movement; preparation of a request by the client | (Number of commitments in which the petition is prepared)/(Total number of commitments) × 100 | To determine that the petition was prepared, it must be verified that the following are established:
| |
| % of compliance negotiation and agreements | KPI measures the compliance percentage of the second movement; negotiation and agreements | (Number of commitments in which a negotiation and agreement is made)/(Total number of commitments) × 100 | - There must be an agreement and not an imposition by the client (Conversations for action are generated) - In addition, the client must consult the executor’s (workers) agenda with the foreman | |
| % of declarations of compliance with the commitment | KPI measures the percentage compliance of the third movement; execution and declaration of compliance with the commitment by the performer | (Number of commitments in which compliance is declared)/(Total number of commitments completed) × 100 | - Performers execute and inform clients that they are done with the assigned task (immediately) in the field huddle - Verification is done at the next weekly meeting | |
| % of fulfillment declaration of satisfaction | KPI measures the percentage of compliance of the fourth movement; acceptance and declaration of satisfaction by the client | (Number of commitments in which satisfaction is accepted and declared)/(Total number of commitments completed) × 100 | - Client verifies compliance and reports if the commitment is satisfactory in the field huddle - Verification is done at the next weekly meeting | |
| % of declaration of the priority of commitment | KPI measures the percentage of commitments that declare the priority (importance) of this, explicitly | (Number of commitments declaring priority)/(Total number of commitments) × 100 | Declare the priority (importance) of commitment in the first two movements: Request or Negotiation and agreements | |
| % of compliance with priority commitments | KPI measures the percentage of commitments that were declared priority and that are effectively met | (Number of priority commitments fulfilled)/(Total number of priority commitments) × 100 | Review of priority commitment agreed at the previous weekly meeting | |
| + M. and C. PP | % of specified deadlines | KPI measures the percentage of commitments that specify the deadline | (Number of commitments that specify the deadline)/(Total number of commitments) × 100 | Specific deadline: date and time (AM, PM) |
| % of unnecessary requests | KPI measures the percentage of commitments that make unnecessary requests | (Number of commitments that make unnecessary requests)/(Total number of commitments) × 100 | When the client declares that the deadline specified in the request does not correspond to the last responsible moment and/or requested something that was not necessary (does not add value) | |
| Measurement and Control of Fundamentals of Trust | % of reliability compliance (complementary to PPC) | KPI measures the percentage of commitments where the performer is able to perform reliably and timely in the required domain | (Number of commitments fulfilled + number of commitments revoked + number of renegotiations + number of commitments canceled)/(Total number of commitments) × 100 | Indicator is the sum expressed in the formula. It is essential to measure it because it provides a higher degree of reliability than the current PPC (Percent Plan Complete) |
| % of revoked commitments | KPI measures the percentage of commitments revoked | (Number of commitments revoked)/(Total number of commitments) × 100 | Performer informs the client immediately after the meeting (ASAP) that he will not be able to fulfill his commitments | |
| % of renegotiated commitments | KPI measures the percentage of renegotiated commitments | (Number of renegotiated commitments)/(Total number of commitments) × 100 | Client and/or performer wishes to change the satisfaction conditions immediately after the meeting, a new agreement is generated in the field huddle (between weekly meetings) | |
| % of canceled commitments | KPI measures the percentage of canceled commitments | (Number of canceled commitments)/(Total number of commitments) × 100 | Client informs the performer immediately after the meeting (ASAP) that the commitment made is no longer necessary | |
| % of engaged participants | KPI measures the percentage of meeting participants who are engaged to it | (Number of participants engaged to the meeting)/(Total number of attendees) × 100 | - Participants must arrive on time (max 5 min late) - Avoid interaction with the cell phone and walkie-talkie - Remain in the room and intervene in the meeting - Take notes and look at the person who is speaking |
Publisher’s Note: MDPI stays neutral with regard to jurisdictional claims in published maps and institutional affiliations. |
© 2020 by the authors. Licensee MDPI, Basel, Switzerland. This article is an open access article distributed under the terms and conditions of the Creative Commons Attribution (CC BY) license (http://creativecommons.org/licenses/by/4.0/).
Share and Cite
Salazar, L.A.; Arroyo, P.; Alarcón, L.F. Key Indicators for Linguistic Action Perspective in the Last Planner® System. Sustainability 2020, 12, 8728. https://doi.org/10.3390/su12208728
Salazar LA, Arroyo P, Alarcón LF. Key Indicators for Linguistic Action Perspective in the Last Planner® System. Sustainability. 2020; 12(20):8728. https://doi.org/10.3390/su12208728
Chicago/Turabian StyleSalazar, Luis A., Paz Arroyo, and Luis F. Alarcón. 2020. "Key Indicators for Linguistic Action Perspective in the Last Planner® System" Sustainability 12, no. 20: 8728. https://doi.org/10.3390/su12208728
APA StyleSalazar, L. A., Arroyo, P., & Alarcón, L. F. (2020). Key Indicators for Linguistic Action Perspective in the Last Planner® System. Sustainability, 12(20), 8728. https://doi.org/10.3390/su12208728