A Practical Methodology for the Design and Cost Estimation of Solar Tower Power Plants


Abstract
1. Introduction
2. Methodology and Modeling
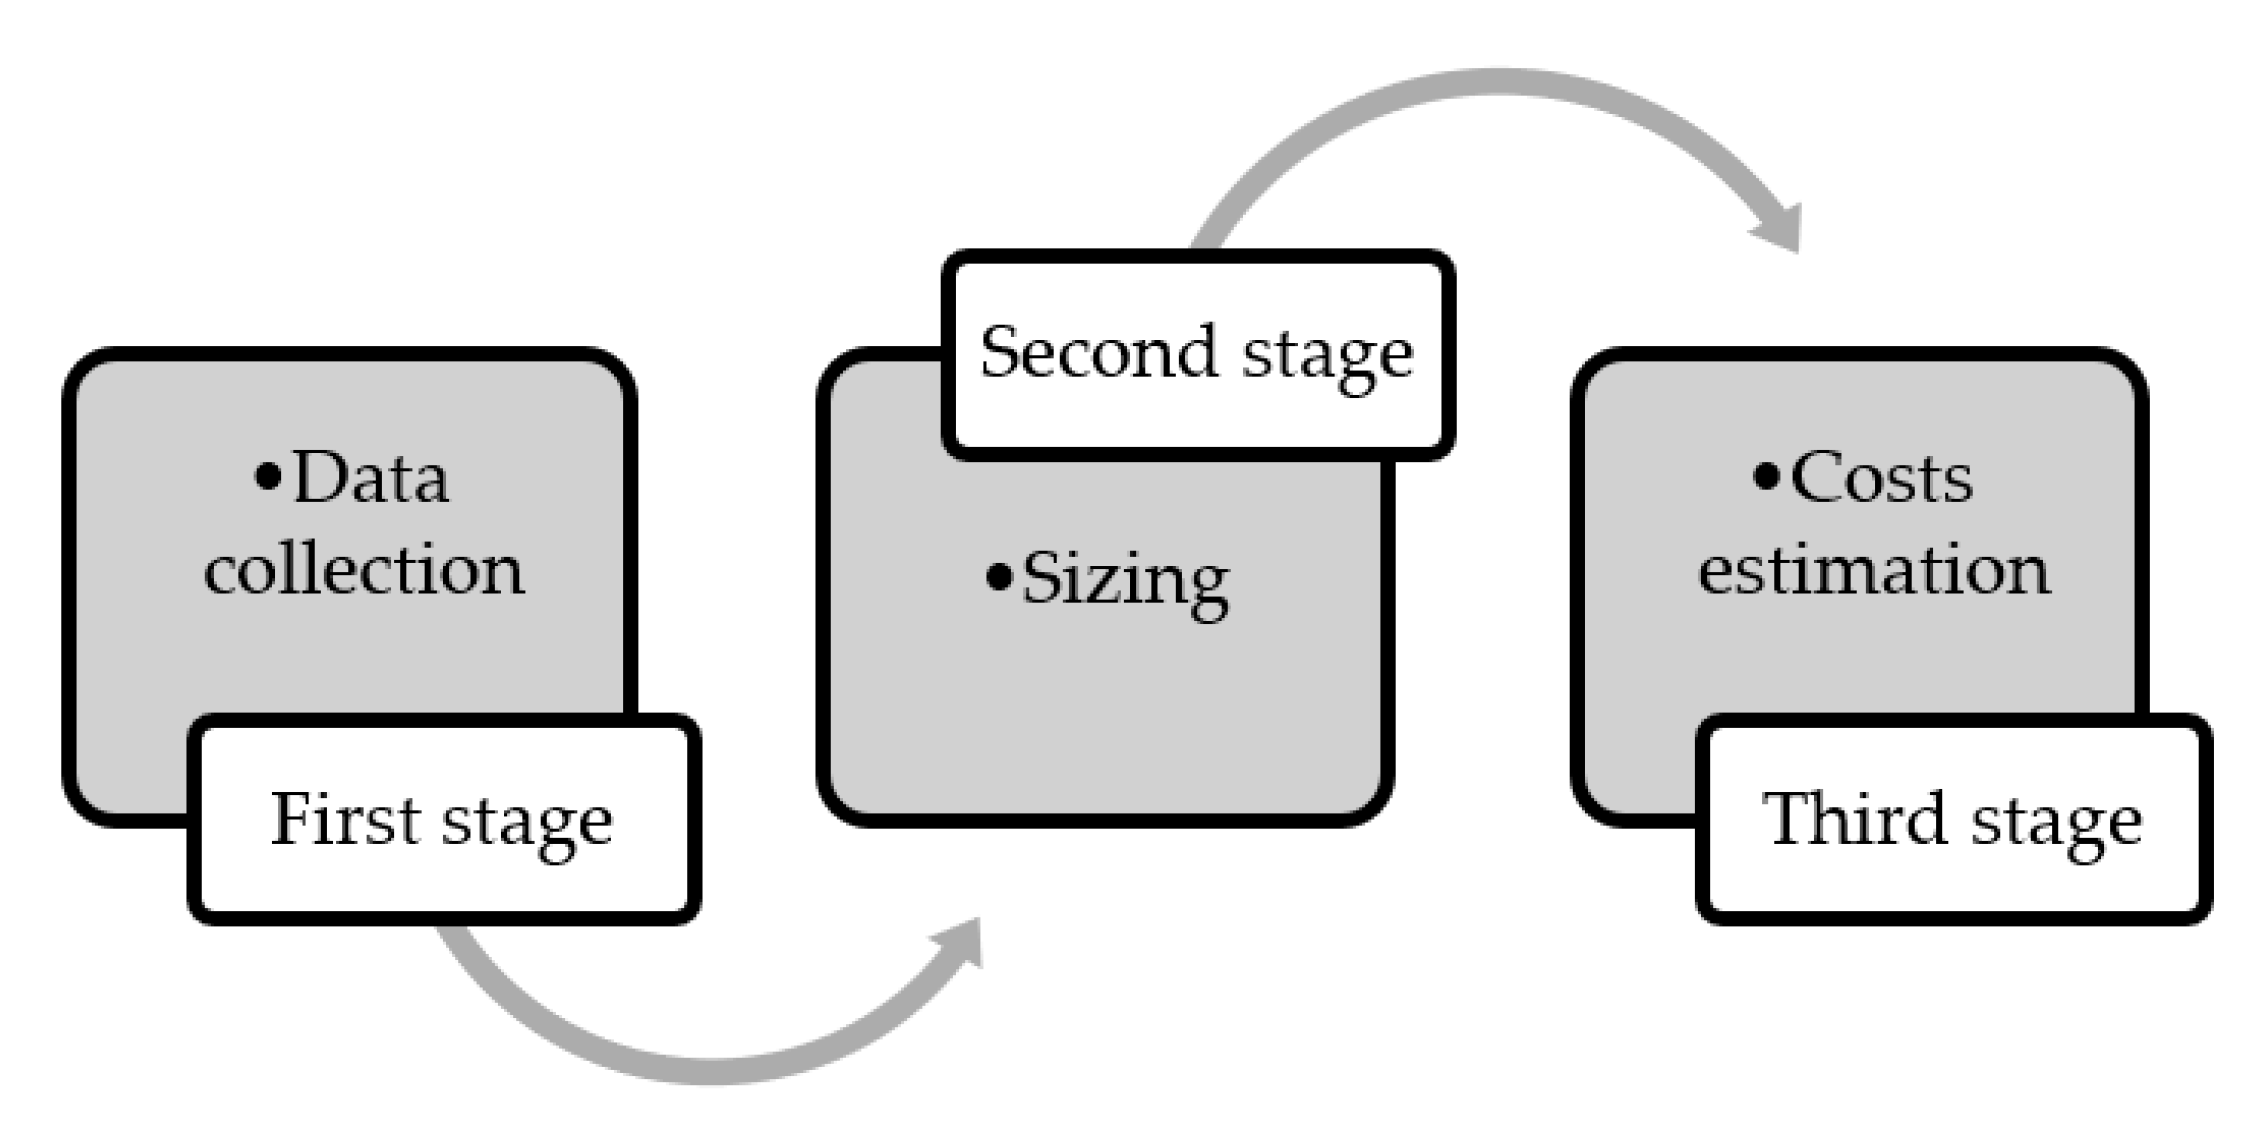
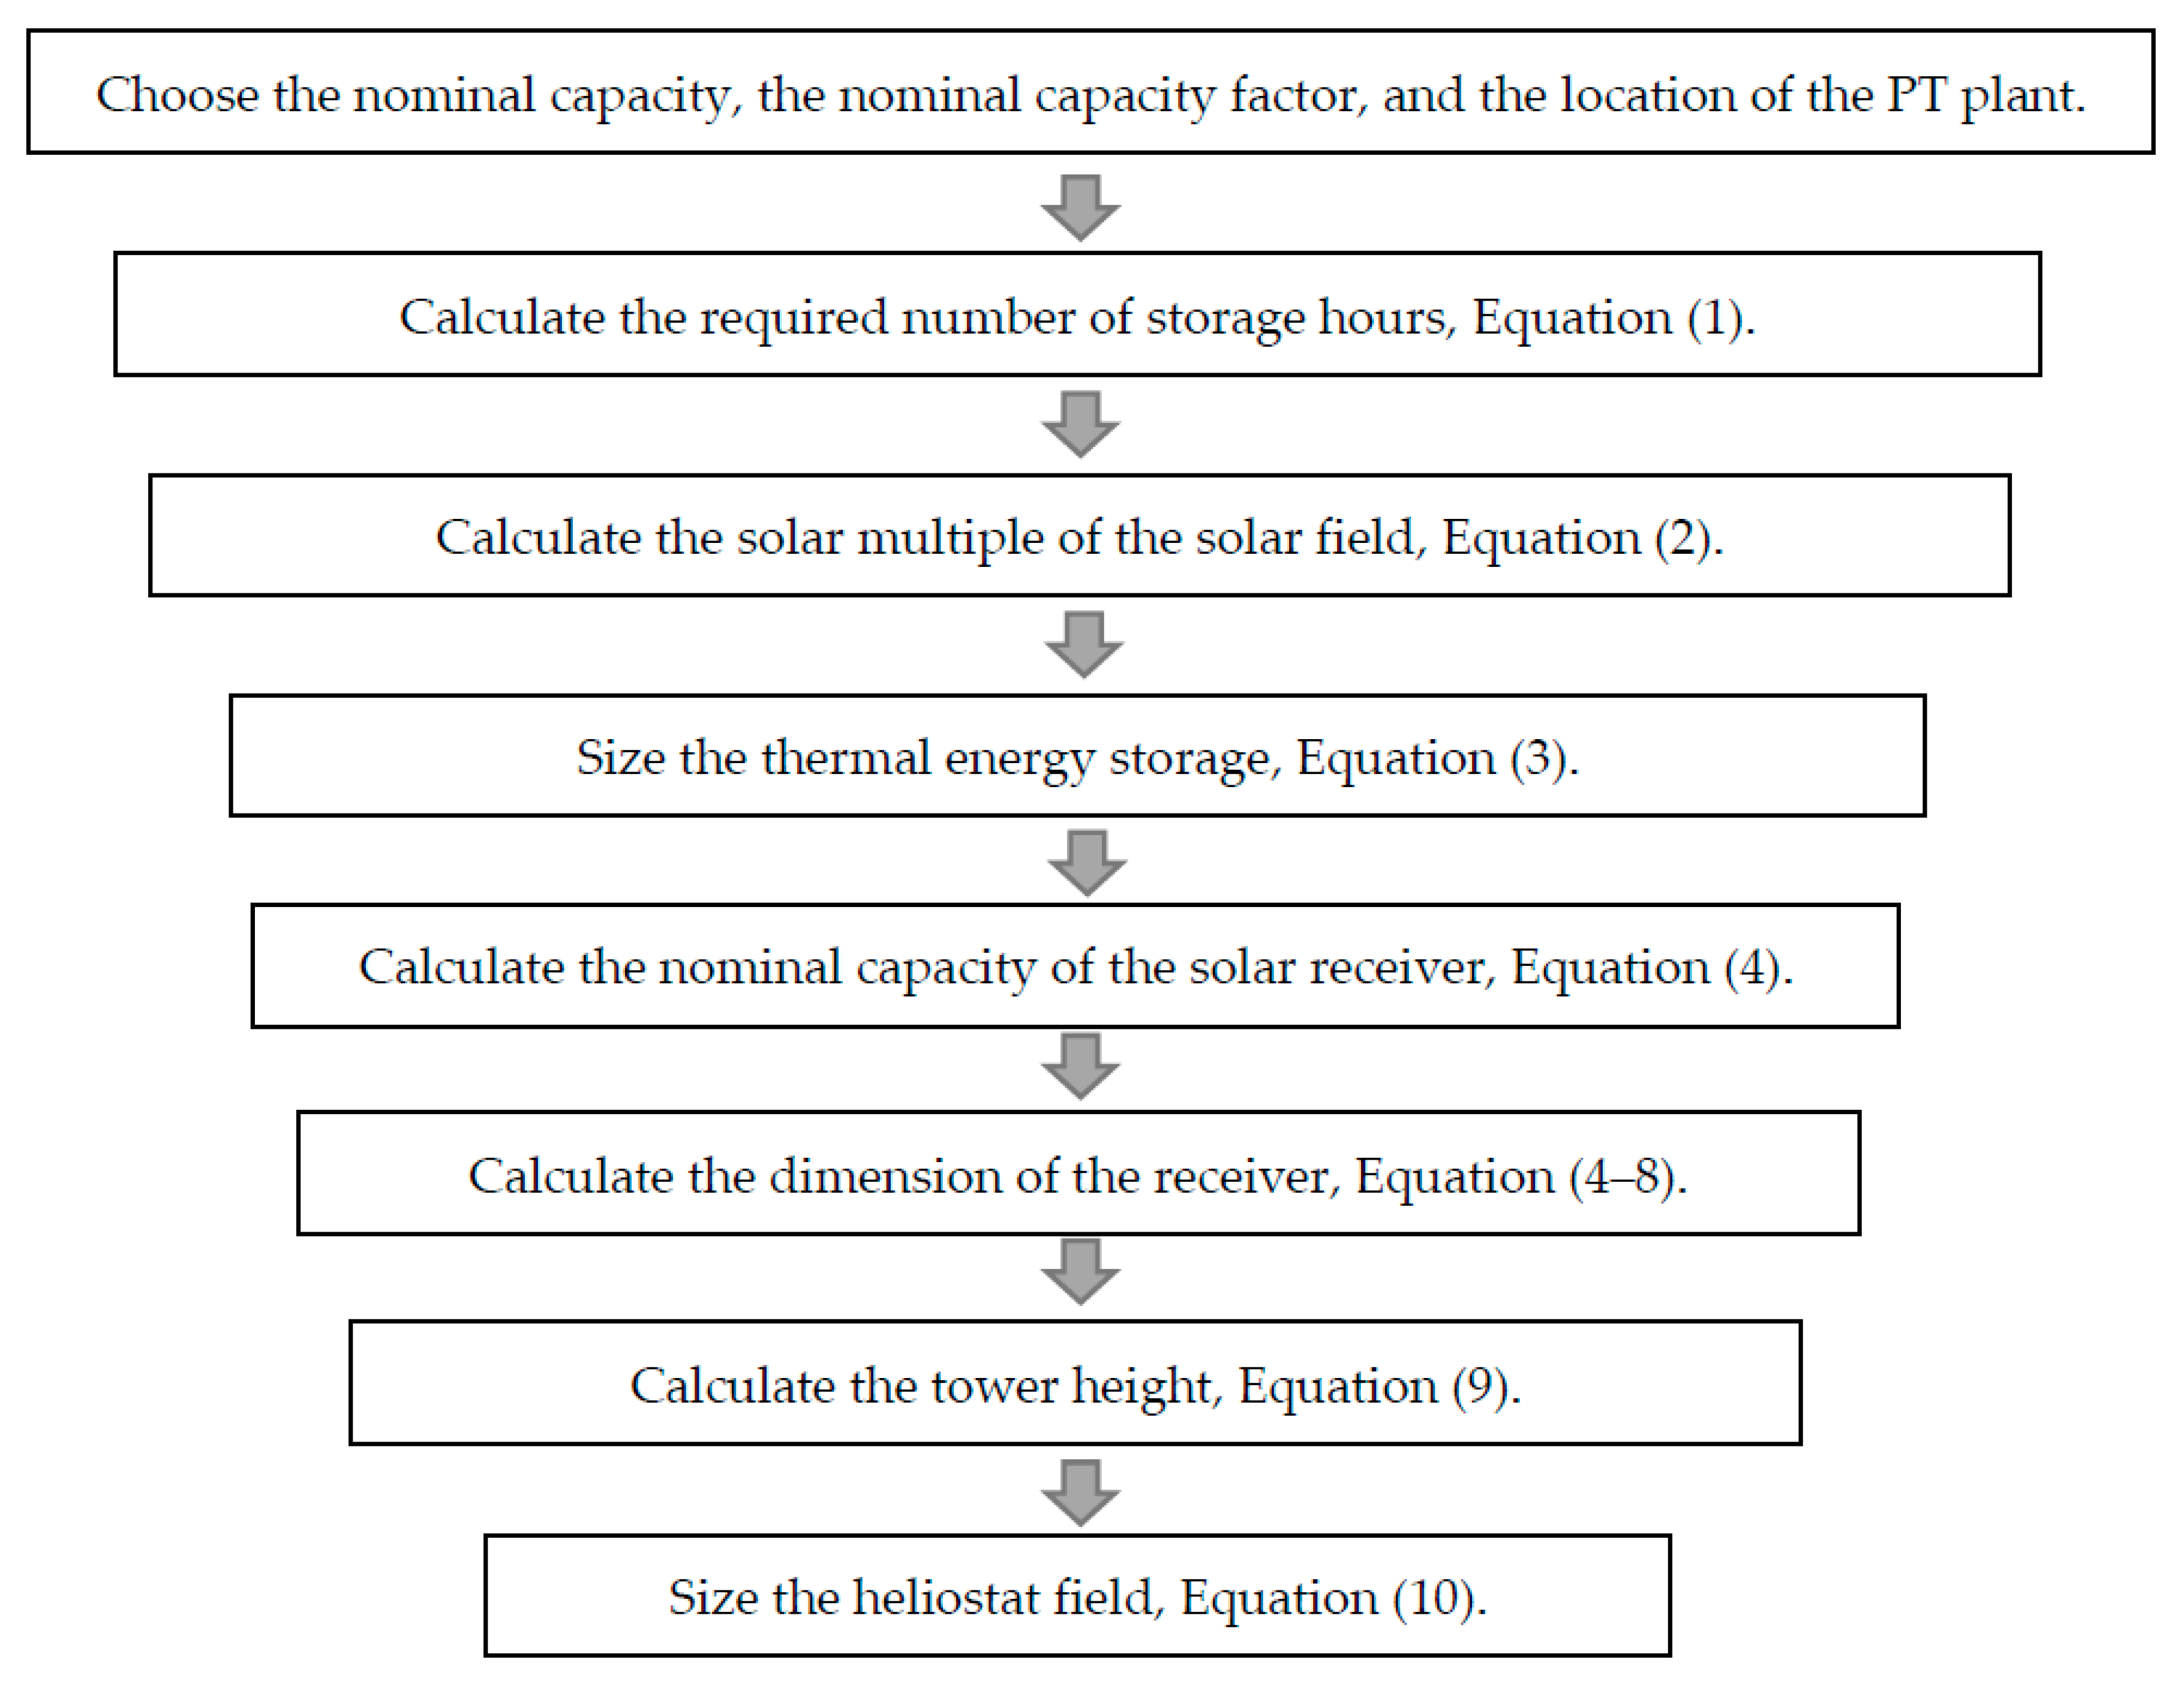
2.1. Methodology
- nominal power of the PT plant,
- location, and
- design point parameters.
- nominal power, height, and SR diameter,
- tower height,
- size of thermal energy storage, and
- SF reflective area.
- estimating investment costs considering the scale effect and
- calculating economic indices.
2.2. Design Approach
2.3. Cost Estimation
3. Validation of the Design Approach
4. Application of the Methodology to Design PT Plants for the Mining Industry in Chile
4.1. Data of the Selected Location
4.2. Design of the PT Plants
4.3. Economic Indices
5. Sensitivity Analysis
6. Conclusions
Author Contributions
Funding
Acknowledgments
Conflicts of Interest
References
- Collado, F.J.; Guallar, J. A review of optimized design layouts for solar power tower plants with campo code. Renew. Sustain. Energy Rev. 2013, 20, 142–154. [Google Scholar] [CrossRef]
- Behar, O.; Khellaf, A.; Mohammedi, K. A review of studies on central receiver solar thermal power plants. Renew. Sustain. Energy Rev. 2013, 23, 12–39. [Google Scholar] [CrossRef]
- Gielen, D. Renewable Energy Technologies: Cost Analysis Series, Concentrating Solar Power. 2012. Available online: https://www.irena.org/documentdownloads/publications/re_technologies_cost_analysis-csp.pdf (accessed on 21 November 2019).
- Jebamalai, M. Receiver Design Methodology for Solar Tower Power Plants. Master’s Thesis, Department of Energy Technology, KTH School of Industrial Engineering and Management, Stockholm, Sweden, 2016. [Google Scholar]
- Srilakshmi, G.; Suresh, N.; Thirumalai, N.; Srilakshmi, R. Preliminary design of heliostat field and performance analysis of solartower plants with thermal storage and hybridisation. Sustain. Energy Technol. Assess. 2017, 19, 102–113. [Google Scholar] [CrossRef]
- Srilakshmi, G.; Suresh, N.; Thirumalai, N.; Srilakshmi, R. Design of Solar Field and Performance Estimation of Solar Tower Plants; Center for Study of Science, Technology and Policy: Bangalore, India, 2016. [Google Scholar]
- Malekan, K.; Pabon, J.; Zhao, X.; Assadet, M. Design parameter modelling of solar power tower system using adaptive neuro-fuzzy inference system optimized with a combination of genetic algorithm and teaching learning-based optimization algorithm. J. Clean. Prod. 2020, 244, 118904. [Google Scholar] [CrossRef]
- Luo, Y.; Hu, Y.; Lu, T. Efficient optimized design of solar power tower plants based on successive response surface methodology. Int. J. Low Carbon Technol. 2019, 14, 475–486. [Google Scholar] [CrossRef]
- Lu, Y.; Lu, T.; Du, X. Novel optimization design strategy for solar power tower plants. Energy Convers. Manag. 2018, 177, 682–692. [Google Scholar] [CrossRef]
- Albarbar, A.; Arar, A. Performance Assessment and Improvement of Central Receivers Used for Solar Thermal Plants. Energies 2019, 12, 3079. [Google Scholar] [CrossRef]
- Siala, F.M.F.; Elayeb, M.E. Mathematical formulation of a graphical method for a no-blocking heliostat field layout. Renew. Energy 2001, 23, 77–92. [Google Scholar] [CrossRef]
- Marcelino, S.; Manuel, R. Methodology for generation of heliostat field layout in central receiver systems based on yearly normalized energy surfaces. Sol. Energy 2006, 80, 861–874. [Google Scholar]
- Wei, X.; Lu, Z.; Lin, Z.; Hongxin, Z.; Ni, Z. Optimization procedure for design of heliostat field layout of a 1 MWe solar tower thermal power plant. Solid State Lighting Sol. Energy Technol. 2007, 6841, 684119. [Google Scholar]
- Noone, J.; Manuel, T.; Alexander, M. Heliostat field optimization: A new computationally efficient model and biomimetic layout. Sol. Energy 2012, 86, 792–803. [Google Scholar] [CrossRef]
- Pitz-Paal, R.; Bayer, B.N.; Aldo, S. Heliostat field layout optimization for high-temperature solar thermochemical processing. Sol. Energy 2011, 85, 334–343. [Google Scholar]
- Besarati, S.; Goswami, Y. A computationally efficient method for the design of the heliostat field for solar power tower plant. Renew. Energy 2014, 69, 226–232. [Google Scholar] [CrossRef]
- Belhomme, B.; Pitz-Paal, R.; Schwarzbözl, P.; Ulmer, S. A New Fast Ray Tracing Tool for High-Precision Simulation of Heliostat Fields. J. Sol. Energy Eng. 2009, 131, 031002. [Google Scholar] [CrossRef]
- Collado, F.J.; Guallar, J. Campo: Generation of regular heliostat fields. Renew. Energy 2012, 46, 49–59. [Google Scholar] [CrossRef]
- Ho, C. Software and Codes for Analysis of Concentrating Solar Power Technologies. Sandia National Laboratories. SAND2008-8053. December 2008. Available online: https://energy.sandia.gov/wp-content/gallery/uploads/SAND2008-8053.pdf (accessed on 21 November 2019).
- SolTrace Software. Available online: https://www.nrel.gov/csp/soltrace.html (accessed on 21 November 2019).
- Collado, F.; Guallar, J. Scaling Campo Code to Commercial Solar Tower Plants. SolarPACES 2017. AIP Conf. Proc. 2018, 2033, 210002-1–210002-7. [Google Scholar] [CrossRef]
- Solstice Software. Available online: https://www.labex-solstice.fr/solstice-software/ (accessed on 21 November 2019).
- Solar Power Tower Integrated Layout and Optimization Tool (SolarPILOT™). Available online: https://www.nrel.gov/csp/solarpilot.html (accessed on 21 November 2019).
- Praveen, R.P. Performance Analysis and Optimization of Central Receiver Solar Thermal Power Plants for Utility Scale Power Generation. Sustainability 2020, 12, 127. [Google Scholar] [CrossRef]
- Collado, F.; Guallar, J. Quick design of regular heliostat fields for commercial solar tower power plants. Energy 2019, 178, 115–125. [Google Scholar] [CrossRef]
- Clausing, A.; Waldvogel, J.; Lister, L. Natural convection from isothermal cubical cavities with a variety of side-facing apertures. J. Heat Transf. 1987, 109, 407–412. [Google Scholar] [CrossRef]
- Capital Cost Estimates for Utility Scale Electricity Generating Plants. US Energy Information Administration. November 2016. Available online: https://www.eia.gov/analysis/studies/powerplants/capitalcost/pdf/capcost_assumption.pdf (accessed on 21 November 2019).
- Platzer, W. Small-scale CSP and solar Process Heat Application: Case Studies. In Proceedings of the Conference on Small-Scale Concentrating Solar Power, Pula, Croatia, 25 September 2015; Available online: https://www.fraunhofer.cl/content/dam/chile/es/documents/csetdocument/presentaciones/platzer-150925-pula-small_scale_csp_solar_thermal_process_heat.pdf (accessed on 21 November 2019).
- Abraham, M. Encyclopedia of Sustainable Technologies; Elsevier: Amsterdam, The Netherlands, 2017. [Google Scholar]
- Fu, R.; Feldman, D.; Margolis, R. U.S. Solar Photovoltaic System Cost Benchmark: Q1 2018; Technical Report: NREL/TP-6A20-72399; NREL: Denver, CO, USA, 2018. [Google Scholar]
- Turchi, C.; Boyd, M.; Kesseli, D.; Kurup, P.; Mehos, M.; Neises, T.; Sharan, P.; Wagner, M.; Wendelin, T. CSP Systems Analysis—Final Project Report; Technical Report; NREL/TP-5500-72856; National Renewable Energy Lab (NREL): Golden, CO, USA, 2019. [Google Scholar]
- Mehos, M.; Turchi, C.; Vidal, J.; Wagner, M.; Ma, Z.; Ho, C.; Kolb, W.; Andraka, C.; Kruizenga, A. Concentrating Solar Power Gen3 Demonstration Roadmap; NREL/TP-5500-67464; NREL: Denver, CO, USA, 2017. [Google Scholar]
- Trading Economics. Available online: https://tradingeconomics.com/chile/ (accessed on 21 November 2019).
- Rinaldi, F.; Binotti, M.; Giostri, A.; Manzolini, G. Comparison of linear and point focus collectors in solar power plants. Energy Procedia 2014, 49, 1491–1500. [Google Scholar] [CrossRef]
- Gemasolar Solar Thermal Power Plant. SENER 2017. Available online: http://www.poweroilandgas.sener (accessed on 21 November 2019).
- Sánchez, M.; de los Reyes, M. On the Design of Solar External Receivers. Ph.D. Thesis, University of Carlos III, Madrid, Spain, 2015. Available online: https://core.ac.uk/download/pdf/44309378.pdf (accessed on 21 November 2019).
- Relloso, R.; Garcia, E. Tower technology cost reduction approach after Gemasolar experience. Energy Procedia 2015, 69, 1660–1666. [Google Scholar] [CrossRef]
- Ehrhart, B.; Gill, D. Evaluation of Annual Efficiencies of High Temperature Central Receiver Concentrated Solar Power Plants with Thermal Energy Storage; SANDIA REPORT: SAND2013-5493; Sandia National Laboratories: Albuquerque, NM, USA, 2013. [Google Scholar]
- Crescent Dunes Solar Energy Project. Available online: https://solarpaces.nrel.gov/crescent-dunes-solar-energy-project (accessed on 21 November 2019).
- Comisión Chilena del Cobre (COCHILCO). Available online: https://www.cochilco.cl (accessed on 3 December 2019).
- Solar Explorador. Available online: http://www.minenergia.cl/exploradorsolar/ (accessed on 21 November 2019).
- Kincaid, N.; Mungas, G.; Kramer, N.; Wagner, M.; Zhu, G. An optical performance comparison of three concentrating solar power collector designs in linear Fresnel, parabolic trough, and central receiver. Appl. Energy 2018, 231, 1109–1121. [Google Scholar] [CrossRef]
- Short, W.; Packey, D.; Holt, T. A Manual for the Economic Evaluation of Energy Efficiency and Renewable Energy Technologies; Technical report; NREL/TP-462-5173; National Renewable Energy Lab (NREL): Golden, CO, USA, 1995. [Google Scholar]
- Reuters Staff, Chile Seen Raising Electricity Price Due to Dollar. Available online: https://www.reuters.com/article/chile-energy-prices/chile-seen-raising-electricity-price-due-to-dollar-idUSN2445562420080924 (accessed on 21 November 2019).
- Xe.com Inc. Available online: https://www.xe.com/ (accessed on 21 November 2019).


| Component | Unit | Value | Reference |
|---|---|---|---|
| Site improvement | USD/m2 | 16 | [31] |
| Solar field | USD/m2 | 140 | [31] |
| Tower structure and solar receiver | USD/Wth | 152 | [32] |
| Thermal energy storage | USD/kWhth | 22 | [31] |
| Power block | USD/kWe | 1040 | [31] |
| Balance of the PT plant | USD/MWe | 290 | [31] |
| EPC and Owners Cost | % | 13 | [31] |
| Contingency | % | 7 | [31] |
| Operation & Maintenance O&M fixed cost by capacity | USD/kWe-y | 66 | [31] |
| O&M variable cost by energy produced | USD/MWhe | 3,5 | [31] |
| Parameter | Unit | Value | |
|---|---|---|---|
| Gemasolar | Crescent Dunes | ||
| Nominal DNI | W/m2 | 900 | 950 |
| Nominal daily insolation | kWh/m2/day | 9.5 | 10 |
| Plant’s nominal capacity | MWe | 19.9 [35] | 110 [36] |
| Peak flux density | kW/m2 | 830 [26] | 830 [26] |
| SR aspect ratio | - | 1.3 [37] | 1.136 [4] |
| Heliostat reflective area | m2 | 115.7 [34] | 115.7 [34] |
| Total error of the heliostat | mrad | 2.9 [34] | 2.9 [34] |
| PB efficiency | % | 40 [36] | 41.8 [38] |
| TES efficiency | % | 98.5 [38] | 99 [39] |
| SR efficiency | % | 89 [38] | 89 [38] |
| (a) | |||||
| Parameter | Unit | Actual Data [34,35,37] | SolarPILOT | Present Study | MBE (%) |
| SR nominal power | MWth | 120 | (¤) | 113.1 | 5.7 |
| SR area | m2 | 269.7 | (¤) | 285.6 | −5.9 |
| SR height | m | 10.6 | (¤) | 10.9 | −2.6 |
| SR diameter | m | 8.1 | (¤) | 8.4 | −3.2 |
| Tower height | m | 116 | (¤) | 111.5 | 3.9 |
| TES capacity | kWhth | 670 | (*) | 535.9 | 20.0 |
| Power incident on the SR | MWth | (*) | 137.1 | 127.1 | |
| Reflective area of the SF | m2 | 304,750 | 240,600 | 256,294.4 | 15.9 |
| Average absolute MBE | 8.2 | ||||
| (¤) SolarPILOT requires this data as input by the user. (*) Not available. | |||||
| (b) | |||||
| Parameter | Unit | Actual Data [36,39] | SolarPILOT | Present Study | MBE (%) |
| SR nominal power | MWth | 540 | (¤) | 627.0 | −16.1 |
| SR area | m2 | 1105.28 | (¤) | 1254.0 | −13.5 |
| SR height | m | 20 | (¤) | 21.3 | −6.5 |
| SR diameter | m | 17.6 | (¤) | 18.7 | −6.5 |
| Tower height | m | 220 | (¤) | 242.6 | −10.3 |
| Reflective area of the SF | m2 | 1,197,148 | 126,920 | 1,345,867 | −12.4 |
| Average absolute MBE | 9.3 | ||||
| (¤) SolarPILOT requires this data as input by the user. (*) Not available | |||||
| Data | Unit | Value |
|---|---|---|
| Mining process’s nominal power | kWe | 43,000 |
| Operation | - | 24 h/7 days |
| Province, Region | - | Copiapó, Atacama |
| Latitude, Longitude, Elevation | °/°/m | −27.53/−70.31/698 |
| Peak measured DNI | W/m2 | 1047 |
| Daily average DNI during January | kWh/m2/day | 10.93 |
| Yearly DNI | kWh/m2 | 3296 |
| Component | Unit | Mining Process | 10 MWe | 20 MWe | 50 MWe | 100 MWe |
|---|---|---|---|---|---|---|
| Nominal power of the PB | MWe | 43 | 10 | 20 | 50 | 100 |
| Number of storage hours | Hour | 13.56 | 13.56 | 13.56 | 13.56 | 13.56 |
| Solar multiple | - | 2.30 | 2.30 | 2.30 | 2.30 | 2.30 |
| SR nominal power | MWth | 236.33 | 54.96 | 109.92 | 274.80 | 549.60 |
| SR intercept power | MWth | 265.54 | 61.75 | 123.51 | 308.77 | 617.53 |
| SR absorptive surface | m2 | 519.01 | 120.70 | 241.40 | 603.50 | 1206.99 |
| SR diameter | m | 11.64 | 5.61 | 7.94 | 12.55 | 17.75 |
| SR height | m | 14.20 | 6.85 | 9.68 | 15.31 | 21.65 |
| Tower height | m | 142.91 | 96.63 | 110.65 | 152.73 | 222.86 |
| Capacity of the TES | MWhth | 5758.29 | 1339.14 | 2678.27 | 6695.68 | 13,391.37 |
| Reflective area of the SF | m2 | 374,621.8 | 81,578.35 | 167,322.4 | 430,519.3 | 871,213.4 |
| Receiver | Storage | PB | |||
|---|---|---|---|---|---|
| Nominal | Annual | Nominal | Annual | Nominal | Annual |
| 90 | 78.6 | 98.5 | 99.6 | 41.83 | 41.0 |
| PT Plant | Nominal | Annual |
|---|---|---|
| Mining process (43 MWe) | 67.7 | 61.6 |
| 10 MWe | 72.3 | 63.9 |
| 20 MWe | 70.5 | 64.0 |
| 50 MWe | 68.5 | 62.7 |
| 100 MWe | 67.7 | 62.2 |
| Parameter | Value | Unit |
|---|---|---|
| Construction period | 2 | Years |
| Operation period | 25 | Years |
| Depreciation period | 5 | Years |
| Inflation rate | 2.30 [32] | % |
| Inflation of services | 1.00 [32] | % |
| Real discount rate | 2.50 [42] | % |
| Sales tax | 19 [33] | % |
| Degradation rate | 0.75 [27] | % |
| Average costs of electricity (period 2019) | 98.29 [44] | USD/MWe |
| Average yearly inflation in the prices | 1 [45] | % |
| PT Plant | TLCC | SPB | IRR | LCOE |
|---|---|---|---|---|
| Unit | Million USD | Year | % | USD/MWe |
| Mining process | 459 | 17 | 1.55 | 143 |
| 10 MWe | 115 | 19 | 0.77 | 156 |
| 20 MWe | 225 | 18 | 0.94 | 153 |
| 50 MWe | 525 | 17 | 1.74 | 140 |
| 100 MWe | 994 | 16 | 2.37 | 131 |
Publisher’s Note: MDPI stays neutral with regard to jurisdictional claims in published maps and institutional affiliations. |
© 2020 by the authors. Licensee MDPI, Basel, Switzerland. This article is an open access article distributed under the terms and conditions of the Creative Commons Attribution (CC BY) license (http://creativecommons.org/licenses/by/4.0/).
Share and Cite
Behar, O.; Sbarbaro, D.; Morán, L. A Practical Methodology for the Design and Cost Estimation of Solar Tower Power Plants. Sustainability 2020, 12, 8708. https://doi.org/10.3390/su12208708
Behar O, Sbarbaro D, Morán L. A Practical Methodology for the Design and Cost Estimation of Solar Tower Power Plants. Sustainability. 2020; 12(20):8708. https://doi.org/10.3390/su12208708
Chicago/Turabian StyleBehar, Omar, Daniel Sbarbaro, and Luis Morán. 2020. "A Practical Methodology for the Design and Cost Estimation of Solar Tower Power Plants" Sustainability 12, no. 20: 8708. https://doi.org/10.3390/su12208708
APA StyleBehar, O., Sbarbaro, D., & Morán, L. (2020). A Practical Methodology for the Design and Cost Estimation of Solar Tower Power Plants. Sustainability, 12(20), 8708. https://doi.org/10.3390/su12208708