Article

Discovering Spatio-Temporal Clusters of Road Collisions Using the Method of Fast Bayesian Model-Based Cluster Detection

1
Department of Geography, College of Science, Swansea University, Swansea SA28PP, UK
2
School of Geography and Planning, Sun Yat-sen University, Guangzhou 510275, China
3
Department of Urban and Rural Planning, School of Architecture, Tianjin University, Tianjin 300072, China
4
Academy of China Open Economy Studies, University of International Business and Economics, Beijing 100029, China
*
Author to whom correspondence should be addressed.
Sustainability 2020, 12(20), 8681; https://doi.org/10.3390/su12208681
Submission received: 18 September 2020 / Revised: 8 October 2020 / Accepted: 14 October 2020 / Published: 20 October 2020
(This article belongs to the Special Issue Urbanization and Road Safety Management)

Abstract

:
Public availability of geo-coded or geo-referenced road collisions (crashes) makes it possible to perform geovisualisation and spatio-temporal analysis of road collisions across a city. This study aims to detect spatio-temporal clusters of road collisions across Greater London between 2010 and 2014. We implemented a fast Bayesian model-based cluster detection method with no covariates and after adjusting for potential covariates respectively. As empirical evidence on the association of street connectivity measures and the occurrence of road collisions had been found, we selected street connectivity measures as the potential covariates in our cluster detection. Results of the most significant cluster and the second most significant cluster during five consecutive years are located around the central areas. Moreover, after adjusting the covariates, the most significant cluster moves from the central areas of London to its peripheral areas, while the second most significant cluster remains unchanged. Additionally, one potential covariate used in this study, length-based road density, exhibits a positive association with the number of road collisions; meanwhile count-based intersection density displays a negative association. Although the covariates (i.e., road density and intersection density) exhibit potential impact on the clusters of road collisions, they are unlikely to contribute to the majority of clusters. Furthermore, the method of fast Bayesian model-based cluster detection is developed to discover spatio-temporal clusters of serious injury collisions. Most of the areas at risk of serious injury collisions overlay those at risk of road collisions. Although not being identified as areas at risk of road collisions, some districts, e.g., City of London, are regarded as areas at risk of serious injury collisions.

1. Introduction

The distribution of road collisions is spatially heterogenous as road collisions are more likely to cluster in certain places than in others [1,2,3]. A spatio-temporal analysis of road collision across a city can help: (1) investigate the associations between road collisions and environmental characteristics (e.g., road infrastructure, land use and demographics); and (2) identify areas with a high risk of road traffic safety issues. The former can offer empirical evidence on the necessity of traffic safety interventions (e.g., improving road infrastructure, reducing traffic speed, etc.). The latter can be achieved by detecting clustering of road collisions [2,3]. Accordingly, road infrastructure improvement and speed limit measures should be prioritised in those high-risk areas inside a city to better reduce road collisions. In the past decade, as geo-coded or geo-referenced road collisions (crashes) are publicly available, geovisualisation and spatio-temporal analysis of road collisions are increasingly performable. On the one hand, point-level collision data enables us to identify spatial clustering of collisions without considering spatial distribution of “population”. For point-level collision data, popular clustering methods have been developed, including kernel density estimation [1,2,3], network kernel density estimation [4,5,6], Ripley K-function [3,7], and K-means [8]. One the other hand, area-level collision volume data enable us to conduct cluster detection after taking account of “population”. Typically, Kulldorff’s spatial cluster detection methods have been widely used to detect spatial clusters of collision injuries [9,10]. Clustering identification results indicate areas with a high density of collisions (events or points) while cluster detection results indicate areas at high risk of collisions. Compared to cluster identification of road collisions, cluster detection of road collisions after considering the distribution of “population (traffic flows)” is scarce. Moreover, the existing studies on collision cluster detection have three limitations: (1) they focus mainly on spatial cluster detection but have not been extended to spatio-temporal cluster detection; (2) they mainly choose residential population or working population to represent the “population variable” in the cluster detection setting while traffic flow volume can, indeed, better represent “population variable”; and (3) as Kulldorff’s spatial cluster detection methods are computationally demanding, they are not suitable for a large data set.
An efficient spatio-temporal cluster detection method has been recently developed [11]. Since the cluster detection method applies a model-based approach, it can largely improve efficiency by avoiding simulations and detect clusters regardless of whether fixed effects or mixed effects are included in the model [11]. Moreover, the method enables us to take account of potential covariates in the cluster detection. According to the existing studies, road collisions are mainly attributable to human factors, vehicle factors and built environment factors. In other words, human factors (e.g., drowsiness, fatigue, alcohol usage, drug abuse, driving inexperience, non-seatbelt use and traffic violations) [12,13,14], vehicle factors (e.g., older vehicles, emergency vehicles, overloaded vehicles) [15,16,17] and built environment factors (e.g., lower levels of street connectivity, lower levels of land use mix, lack of traffic calming) [18,19,20] contribute to road collisions. Compared with human factors and vehicle factors, built-up environment factors are related closely to urban design and urban planning. Particularly, the influence of the built environment (e.g., street connectivity and land use) on collision occurrence has been reported [18]. Typically, street connectivity is reportedly associated with the occurrence of road collisions [19,20]. Count-based density measures (e.g., intersection density) and length-based density measures (e.g., road density) are likely to exhibit different types of associations with the occurrence of road collisions. For instance, more crashes are associated with higher road density [19], while fewer crashes are associated with higher intersection density [20]. Therefore, we can count street connectivity measures, including both count-based and length-based measures, as the potential covariates in this study.
Although it is of more interest to model road collisions according to human, vehicle and built environment factors, regression models cannot be firmly established due to the absence of required data on those factors. Instead, this study is dedicated to identifying areas at risk of road traffic safety issues by discovering spatio-temporal clusters of road collisions across a city. In this study, a Bayesian model-based detection method was applied to cluster detection instead of conventional cluster detection methods (e.g., Kulldorff’s spatial cluster detection methods), as the Bayesian model-based approach (1) is likely to produce a larger number of statistically significant clusters and more local areas are required to be identified as a result; and (2) it allows researchers to incorporate covariates into cluster detection and thereby to identify potential risk factors that are worth new investigations [11]. Specifically, this study aims to detect spatio-temporal clusters of road collisions when replacing residential population with traffic flow volume as the “population variable”. Empirically, we used the district-level data across London from 2010 to 2014 to detect spatio-temporal clusters by district and year. Methodologically, we applied a fast Bayesian model-based detection method newly developed [11] to the road collision data due to its advantages: a model-based approach accounting for covariates and the application of a fast approximation method (integrated nested Laplace approximation) instead of a conventional one (Markov chain Monte Carlo methods). As empirical evidence on the association of street connectivity measures and the occurrence of road collisions has been found, we selected street connectivity measures as the potential covariates in the cluster detection. Furthermore, we detected spatio-temporal clusters of serious injury collisions when setting the number of road collisions as the “population variable”. Detection results for road collisions and serious injury collisions were compared. This study makes new contributions to this field by: (1) extending spatial cluster detection to spatio-temporal cluster detection; (2) replacing residential population with traffic flow volume as the “population variable”; (3) applying a new and faster cluster detection method which can further incorporate covariates into the cluster detection; and (4) examining the potential impact of the covariates (street connectivity measures) by comparing cluster detection results with no covariates and after adjusting for covariates.

2. Literature Review

Spatial analyses of road collisions across a city are mainly divided into two groups: point-based analyses and area-level analyses. In the group of point-based analyses, researchers have focused on the spatial distributions of road collisions along roads or around intersections. Kernel density estimation (KDE) methods were initially used to explore spatial clustering of road collisions [1,2,3]. After considering the structure of road network, network kernel density estimation (NKDE) methods were adopted to improve the clustering analysis of road collisions [4,5,6]. Application of K-means allows researchers to define the number of clusters (groups) [8] while the application of KDE focuses on the concentration of high-density road collisions. Compared with KDE, NKDE and K-means methods, Ripley K-function methods were developed to determine the global distribution pattern of road collisions, including random distribution, clustering distribution and even distribution [3,7]. KDE and NKDE methods can be further utilised to investigate local areas with high clustering of road collisions if Ripley K-function methods determine that the global distribution pattern of road collisions is clustering distribution [3,7]. Those point-based analyses uncovered several findings on spatial distribution of road collisions: e.g., more road collisions have occurred at road intersections than on road segments [3]; meanwhile more road collisions have occurred along motorways than along other types of road [7].
In the group of area-based analyses, researchers have focused more on the spatial distribution of road collisions in relation to socioeconomic and built environment characteristics. First, researchers identified clusters of road collisions largely existed in those areas with lower socioeconomic status (e.g., densely populated or poorer areas) [9,10]. Second, relevant studies explained the spatial variations of road collisions by using a variety of regression models, including Poisson models (e.g., spatial lag, spatial multinomial-generalised Poisson, and Poisson log-normal regression models) [21,22,23,24], Bayesian models (e.g., Bayesian spatial joint, Bayesian spatial random parameters Tobit, and Bayesian–Poisson log-normal models) [25,26,27,28], and spatially varying coefficients models (e.g., geographically weighted regression and Bayesian spatially varying coefficients models) [29,30]. Bayesian models are reported to outperform Poisson models in modelling road collisions [29,30]. Third, impacts of socioeconomic and built environment characteristics on road collisions were investigated at the area level [23,27,29], the intersection level [21,24,25], and the road segment (street) level [22,25,26]. More specifically, population [29], traffic volume [29] and speed limit measures [29,30] are reported to contribute to road collisions at the area level. Roadway configuration, the type of approach roadway function, the type of traffic control, the total daily volume of entering traffic and the split of volumes between approaches are all associated with collision frequency at intersections [21], while increased traffic volume and poorer pavement conditions are associated with more collisions at road segments [26]. More collisions are reported to occur at intersections with signal controls, with more intersecting legs, and with higher speed limits, while more collisions are reported to occur on road segments with more lanes, more accesses, higher speed limits and worse pavement conditions [25].

3. Materials and Methods

In this section, data on crime and socioeconomic factors are introduced. The spatio-temporal cluster detection method used is presented, followed by a list of socioeconomic factors as potential covariates.

3.1. Data

In this study, we focus on 5-year road collisions across the region of Greater London. It consists of 33 districts, including City of London and 32 boroughs (see Figure 1). The district-level road collision data were downloaded from the London Datastore (https://data.london.gov.uk/dataset/road-collisions-severity). According to the level of severity, the road collisions are classified into “fatal injury”, “serious injury”, and “slight injury”. Table 1 shows the number of road collisions in London by severity and year. The number of road collisions increases largely after 2012 when the 2012 Summer Olympics took place in London. From 2012 to 2013, the number of road collisions by each severity level increases by more than 50%. The district-level motor vehicle flow volume data were downloaded from the website of GOV.UK (https://www.gov.uk/government/statistical-data-sets/road-traffic-statistics-tra). The flow volume is represented by the number of vehicles passing in 24 h at an average point on the road network in each local authority. It is calculated by dividing the estimate of annual vehicle miles in each local authority by the length of road in that authority and number of days in the year. The road network data were downloaded from the Ordnance Survey (https://www.ordnancesurvey.co.uk/business-government/products/open-map-roads). Figure 2 box-plots district-level collision rate and serious injury collision rate across London from 2010 to 2014. As Figure 2 shows, inter-annual variability in collision rate is not high across London though collision rate is relatively low in 2013. Figure 3 maps district-level road collision rate and serious injury collision rate (i.e., the number of serious injury collisions/the number of motor vehicle flows) in 2012 (note: 2012 is in the middle of the 5 years).

3.2. Detecting Spatio-Temporal Clusters of Road Collisions

3.2.1. Fast Bayesian Model-Based Cluster Detection
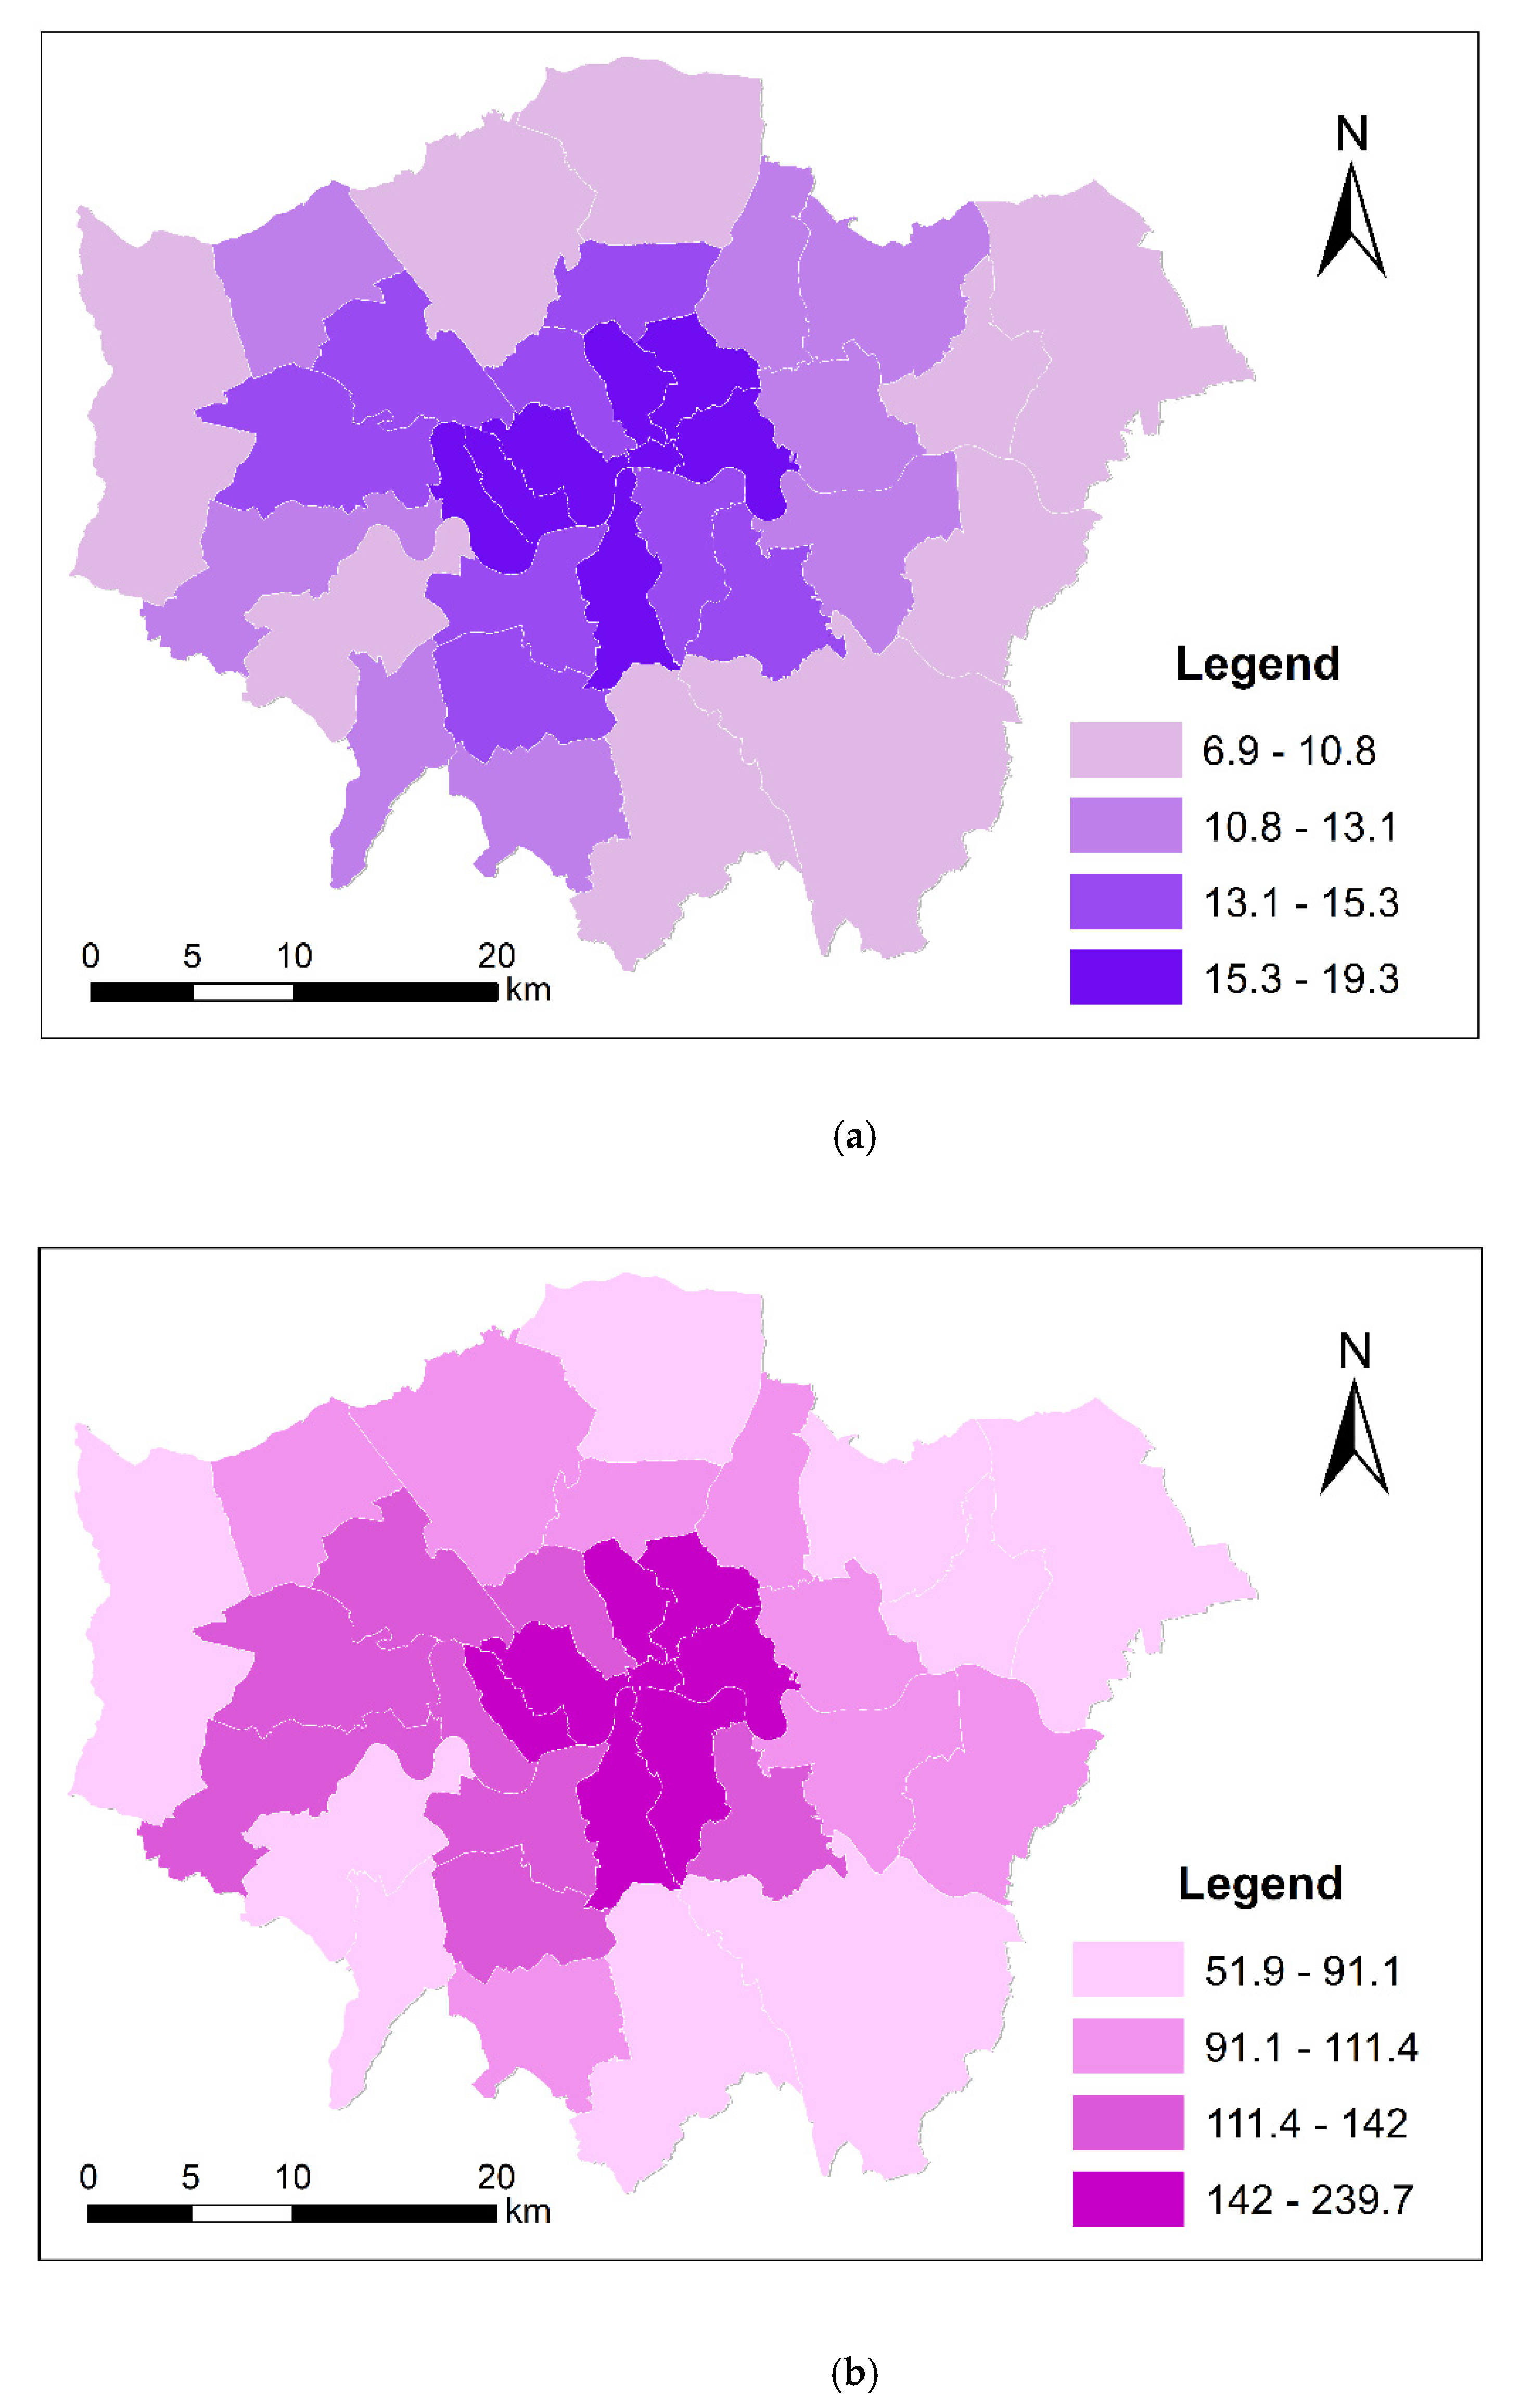
Based on the model-based approaches of [31] for the detection of spatial disease clusters to space and time [32], Gómez-Rubio et al. [11] propose a new approach that uses dummy variables in a regression model to group regions into clusters. The importance of the clusters is assessed based on a likelihood calculation that measures the extent to which the clusters capture the variability in the outcome [11]. To address a huge computational burden due to the usage of Bayesian hierarchical models fit by means of Markov chain Monte Carlo (MCMC) methods, Gómez-Rubio et al. [11] use a fast approximation method (integrated nested Laplace approximation) proposed by Rue et al. [33] to fit the model, and provide a reasonable estimate of the coefficient of the cluster variables and compute the deviance information criterion (DIC) in model selection. Theoretically, the problem of cluster detection is regarded as a problem of variable selection, where covariates include a number of dummy variables that represent all possible clusters [11]. Hence, when fitting an individual model to test for different clusters, this approach, based on integrated nested Laplace approximation (INLA), will be faster than fitting the same models with MCMC [11].
For the sake of brevity, we present the model as follows [32]:
l o g ( μ i , t ) = l o g ( E i , t ) + γ j c i , t ( j )
where μi,t is the mean of area i at time t, and Ei,t is the expected number of cases in area i at time t. c i , t ( j ) is a cluster dummy variable for spatio-temporal cluster j, and γ j is the coefficient of the cluster dummy variable.
Note how now data are indexed according to space and time. Dummy cluster variables are defined as in the spatial case, by considering areas in the cluster according to their distance to the cluster centre, for data within a particular time period. When defining a temporal cluster, areas are aggregated using all possible temporal windows up to a predefined temporal range.
Moreover, Ei,t is computed as follows [11]: “Raw expected cases Ei,t are computed using the population in each area. Covariate standardised expected number of cases Ei,t is computed fitting a Poisson regression (generalised linear model) with offset log(Ei,t) on the covariates. Then, the fitted values from this model are used to compute the expected number of cases using Equation (1).”

3.2.2. Covariates

Table 2 lists the covariates considered in this study. The response is the number of road collisions (unit: count). The covariates are street connectivity indicators, including road density (i.e., length of roads/area) and intersection density (i.e., number of road intersections/area). Table 2 also shows statistical descriptions for the covariates.
In this study, the cluster detection is implementable in R. Specifically, the model-based cluster detection method is supported by an R package named “DClusterm” [32].

4. Results and Discussion

This section demonstrates the cluster detection results with no covariates or after adjusting for covariates, and discusses the potential impacts of potential covariates. Furthermore, the results of cluster detection for serious injury collisions are presented. They are further compared with those detected for road collisions.

4.1. Cluster Detection: Spatio-Temporal Clusters of Road Collisions

We applied the fast Bayesian model-based cluster detection method to the 165 observations (33 districts × 5 years) with no covariates and after adjusting for covariates respectively. In the cluster detection, the “case variable” is the number of road collisions by district and year; the “population variable” is the number of motor vehicle flows by district and year.

4.1.1. Cluster Detection with no Covariates

First of all, we implemented the model-based cluster detection method with no covariates. Covariate standardised expected number of cases Ei,t was computed fitting a Poisson regression (generalised linear model) with offset log(Ei,t) on no covariates (see Equation (1)). The generalised linear model (GLM) estimated is shown in Table 3 (see GLM 1). As a result, five statistically significant clusters were detected with a p-value of below 0.05. These clusters are list in Table 4 and mapped in Figure 4 (see Table 4 and Figure 4a). In Table 4, the clusters are ranked according to the p-value in ascending order. All these clusters cover 5 years from 2010 to 2014 (see Table 4). Specifically, the most significant cluster (Cluster 1 in Figure 4a) and the second most significant cluster (Cluster 2 in Figure 4a) are located around the central areas (inner boroughs in Figure 1); while the other three clusters (Cluster 3, 4 and 4 in Figure 4a) are located around the peripheral areas (outer boroughs in Figure 1).

4.1.2. Cluster Detection after Adjusting for Covariates

Subsequently, we implemented the model-based cluster detection method after adjusting for covariates. Ei,t was computed fitting a Poisson regression (generalised linear model) with offset log(Ei,t) on two covariates: RD (road density) and ID (intersection density). The GLM estimated is shown in Table 3 (see GLM 2). Expectedly, RD is statistically significantly and positively associated with observed number of road collisions (response), while ID is statistically significantly and negatively associated with observed number of road collisions (response). As a result, 6 statistically significant clusters were detected with a p-value of below 0.05. These clusters are listed in Table 5 and mapped in Figure 4 (see Table 5 and Figure 4b). In Table 5, the clusters are ranked according to the p-value in ascending order. Clusters 5 and 6 cover 2 and 3 years respectively while the other 4 clusters cover 5 years (see Table 5). Specifically, Cluster 2 (the second most significant cluster) and Cluster 3 are located around the central areas (inner boroughs) while the other 4 clusters are located around the peripheral areas (see Figure 4b). Particularly, Cluster 1 (the most significant cluster) is located around the southern peripheral areas. It is noted that 2 districts belong to Cluster 5 from 2010 to 2011 and constitute Cluster 6 from 2012 and 2014.

4.1.3. Comparison of Cluster Detection with and without Covariates

We compared the clusters detected in the two models (with and without covariates). The geographic boundaries of clusters tend to move eastward from the detection results with the covariates to those without the covariates (see Figure 4). Cluster 2 is an exception as its geographic boundaries remain the same. This indicates that Cluster 2 is unlikely to be explained by the covariates while the other clusters are partly explained by the covariates. Particularly, the most significant cluster (Cluster 1 in Figure 4a) changes into the third most significant cluster (Cluster 3 in Figure 4b) after adjusting for the potential covariates. Additionally, the most significant cluster (Cluster 1) moves from the central areas (inner boroughs) to southern peripheral areas (outer boroughs) (see Cluster 1 in Figure 4a and Cluster 1 in Figure 4b). Generally, the covariates are likely to have potential impact on the clusters of road collisions.
We further examined the high-risk areas (i.e., areas covered by clusters) which disappeared or newly appeared in relation to the two covariates. Figure 5 maps the covariates (i.e., RD and ID) across London. After comparing Figure 4a,b, we can identify 4 disappearing areas and 2 newly disappearing areas after adjusting for the covariates. Moreover, as Table 3 shows, RD is positively associated with the number of road collisions while ID is negatively associated with the number of road collisions. Accordingly, among the four disappearing high-risk areas, two co-locate with a high level of RD while the other two co-locate with a low level of ID (see Figure 4 and Figure 5 together). Figure 6 shows the two areas mainly caused by a high level of RD, the two areas mainly caused by a low level of ID, and the two areas newly appearing after adjusting for the covariates. Apart from the 4 disappearing high-risk areas, other high-risk areas are unlikely to be attributable to the two covariates (i.e., RD and ID). In other words, the majority of high-risk areas are not attributable to street connectivity. Besides, further investigations are needed to explain the remaining high-risk areas.

4.2. Cluster Detection: Spatio-Temporal Clusters of Serious Injury Collisions

Likewise, we applied the fast Bayesian model-based cluster detection method to the 165 observations (33 districts × 5 years) with no covariates. In the cluster detection, the “case variable” is the number of serious injury road collisions by district and year whist the “population variable” is the number of all-type road collisions by district and year. As a result, five statistically significant clusters were detected with a p-value of below 0.05. These clusters are listed in Table 6 and mapped in Figure 7 (see Table 6 and Figure 7). Specifically, the most significant cluster (Cluster 1 in Figure 7) located around the central areas (City of London and inner boroughs) covers only 2011 and 2012; the second most significant cluster (Cluster 2 in Figure 7), located in southwestern London, covers only 2010. Cluster 3, located in the City of London, covers 2013 and 2014; Cluster 4, located in the northwestern peripheries (outer boroughs), covers only 2013; and Cluster 5, located in the southwestern peripheries (outer boroughs), covers 3 years (from 2011 to 2013).

4.3. Discussion

Generally, the covariates are likely to have potential impacts on the clusters of road collisions. The most significant cluster moves from central areas (inner boroughs) to southern peripheral areas (outer boroughs) after adjusting for the covariates. Moreover, as the potential covariates used in this study, length-based road density exhibits a positive association with the number of road collisions while count-based intersection density exhibits a negative association. This is consistent with some previous studies [19,20]. Furthermore, we compared the cluster detection results for road collisions and serious injury collisions (see Figure 4 and Figure 7). Most of these areas at risk of serious injury collisions overlay those at risk of road collisions. Although not being identified as areas at risk of road collisions, some districts, e.g., City of London, are regarded as areas at risk of serious injury collisions.

5. Conclusions

In this study, we aimed to detect spatio-temporal clusters of road collisions across Greater London from 2010 to 2014. We implemented a fast Bayesian model-based cluster detection method with no covariates and after adjusting for covariates respectively. As a result, the most significant and second most significant clusters were located around the central areas covering 5 years. Moreover, after adjusting for the covariates, the most significant cluster moves from the central areas to the peripheral areas, while the second most significant cluster remains unchanged. Although the covariates (i.e., RD and ID) exhibit potential impact on the clusters of road collisions, they are unlikely to contribute to the majority of high-risk areas. Furthermore, we detected spatio-temporal clusters of serious injury collisions. As expected, most of the areas at risk of serious injury collisions overlay those at risk of road collisions. Although not being identified as areas at risk of road collisions, some districts, e.g., City of London, are regarded as areas at risk of serious injury collisions.
However, there are some limitations in this study. Firstly, we cannot undertake cluster detection by a higher level of temporal granularity (e.g., month) or spatial granularity (e.g., smaller area, street or intersection) due to the absence of spatio-temporally fine-grained traffic flow volume data. Due to the potential presence of the modifiable areal unit problem (MAUP), the cluster detection results might differ from fine-grained data and coarse-grained data. Secondly, although traffic flows should include traffic flows by different transport modes, we had to use motor vehicle flows rather than all-mode traffic flow to represent traffic flows in this study due to the absence of pedestrian and cycle flow volume. Thirdly, apart from traffic flow volume, other dynamic factors (e.g., weather conditions) have not been considered in this study. The impacts of street connectivity on road collisions might be better examined after adjusting for weather conditions.
We will attempt to address those limitations in the future. Firstly, we will perform a similar study in another city with the availability of fine-grained traffic flow data. This would help to understand the potential influence of the MAUP on the cluster detection. Secondly, we will attempt to repeat this study once all-mode traffic flow data are publicly available. The cluster detection results might differ between selected motor vehicle flow volume and all-mode traffic flow volume as the population variable. Thirdly, to take account of more built-up environmental factors as potential covariates, we will select transport facilities including traffic calming, walkways and sidewalks once the data are publicly available. Fourthly, we would include more dynamic factors (e.g., weather conditions) in the future. Finally, since previous studies argued that the reduced travel speed caused by increasing traffic volume may decrease the likelihood of crash occurrence [26], we would consider traffic volume and traffic speed that could be both observed or estimated [34].

Author Contributions

Conceptualization, Y.S., Y.W., K.Y.; methodology, Y.S.; formal analysis and investigation, Y.S., Y.W.; writing—original draft preparation, Y.S., Y.W., K.Y.; writing—review and editing, Y.S., T.O.C., Y.H.; funding acquisition, Y.S.; resources, Y.S., Y.W. All authors have read and agreed to the published version of the manuscript.

Funding

This work is supported by the Fundamental Research Funds for the Central Universities (Grant No. 37000-31610453), China and the Independent Innovation Fund of Tianjin University (Grant No. 2020XRY-0010).

Acknowledgments

We are thankful to the anonymous reviewers for their helpful comments.

Conflicts of Interest

The authors declare no conflict of interest.

References

  1. Bíl, M.; Andrášik, R.; Janoška, Z. Identification of hazardous road locations of traffic accidents by means of kernel density estimation and cluster significance evaluation. Accid. Anal. Prev. 2013, 55, 265–273. [Google Scholar] [CrossRef] [PubMed]
  2. Thakali, L.; Kwon, T.J.; Fu, L. Identification of crash hotspots using kernel density estimation and kriging methods: A comparison. J. Mod. Transp. 2015, 23, 93–106. [Google Scholar] [CrossRef] [Green Version]
  3. Chen, X.; Huang, L.; Dai, D.; Zhu, M.; Jin, K. Hotspots of road traffic crashes in a redeveloping area of Shanghai. Int. J. Inj. Control Saf. Promot. 2018, 25, 293–302. [Google Scholar] [CrossRef] [PubMed]
  4. Mohaymany, A.S.; Shahri, M.; Mirbagheri, B. GIS-based method for detecting high-crash-risk road segments using network kernel density estimation. Geo Spat. Inf. Sci. 2013, 16, 113–119. [Google Scholar] [CrossRef]
  5. Nie, K.; Wang, Z.; Du, Q.; Ren, F.; Tian, Q. A network-constrained integrated method for detecting spatial cluster and risk location of traffic crash: A case study from Wuhan, China. Sustainability 2015, 7, 2662–2677. [Google Scholar] [CrossRef] [Green Version]
  6. Fan, Y.; Zhu, X.; She, B.; Guo, W.; Guo, T. Network-constrained spatio-temporal clustering analysis of traffic collisions in Jianghan District of Wuhan, China. PLoS ONE 2018, 13, e0195093. [Google Scholar] [CrossRef]
  7. Ouni, F.; Belloumi, M. Spatio-temporal pattern of vulnerable road user’s collisions hot spots and related risk factors for injury severity in Tunisia. Transp. Res. Part F Traffic Psychol. Behav. 2018, 56, 477–495. [Google Scholar] [CrossRef]
  8. Kim, K.; Yamashita, E.Y. Using a k-means clustering algorithm to examine patterns of pedestrian involved crashes in Honolulu, Hawaii. J. Adv. Transp. 2007, 41, 69–89. [Google Scholar] [CrossRef]
  9. Warden, C.R. Comparison of Poisson and Bernoulli spatial cluster analyses of pediatric injuries in a fire district. Int. J. Health Geogr. 2008, 7, 51. [Google Scholar] [CrossRef] [Green Version]
  10. Minamisava, R.; Nouer, S.S.; de Morais Neto, O.L.; Melo, L.K.; Andrade, A.L.S. Spatial clusters of violent deaths in a newly urbanized region of Brazil: Highlighting the social disparities. Int. J. Health Geogr. 2009, 8, 66. [Google Scholar] [CrossRef] [Green Version]
  11. Gómez-Rubio, V.; Molitor, J.; Moraga, P. Fast Bayesian classification for disease mapping and the detection of disease clusters. In Quantitative Methods in Environmental and Climate Research; Springer: Cham, Switzerland, 2018; pp. 1–27. [Google Scholar]
  12. Petridou, E.; Moustaki, M. Human factors in the causation of road traffic crashes. Eur. J. Epidemiol. 2000, 16, 819–826. [Google Scholar] [CrossRef] [PubMed]
  13. Adanu, E.K.; Smith, R.; Powell, L.; Jones, S. Multilevel analysis of the role of human factors in regional disparities in crash outcomes. Accid. Anal. Prev. 2017, 109, 10–17. [Google Scholar] [CrossRef] [PubMed]
  14. Siskind, V.; Steinhardt, D.; Sheehan, M.; O’Connor, T.; Hanks, H. Risk factors for fatal crashes in rural Australia. Accid. Anal. Prev. 2011, 43, 1082–1088. [Google Scholar] [CrossRef] [Green Version]
  15. Yau, K.K. Risk factors affecting the severity of single vehicle traffic accidents in Hong Kong. Accid. Anal. Prev. 2004, 36, 333–340. [Google Scholar] [CrossRef]
  16. Zhang, G.; Yau, K.K.; Chen, G. Risk factors associated with traffic violations and accident severity in China. Accid. Anal. Prev. 2013, 59, 18–25. [Google Scholar] [CrossRef]
  17. Hsiao, H.; Chang, J.; Simeonov, P. Preventing emergency vehicle crashes: Status and challenges of human factors issues. Hum. Factors 2018, 60, 1048–1072. [Google Scholar] [CrossRef]
  18. Miranda-Moreno, L.F.; Morency, P.; El-Geneidy, A.M. The link between built environment, pedestrian activity and pedestrian–vehicle collision occurrence at signalized intersections. Accid. Anal. Prev. 2011, 43, 1624–1634. [Google Scholar] [CrossRef]
  19. Wang, X.; Yang, J.; Lee, C.; Ji, Z.; You, S. Macro-level safety analysis of pedestrian crashes in Shanghai, China. Accid. Anal. Prev. 2016, 96, 12–21. [Google Scholar] [CrossRef] [Green Version]
  20. Marshall, W.E.; Garrick, N.W. Does street network design affect traffic safety? Accid. Anal. Prev. 2011, 43, 769–781. [Google Scholar] [CrossRef]
  21. Castro, M.; Paleti, R.; Bhat, C.R. A latent variable representation of count data models to accommodate spatial and temporal dependence: Application to predicting crash frequency at intersections. Transp. Res. B-Meth. 2012, 46, 253–272. [Google Scholar] [CrossRef] [Green Version]
  22. Cai, Q.; Abdel-Aty, M.; Lee, J.; Wang, L.; Wang, X. Developing a grouped random parameters multivariate spatial model to explore zonal effects for segment and intersection crash modeling. Anal. Methods Accid. 2018, 19, 1–5. [Google Scholar] [CrossRef]
  23. Cai, Q.; Lee, J.; Eluru, N.; Abdel-Aty, M. Macro-level pedestrian and bicycle crash analysis: Incorporating spatial spillover effects in dual state count models. Accid. Anal. Prev. 2016, 93, 14–22. [Google Scholar] [CrossRef] [PubMed]
  24. Huang, H.; Zhou, H.; Wang, J.; Chang, F.; Ma, M. A multivariate spatial model of crash frequency by transportation modes for urban intersections. Anal. Methods Accid. 2017, 14, 10–21. [Google Scholar] [CrossRef]
  25. Zeng, Q.; Huang, H. Bayesian spatial joint modeling of traffic crashes on an urban road network. Accid. Anal. Prev. 2014, 67, 105–112. [Google Scholar] [CrossRef]
  26. Zeng, Q.; Wen, H.; Huang, H.; Abdel-Aty, M. A Bayesian spatial random parameters Tobit model for analyzing crash rates on roadway segments. Accid. Anal. Prev. 2017, 100, 37–43. [Google Scholar] [CrossRef] [PubMed]
  27. Liu, C.; Sharma, A. Exploring spatio-temporal effects in traffic crash trend analysis. Anal. Methods Accid. 2017, 16, 104–116. [Google Scholar] [CrossRef] [Green Version]
  28. Guo, Q.; Xu, P.; Pei, X.; Wong, S.C.; Yao, D. The effect of road network patterns on pedestrian safety: A zone-based Bayesian spatial modeling approach. Accid. Anal. Prev. 2017, 99, 114–124. [Google Scholar] [CrossRef] [PubMed] [Green Version]
  29. Xu, P.; Huang, H.; Dong, N.; Wong, S.C. Revisiting crash spatial heterogeneity: A Bayesian spatially varying coefficients approach. Accid. Anal. Prev. 2017, 98, 330–337. [Google Scholar] [CrossRef] [Green Version]
  30. Rhee, K.A.; Kim, J.K.; Lee, Y.I.; Ulfarsson, G.F. Spatial regression analysis of traffic crashes in Seoul. Accid. Anal. Prev. 2016, 91, 190–199. [Google Scholar] [CrossRef]
  31. Jung, I.A. Generalized linear models approach to spatial scan statistics for covariate adjustment. Stat. Med. 2009, 28, 1131–1143. [Google Scholar] [CrossRef]
  32. Gómez-Rubio, V.; Moraga, P.; Molitor, J.; Rowlingson, B. DClusterm: Model-based detection of disease clusters. J. Stat. Softw. 2019, 90, 1–26. [Google Scholar] [CrossRef] [Green Version]
  33. Rue, H.; Martino, S.; Chopin, N. Approximate Bayesian inference for latent gaussian models by using integrated nested laplace approximation (with discussion). J. R Stat. Soc. Ser. B 2009, 71, 319–392. [Google Scholar] [CrossRef]
  34. Kim, H.; Kim, Y.; Jang, K. Systematic relation of estimated travel speed and actual travel speed. IEEE Trans. Intell. Transpo. Syst. 2017, 18, 2780–2789. [Google Scholar] [CrossRef]
Figure 1. Map of districts of Greater London.
Sustainability 12 08681 g001
Figure 2. Box-plot of district-level collision rate and serious injury collision rate across Greater London from 2010 to 2014. (a) Collision rate (cases/1000 flows). (b) Serious injury collision rate (cases/1000 flows).
Sustainability 12 08681 g002
Figure 3. District-level road collision rate and serious injury collision rate across Greater London in 2012. (a) Collision rate (cases/1000 flows). (b) Serious injury collision rate (cases/1000 flows).
Sustainability 12 08681 g003
Figure 4. The significant clusters of road collisions in Greater London (from 2010 to 2014). (a) Detection results with no covariates. (b) Detection results after adjusting for covariates.
Sustainability 12 08681 g004aSustainability 12 08681 g004b
Figure 5. District-level road connectivity measures across Greater London. (a) Road density (km/km2). (b) Intersection density (count/km2).
Sustainability 12 08681 g005
Figure 6. Classification of the significant clusters of road collisions.
Sustainability 12 08681 g006
Figure 7. The significant clusters of serious injury collisions in Greater London (from 2010 to 2014).
Sustainability 12 08681 g007
Table 1. The number of road collisions in Greater London by severity and year.
Year20102011201220132014
Fatal injury19792107190533423444
Serious injury25,69426,08626,48741,36043,331
Slight injury175,031172,217165,373255,715271,899
Total202,704200,410193,765300,417318,674
Table 2. The covariates that are considered in this study.
CategoryVariableFull NameMeanSD
ResponseN_RCNumber of road collisions (count)737.36253.96
CovariatesRDRoad density (km/km2)13.043.31
IDIntersection density (count/km2)120.5142.36
Table 3. The estimation results of generalised linear models (GLMs) (N = 165).
CoefficientGLM 1GLM 2
Intercept6.477 × 10−12−0.937 ***
RD 0.194 ***
ID −0.013 ***
AIC19,43815,086
Note: Significance codes: ***: 0.001.
Table 4. Statistically significant clusters of road collisions with no covariates.
ClusterSizeStart TimeEnd TimeStatisticp-ValueRisk
14201020141318.03<0.0010.391
23201020141265.73<0.0010.431
3520102014201.551<0.0010.143
4220102014197.901<0.0010.222
532010201427.061<0.0010.079
Table 5. Statistically significant clusters of road collisions after adjusting for covariates.
ClusterSizeStart TimeEnd TimeStatisticp-ValueRisk
12201020141115.666 <0.0010.573
2320102014533.565 <0.0010.273
3420102014517.329 <0.0010.239
4420102014371.843 <0.0010.224
55201020113.365 <0.0010.03
62201220142.052 <0.0010.03
Table 6. Statistically significant clusters of serious injury road collisions.
ClusterSizeStart TimeEnd TimeStatisticp-ValueRisk
1102011201259.633<0.0010.242
2132010201029.287<0.0010.234
312013201410.867<0.0010.490
44201320135.659<0.0010.175
51201120132.830<0.0010.193
Publisher’s Note: MDPI stays neutral with regard to jurisdictional claims in published maps and institutional affiliations.

