A Data Size Reduction Approach Applicable in Process Control System of Oil and Gas Plants
Abstract
1. Introduction
2. Details of the Selected Process Unit
3. Archived Data Specification
4. Data Size Reduction Methods
4.1. Frequency Domain and Statistical Analysis
4.1.1. Frequency-Domain Method
4.1.2. Adaptive Sampling Rate Method Investigation
4.1.3. Performance Index Based Analysis
4.1.4. Combination of Frequency and Statistical Analysis Methods
4.2. Traffic Model Analysis
4.3. Correlation Analysis
5. Effect of Proposed Data Size Reduction Methods on Control System Performance and Plant Safety
- (A)
- It should be ensured that any important change in the selected process variables is not missed, which enables the control/safety system to take an on-time and accurate reaction as a response. Hopefully, by applying a time–frequency analysis method (DWT method), finding drastic changes in the process variables is possible. As a result, by choosing a fast enough sampling rate, based on the presented methodology and according to time–frequency analysis, a suitable scheme can be designed to guarantee not to miss important changes in the selected process variables.
- (B)
- Another issue which may cause the missing of important changes in the process variables is the high volume of calculations between two consecutive sampling times. To prove this concept, the Harris performance index is a reliable benchmarking tool [8]. Two essential factors that affect the Harris performance index are sampling rate and controller dead-time [7]. So, for each method, the effects on these two factors are evaluated to find out whether they have any side effects on the control system performance.
5.1. Sampling Rate Changing Method
5.2. Traffic Enhancement Method
5.3. Correlation Analysis Method
- (C)
- Finally, there are many safety associated systems/equipment generally embedded in chemical plants, such as emergency shut down (ESD), safety and relief valves, which ensure a safe operation even if failures occur in the regular “control and monitoring” system.
6. Conclusions
Author Contributions
Funding
Acknowledgments
Conflicts of Interest
References
- Seborg, D.; Edgar, T.; Mellichamp, D. Process Dynamics and Control; Wiley: New York, NY, USA, 2004. [Google Scholar]
- Couper, J.R.; Penney, W.R.; Fair, J.R. Chemical Process Equipment Revised 2E: Selection and Design; Gulf Professional Publishing: Houston, TX, USA, 2009. [Google Scholar]
- McMillan, G.K.; Considine, D.M. Process/Industrial Instruments and Controls Handbook; McGraw Hill: New York, NY, USA, 1999. [Google Scholar]
- Park, J.; Mackay, S. Practical Data Acquisition for Instrumentation and Control Systems; Newnes, Elsevier, IDC Technologies: Perth, Australia, 2003. [Google Scholar]
- Chiang, L.; Lu, B.; Castillo, I. Big Data analytics in chemical engineering. Annu. Rev. Chem. Biomol. Eng. 2017, 8, 63–85. [Google Scholar] [CrossRef] [PubMed]
- Thornhill, N.F.; Shoukat Choudhury, M.; Shah, S.L. The impact of compression on data-driven process analyses. J. Process Control 2004, 14, 389–398. [Google Scholar] [CrossRef]
- Horch, A.; Isaksson, A.J. Assessment of the sampling rate in control systems. Control Eng. Pract. 2001, 9, 533–544. [Google Scholar] [CrossRef]
- Desborough, L.; Harris, T. Performance assessment measures for univariate feedback control. Can. J. Chem. Eng. 1992, 70, 1186–1197. [Google Scholar] [CrossRef]
- Jain, A.; Chang, E.Y. Adaptive sampling for sensor networks. In Proceedings of the 1st International Workshop on Data Management for Sensor Networks: In Conjunction with VLDB, Chicago, IL, USA, 27 June–2 July 2004; pp. 10–16. [Google Scholar]
- Zheng, L.; Chow, M.-Y. Adaptive multiple sampling rate scheduling of real-time networked supervisory control system-part I. In Proceedings of the IECON 2006—32nd Annual Conference on IEEE Industrial Electronics, Paris, France, 6–10 November 2006. [Google Scholar]
- Mah, R.; Tamhane, A.; Tung, S.; Patel, A. Process trending with piecewise linear smoothing. Comput. Chem. Eng. 1995, 19, 129–137. [Google Scholar] [CrossRef]
- Watson, M.J.; Liakopoulos, A.; Brzakovic, D.; Georgakis, C. A practical assessment of process data compression techniques. Ind. Eng. Chem. Res. 1998, 37, 267–274. [Google Scholar] [CrossRef]
- Hale, J.C.; Sellars, H.L. Historical data recording for process computers. Chem. Eng. Prog. 1981, 77, 11. [Google Scholar]
- Donoho, D.L.; Vetterli, M.; DeVore, R.A.; Daubechies, I. Data compression and harmonic analysis. IEEE Trans. Inf. Theory 1998, 44, 2435–2476. [Google Scholar] [CrossRef]
- Nesic, Z.; Davies, M.; Dumont, G. Paper machine data analysis and compression using wavelets. Tappi J. 1997, 80, 191–204. [Google Scholar]
- Hodson, R. Optimizing Fieldbus Link Schedules Makes a Difference! ISA EXPO 2005, 2005, 1711. [Google Scholar]
- Bezergianni, S.; Kalogianni, A. Application of principal component analysis for monitoring and disturbance detection of a hydrotreating process. Ind. Eng. Chem. Res. 2008, 47, 6972–6982. [Google Scholar] [CrossRef]
- AlGhazzawi, A.; Lennox, B. Monitoring a complex refining process using multivariate statistics. Control Eng. Pract. 2008, 16, 294–307. [Google Scholar] [CrossRef]
- Ur Rehman, M.H.; Liew, C.S.; Abbas, A.; Jayaraman, P.P.; Wah, T.Y.; Khan, S.U. Big data reduction methods: A survey. Data Sci. Eng. 2016, 1, 265–284. [Google Scholar] [CrossRef]
- Khan, A.R.; Schioler, H.; Kulahci, M.; Knudsen, T. Big data analytics for industrial process control. In Proceedings of the 2017 22nd IEEE International Conference on Emerging Technologies and Factory Automation (ETFA), Limassol, Cyprus, 12–15 September 2017; pp. 1–8. [Google Scholar]
- Moyne, J.; Iskandar, J. Big data analytics for smart manufacturing: Case studies in semiconductor manufacturing. Processes 2017, 5, 39. [Google Scholar] [CrossRef]
- Salomon, D. Data Compression: The Complete Reference; Springer: Berlin/Heidelberg, Germany, 2004. [Google Scholar]
- Lipták, B.G. Instrument Engineers’Handbook, Volume Two: Process Control and Optimization; CRC Press: Boca Raton, FL, USA, 2005; Volume 2. [Google Scholar]
- Baptista, M.; Sankararaman, S.; de Medeiros, I.P.; Nascimento, C., Jr.; Prendinger, H.; Henriques, E.M. Forecasting fault events for predictive maintenance using data-driven techniques and ARMA modeling. Comput. Ind. Eng. 2018, 115, 41–53. [Google Scholar] [CrossRef]
- Bao, Y. A general result on the estimation bias of ARMA models. J. Stat. Plan. Inference 2018, 197, 107–125. [Google Scholar] [CrossRef]
- Von Storch, H.; Zwiers, F.W. Statistical Analysis in Climate Research; Cambridge University Press: Cambridge, UK, 2001. [Google Scholar]
- Erwin, D.L. Industrial Chemical Process Design; McGraw Hill Professional: Pennsylvania Plaza, NY, USA, 2002. [Google Scholar]
- Norma, I. 5.1 Instrumentation Symbols and Identification; ANSI/ISA: Research Triangle Park, NC, USA, 1992. [Google Scholar]
- Markstein, P.W. The New IEEE-754 Standard for Floating Point Arithmetic. In Numerical Validation in Current Hardware Architectures; Springer-Verlag Berlin and Heidelberg GmbH & Co.: Berlin/Heidelberg, Germany, 2008. [Google Scholar]
- Citect Facilities 7.10 Service Pack 4- Release Notes. 2011. Available online: https://docplayer.net/1303759-Citectscada-7-10-release-notes-for-service-pack-4.html (accessed on 30 September 2019).
- Thornhill, N.; Oettinger, M.; Fedenczuk, P. Refinery-wide control loop performance assessment. J. Process Control 1999, 9, 109–124. [Google Scholar] [CrossRef][Green Version]
- Oppenheim, A.V.; Willsky, A.S.; Nawab, S.H. Signals and Systems; Prentice-Hall Englewood Cliffs: Upper Saddle River, NJ, USA, 1983; Volume 2. [Google Scholar]
- Daubechies, I. Ten Lectures on Wavelets; SIAM: Philadelphia, PA, USA, 1992; Volume 61. [Google Scholar]
- Percival, D.B.; Walden, A.T. Wavelet Methods for Time Series Analysis (Cambridge Series in Statistical and Probabilistic Mathematics); Cambridge University Press: Cambridge, UK, 2000. [Google Scholar]
- Carlson, A.B.; Crilly, P.; Rutledge, J. Communication Systems: An Introduction to Signals and Noise in Electrical Communication; McGraw Hill Professional: Pennsylvania Plaza, NY, USA, 1986. [Google Scholar]
- Bissell, C.C.; Chapman, D. Digital Signal Transmission; Cambridge University Press: Cambridge, UK, 1992. [Google Scholar]
- API RP 554: Process Instrumentation and Control; American Petroleum Institue: Washington, DC, USA, 1995.
- Chung, K.L.; AitSahlia, F. Elementary Probability Theory: With Stochastic Processes and an Introduction to Mathematical Finance (Undergraduate Texts in Mathematics); Springer-Verlag: New York, NY, USA, 2003. [Google Scholar]
- Beutler, F.J.; Leneman, O.A. The spectral analysis of impulse processes. Inf. Control 1968, 12, 236–258. [Google Scholar] [CrossRef][Green Version]
- Glanzer, D. Technical Overview: Foundation Fieldbus, FD-043 Revision 2.0; Fieldbus Foundation: Austin, TX, USA, 1998. [Google Scholar]
- Brockwell, P.J.; Davis, R.A. Time Series: Theory and Methods; Springer Science & Business Media: Berlin/Heidelberg, Germany, 2013. [Google Scholar]
- Sigua, R.G. Fundamentals of Traffic Engineering; UP Press: Metro Manila, Philippines, 2008. [Google Scholar]
- Corporation, N.I. Foundation Fieldbus Overview; National Instruments: Austin, TX, USA, 2011; Volume 370729C-01. [Google Scholar]
- Services, F.-R.E. Course 7032 Foundation Fieldbus Systems & Devices. 2000. Available online: http://www.emersonprocesscourseadvisor.eu (accessed on 30 September 2019).
- Mackay, S.; Wright, E.; Park, J. Practical Data Communications for Instrumentation and Control; Newnes, Elsevier, IDC Technologies: Perth, Australia, 2003. [Google Scholar]
- Yadav, D.; Singh, A.K. Microcontroller: Features and Applications; New Age International: New Delhi, India, 2004. [Google Scholar]
- SIMATIC. Auto Mation System S7-400 CPU Specification. 2008, Volume A5E00267840-03. Available online: http://www.tk-siemens.com/upload/PDF/tk-siemense.com-S7400.pdf (accessed on 30 September 2019).


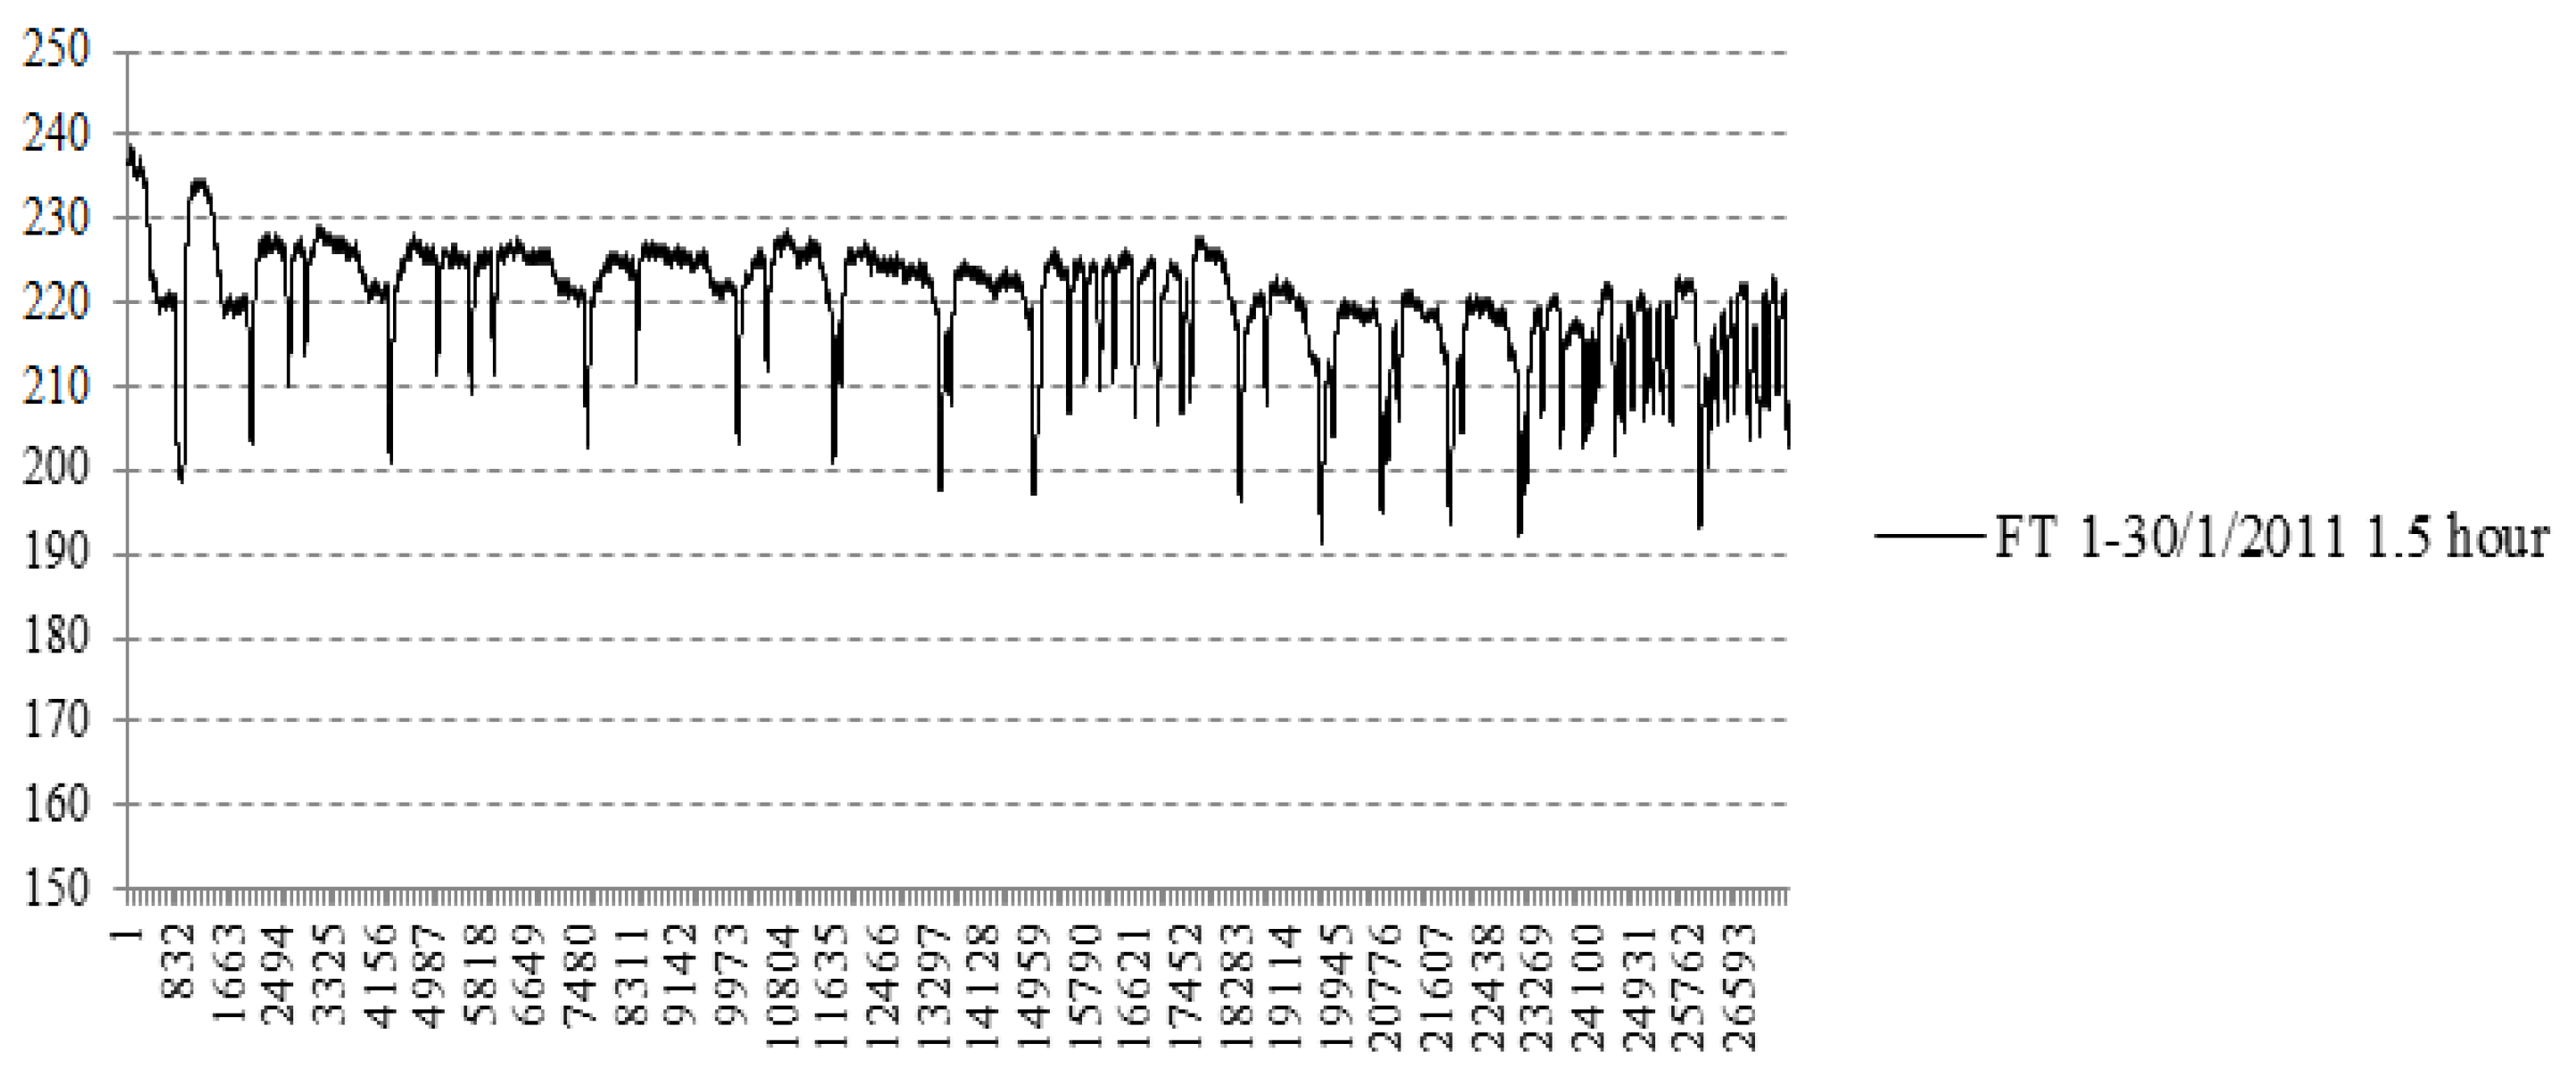
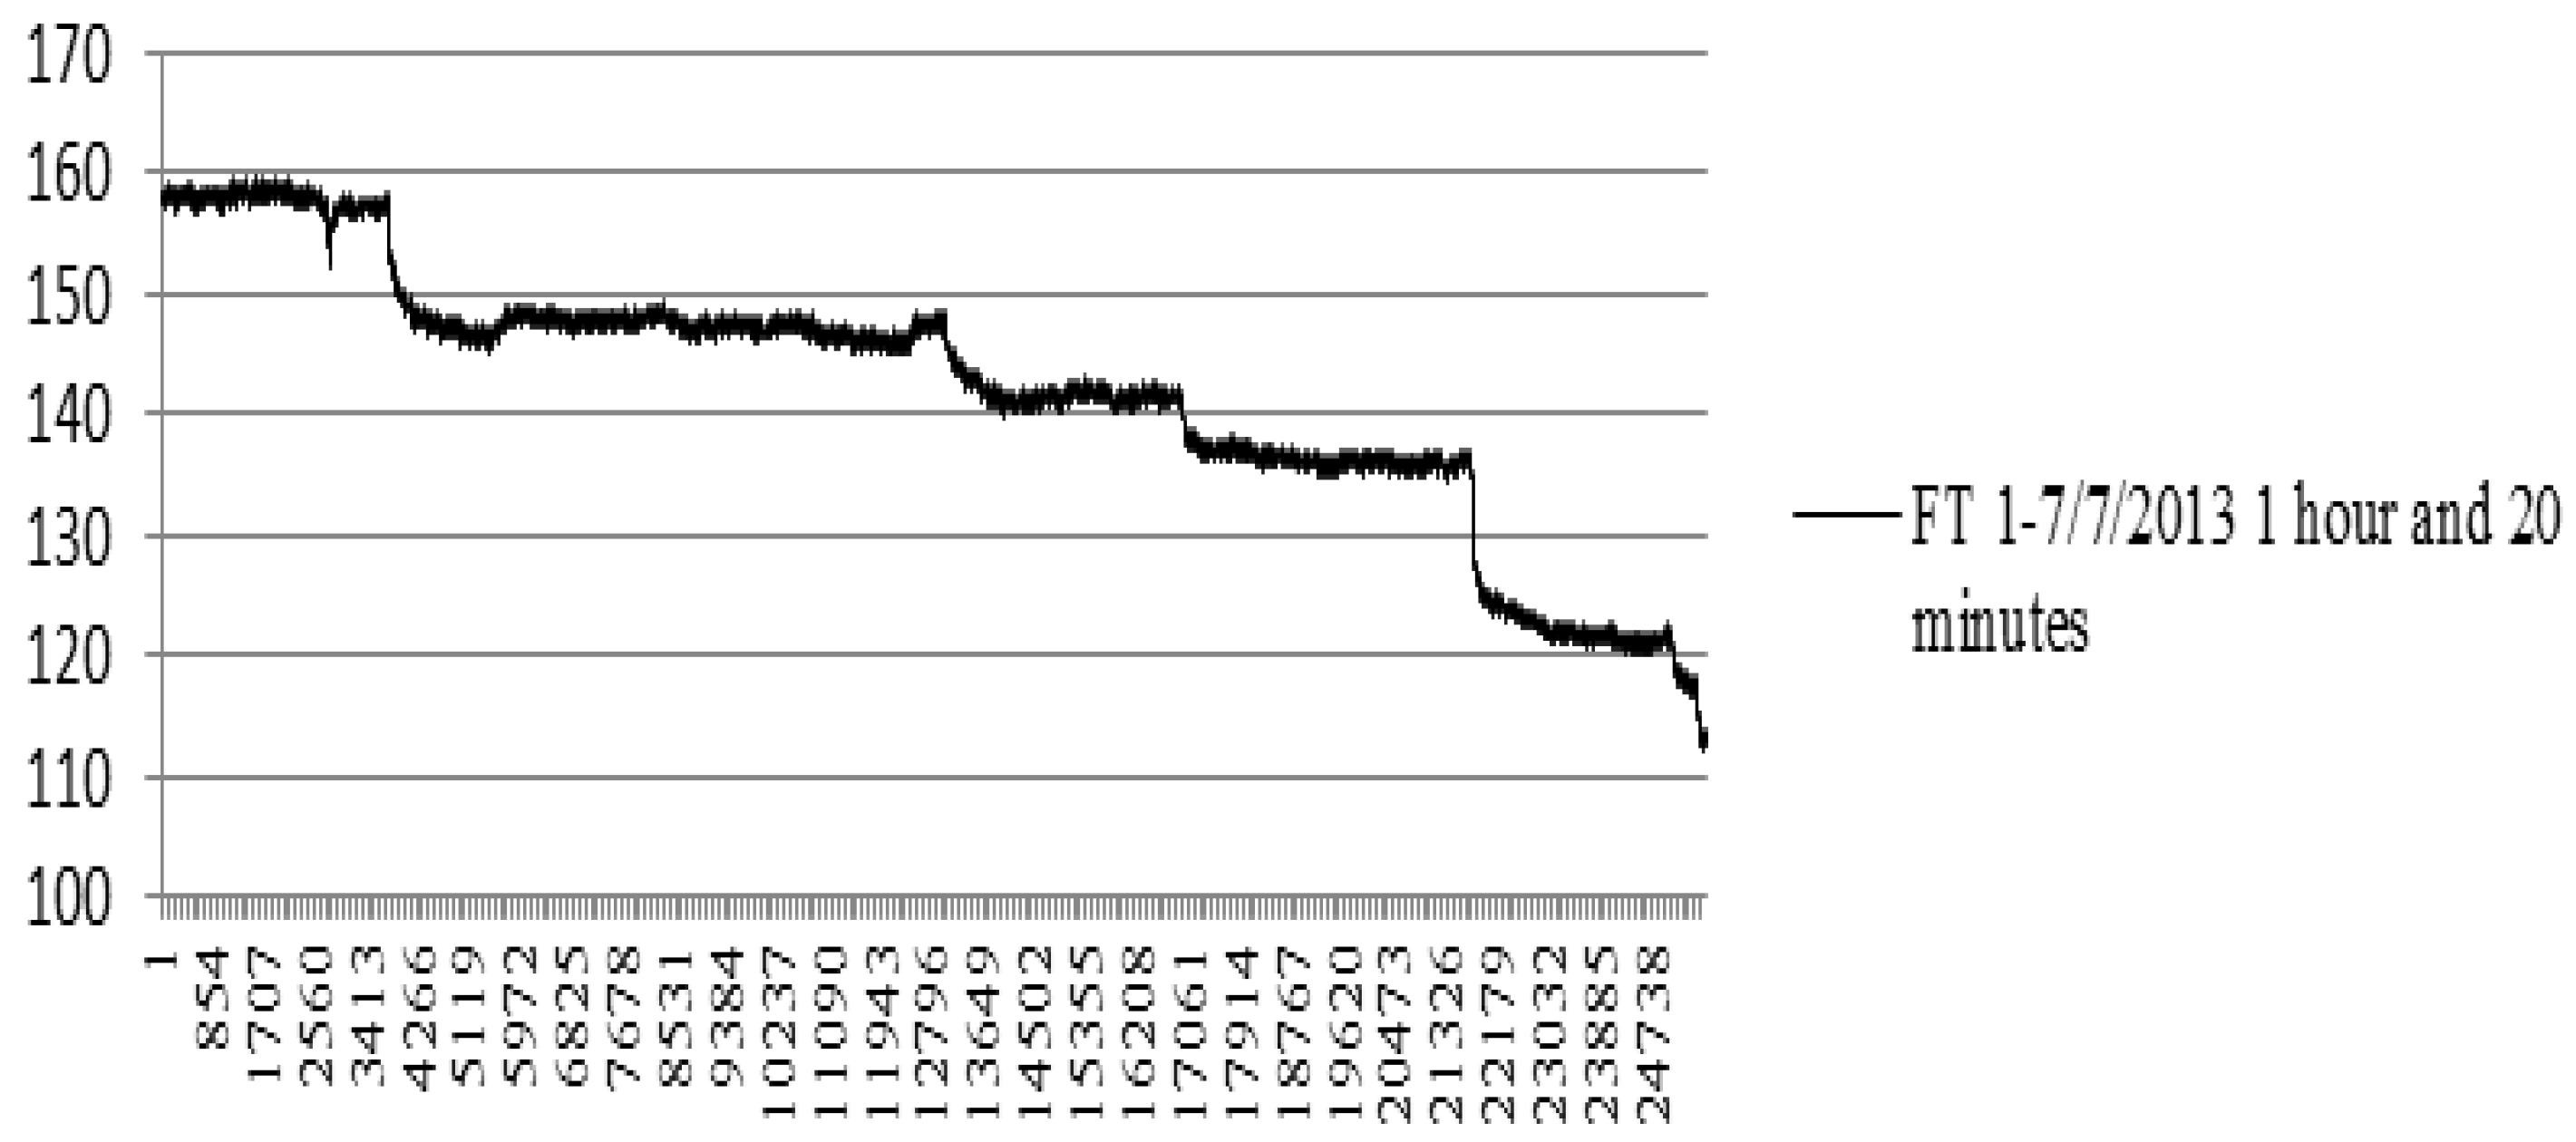

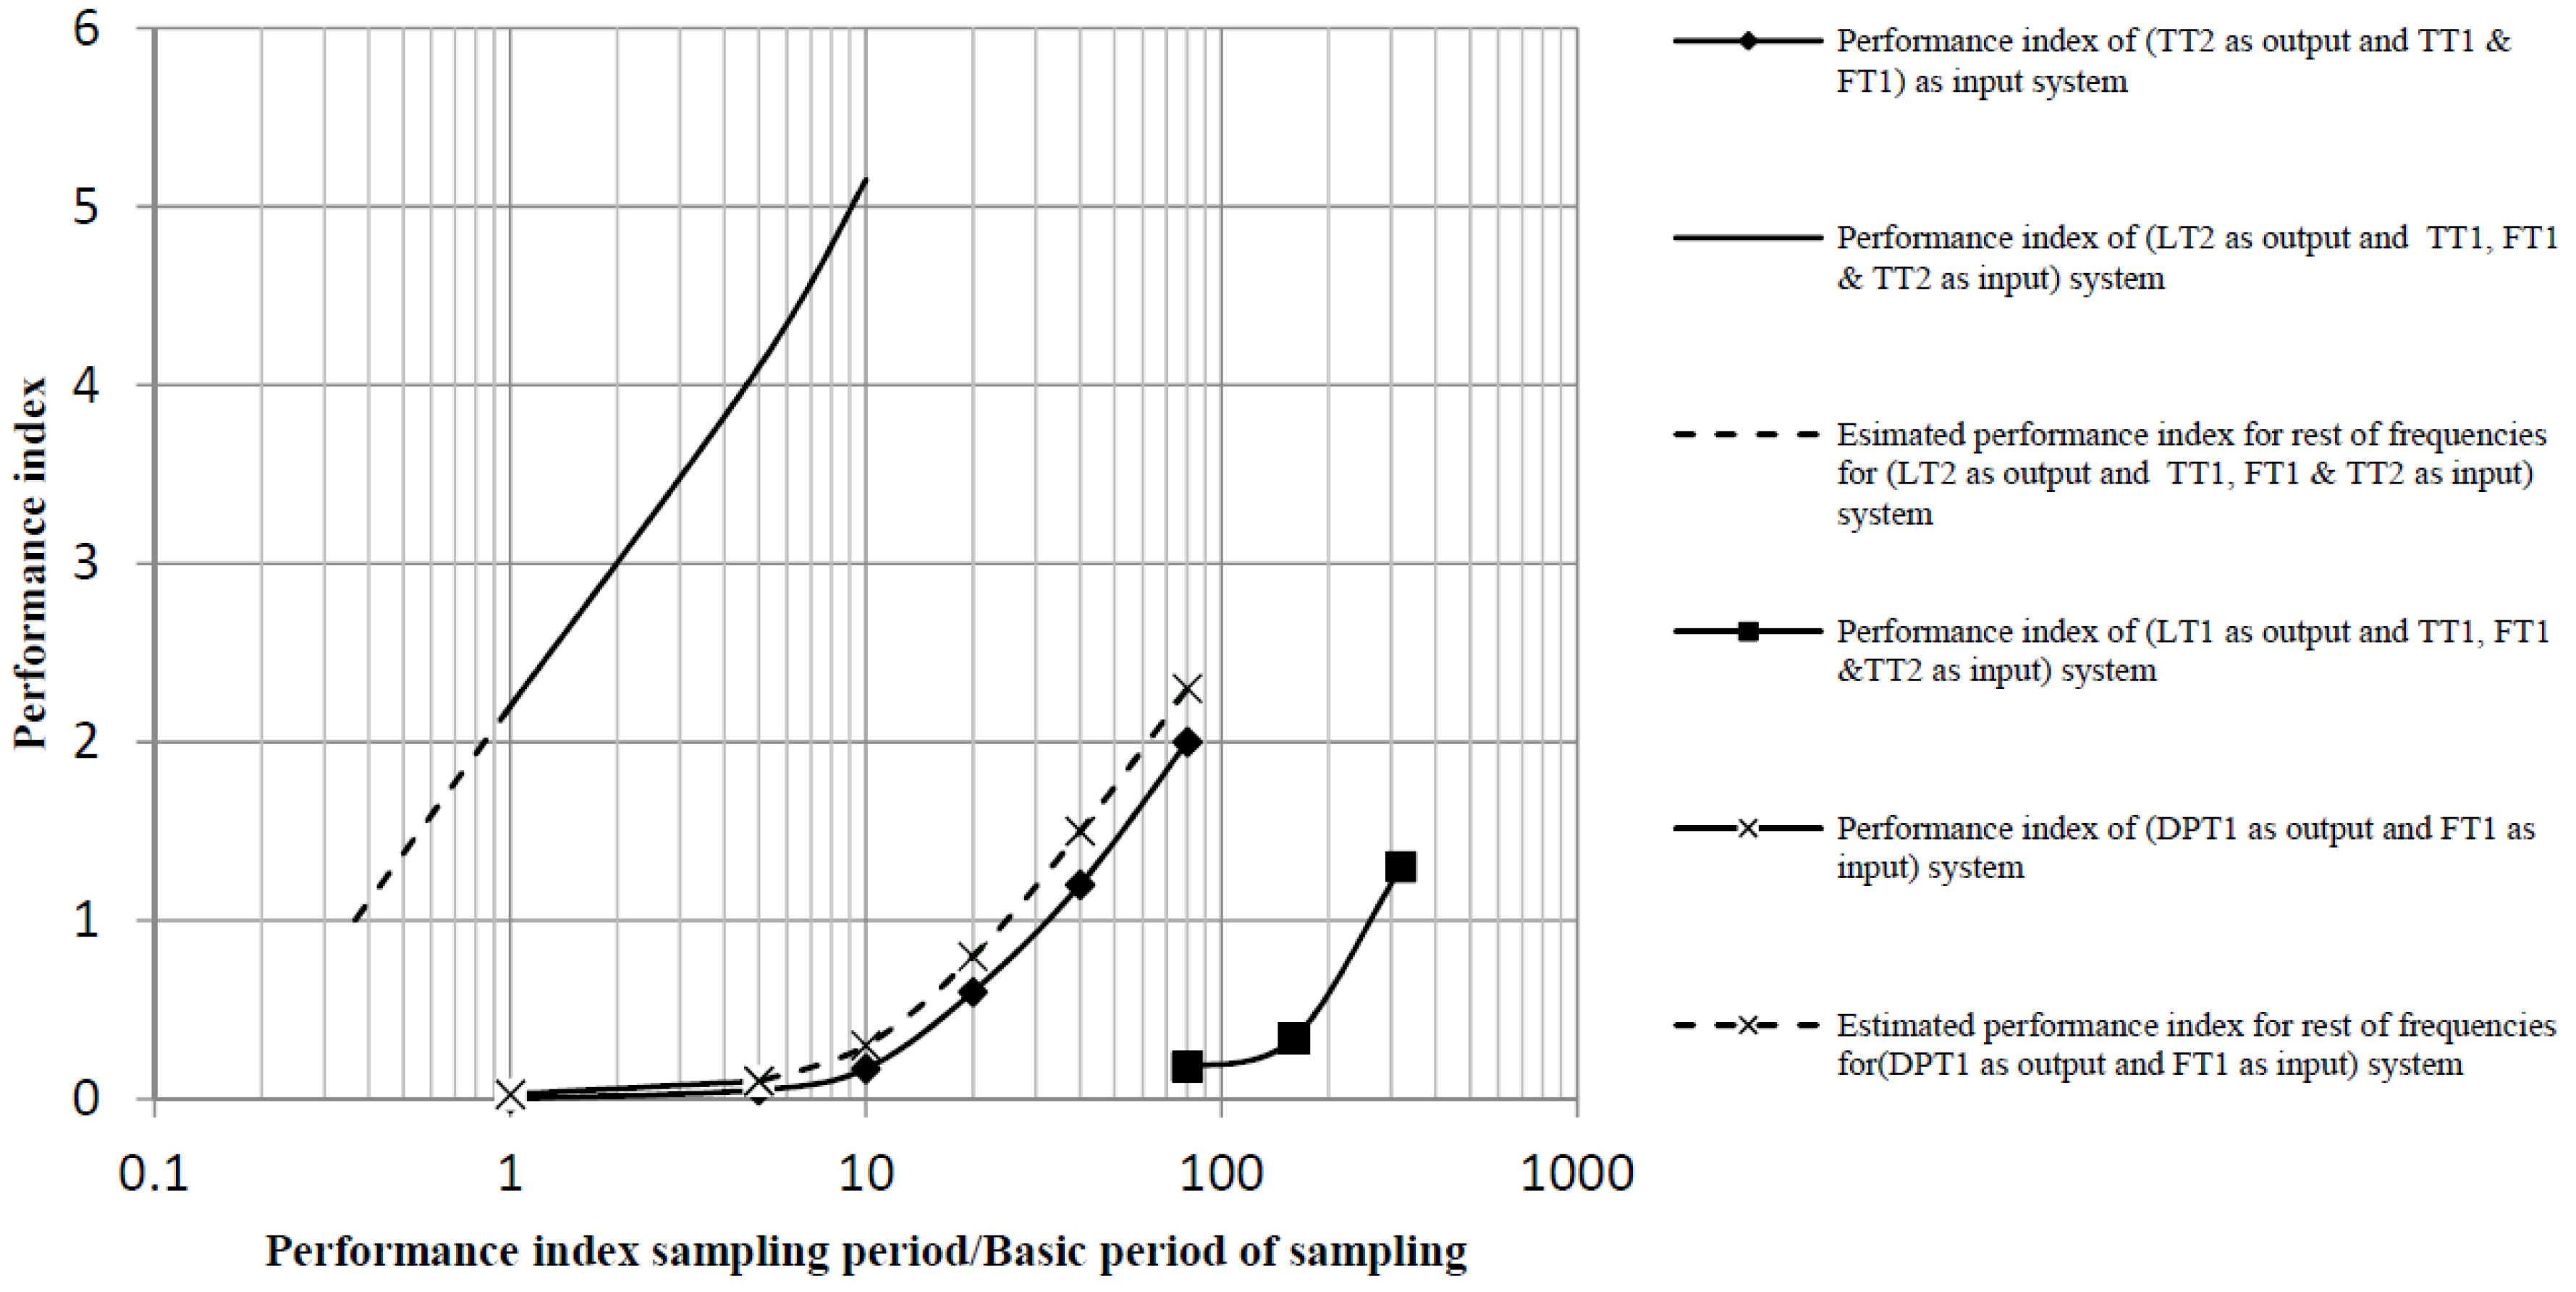
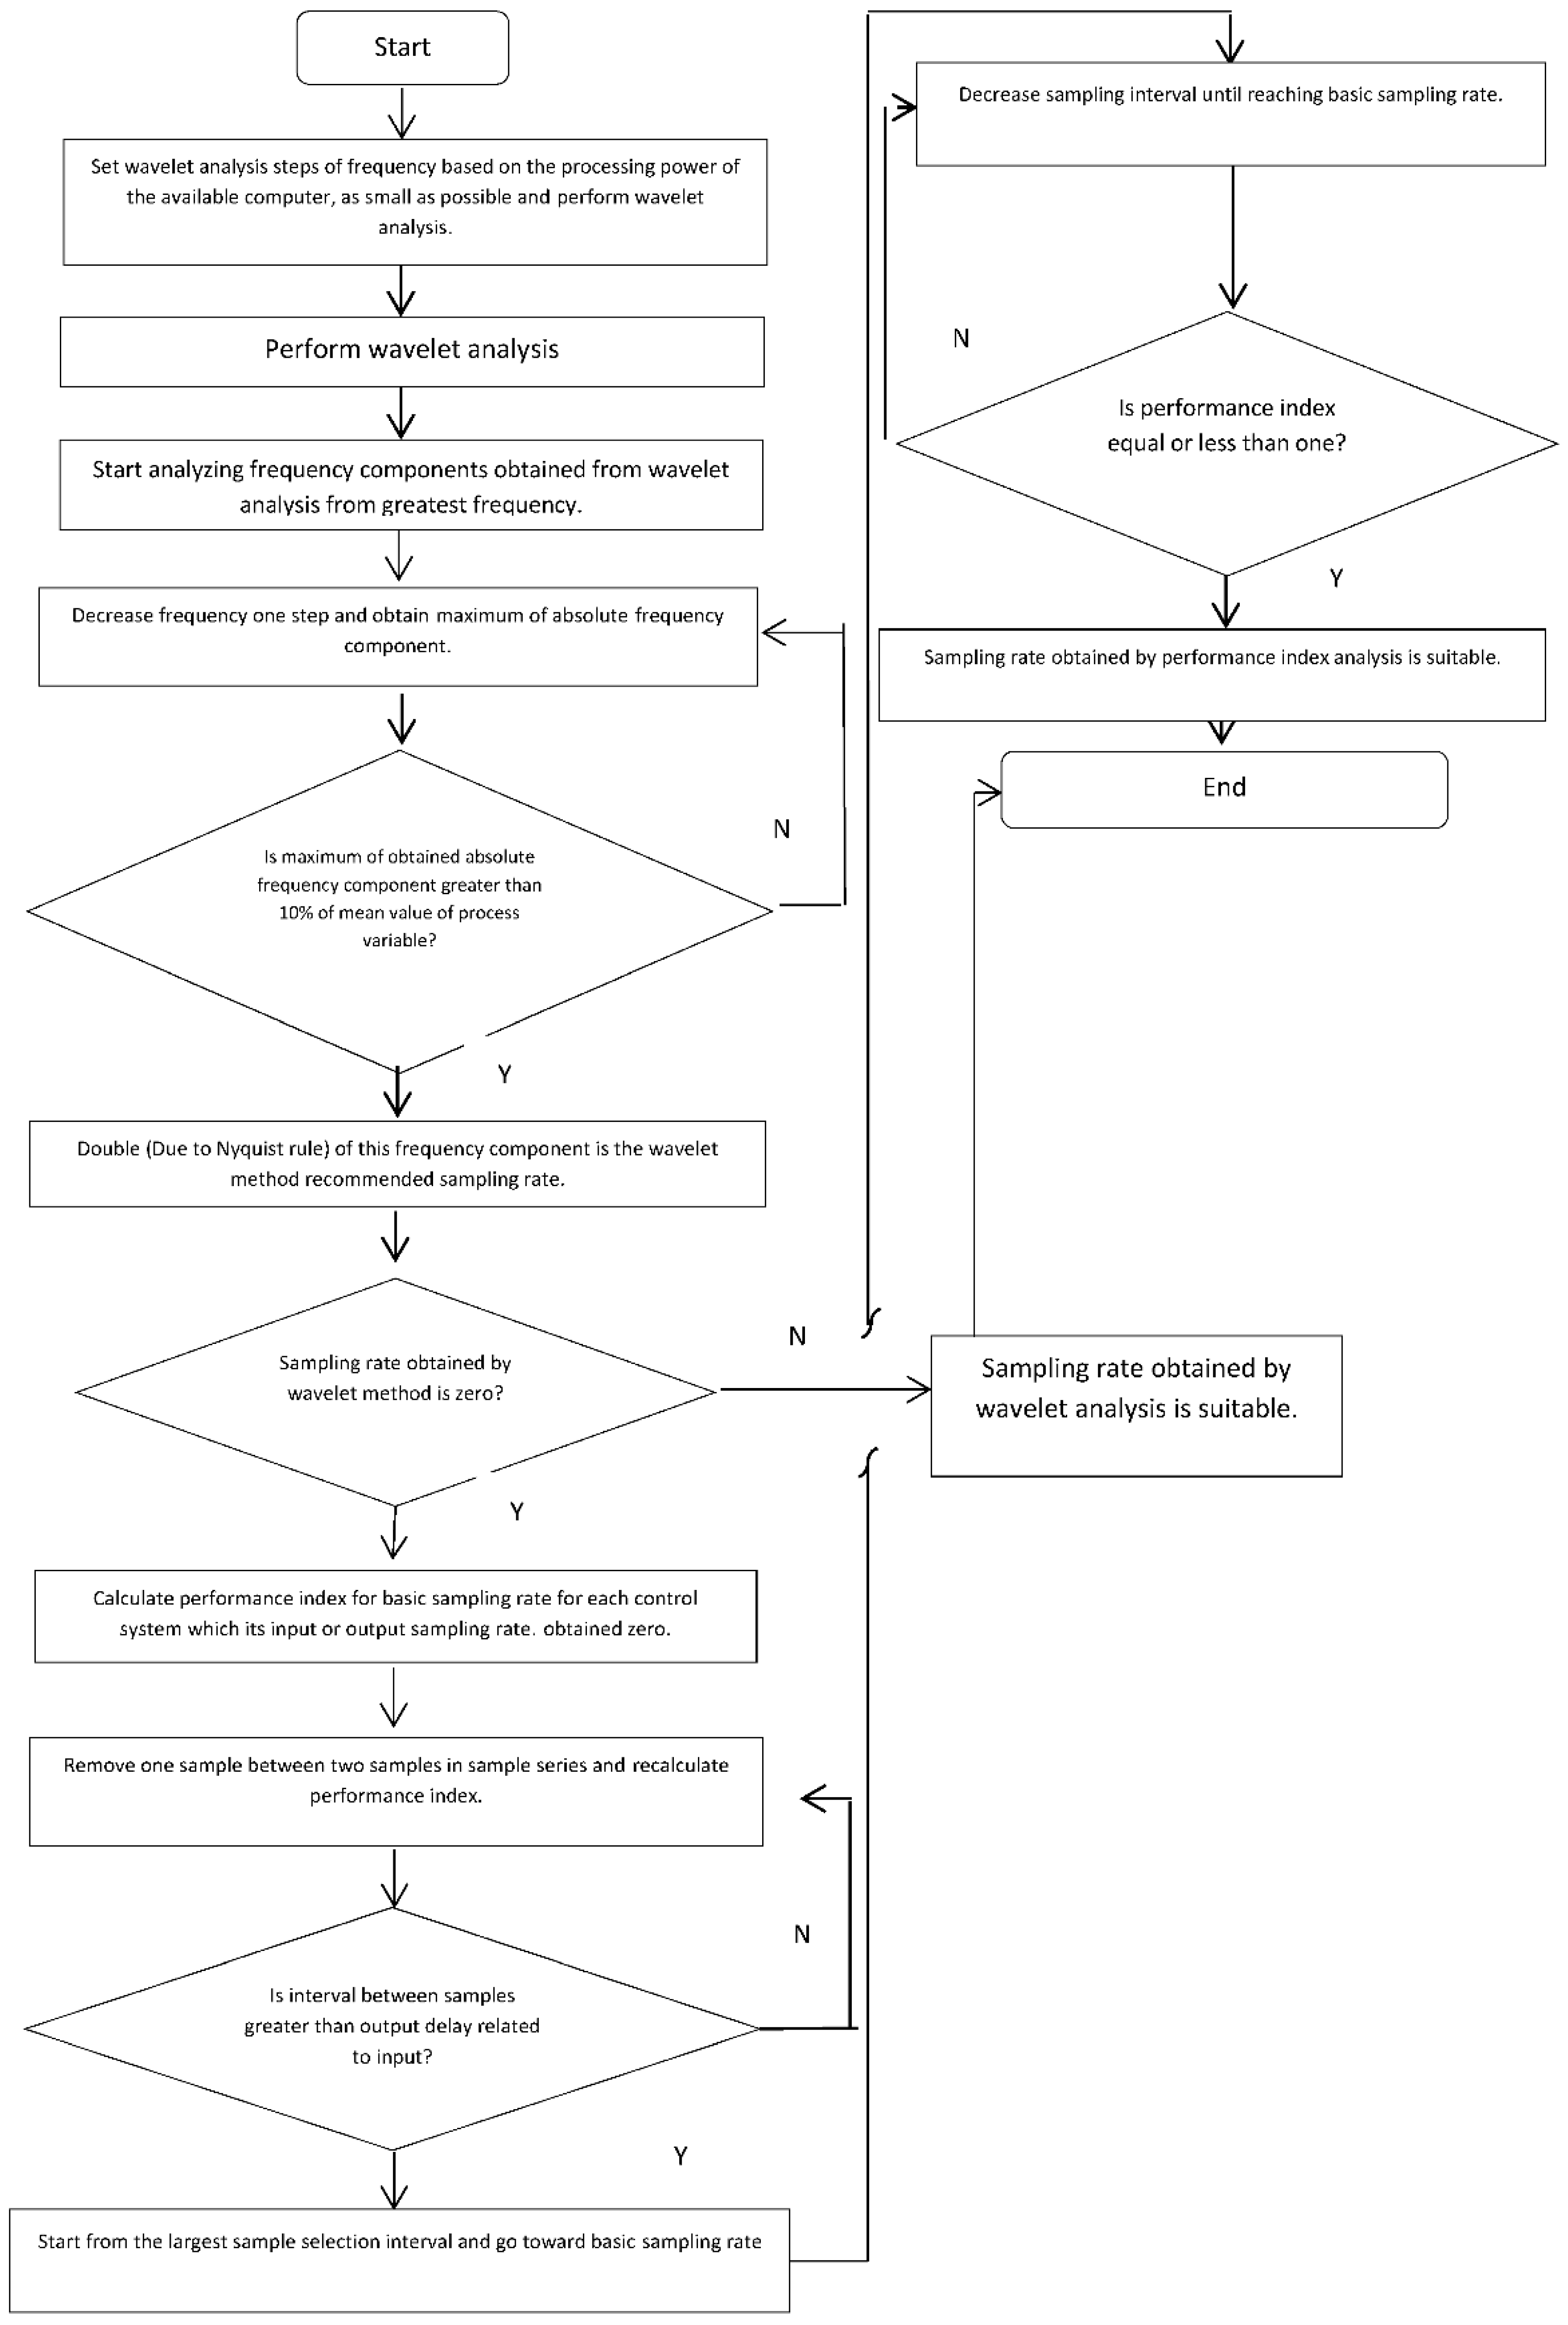
| Process Value Name | Cut-Off Frequency (Hz) | Absolute Mean Value of Variable | Maximum Value of FFT |
|---|---|---|---|
| DPT1 | 0.1008 | 0.1008 | |
| DPT2 | 0.1438 | 0.1438 | |
| DPT3 | 0.1827 | 0.1828 | |
| DPT4 | 0.1424 | 0.1424 | |
| FT1 | 220.2619 | 220.25 | |
| LT1 | 13.8186 | 13.82 | |
| LT2 | 3.3918 | 3.392 | |
| LT3 | 30.0275 | 30.03 | |
| PT1 | 65.6893 | 65.7 | |
| TT1 | 63.7867 | 63.8 | |
| TT2 | 33.6374 | 33.635 | |
| TT3 | 18.6766 | 18.675 | |
| TT4 | 21.1327 | 21.135 | |
| TT5 | 10.6754 | 10.675 |
| Process Value Name | Low Cut-Off Frequency (Hz) | High Cut-Off Frequency (Hz) | Maximum Value of FFT as a Percentage of Absolute Mean Value of Process Variable in Time Domain (%) |
|---|---|---|---|
| DPT1 | 0.0001 | 0.0002 | 1.19 |
| DPT2 | 0.0042 | 0.0048 | 0.97 |
| DPT3 | 0.0002 | 0.0088 | 0.93 |
| DPT4 | 0.0001 | 0.0089 | 0.70 |
| FT1 | 0.0001 | 0.0002 | 1.23 |
| LT1 | 0.0001 | 0.0003 | 7.81 |
| LT2 | 0.0001 | 0.0002 | 10.62 |
| LT3 | 0.0005 | 0.0007 | 0.47 |
| PT1 | 0.0001 | 0.0048 | 0.05 |
| TT1 | 0.0001 | 0.0002 | 0.16 |
| TT2 | 0.0001 | 0.0002 | 0.53 |
| TT3 | 0.0001 | 0.0002 | 1.43 |
| TT4 | 0.0001 | 0.0002 | 7.59 |
| TT5 | 0.0001 | 0.0002 | 1.78 |
| Subsystem | A | B | C | D |
|---|---|---|---|---|
| TT2 as output TT1 & FT1 as input (1, 1) | [1, −0.9981] | B1–78 = 0 B79 = −0.007830 | [1, 0.7830] | 1 |
| TT2 as output TT1 & FT1 as input (1, 2) | [1, −0.9981] | B1–54 = 0 B55 = −5.4282e−4 | [1, 0.7830] | 1 |
| LT2 as output TT1, FT1 & TT2 as input (1, 1) | [1, −0.3786] | B1–10 = 0 B11 = −0.0081 | [1, 0.8698] | 1 |
| LT2 as output TT1, FT1 & TT2 as input (1, 2) | [1, −0.3786] | B1–10 = 0 B11 = 0.0438 | [1, 0.8698] | 1 |
| LT2 as output TT1, FT1 & TT2 as input (1, 3) | [1, −0.3786] | B1–10 = 0 B11 = −0.0480 | [1, 0.8698] | 1 |
| LT1 as output TT1, FT1 & TT2 as input (1, 1) | [1, −0.9704] | B1–8 = 0 B9 = −0.0333 | [1, −0.4690] | 1 |
| LT1 as output TT1, FT1 & TT2 as input (1, 2) | [1, −0.9704] | B1–40 = 0 B41 = −0.0229 | [1,−0.4690] | 1 |
| LT1 as output TT1, FT1 & TT2 as input (1, 3) | [1, −0.9704] | B1–4 = 0 B5 = 0.0181 | [1, −0.4690] | 1 |
| DPT1 as output FT1 as input (1, 1) | [1, −0.9291] | B1–5 = 0 B6 = 0.0567 | [1, 0.7887] | 1 |
| Period of Sampling Rate (Sec) | |||||
|---|---|---|---|---|---|
| Existing Methods (Fixed Sampling Rates) | Methods Used in This Paper (Flexible Methods) | ||||
| Process parameter | API 554 recommendation | Åström & Wittenmark, recommendation [1] | Wavelet analysis (10% criteria) | Performance index analysis | |
| Controller | TT2 | 0.02 | 0.005 | ∞ | 6 |
| LT2 | 0.02 | 0.01 | 0.08 | 0.07 | |
| LT1 | 0.02 | 0.1 | 250 | 50 | |
| DPT1 | 0.02 | 0.005 | 16 | 5 | |
| Monitoring | TT2 | 1 | 1 | ∞ | 6 |
| LT2 | 1 | 1 | 0.08 | 0.07 | |
| LT1 | 1 | 1 | 250 | 50 | |
| DPT1 | 1 | 1 | 16 | 5 | |
| Historian Purpose | TT2 | <60 | 1 | ∞ | 6 |
| LT2 | <60 | 1 | 0.08 | 0.07 | |
| LT1 | <60 | 1 | 250 | 50 | |
| DPT1 | <60 | 1 | 16 | 5 | |
| Purpose | Controlling | Monitoring | Historian | |
|---|---|---|---|---|
| Method | ||||
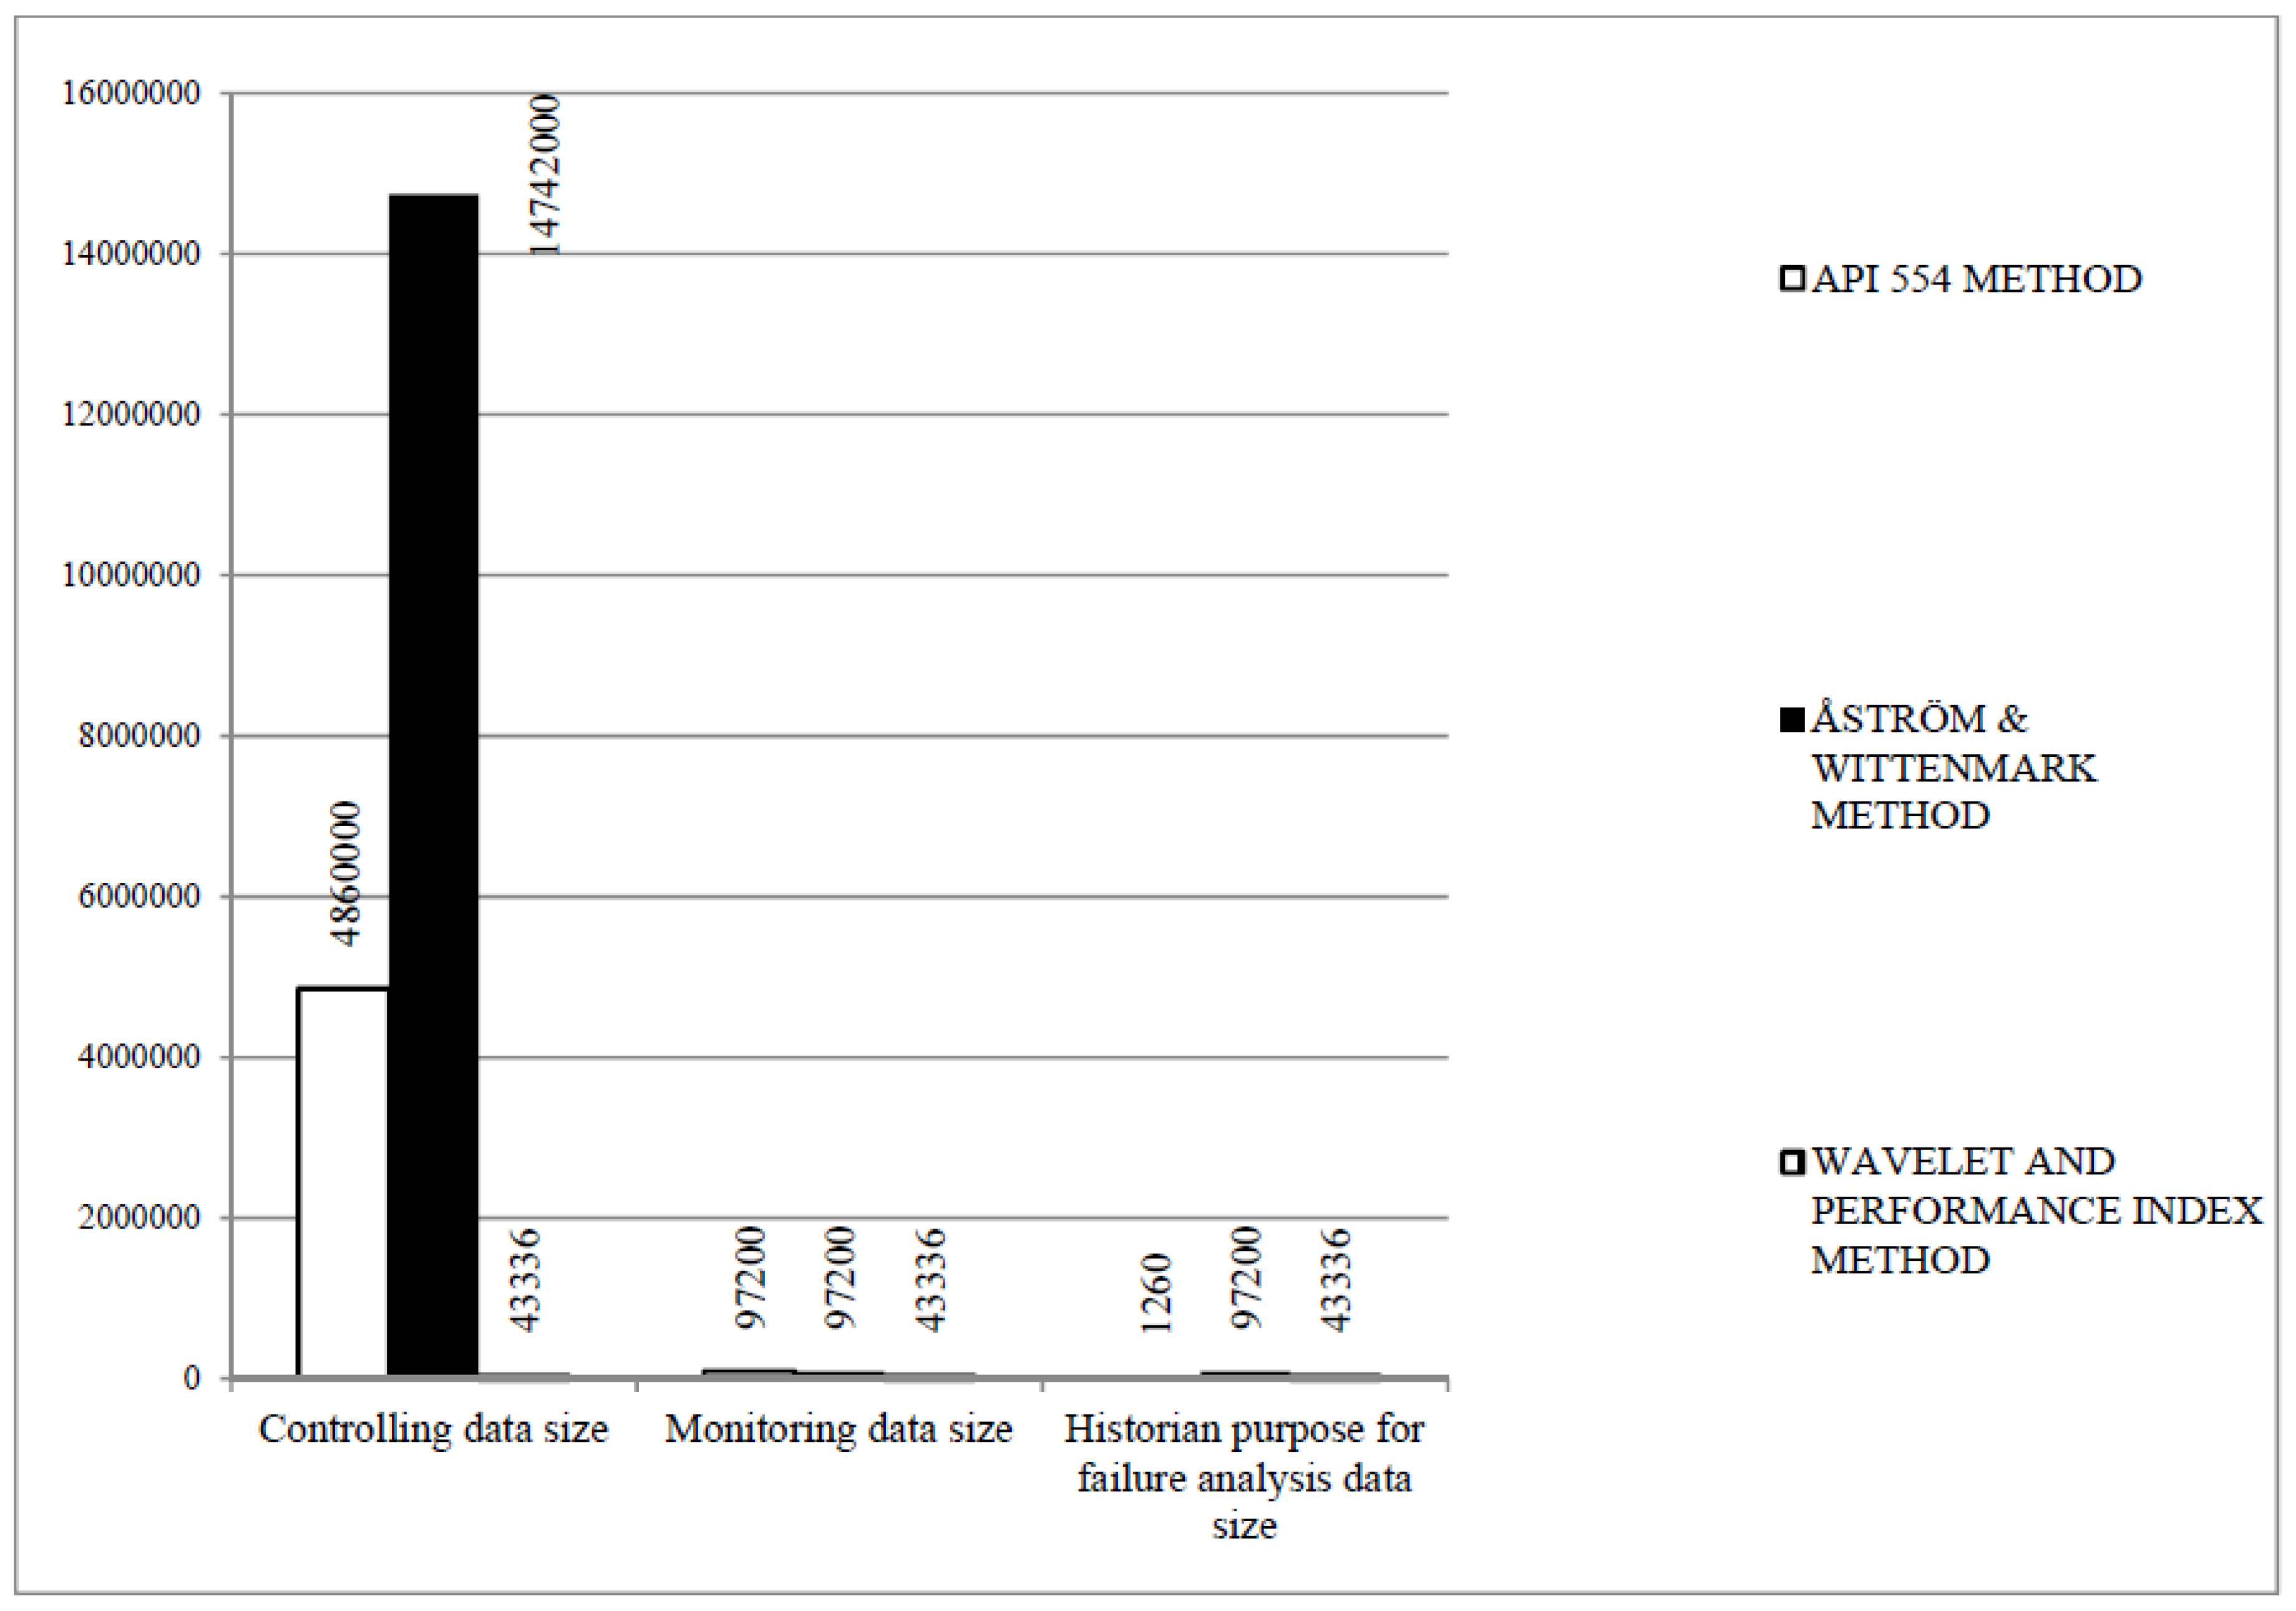
| Proposed approach | 43,336 | 43,336 | 43,336 | |
| API 554 approach | 4,860,000 | 97,200 | 1260 | |
| Åström & Wittenmark recommendation | 14,742,000 | 97,200 | 97,200 | |
| Decreasing Percent | |||||||
|---|---|---|---|---|---|---|---|
| Controlling | Monitoring | Historian | Traffic of Industrial Network | ||||
| Sampling rate changing method | 99.11% of API 554 method | 99.71% of Åström & Wittenmark method | 55.42% of API 554 method | 55.42% in comparison with Åström & Wittenmark method | No decrease compared with API 554 method | 55.42% decrease compared with Åström & Wittenmark method | Associated with Hodson [16] method in comparison with existing methods in Foundation Fieldbus in Delta V system: 82% |
| Linear correlation method | 99.19% of API 554 method, associated with sampling rate method | 55.56% of API 554 method, using only this method. | 59.67% of API 554 method, associated with sampling rate method | 55.56% of API 554 method, using only this method. | No decrease in comparison with API 554 method, associated with sampling rate method | No decrease in comparison with all methods, using only this method. | Associated with Hodson [16] and sampling rate change method in comparison with existing methods in Foundation Fieldbus in Delta V system: 85% |
© 2020 by the authors. Licensee MDPI, Basel, Switzerland. This article is an open access article distributed under the terms and conditions of the Creative Commons Attribution (CC BY) license (http://creativecommons.org/licenses/by/4.0/).
Share and Cite
Abbasinejad, R.; Hourfar, F.; Madhuranthakam, C.M.R.; Elkamel, A. A Data Size Reduction Approach Applicable in Process Control System of Oil and Gas Plants. Sustainability 2020, 12, 639. https://doi.org/10.3390/su12020639
Abbasinejad R, Hourfar F, Madhuranthakam CMR, Elkamel A. A Data Size Reduction Approach Applicable in Process Control System of Oil and Gas Plants. Sustainability. 2020; 12(2):639. https://doi.org/10.3390/su12020639
Chicago/Turabian StyleAbbasinejad, Reza, Farzad Hourfar, Chandra Mouli R Madhuranthakam, and Ali Elkamel. 2020. "A Data Size Reduction Approach Applicable in Process Control System of Oil and Gas Plants" Sustainability 12, no. 2: 639. https://doi.org/10.3390/su12020639
APA StyleAbbasinejad, R., Hourfar, F., Madhuranthakam, C. M. R., & Elkamel, A. (2020). A Data Size Reduction Approach Applicable in Process Control System of Oil and Gas Plants. Sustainability, 12(2), 639. https://doi.org/10.3390/su12020639


