Article

Environmental Sustainability Assessment of Multi-Sectoral Energy Transformation Pathways: Methodological Approach and Case Study for Germany

1
Department of Energy Systems Analysis, Institute of Engineering Thermodynamics, German Aerospace Center (DLR), 70569 Stuttgart, Germany
2
Institute for Technology Assessment and Systems Analysis (ITAS), Karlsruhe Institute of Technology, 76021 Karlsruhe, Germany
3
Institute of Energy and Climate Research, Systems Analysis and Technology Evaluation (IEK-STE), Forschungszentrum Jülich, 52428 Jülich, Germany
*
Author to whom correspondence should be addressed.
Sustainability 2020, 12(19), 8225; https://doi.org/10.3390/su12198225
Submission received: 14 September 2020 / Revised: 1 October 2020 / Accepted: 2 October 2020 / Published: 6 October 2020
(This article belongs to the Special Issue Analyzing Development Paths of Emerging Energy Technologies)

Abstract

:
In order to analyse long-term transformation pathways, energy system models generally focus on economical and technical characteristics. However, these models usually do not consider sustainability aspects such as environmental impacts. In contrast, life cycle assessment enables an extensive estimate of those impacts. Due to these complementary characteristics, the combination of energy system models and life cycle assessment thus allows comprehensive environmental sustainability assessments of technically and economically feasible energy system transformation pathways. We introduce FRITS, a FRamework for the assessment of environmental Impacts of Transformation Scenarios. FRITS links bottom-up energy system models with life cycle impact assessment indicators and quantifies the environmental impacts of transformation strategies of the entire energy system (power, heat, transport) over the transition period. We apply the framework to conduct an environmental assessment of multi-sectoral energy scenarios for Germany. Here, a ‘Target’ scenario reaching 80% reduction of energy-related direct CO2 emissions is compared with a ‘Reference’ scenario describing a less ambitious transformation pathway. The results show that compared to 2015 and the ‘Reference’ scenario, the ‘Target’ scenario performs better for most life cycle impact assessment indicators. However, the impacts of resource consumption and land use increase for the ‘Target’ scenario. These impacts are mainly caused by road passenger transport and biomass conversion.

1. Introduction

The threat of irreversible effects of global warming led to the agreement at the Paris Climate Conference (COP 21) that the rise in global temperature should remain well below 2 °C and that net greenhouse gas neutrality must be achieved in the second half of the century [1]. Today, the global energy supply based on fossil fuels is the main source of greenhouse gas emissions. Energy system models (ESMs) are frequently used in order to identify strategies on how to achieve these goals in the most cost-effective and efficient manner. These models depict specific energy conversion sectors such as power supply via the technologies contained therein (e.g., photovoltaic (PV) modules). In the ESMs, the expansion and operation of these technologies are usually driven by techno-economic characteristics combined with CO2 emission reduction targets for the sectors included. The resulting scenarios at various geographical levels provide important insights into techno-economic and political options for the energy system transformation [2].
However, ESMs generally do not consider other environmental impacts (e.g., effects on ecosystems). In addition, as energy supply shifts from fossil fuels to renewable sources, environmental impacts tend to shift to processes beyond the traditional system boundaries of ESMs, which usually only include emissions during operation [3]. Therefore, processes such as the construction of energy conversion plants and other infrastructure elements must be additionally considered. Life cycle assessment (LCA) provides detailed information on a wide range of sustainability indicators by taking full account of the impact of an energy technology on the environment from cradle-to-grave based on the life cycle inventory (LCI). Due to the complementary nature of technology-focused energy system models and LCA with cradle-to-grave environmental impact assessment, their combination can contribute to a more complete picture and knowledge on the sustainability of energy system transformation pathways.
The combination of technologies modelled in ESMs with LCI data is an emerging field of research, currently mainly focusing on the power sector (see Table 1).
We analysed these studies and classified their approaches in order to identify methodology gaps. Five of the eighteen studies found in the literature assess multi-sectoral energy scenarios that include, next to electricity, also the heating and/or transport sectors [6,7,11,17,22]. Concerning the time horizon, a transformation path over longer time horizons (not just a single year) is assessed by less than half of the studies. Few studies disaggregate the environmental impacts into the life cycle phases corresponding to the investment and operation (and partly decommissioning) of the energy technologies in the scenario [7,8,18]. Therefore, environmental impacts of a transformation path can be allocated to the corresponding points in time. This contrasts with the simplifications of other studies that assess a transformation path but do not distinguish between life cycle phases [10,12,16,17,19].
Since the application of LCA to energy scenarios has a prospective character, some studies include changes to the background LCI database [4,5,8,11,15,18]. However, the approaches and the degree of these adaptions vary greatly depending on the study. For example, in the technology hybridized environmental-economic model with integrated scenarios (THEMIS), applied in [5,8,15,18], the electricity mix of a global energy scenario is integrated into the background LCI database and serves as input to all upstream supply processes that consume electricity (e.g., the construction of electricity generation technologies). Volkart et al. [11] also adapt the background electricity mix for Europe to a scenario for 2030 from literature. In a recent study by Xu et al. [4], the authors integrate the electricity mix of the applied ESM with a focus on Europe to the LCI database. However, as the technologies are manufactured globally, adjusting the electricity mix of a specific region to future developments may have only a minor impact on the environmental profile of the technologies. Many studies do not consider future evolvements of foreground technologies. An exception is the THEMIS model, where LCIs from secondary literature are used to reflect future changes in material composition and efficiency of the electricity generating technologies. In other studies, foreground technologies and their expected future properties are included in the assessment if corresponding LCIs are available [4,7,11,19]. Next to the consideration of future material composition for some technologies, the adaption of conversion efficiencies (e.g., in power generation) to the assumptions of the ESM is the most frequently used method.
Despite the growing number of studies, current attempts to combine ESMs and LCA encounter significant methodological challenges. Firstly, most studies cover only a limited number of technologies or have narrow sectoral boundaries (e.g., electricity supply only). This ignores relevant dynamics and interrelationships such as the direct or indirect electrification of transport, industry and households and their environmental impact on specific sectors and the overall energy system. This will become increasingly relevant with increasing electrification of fuels and heat, as will occur at high shares of renewable energy [2,23,24]. In addition, to the best of our knowledge, no environmental ex-post assessment of multi-sectoral energy system transformation pathways with simultaneous adjustment of the global background electricity mix has been conducted. This would lead to a more precise assessment of environmental impacts, especially in the construction phase, which will also gain relevance with increasing shares of renewable energy in the system (see above).
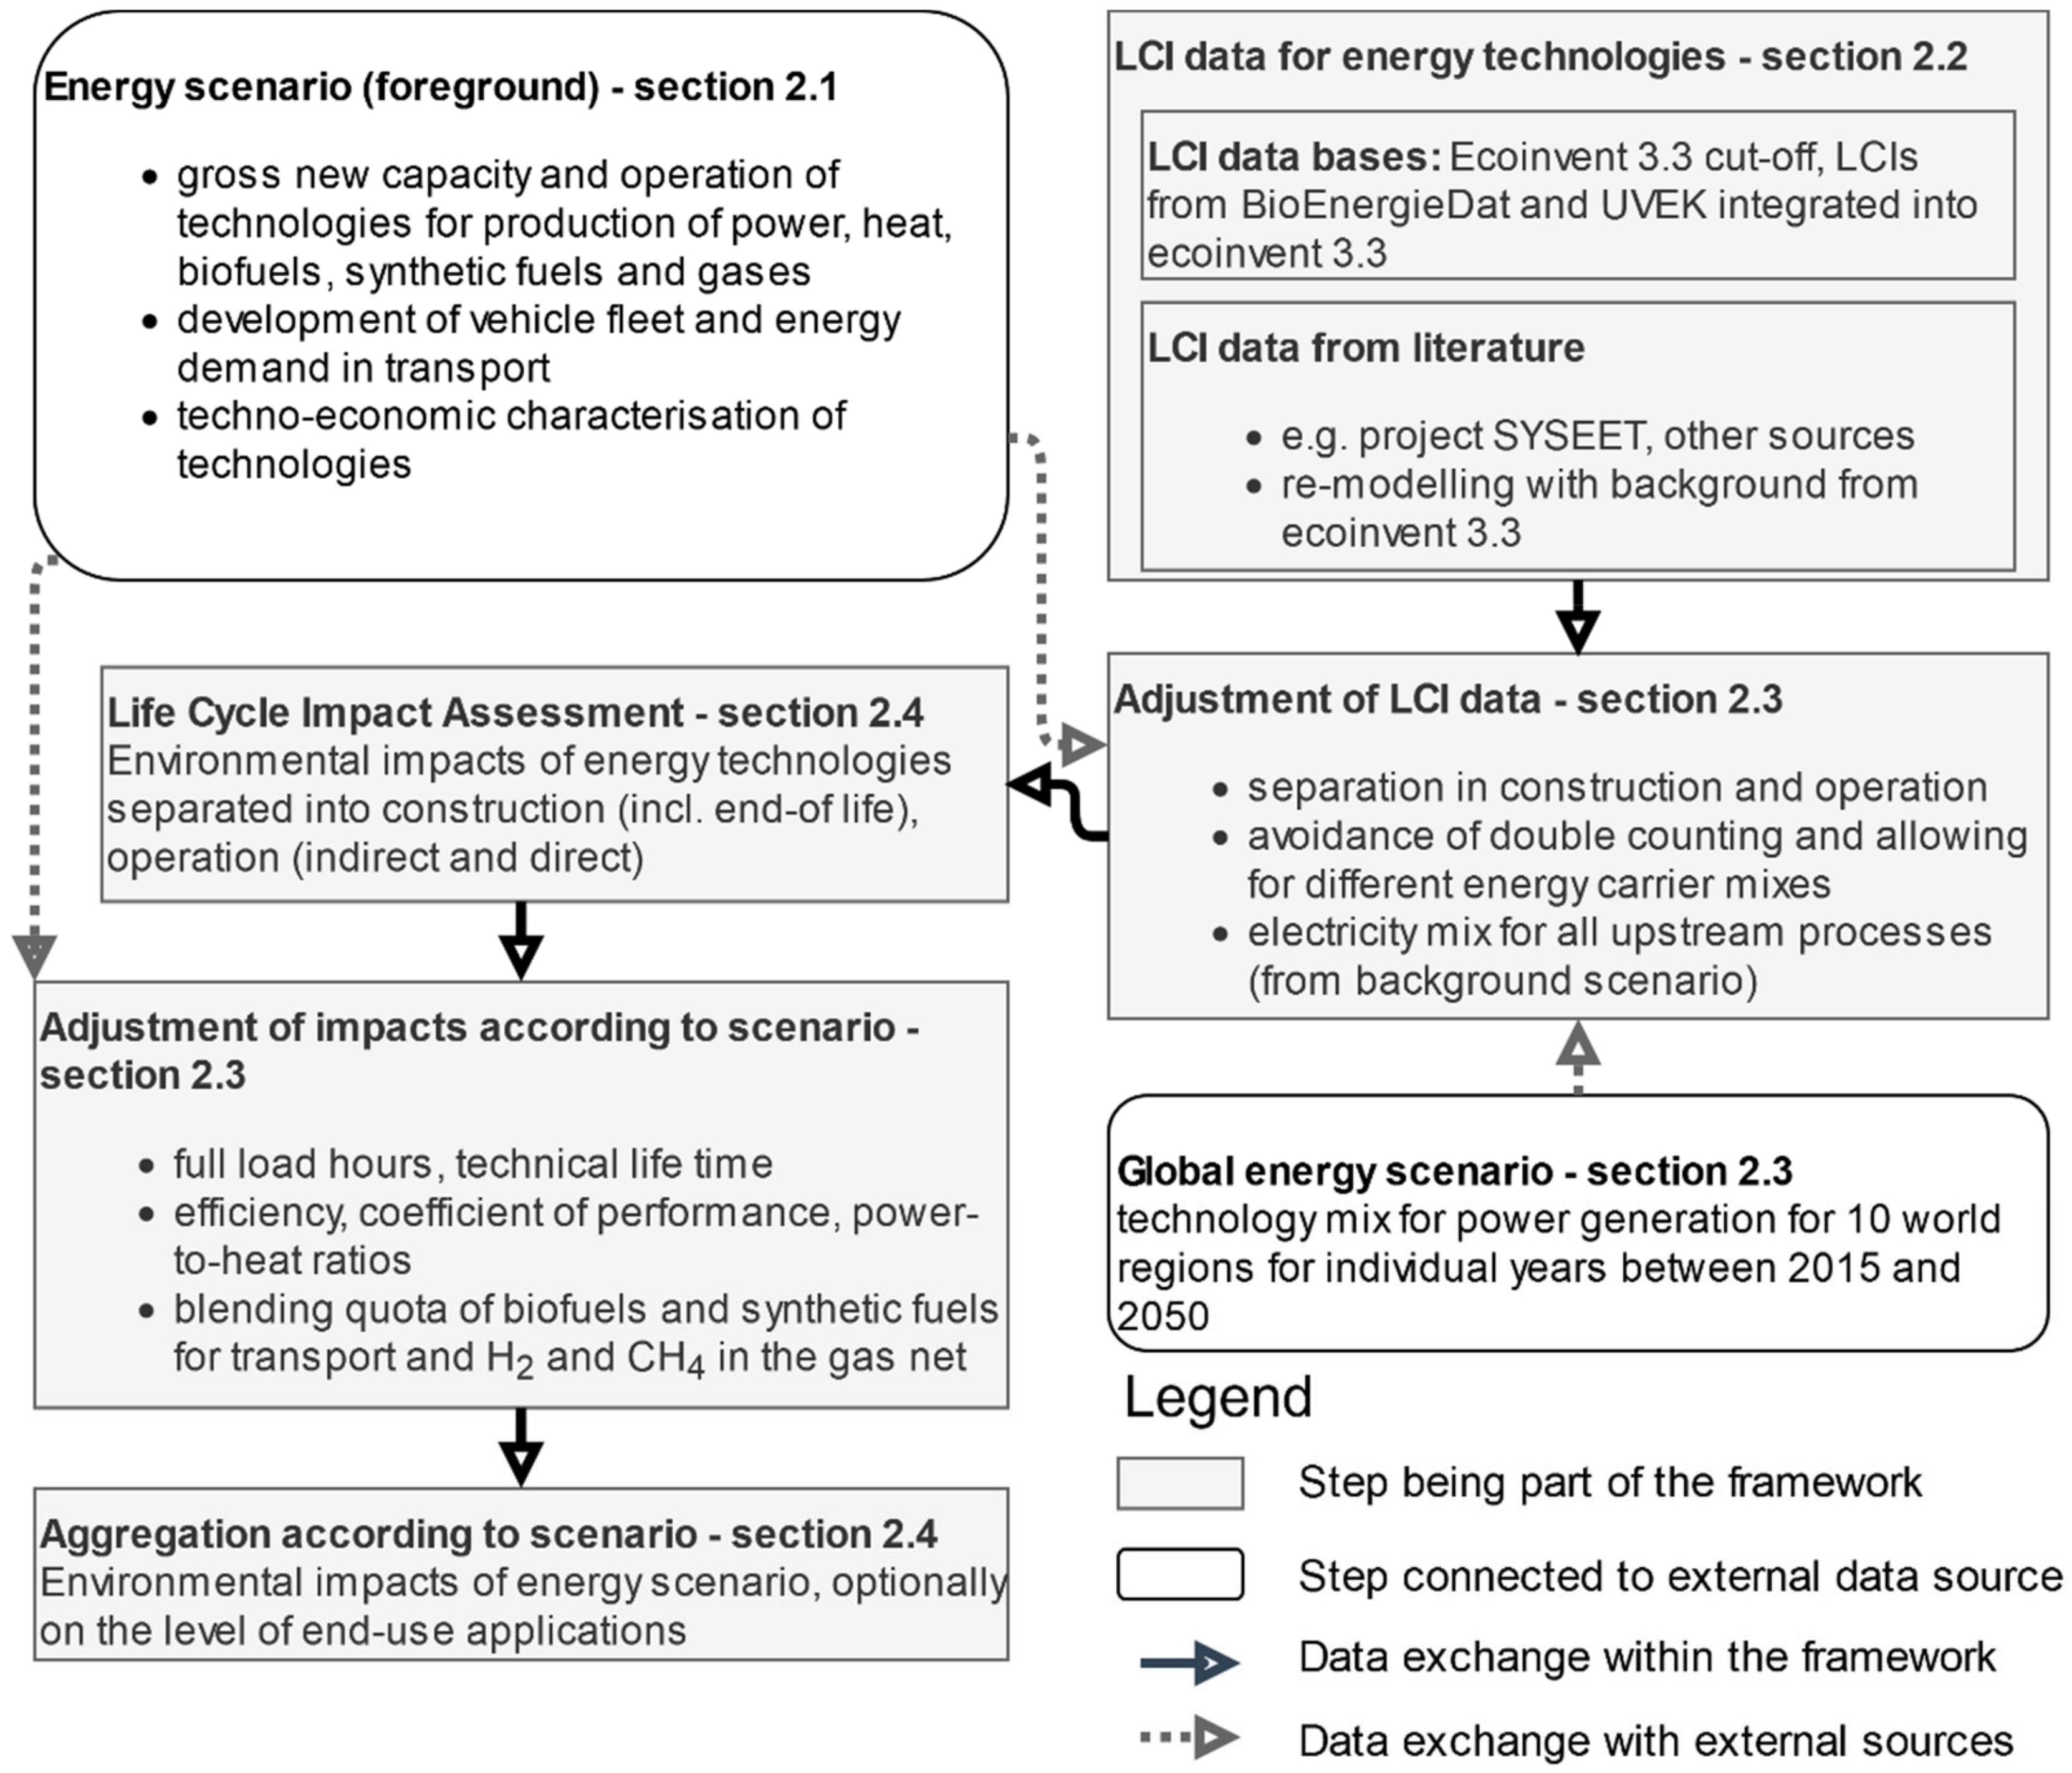
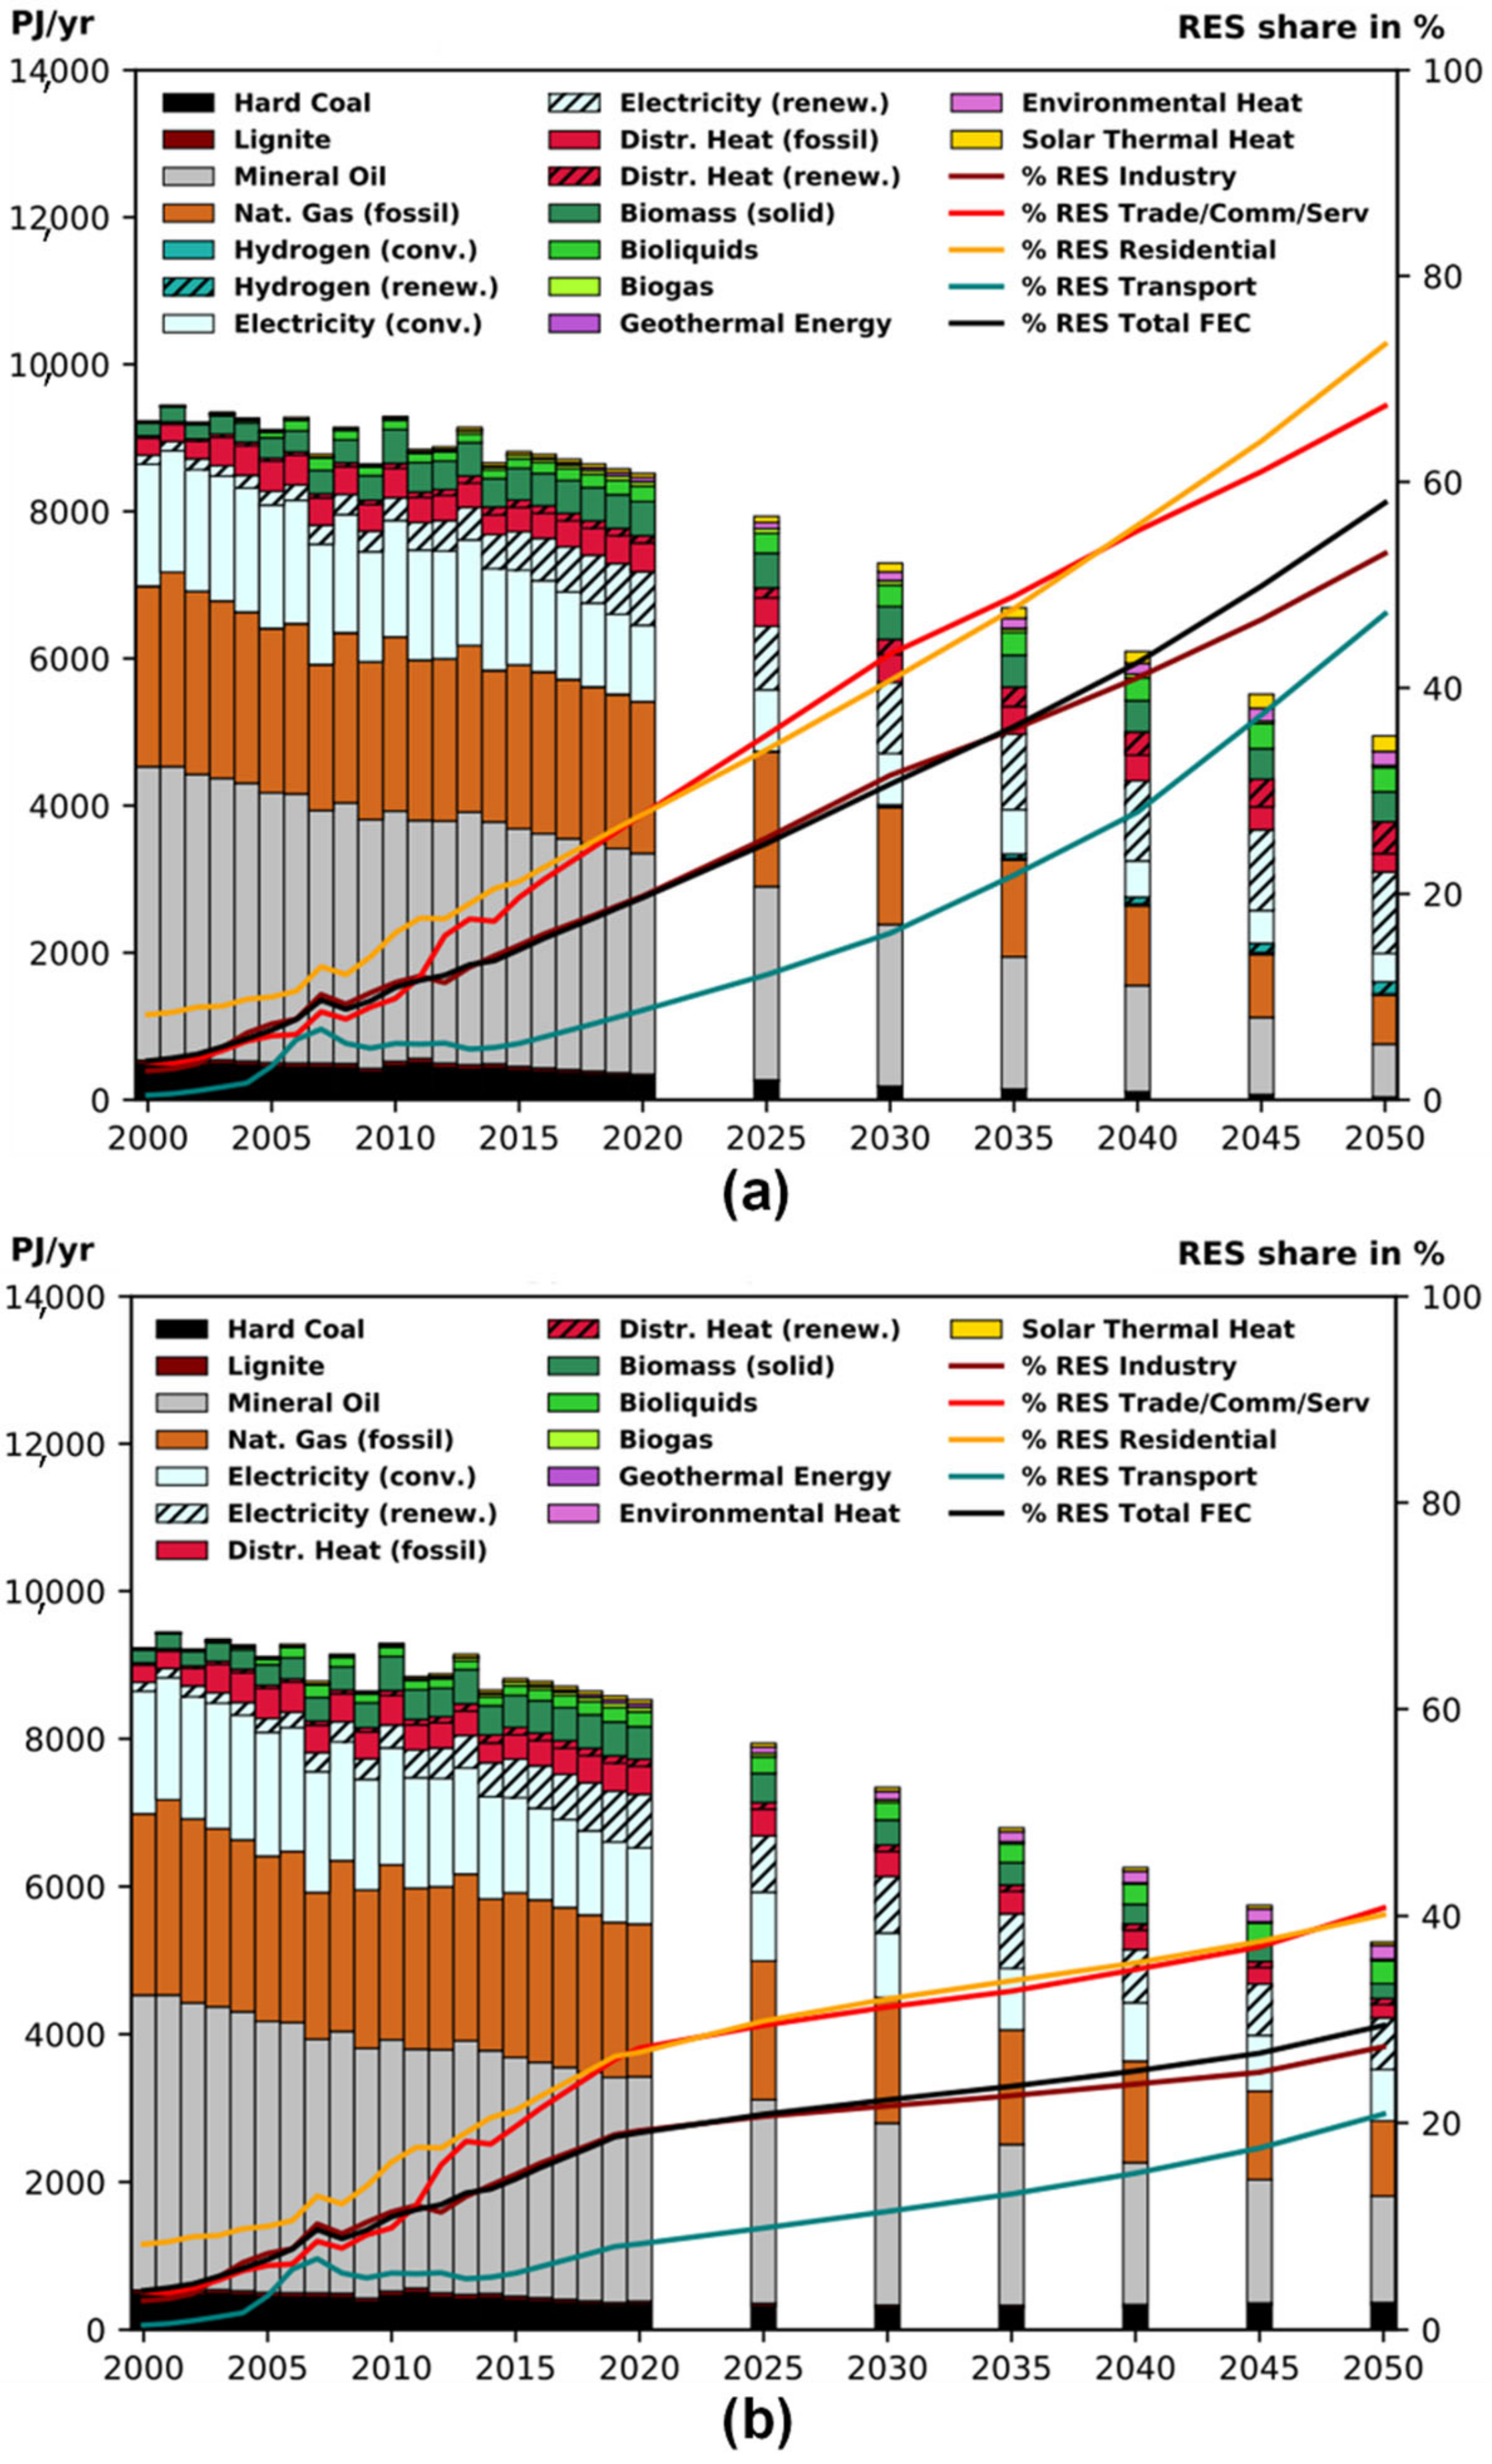
To overcome these limitations, we develop the FRamework for the assessment of environmental Impacts of Transformation Scenarios (FRITS). FRITS provides a basis for coupling multi-sectoral ESMs that assess energy transformation pathways with a high technological detail with an LCI database. FRITS allows for assessing environmental impacts of the entire energy system (electricity, heat, transport and the generation of biogenic and synthetic fuels and gases). Therefore, it is particularly suited for scenarios with a high degree of sector coupling, i.e., direct and indirect electrification of the transport and heat sectors. It further takes into account a number of prospective elements such as the change of the global electricity mix in the background system, the evolvement of plant efficiencies and operation hours. In contrast to the geographical focus of the aforementioned studies—predominantly European countries and the World—we provide the first assessment of transformation pathways of the German energy system.
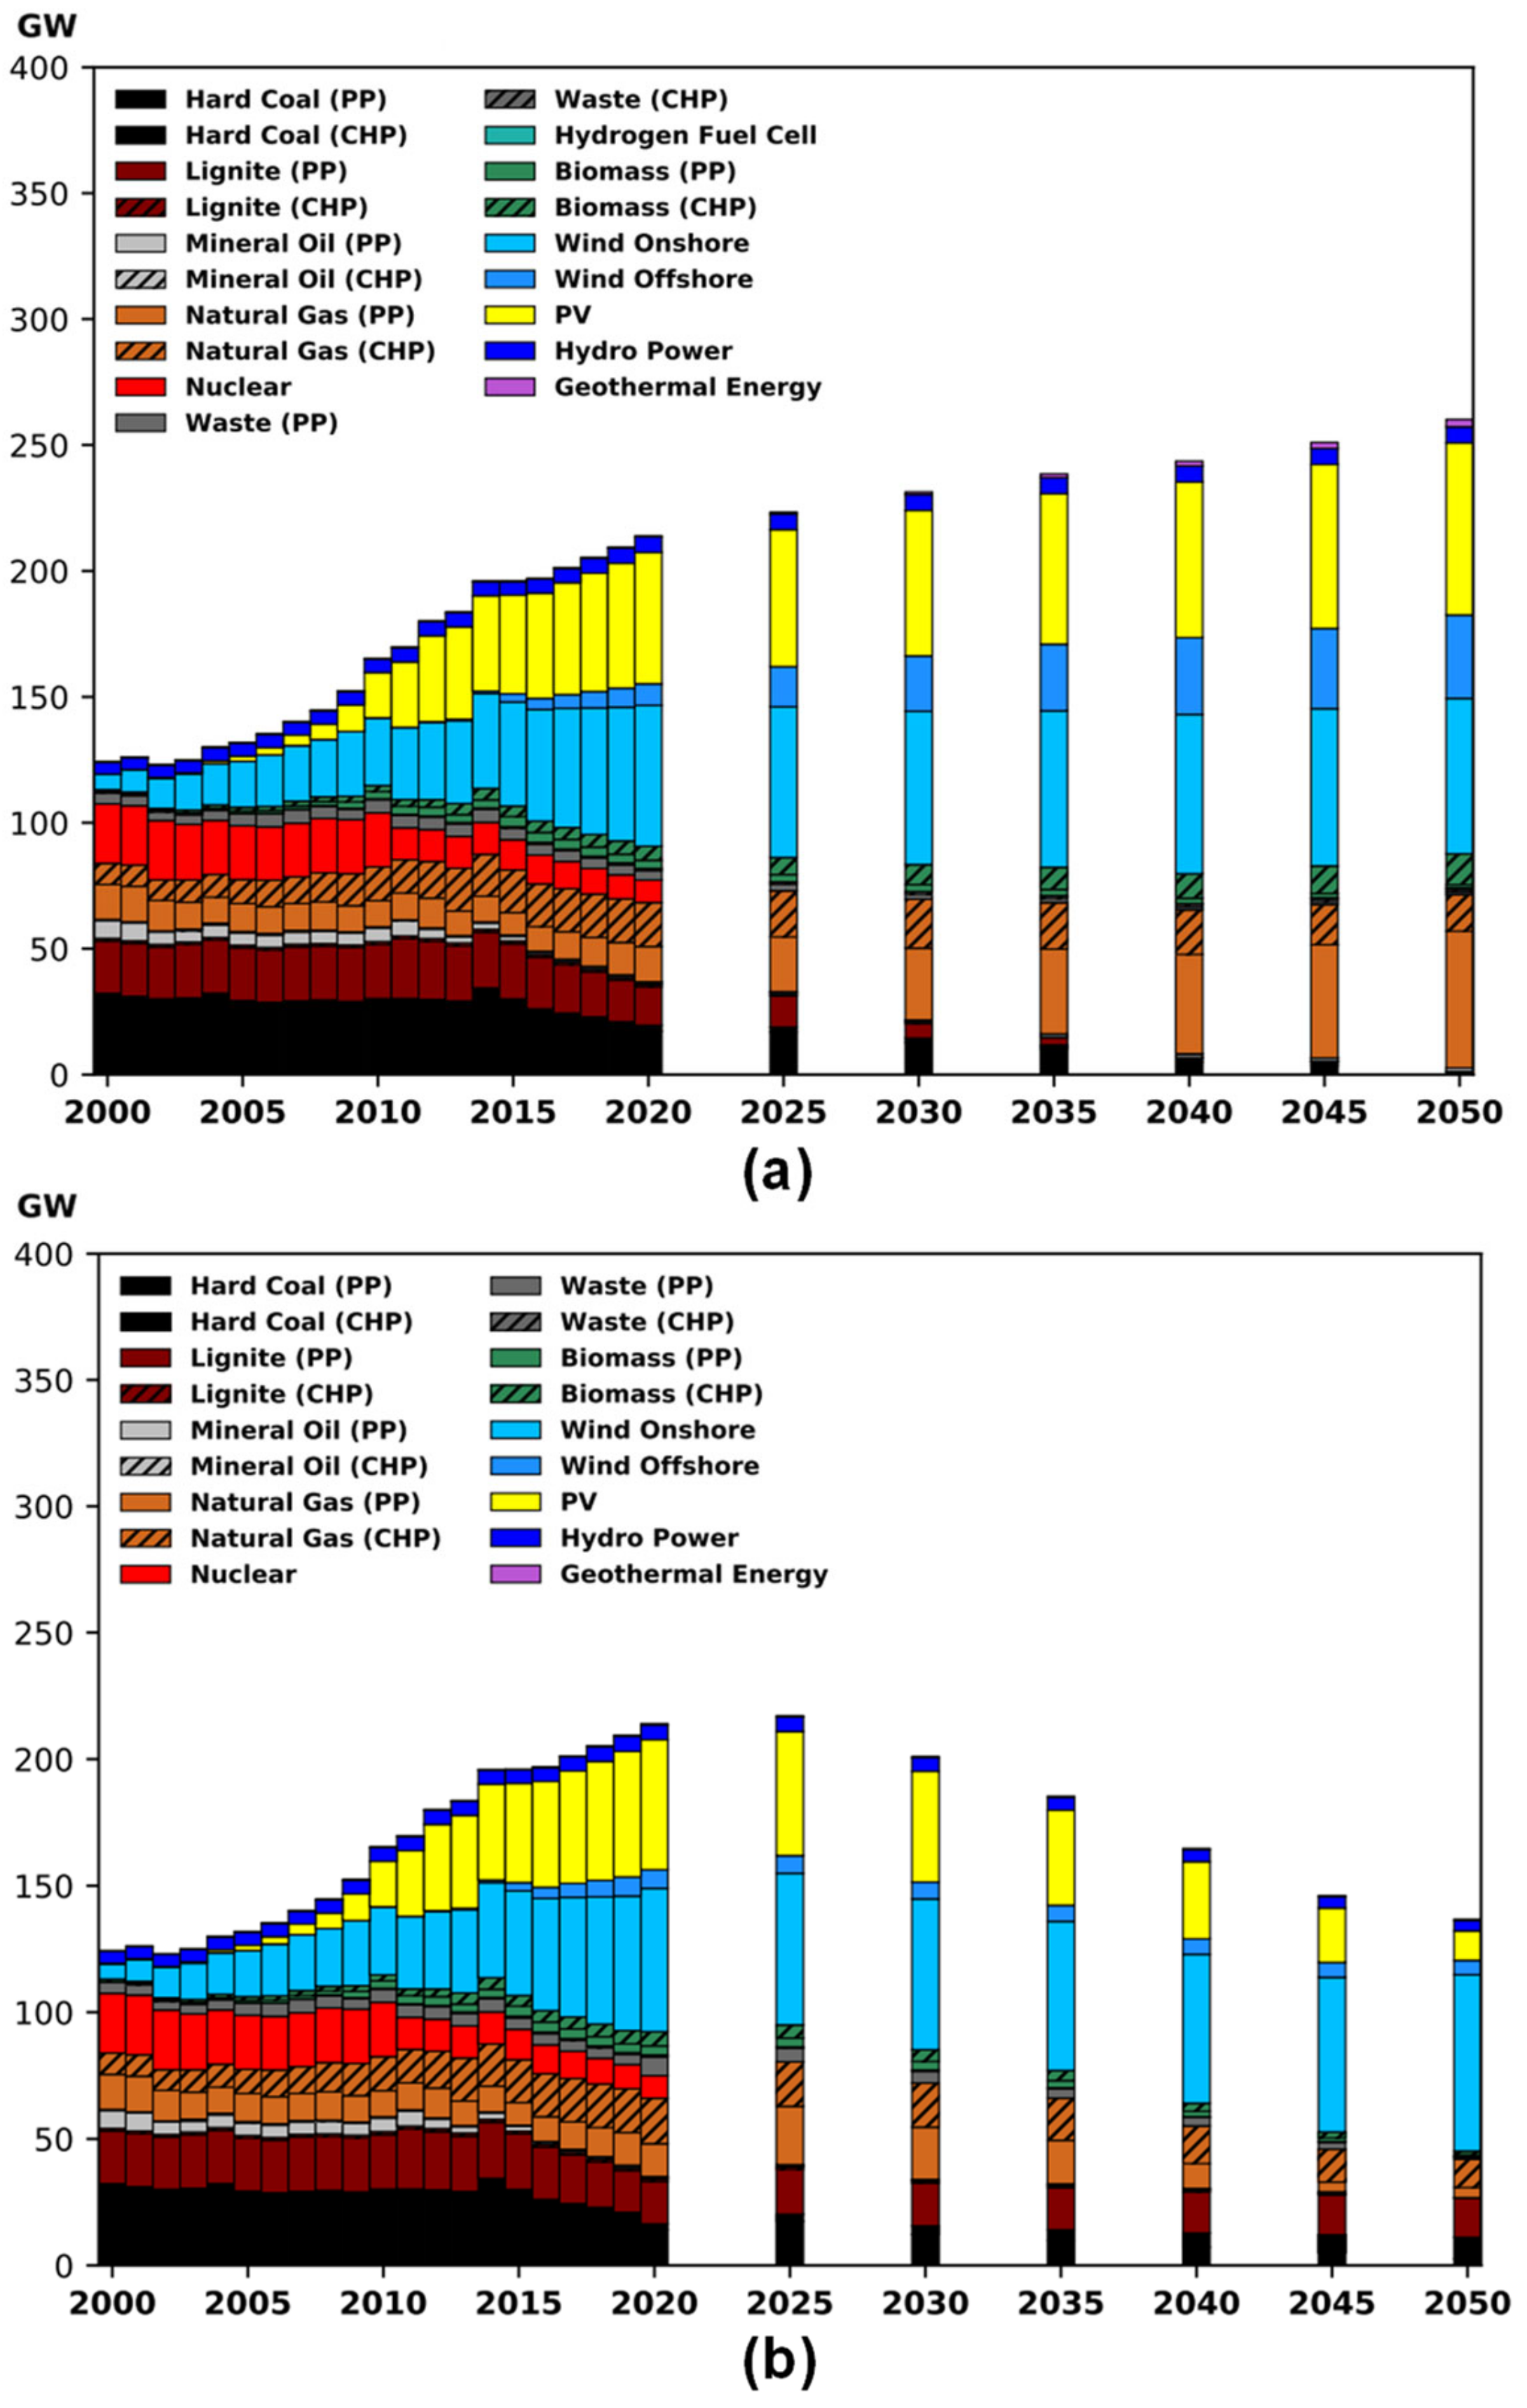
Germany’s energy system transformation is guided by ambitious political targets until 2050, such as increasing the share of renewable energies in gross final energy consumption to 60% and reducing greenhouse gas emissions by 80–95% (compared to 1990) [25]. Thus, it can serve as a role model for the transformation of a highly industrialized country. We compare a number of environmental co-benefits and adverse side-effects of an ambitious scenario that meets these political targets (‘Target’) with the current energy system and a baseline (‘Reference’) scenario to deliver insights for policy planning. Specifically, the following research questions are addressed:
  • How can LCI data be used to evaluate energy system transformation scenarios? Which adjustments need to be made to available LCI data in order to become consistent with the energy scenario, especially in the case of very ambitious scenarios with a central role of power-to-x (admixtures) and biofuels? (Section 2)
  • What co-benefits and adverse side effects arise in the transformation of the energy system compared to today? (Section 3.1.1)
  • Which indicators decrease or increase at, collectively, the scenario level, the sectoral level (e.g., power generation) and the end-use level when comparing life cycle based environmental impacts for two scenarios for Germany? (Section 3.1.2 and Section 3.1.3)
  • How do life cycle assessments improve the perspective on environmental impacts compared to considering only the direct emissions caused by operation and use? (Section 3.2)
  • What influence does the global background electricity mix have on the scenarios assessed? (Section 3.3)
The scenarios are described in Section 2.5. Associated uncertainties, as well as further steps to improve the assessment are discussed in Section 4. Finally, conclusions are provided in Section 5. With this study, we contribute to the integration of knowledge from the ESM and LCA communities with the aim to increase the robustness of energy scenario assessments. The outputs of FRITS may also serve as inputs for multi-criteria decision making (MCDM).

2. Materials and Methods

Figure 1 describes the methodological steps of the framework and provides a reference to the relevant sections of this chapter, where they are explained in detail.

2.1. Energy System Model for Scenario Development

The ESM used in this study is MESAP/PlaNet (MESAP in the following) [26], which has been used in several studies with various geographical foci: global [2,27], national [28,29,30] and regional [31]. The MESAP accounting framework allows the integration of a wide variety of assumptions into the energy system scenario from other models and studies as well as exogenously defined premises. Table 2 lists sectors and sub-sectors considered in MESAP (the respective technologies are listed in the Supplementary Materials). The MESAP output relevant for FRITS comprises the following quantities (each on an annual basis):
  • The annual generation of electricity, heat, synthetic fuels and gases and biogenic energy carriers,
  • gross new installed capacities (including replacement capacities) for the generation of power, heat, synthetic fuels, synthetic gases, biofuels, biogas and solid biomass, as well as electricity storage,
  • development of vehicle fleet and energy demand in transport by energy carrier,
  • annual average blending quota (such as share of biodiesel and/or synfuels in total diesel fuel demand, the share of hydrogen and/or synthetic methane in the natural gas grid, etc.).
This output is then combined (soft-coupled) with the LCA impacts of the individual technologies. Detailed explanations on the processing of the LCI data can be found in the following subsections. Note that FRITS is not limited to scenarios generated with MESAP, but can be applied to any model output if the aforementioned data is provided.

2.2. Life Cycle Inventory Database and Software

The LCI data for energy and transport technologies from the attributional ecoinvent v3.3 cut-off database [32] are supplemented by LCI data for biomass conversion from BioEnergieDat [33], UVEK LCI data for PV systems [34], for synthetic fuels from the project on the system comparison of storable renewable energy sources (SYSEET) [35] and for single technologies from various other sources (see Table S1 in the Supplementary Materials), which either provide more recent data or geographically specific data for Germany. All non-ecoinvent datasets have been integrated into the database in order to ensure consistent modelling of background data, system boundaries and time frames. The LCI data adaptions described below are performed with the LCA software openLCA version 1.8. A Python plugin based on GreenDelta [36] is used and adapted to update the parametrized electricity markets within ecoinvent (see Section 2.3.2) and to perform the life cycle impact assessment (LCIA) calculations.

2.3. Matching and Adapting the Life Cycle Inventory Data to the Energy System Model

When coupling LCI data to an ESM, a distinction must be made between processes and flows that are assigned to the foreground and those in the background system. The foreground system is defined as all conversion technologies that are used in the ESM. The background system comprises all flows and activities that are outside the system boundary of the ESM.

2.3.1. System Boundaries and Technology Mapping

In MESAP, the foreground system comprises all sectors and technologies generating electricity, heat, non-fossil fuels (biofuels, power-to-liquid (P2L)), non-fossil gases (biogas, H2 and synthetic CH4) and road transportation (passenger and freight). Note that since many current scenarios for Germany assume a net import of electricity and/or synthetic fuels and gases, the electricity generation and conversion technologies used abroad for this purpose are also treated as foreground technologies in FRITS.
Table 2 gives an overview of the sub-sectors and end-use applications (EUAs). The output generated by these sub-sectors (electricity, heat, transport, fuels) is used by the EUAs.
Technologies in the ESM are matched with a corresponding LCI data set. Ideally, the LCI data represents the respective energy system technology precisely with regard to the technology type used and the model region. If this is not the case, we select proxy data sets that most closely correspond to the process of the energy system model. We also account for technology deployment scenarios on subtechnology level in FRITS (see Excel supplement). In MESAP, the supply of fossil fuels and gases, as well as uranium, and the construction of energy technologies and auxiliary infrastructure are considered outside the energy system. The LCI data of those (background) processes rely exclusively on the ecoinvent database.

2.3.2. Integration of Future Global Electricity Supply Scenarios into the Background Database

The ecoinvent database distinguishes processes in transformation activities and markets (consumption mixes). The aggregation of activities in markets simplifies the identification and modification of relevant parameters such as the shares of technologies that provide the same output in a given geographical region. In this study, the electricity markets are manipulated, most of which are at country level or higher such as provinces. To account for an evolving electricity mix in FRITS, we integrate the global power mix of the 2.0 °C scenarios from Teske et al. [2] for the scenario years 2015, 2020, 2030, 2040 and 2050 in ecoinvent. Next to the 2.0 °C scenario, we also integrate the 5 °C scenario from Teske et al. [2] to test the influence of the adapted electricity mix on both foreground scenarios (see Section 3.3). The 5.0 °C scenario describes a global energy system pathway strongly following the World Energy Outlook (WEO) 2017′s ‘Current Policies’ scenario of the International Energy Agency [37], whereas the 2.0 °C scenario describes a global energy system pathway consistent with temperature increase of below 2.0 °C compared to pre-industrial levels. For further details on the manipulation of the electricity markets, see Appendix A. The reference power plants are listed in Table S4 of the Supplementary Materials.

2.3.3. Separation of Life Cycle Phases

When the traditional per-output LCI data (e.g., kWh electricity from coal power plants) are used for the assessment of energy transformation pathways, assumptions in the LCI data on both the technical lifetime and full load hours of the technologies would be implicitly included in the analysis. Furthermore, such a single impact coefficient per energy output is not adequate to represent energy transformations pathways as the impacts (especially of renewable technologies) mainly occur during a short construction period. To correctly allocate the environmental impacts in time in line with the outputs of MESAP, the LCI data sets are divided into two life cycle phases: construction and operation. The bases for the separation are the unit processes (e.g., for electricity generation) from which the construction processes are excluded and merged in separate data sets (see Table S1 in the Excel supplement).

2.3.4. Harmonisation of Technical Characteristics of the Technologies

Technical characteristics of the energy technologies assumed in the LCI data sets have to be adapted to those of the ESM. The ESM provides detailed data on the technical characteristics in Germany, such as the efficiency, the output ratios (e.g., in the case of CHP plants the power-to-heat ratio) and the coefficient of performance (COP) of heat pumps. In order to harmonise efficiencies and estimates of the COP, it is assumed that all impacts associated with the operation of a technology scale linearly with those parameters in the ESM. If the respective efficiencies of the model (ηMOD) and those assumed in the LCI data (ηLCI) diverge, the output from these process are adjusted by their ratios (OutLCI: output from the original LCI dataset, OutADJ: output adjusted to model efficiency):
Out ADJ = Out LCI · η LCI η MOD
The same is true for adjustments in the COP of heat pumps. For CHP technologies in ecoinvent (cut-off), LCIs are already pre-allocated to heat and power generation. For those technologies, first the total efficiencies (sum of heat and power output divided by fuel input) are calculated from the documented (separate) efficiencies with respect to heat generation, to power generation and the power-to-heat-ratios of the respective LCI data sets. The environmental impacts are then adjusted to total efficiency assumptions in the energy system model according to the equation above. Total impacts from CHP are subsequently allocated to heat and power generation according to the heat and power output (energy allocation).

2.3.5. Avoiding Double Counting in the Foreground System

The foreground system assessed in this study comprises both EUAs (e.g., electric heat pump or residential gas heater providing space heat) and conversion technologies (such as power plants or technologies for the production of synthetic gases). Thus, in order to avoid double counting of environmental impacts, any inputs of energy sources generated by other foreground technologies have to be excluded from the LCI datasets (see exemplary illustration in Figure 2).
With this approach, the environmental impact of the production of these secondary or final energy carriers is assigned to the conversion technologies (e.g., electricity generation in a gas turbine).

2.3.6. Impacts of Energy Carrier Mixes

Some technologies (e.g., a gas burner for heat generation) of the foreground system can be operated by a mix of energy sources generated both in the background (e.g., natural gas) and in the foreground (e.g., H2) (see Figure 3).
Therefore, several product systems are modelled to allow for a fuel mix. These product systems rely on the original LCI datasets (e.g., transport by a diesel fueled passenger car) from which the original inputs of the fuel supply (e.g., diesel) and the construction (e.g., of the vehicle) are deleted. For technologies where hydrogen is burned (gas burners, gas turbines, etc.), we remove all emissions except NOx from the original unit process to approximate direct emissions. NOx emission factors are taken from the original unit process. However, as ecoinvent does not contain any process emissions for the combustion of non-fossil fuels (such as biodiesel or synthetic gas), it is assumed that the emissions are the same as those of the corresponding conventional fuels. For the correct consideration of CO2 emissions in the impact assessment method, they are characterized as non-fossil (synthetic fuels and gases) or biogenic (biofuels and gases). These adaptions include product systems that have the following primary energy sources as inputs: gas: admixture of biomethane, H2 or synthetic CH4; diesel: admixture of biodiesel and synthetic fuels; gasoline: admixture of bioethanol; kerosene and marine diesel: admixture of biomass to liquid (BtL) and synthetic fuels (see Table S1 in the Excel supplement).

2.3.7. Avoiding Double Counting in the Background System

When assessing large scale systems, double counting also occurs in other processes (e.g., the construction of power plants), since part of the energy and service inputs (e.g., electricity, heat or transport processes) take place within the geographical system boundary of the scenario assessed. As the ecoinvent database models the electricity supply (in the form of markets) according to a sufficient regional granularity (e.g., for Germany), the supply flows (e.g., electricity production from a wind turbine in Germany) are removed from the German electricity market and thereby from all processes in the database. In other words, the German electricity mix has no impacts in the background. Thus, we avoid double counting on the level of the LCA indicators.
However, double counting is not avoided for heat and transport supply processes due to the insufficiently detailed regional resolution of the database. Since the present analysis covers Germany only, we expect the impact of double counting from the heat and transport activities in in the LCI database to be of limited relevance.

2.4. Linking Scenario Results with LCA Impacts for Scenario Assessment

The impact assessment is based on two of model outputs: (a) annual gross new installations (including replacements after the end of the technical lifetime) of power, heat, gas and fuel generating technologies, electricity storages as well as passenger cars, and (b) annual power, heat, gas and fuel generation and/or the corresponding final energy consumption of those technologies. Gross new installations of power, heat and fuel generating technologies are given in units of MW/a (where the capacity is related to the output). New cars are reported in number of new vehicles. The functional unit for any kind of power, heat, fuel or gas generation is kWh (lower heating value). Passenger and freight transport is given in passenger kilometres and tonne kilometres, respectively. The impact assessment data (per functional unit) are harmonised with the model assumptions (see Section 2.3.4) and then multiplied with the corresponding scenario output to obtain the impacts at the technological, sub-sectoral and scenario levels.
The environmental impacts can also be allocated from the foreground technologies to the 17 EUAs (Table 2) to provide information on the original polluter. This allocation is based on the scenario results (e.g., share of the EUAs in total (net) power demand) and done iteratively on an annual basis.

2.5. Energy Scenarios Used in the Case Study

Two different energy (foreground) scenarios for Germany are used in order to compare life cycle impacts for different transformation paths. The scenario ‘Target’ is taken from Pregger et al. [30]. It is a normative scenario that describes a technically feasible way of achieving the German targets for reducing greenhouse gas emissions by 80% by 2050. The ‘Reference’ scenario is inspired by the ‘Referenzszenario’ (reference scenario) from the BMWi [38]. The main characteristics of the scenarios are shown in Figure 4 and Figure 5.
In the original study from BMWi [38], the ‘Reference’ scenario describes a business-as-usual (BAU) case with a reduction of energy related CO2 emissions by ~59% until 2050. However, assumptions on drivers (e.g., population and GDP) and on efficiency improvements differ between Pregger et al. [30] and BMWi [38]. In this study, the aim is to compare the effect of different transformation depths (e.g., shares of renewables) and different technological options, of drivers and assumptions. Thus, the BMWi ‘Reference’ scenario is adapted to Pregger et al. [30] regarding GDP, population, useful energy demand and transport. In each EUA or conversion sector, technology shares for the ‘Reference’ scenario are adopted. This leads to a CO2 reduction of ~65% in 2050 compared to 1990 in the ‘Reference’ scenario (see Figure 5).
As these energy scenarios provide only limited information on some transport sectors, we do not account for the impact of new installations of the technologies listed in Table 3 in the following case study. However, operation-dependent life cycle impacts according to the information on the required final demand are considered in the foreground.

3. Results

In the following case study, we use a selection of midpoint indicators from the ILCD 2.0 2018 method [39]. The impact categories used in this study are listed in Table 4.

3.1. Co-Benefits and Adverse Side Effects at a Sectoral and Overall Scenario Level

In the first two sections (Section 3.1.1 and Section 3.1.2), the main sub-sector (see Table 2) and the corresponding technology most relevant for each indicator is highlighted. A more detailed sectoral analysis is provided in Section 3.1.3, where we analyse climate change, local emissions and the resulting effects on human health as well as the demand for minerals and metals. The latter two dimensions are selected because they have been recognized in various studies as crucial aspects to monitor when assessing the transformation of the energy system [40,41].

3.1.1. Environmental Co-Benefits and Adverse Side Effects of the Energy System Transformation

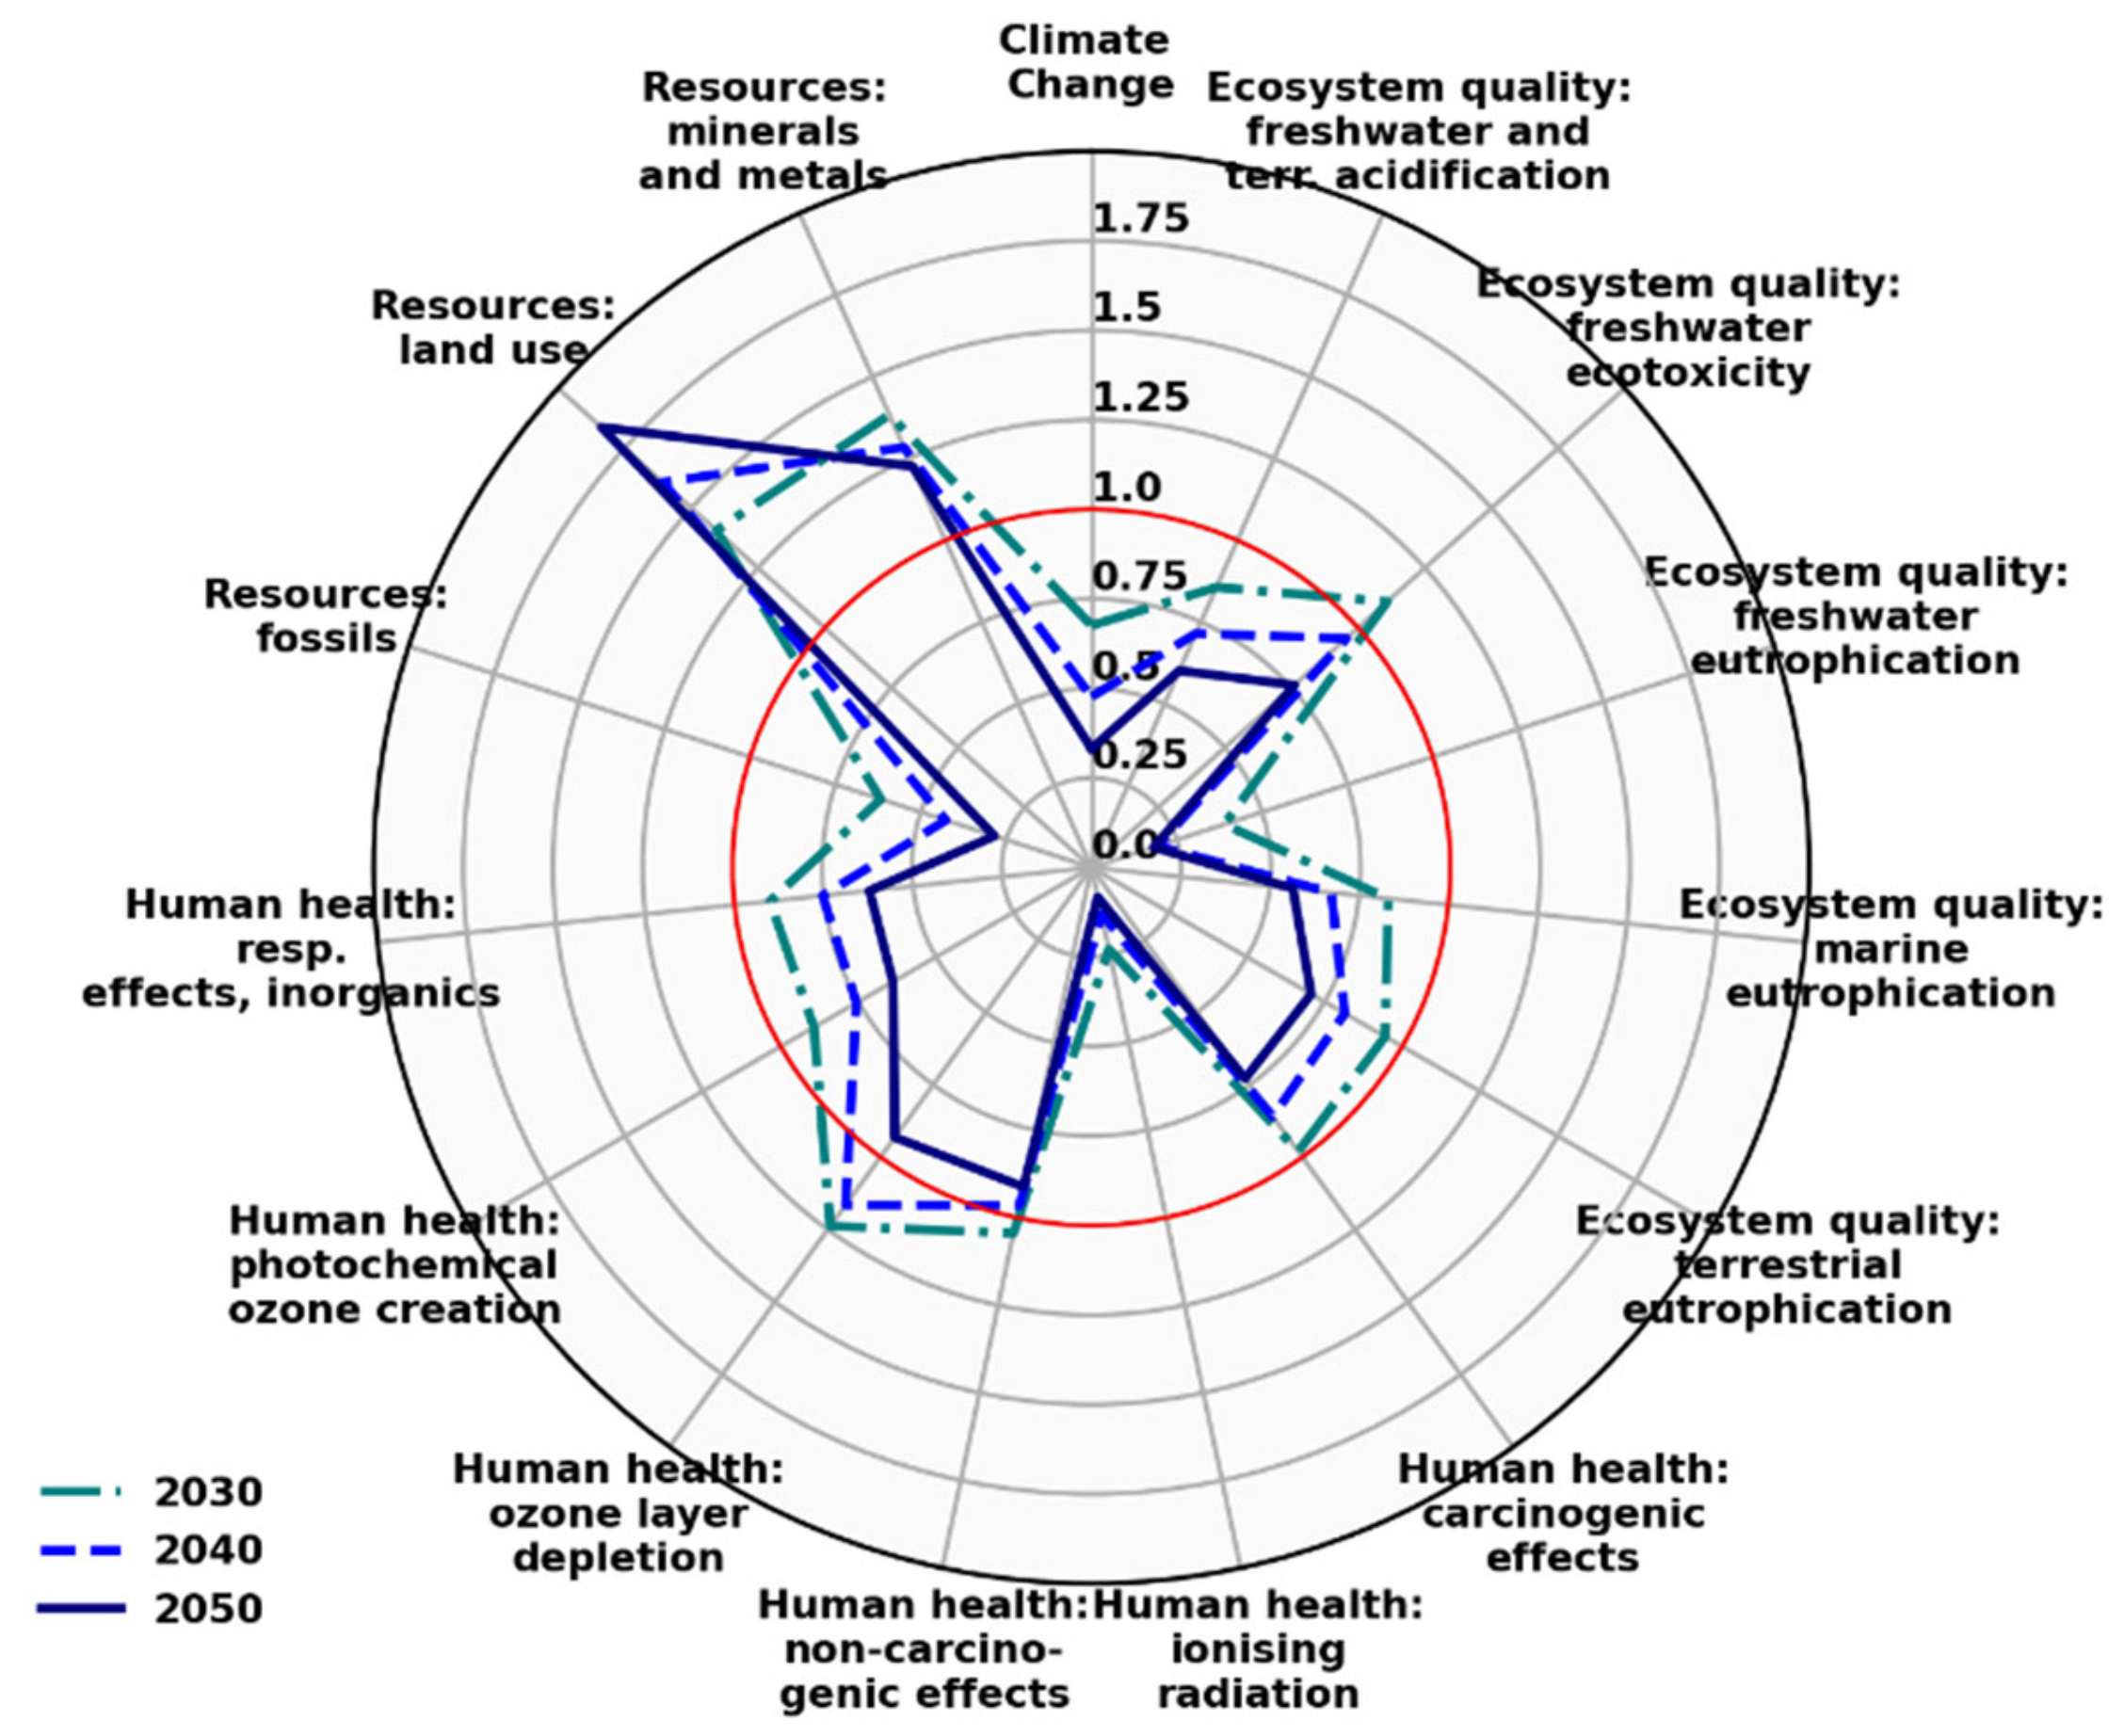
Figure 6 shows the impacts of the ‘Target’ scenario for 2030, 2040 and 2050 relative to the impacts in 2015. It illustrates that both co-benefits (impact ratio < 1) and adverse side effects (impact ratio > 1) of an ambitious transformation path show a clear increasing or decreasing trend for some impacts, while other impacts first increase and then decrease again. The following analysis focuses on those indicators where the difference between 2015 and the ‘Target’ scenario is at least ±15% in one of the years.
In accordance with previous literature, the energy system transformation causes adverse side effects in the use of minerals and metals as well as in land use [7,11]. The increase in the indicator ‘minerals and metals’ can be attributed in particular to road passenger transport, with Otto and diesel engines being substituted by plug-in hybrid electric vehicles (PHEVs) and battery electric vehicles (BEVs) from 2020 onwards. Both car types have a higher specific (per car) value for ‘minerals and metals’, but the increasing sufficiency in road passenger transport assumed in the scenario (lower total passenger km) leads to a slight reduction of this impact category for the years 2040 and 2050 compared to 2030. The widening gap for the indicator ‘land use’ compared to 2015 is mainly due to the use of agricultural land for the production of wood used directly as pellets or in gasification in the bioenergy conversion sector. The strong impact of energy crop cultivation on land use is also highlighted by Volkart et al. [7].
For the indicators ‘ozone layer depletion’ and ‘freshwater ecotoxicity’, the energy transformation first leads to an increase and then to a decrease in 2050 of the indicators compared to 2015. In 2030 and 2040, ‘ozone layer depletion’ is driven in particular by bioethanol production from winter wheat and grass in the bioenergy conversion sector. The decline in bioethanol production from 2025 to 2050 eventually leads to a better performance of the scenario in 2050 compared to 2015. In 2050, passenger transport, especially BEVs, make the largest contribution to this indicator. The ecosystem quality related ‘freshwater ecotoxicity’ is dominated by passenger transport in all years. In 2030, this dominance is largely driven by Otto and diesel engines, while between 2040 and 2050, BEVs and PHEVs are increasingly responsible for the reduced impact.
As shown in other studies [6,8,18], the phase-out of fossil power plants, specifically lignite-based power generation, leads to a considerable reduction of the indicators ‘climate change’, ‘fossils’, ‘carcinogenic effects’, ‘marine eutrophication’, ‘freshwater eutrophication’ as well as ‘freshwater and terrestrial acidification’. The decline in the indicator ‘respiratory effects, inorganics’ is due to the declining use of Otto and diesel engines in road passenger transport, but also to the decline in the use of coal and the switch to solar thermal production for process heat for industry. Passenger transport also drives most of the reductions in ‘photochemical ozone creation’ and ‘terrestrial eutrophication’. The phase-out of nuclear power plants by 2022 leads to a sharp decline of ‘ionizing radiation’.

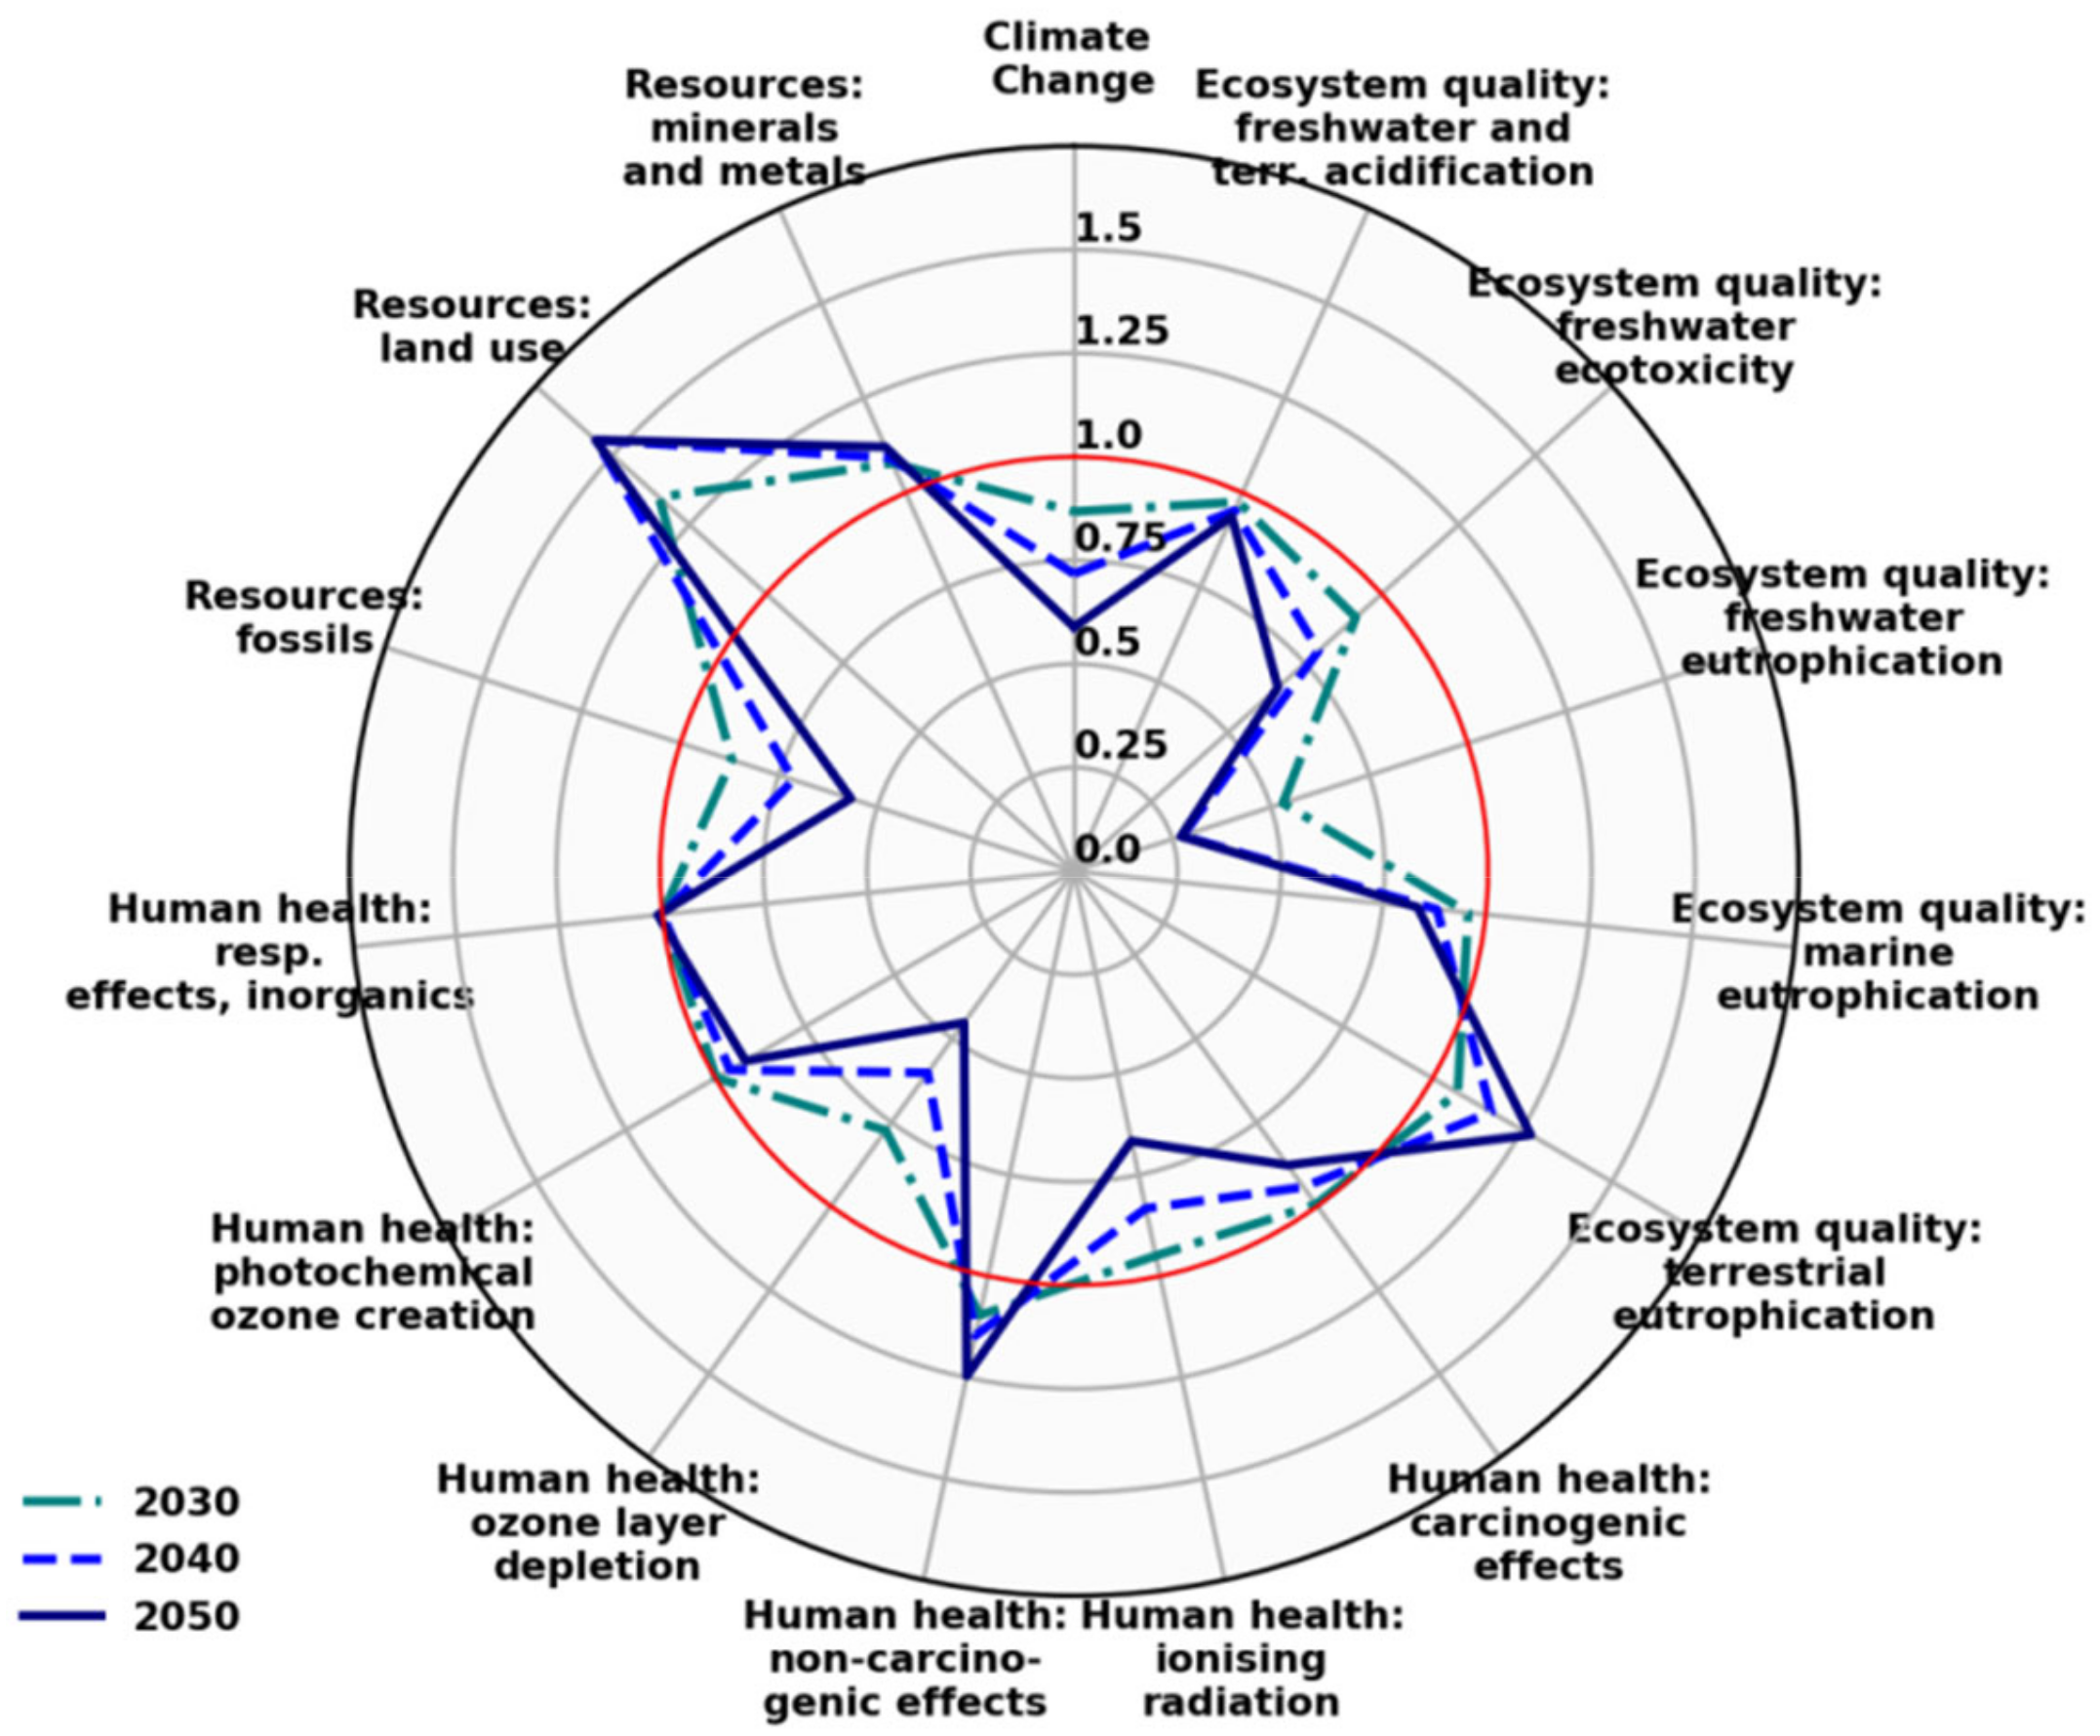
3.1.2. Comparison of the Impacts of the ‘Reference’ and ‘Target’ Scenarios

Figure 7 shows the impacts of the ‘Target’ scenario relative to the impacts of the ‘Reference’ scenario for 2030, 2040 and 2050. The differences between the scenarios per indicator mostly follow a clear trend with increasing years. This is also true at the level of the responsible sub-sectors. Therefore, the following analysis focuses on the year 2050. In addition, only indicators where the difference between the ‘Target’ and ‘Reference’ scenarios is at least ±15% in 2050 are analysed in more detail.
Significant higher impacts in the ‘Target’ scenario, i.e., adverse side-effects, can be observed for the indicators ‘land use’, ‘non-carcinogenic effects’ and ‘terrestrial eutrophication’, while ‘minerals and metals’ is only slightly affected. Higher land use impacts are primarily driven by the bioenergy conversion sector, i.e., agricultural land for energy crops such as short rotation forestry for the production of wood pellets or in gasification as well as rapeseed for biodiesel production. The difference of human-health-related ‘non-carcinogenic effects’ is driven by the greater share of heat and power co-generation in industry using wood chips and the higher production of biodiesel and biogas in the bioenergy conversion sector. Biogas production from energy crops also accounts for most of the larger impacts in ecosystem quality related ‘terrestrial eutrophication’.
Similar impacts of the ‘Target’ scenario compared to the ‘Reference’ scenario for all years occur for the indicator ‘respiratory effects, inorganics’. The indicators ‘photochemical ozone creation’, ‘carcinogenic effects’ and ‘freshwater and terrestrial acidification’ are slightly lower. Significantly lower impacts can be observed for the indicators ‘climate change’, ‘fossils’, ‘ozone layer depletion’, ‘ionising radiation’, ‘marine eutrophication’, ‘freshwater eutrophication’ as well as ‘freshwater ecotoxicity’. Declining impacts of ‘climate change’ and ‘fossils’ in the ‘Target’ scenario are mainly caused by the phase out of lignite-based generation by 2038 and the deployment of electric vehicles which reduces fossil fuel demand and emissions from combustion. The power plant sector is also responsible for most of the differences of ‘marine eutrophication’ and ‘freshwater eutrophication’ in 2050. The difference in the human health related indicator ‘ozone layer depletion’ is mainly caused by the lower production of bioethanol from winter wheat and grass in the bioenergy conversion sector. The latter and road passenger transport, especially the significant reduction of Otto engines, are responsible for the majority of the differences in ‘freshwater ecotoxicity’ in 2050. The difference in ‘ionising radiation’ is due to road freight and passenger transport, as less petroleum is produced, the process in which most impacts occur in 2050, e.g., from naturally occurring radioactive material.

3.1.3. Impacts for Selected Indicators at the Level of Technology Groups and End-Use Sectors

In the following section, the assessment is conducted both at sub-sector level and for EUAs (see Table 2) and, if relevant, the technology of the sub-sector responsible for most of the respective impacts is highlighted.

3.1.4. Climate Change

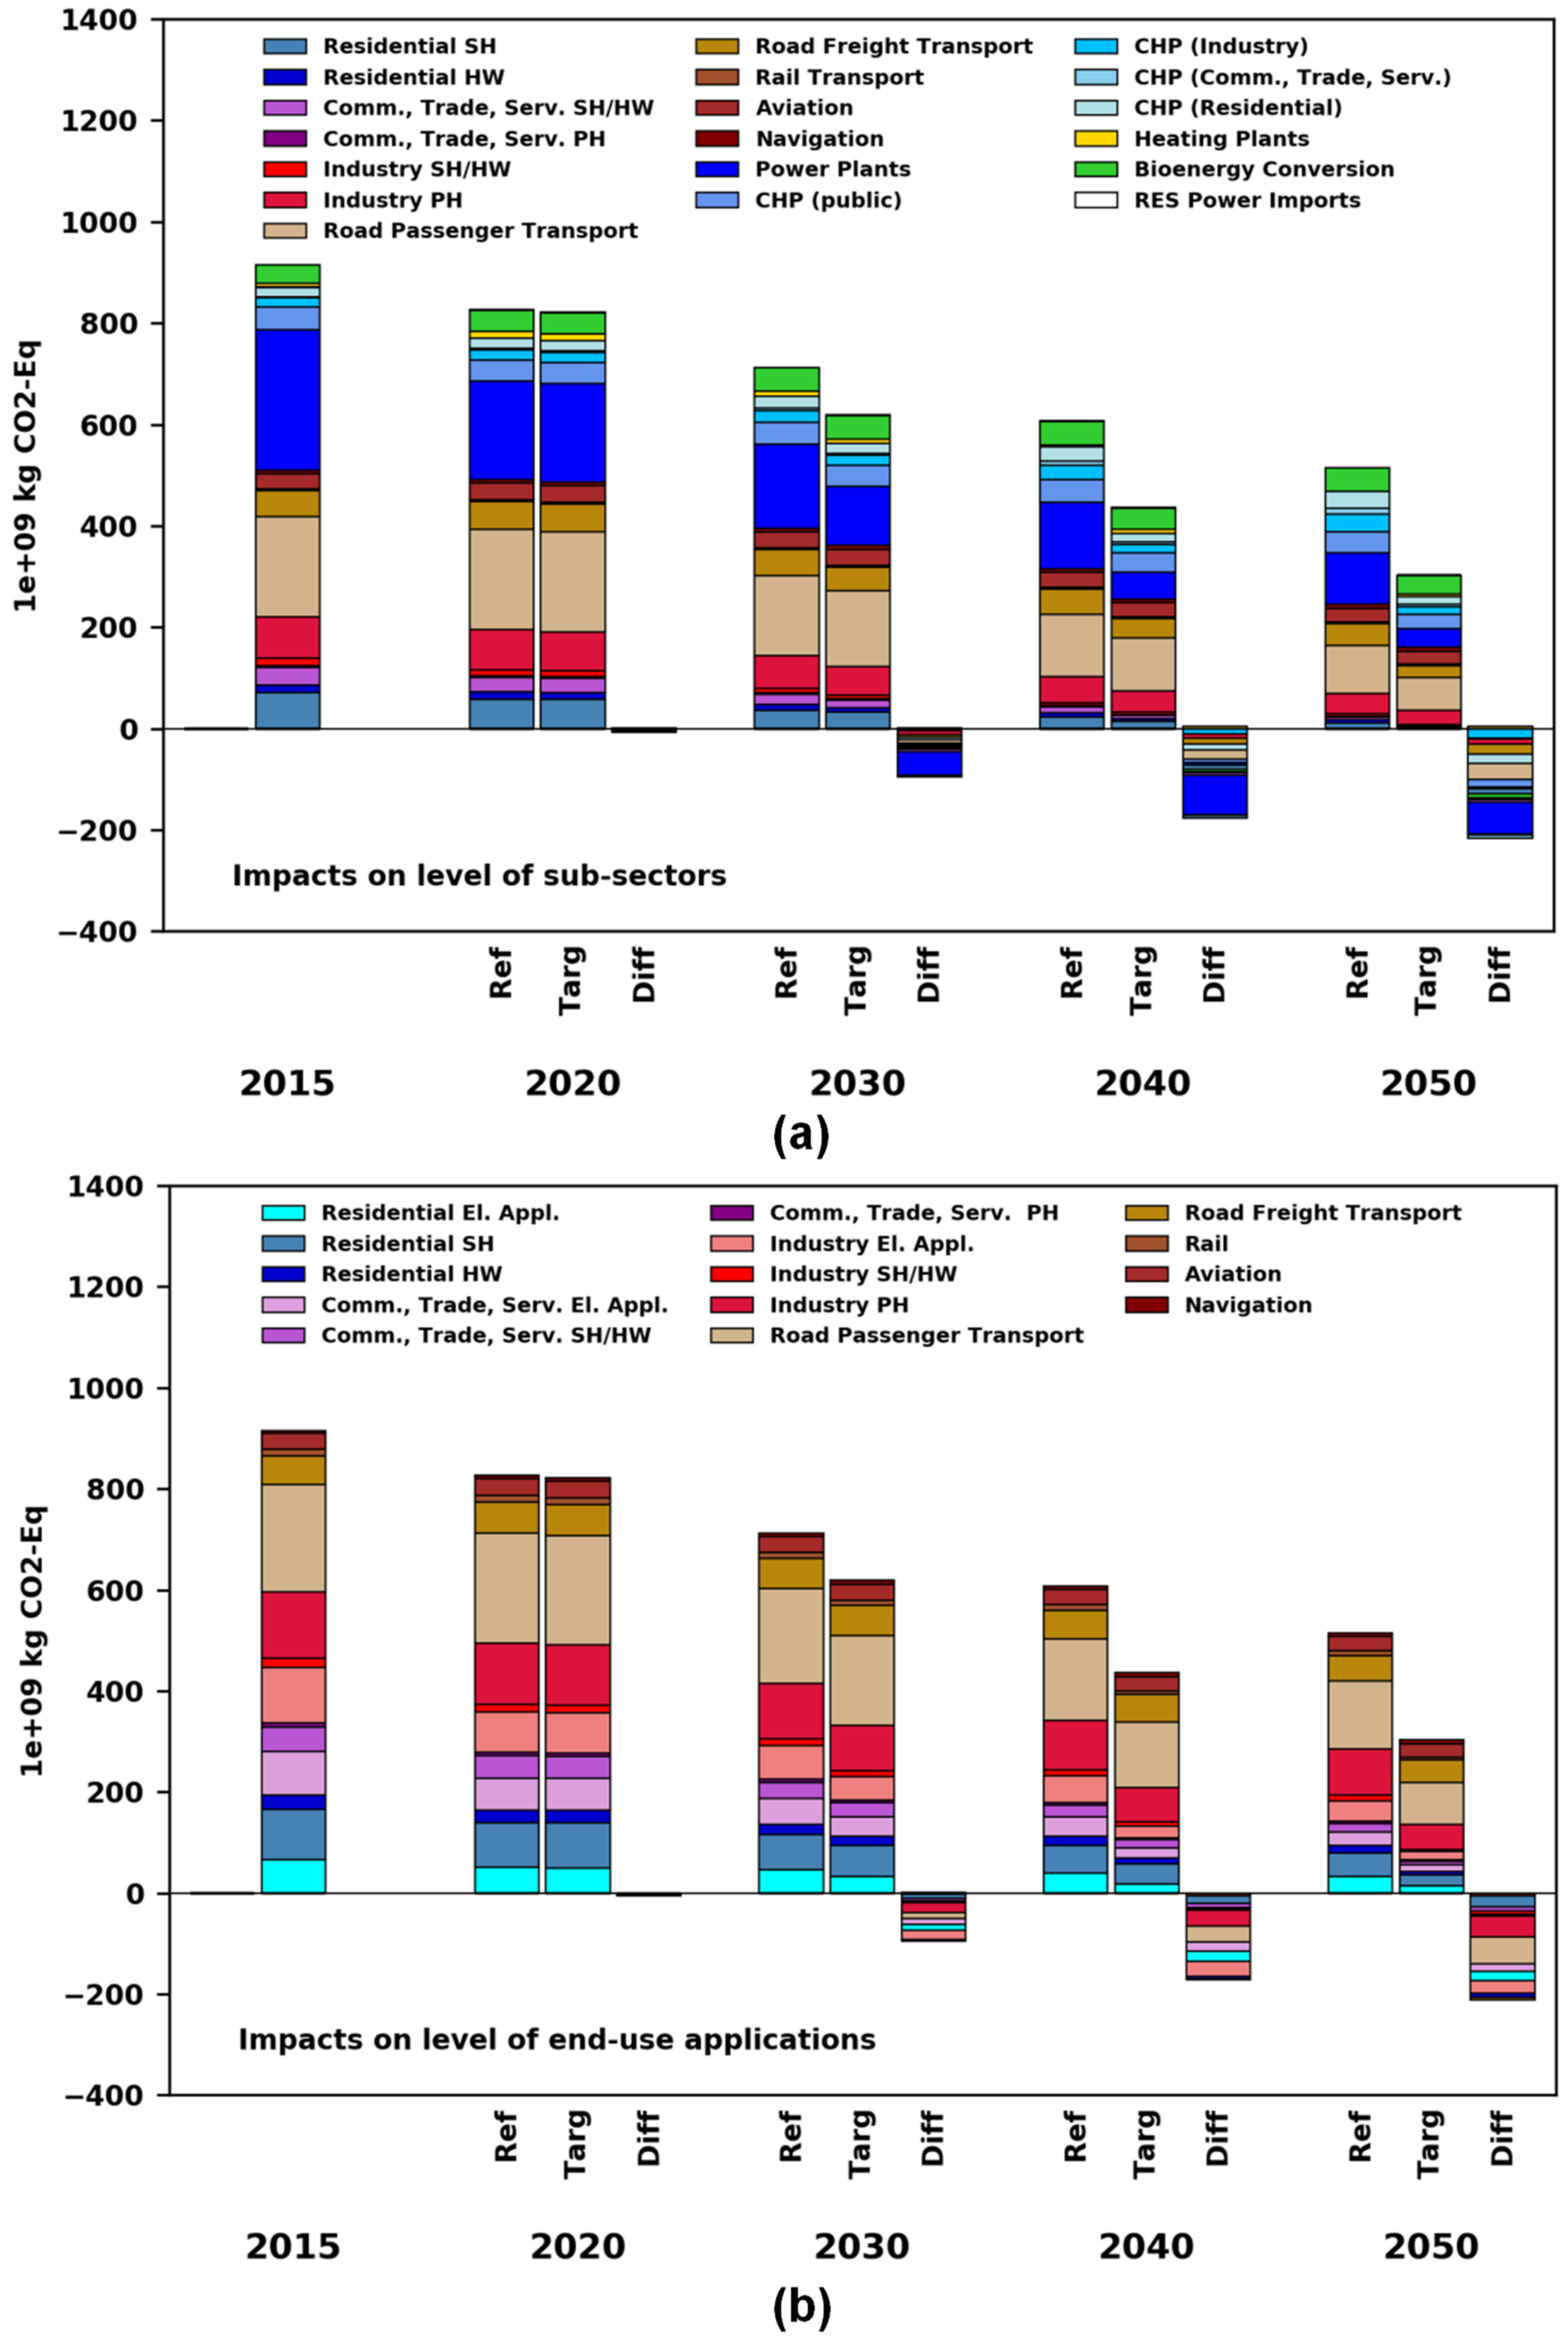
Between 2015 and 2050, total life cycle CO2 eq decrease by 44% and 67% in the ‘Reference’ and ‘Target’ scenario, respectively (see Figure 8). This results in a difference between the two scenarios of 211 Mt CO2 eq in 2050.
In both scenarios and all years, the main drivers in the sub-sectors (Figure 8a) are road freight and passenger transport as well as power generation. In 2050, the impacts related to freight transport are dominated by light and heavy duty vehicles with diesel engines, although in the ‘Target’ scenario they are operated to a larger extent with bio-based fuels or hydrogen. In the ‘Target’ scenario, there is also a greater technological shift in passenger transport with an increased use of PHEVs and BEVs. Thus, the higher direct and indirect electrification of both transport modes in the ‘Target’ scenario leads to a reduction of total climate change impacts.
As described above, the phase out of coal based generation and the switch to renewable electricity and natural gas in the ‘Target’ scenario leads to a strong decrease of overall greenhouse gas emissions, in particular during the operation phase of the power plants. In 2050, in addition to the dominant gas-fired power plants, 19% of total emissions in the power sector would be accounted for by rooftop PV. Furthermore, emissions from biomass cultivation and supply in the bioenergy conversion sector are driven by biodiesel production in the ‘Target’ scenario and bioethanol production in the ‘Reference’ scenario.
The column ‘Diff’ shows the difference between both scenarios for each year. If the difference is negative for a given sector, then the impacts from the ‘Target’ scenario are lower in this sector compared with the ‘Reference’ scenario. This means that ambitious climate protection has co-benefits in the respective sector and impact category. On the other hand, if the difference is positive, ambitious climate protection comes along with adverse side effects. All the aforementioned sectors emit absolutely less in the ‘Target’ than in the ‘Reference’ scenario.
In line with the sub-sectors, all the EUAs perform better in the ‘Target’ scenario than in the ‘Reference’ case in all years. In both scenarios, emissions caused by different end-use sectors in 2050 are dominated by passenger and freight cars as well as process heat production for the industrial sector (see Figure 8b). The avoided CO2 eq in the ‘Target’ scenario are mainly due to road passenger transport and industrial electric appliances. The large emission differences in power generation between the two scenarios (see Figure 8a) are thus now particularly reflected in passenger road transportation and industrial electric appliances due to the higher degree of direct electrification of these applications in the ‘Target’ scenario compared to the ‘Reference’ case.

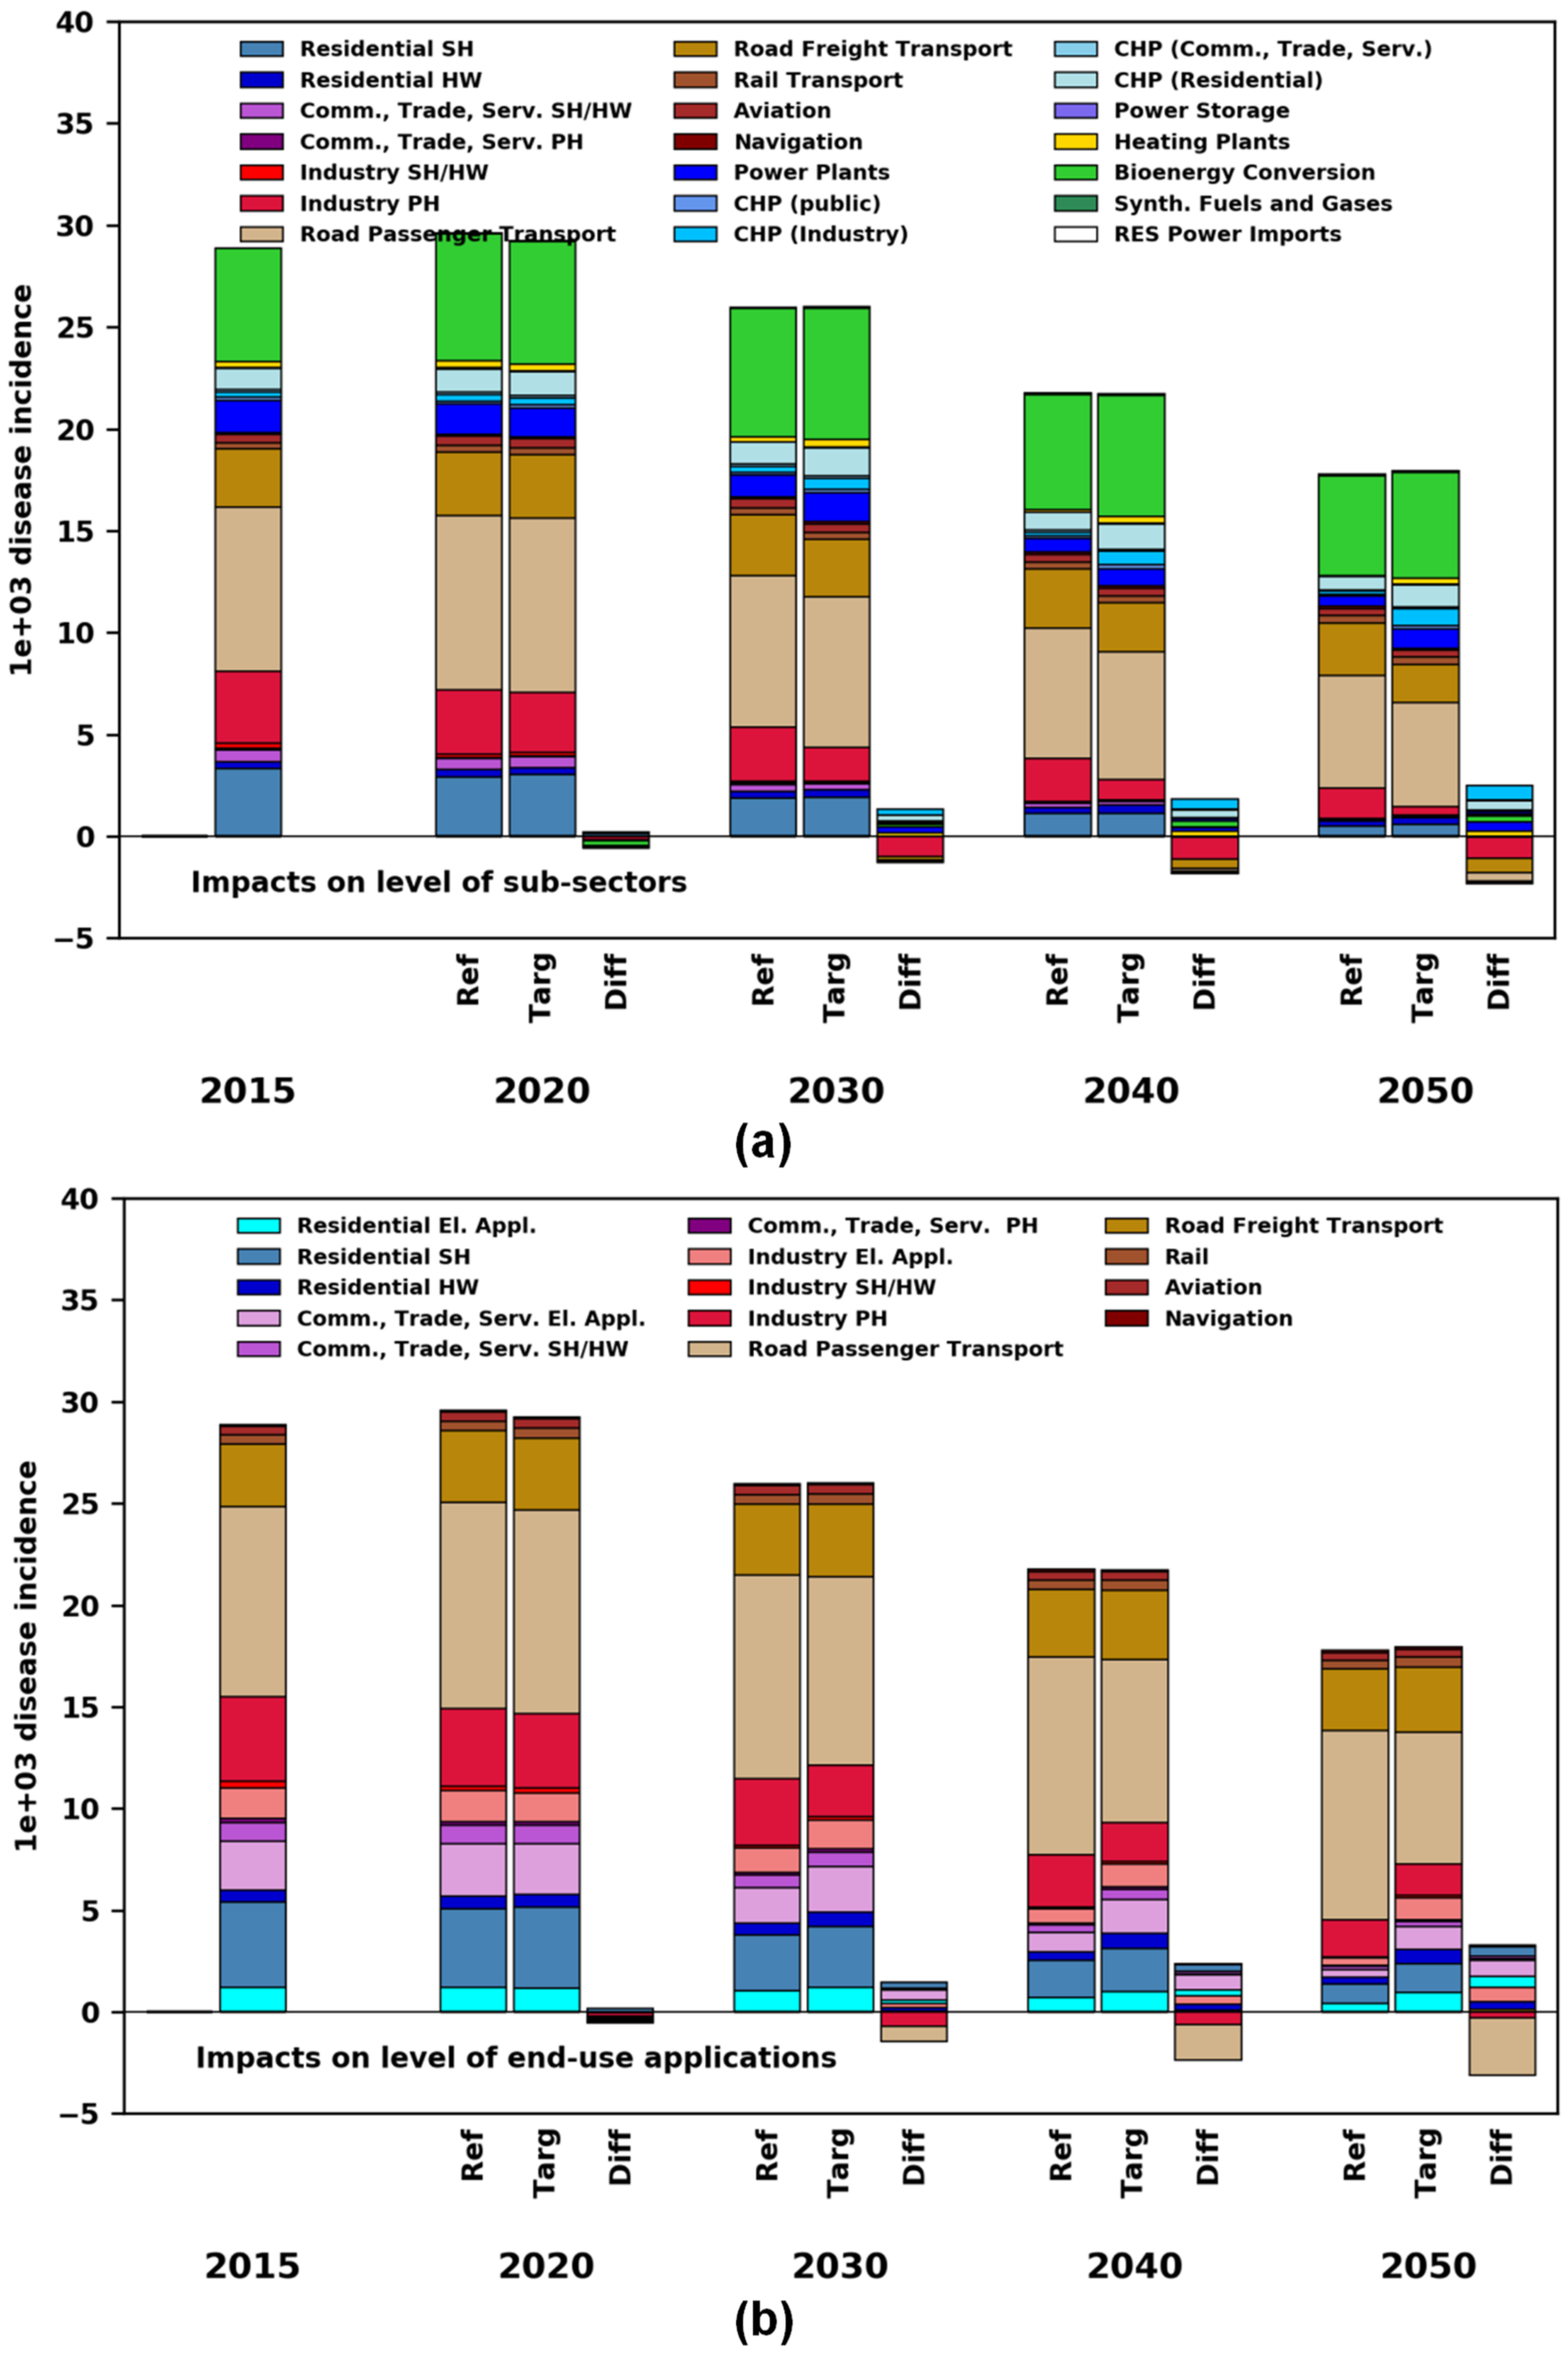
3.1.5. Disease Incidences

The disease incidences of the two scenarios are reduced by 39% and 38% between 2015 and 2050 respectively for the ‘Reference’ and ‘Target’ scenarios (see Figure 9). Over the whole time horizon, both scenarios reveal quite similar impacts on the scenario level, while the shares of the sub-sectors in the overall impact become increasingly different over time between the scenarios.
In 2050 and in both scenarios, the main drivers for disease incidences of the sub-sectors (Figure 9a) are road passenger and freight transport as well as the bioenergy conversion sector. Similar to climate change, the impacts related to freight transport are dominated by light and heavy duty vehicles with diesel engines. Disease incidences from road passenger transport in the ‘Reference’ scenario mostly stem from vehicles with Otto engines (in the scenario they have almost three times the annual mileage in 2050 compared to diesel engines). In the ‘Target’ scenario, the impact is dominated by PHEVs with Otto engines but also from BEVs where the impact is shifted towards the construction phase of the vehicle. Most of the impacts in the transport sector are caused by PM2.5 emissions. In the bioenergy conversion sector, on the other hand, impacts in the ‘Reference’ scenario are mainly driven by SO2, NH3 and NOx emissions from cultivating of winter wheat and grass for the production of bioethanol, whereas in the ‘Target’ scenario NH3 emissions during the fermentation process for biogas production are the main cause.
The sectors where disease incidences are comparably smaller in the ‘Target’ scenario compared with the ‘Reference’ scenario are mainly freight and road passenger transport as well as process heat in industry (Figure 9a). However, these positive effects are counterbalanced by increased impacts for combined electricity and heat production for industry and residents where emissions mainly result from the increasing combustion of solid biomass. Likewise, respiratory diseases in the ‘Target’ scenario from the electricity sector are higher than those in the ‘Reference’ case, especially due to the higher installation rate of rooftop PV with high impacts during construction.
In the EUAs perspective, in both scenarios in 2050, passenger and freight cars are clearly the main contributors to respiratory disease impacts due to the large consumption of bio- and synthetic fuels and electricity (see Figure 9b). The impacts of road passenger transport are smaller in the ‘Target’ scenario compared to the ‘Reference’ scenario, mainly because of the higher direct and indirect electrification in the ‘Target’ scenario compared to the use of biofuels in the ‘Reference’ scenario. On the other hand, impacts from the residential and industrial electrical appliances are higher in the ‘Target’ than in the ‘Reference’ scenario due to higher impacts from power generation in the former (see Figure 9a). Higher impacts in the EUA residential heat in the ‘Target’ scenario are cause by the greater use of biomass.

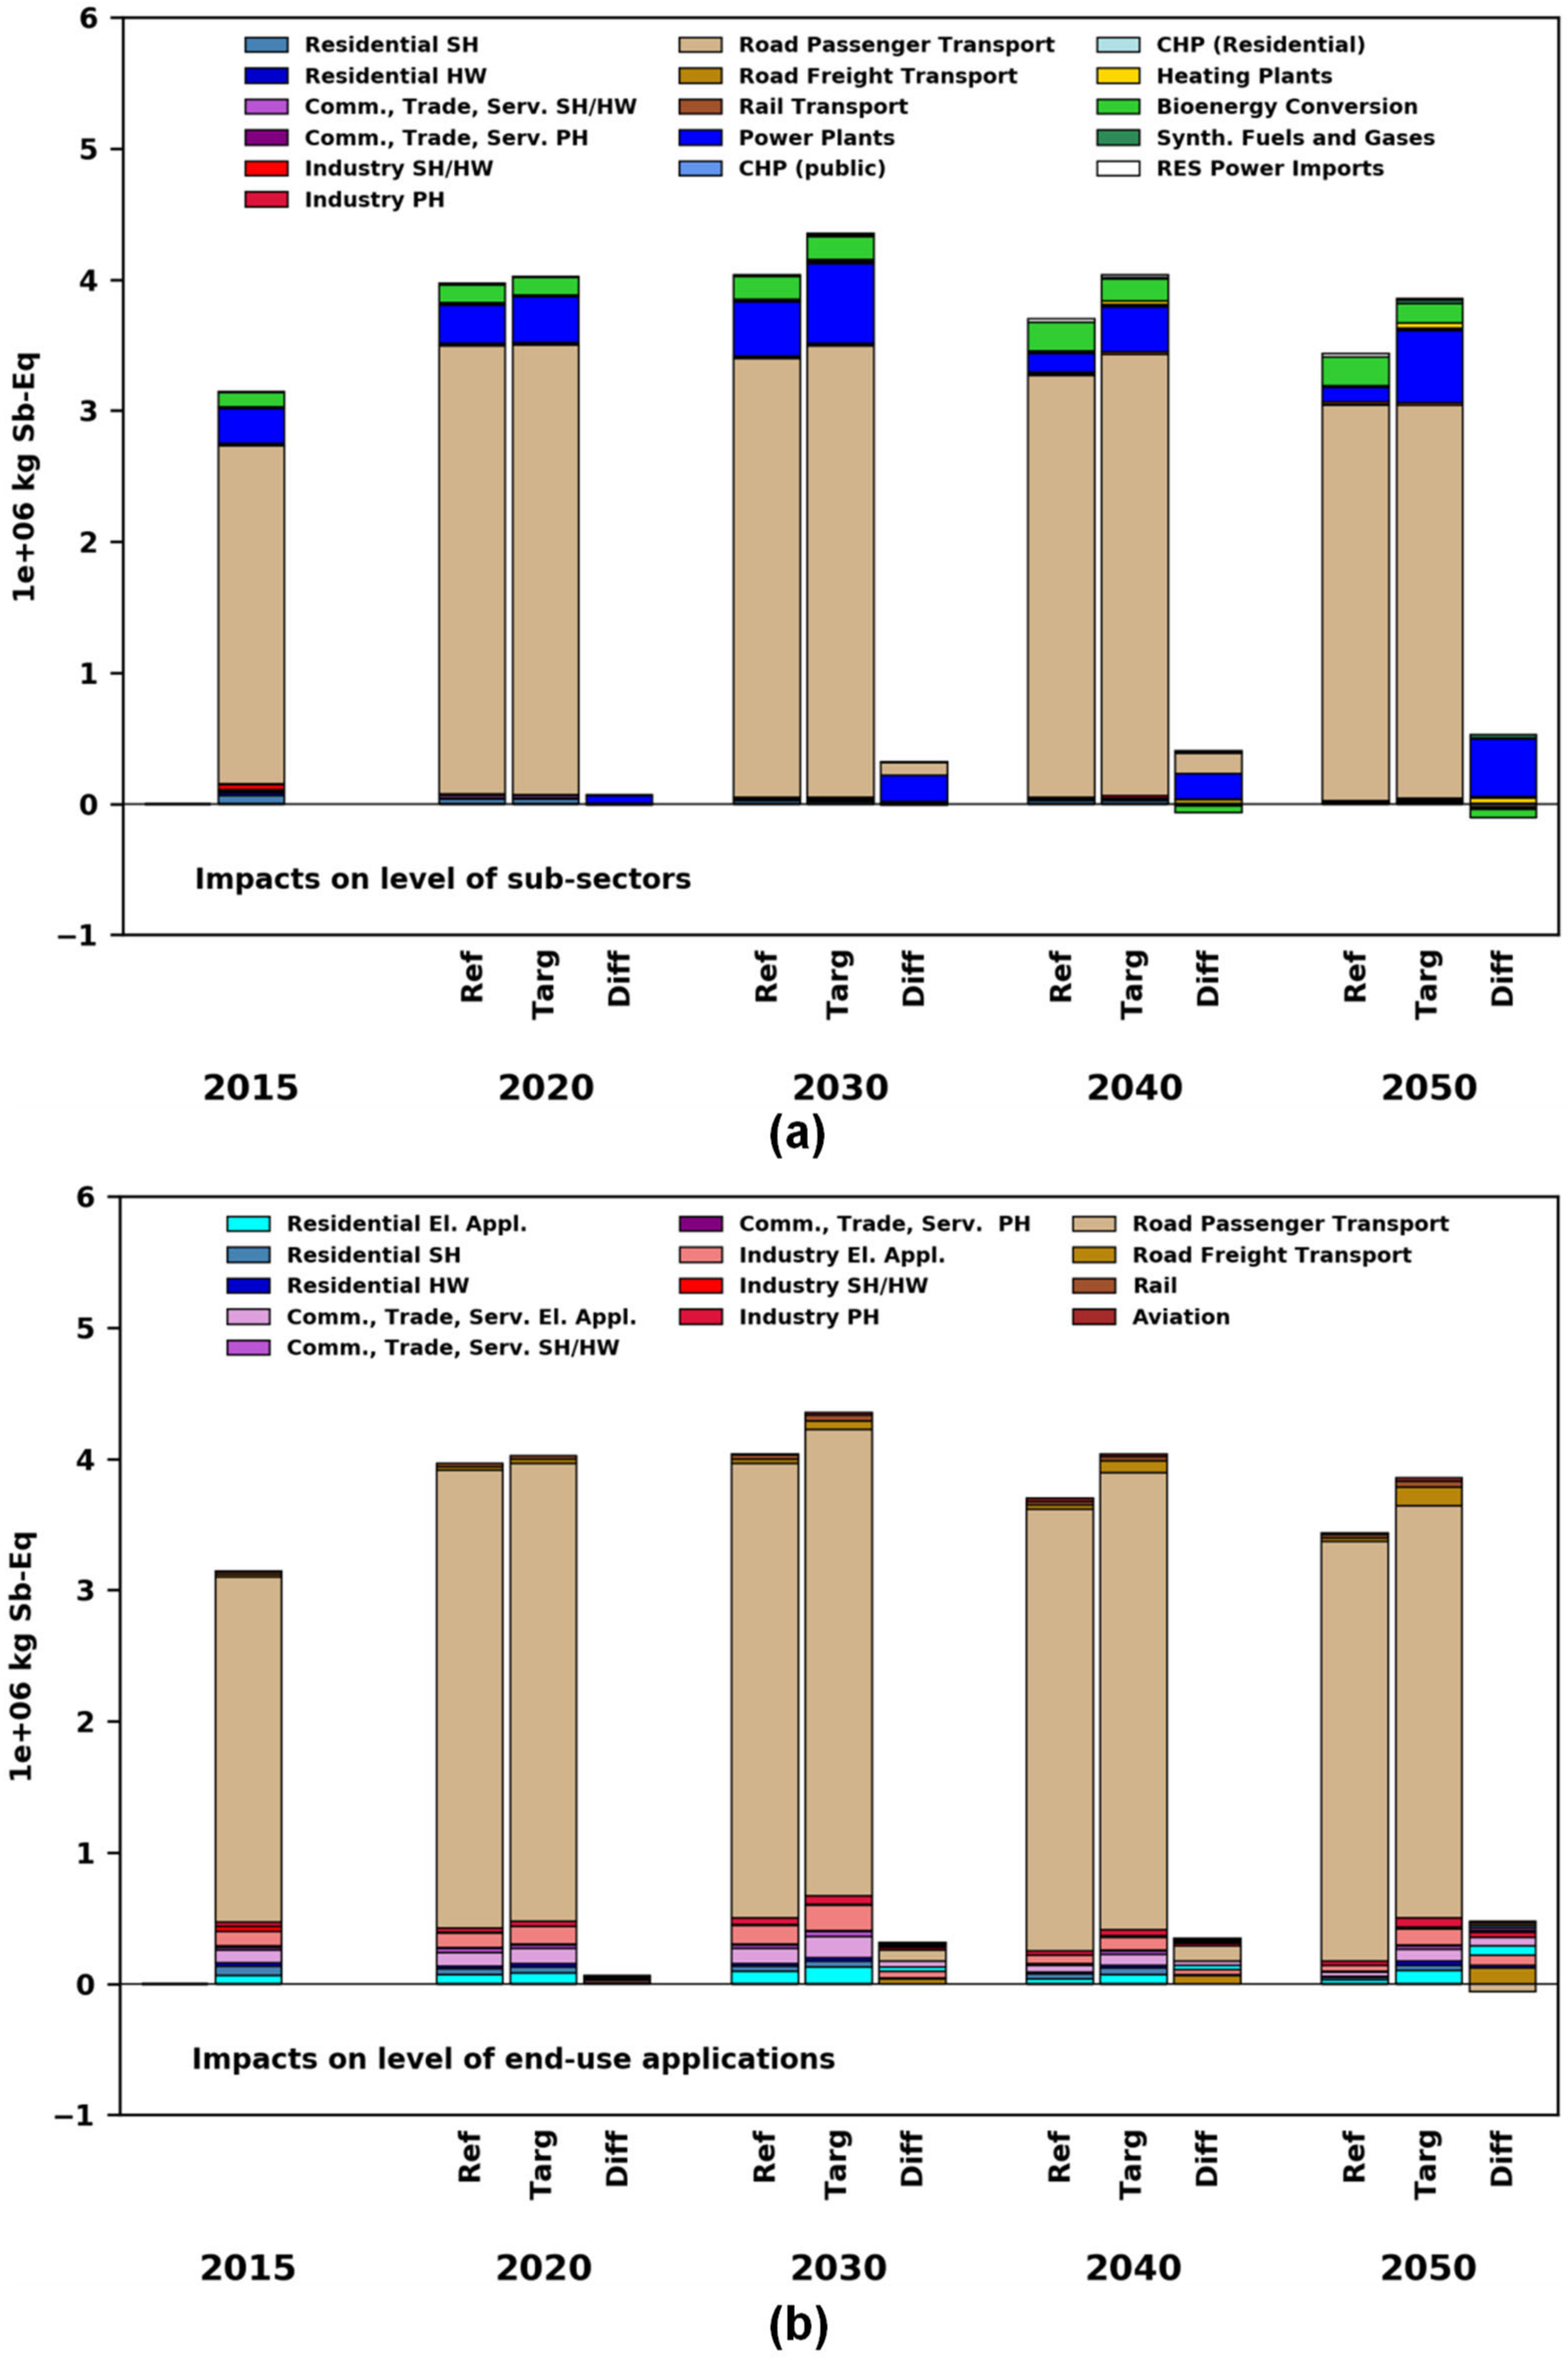
3.2. Resource Depletion of Minerals and Metals

Between 2015 and 2050, the resource depletion of minerals and metals increases by 9% in the ‘Reference’ scenario and by 23% in the ‘Target‘ scenario (see Figure 10).
In a sub-sectoral perspective, in both scenarios and for all years, the main driver is road passenger transport (Figure 10a). However, the comparatively stronger expansion of PHEVs with Otto engines and BEVs in the ‘Target’ scenario only contributes slightly to the adverse side effects. In the electricity sector, which is responsible for most of the higher impacts of the ‘Target’ scenario, the strong increase in rooftop PV in particular increases the material intensity. While the peak in the ‘Reference’ scenario in 2030 is also attributed to rooftop PV, the impact in the following years in the ‘Reference’ scenario is mainly driven by wind-onshore power plants and is noticeably decreasing. Bioethanol production accounts for a large part of the impacts of the bioenergy conversion sector in the ‘Reference’ scenario. In the ‘Target’ scenario, the effects of bioenergy conversion are driven by bioethanol, biodiesel and biogas production, leading to slight co-benefits in this sector. In the ‘Target’ scenario, the use of flat and tube solar collectors as local heating systems causes most of the impact in this sector.
From an EUAs perspective and in line with the sectoral perspective, passenger cars cause most of the impacts of both scenarios (Figure 10b). Freight transport plays a larger role, as it consumes parts of the liquid biofuels where impacts are associated with the respective infrastructure (e.g., biomass conversion plants). The greater extent of direct electrification results in a comparably higher impact in most other EUAs in the ‘Target’ scenario compared with the ‘Reference’ scenario. The only exception is road passenger transport, where slight co-benefits arise due to the larger share of indirect electrification in the ‘Target’ scenario compared to the ‘Reference’ scenario via H2 and the comparatively small contribution of electrolysis to this indicator.

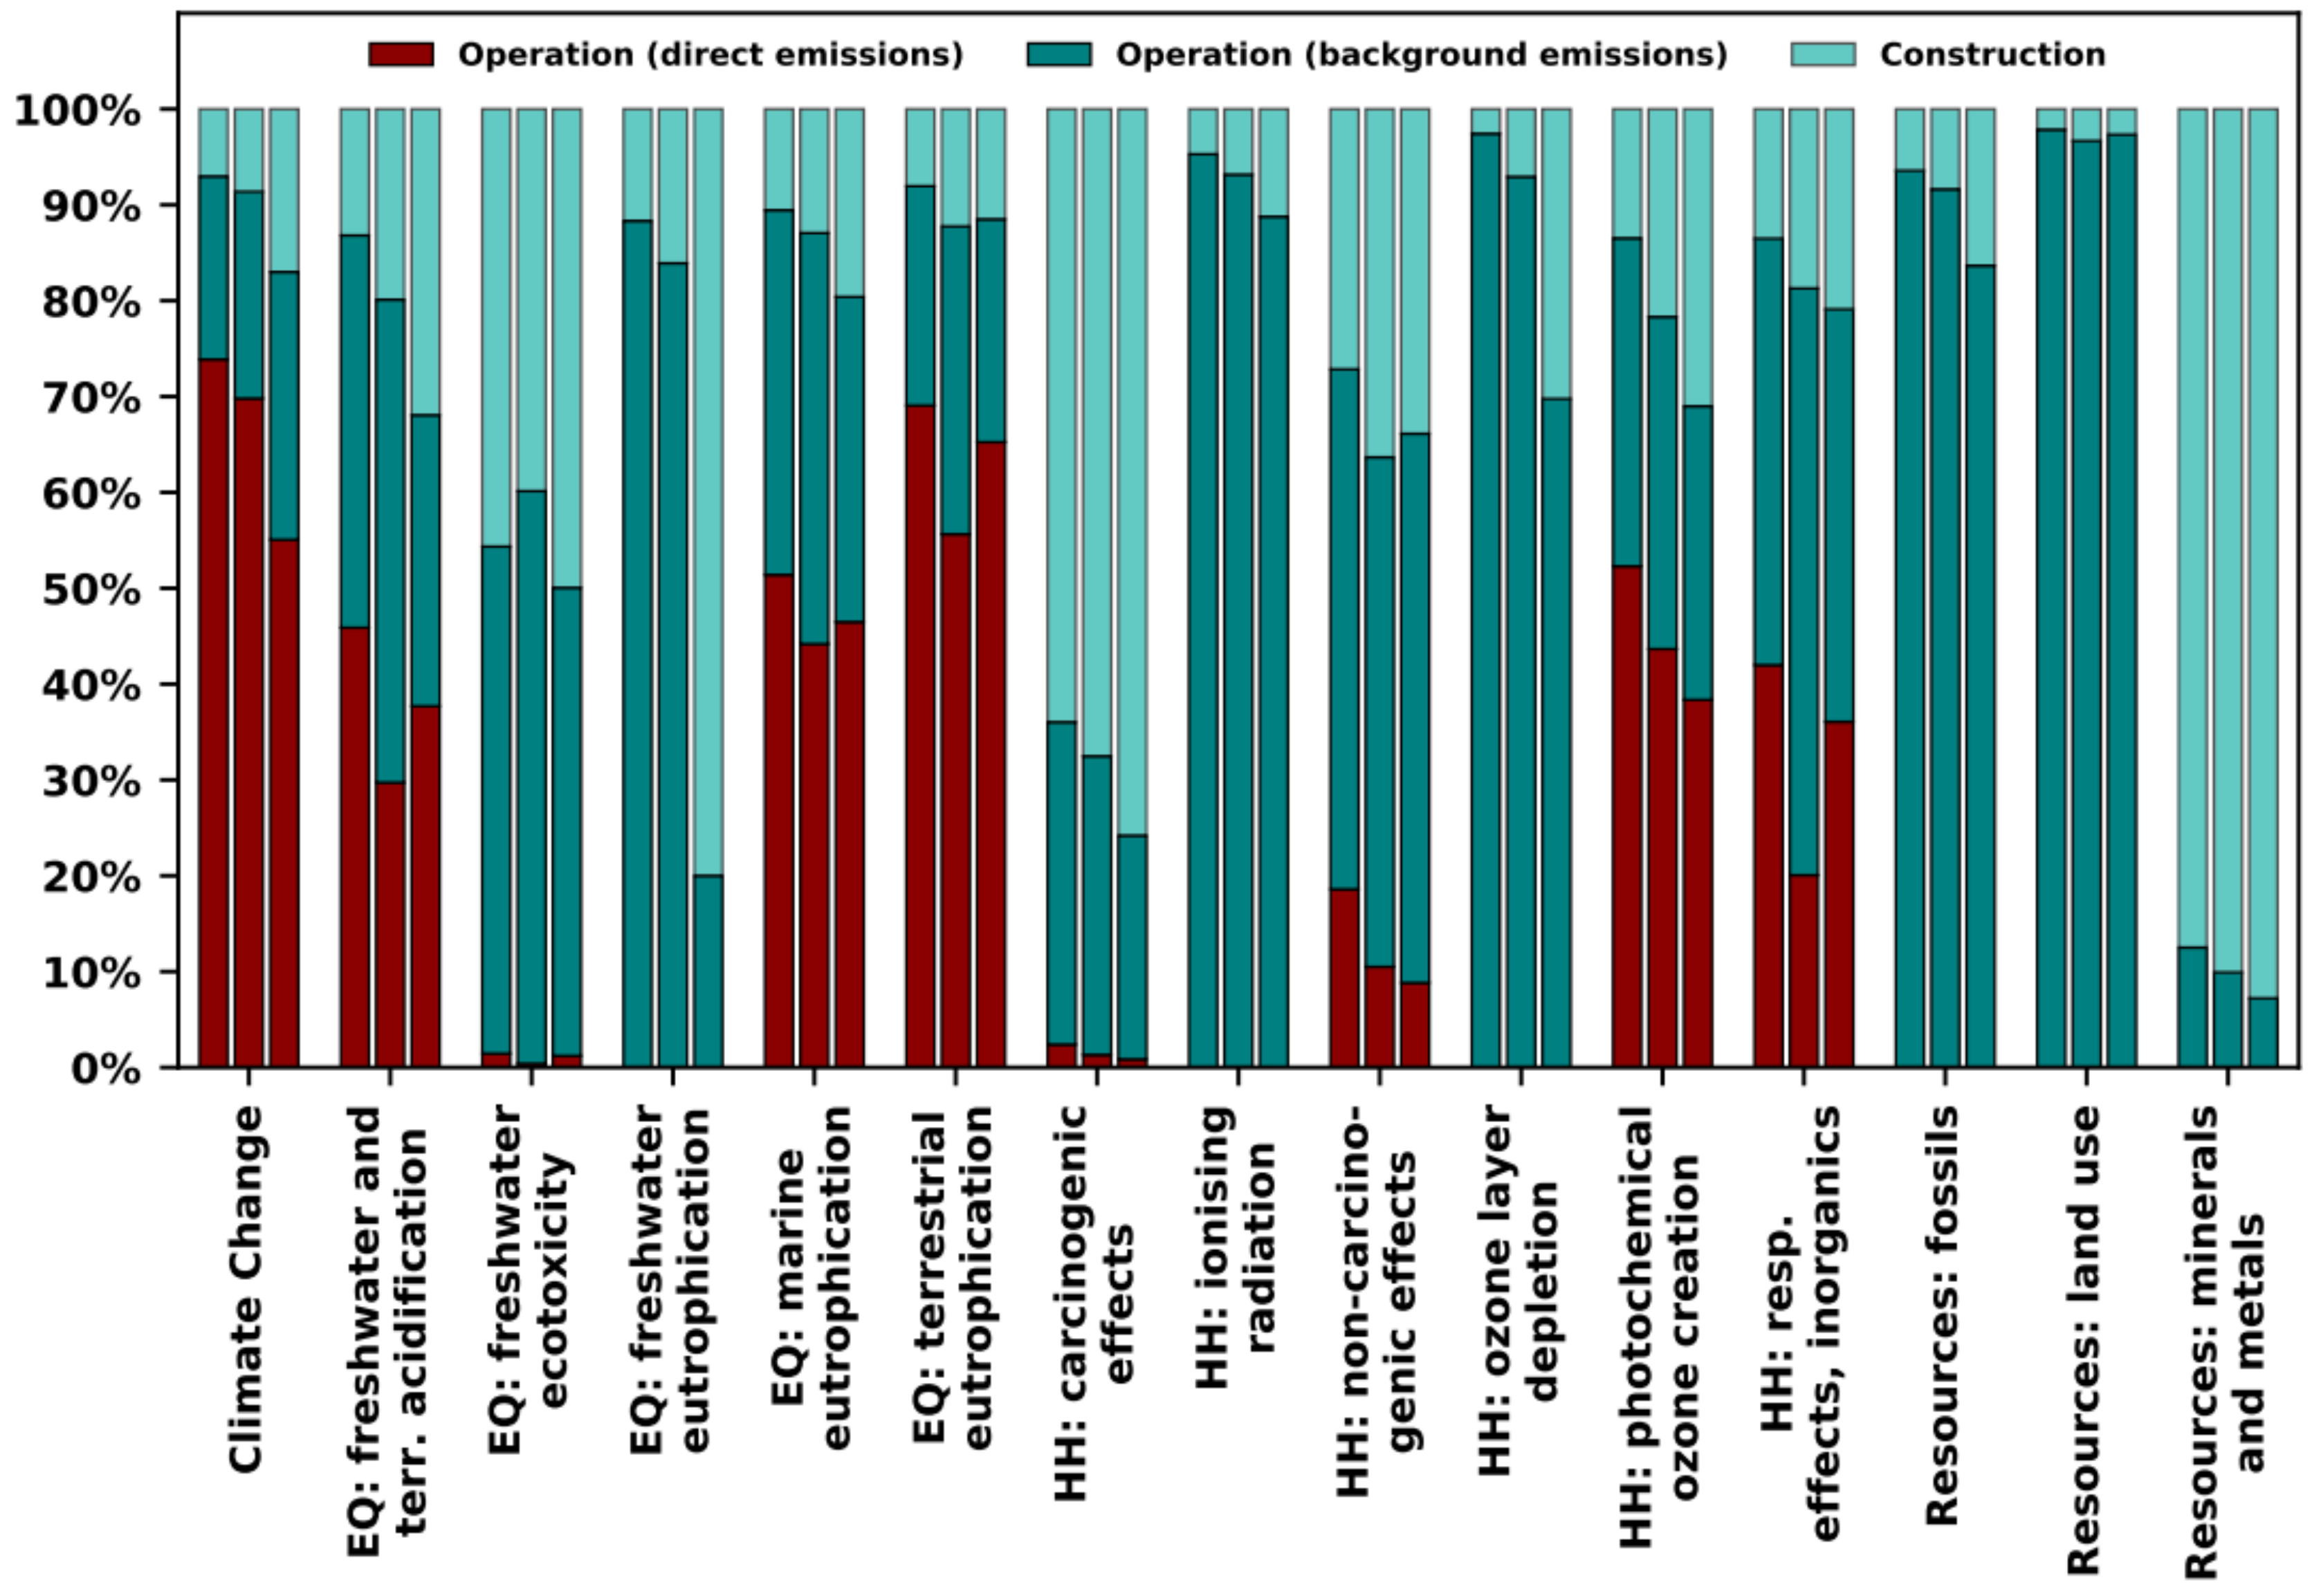
3.3. Influence of Different Life Cycle Phases

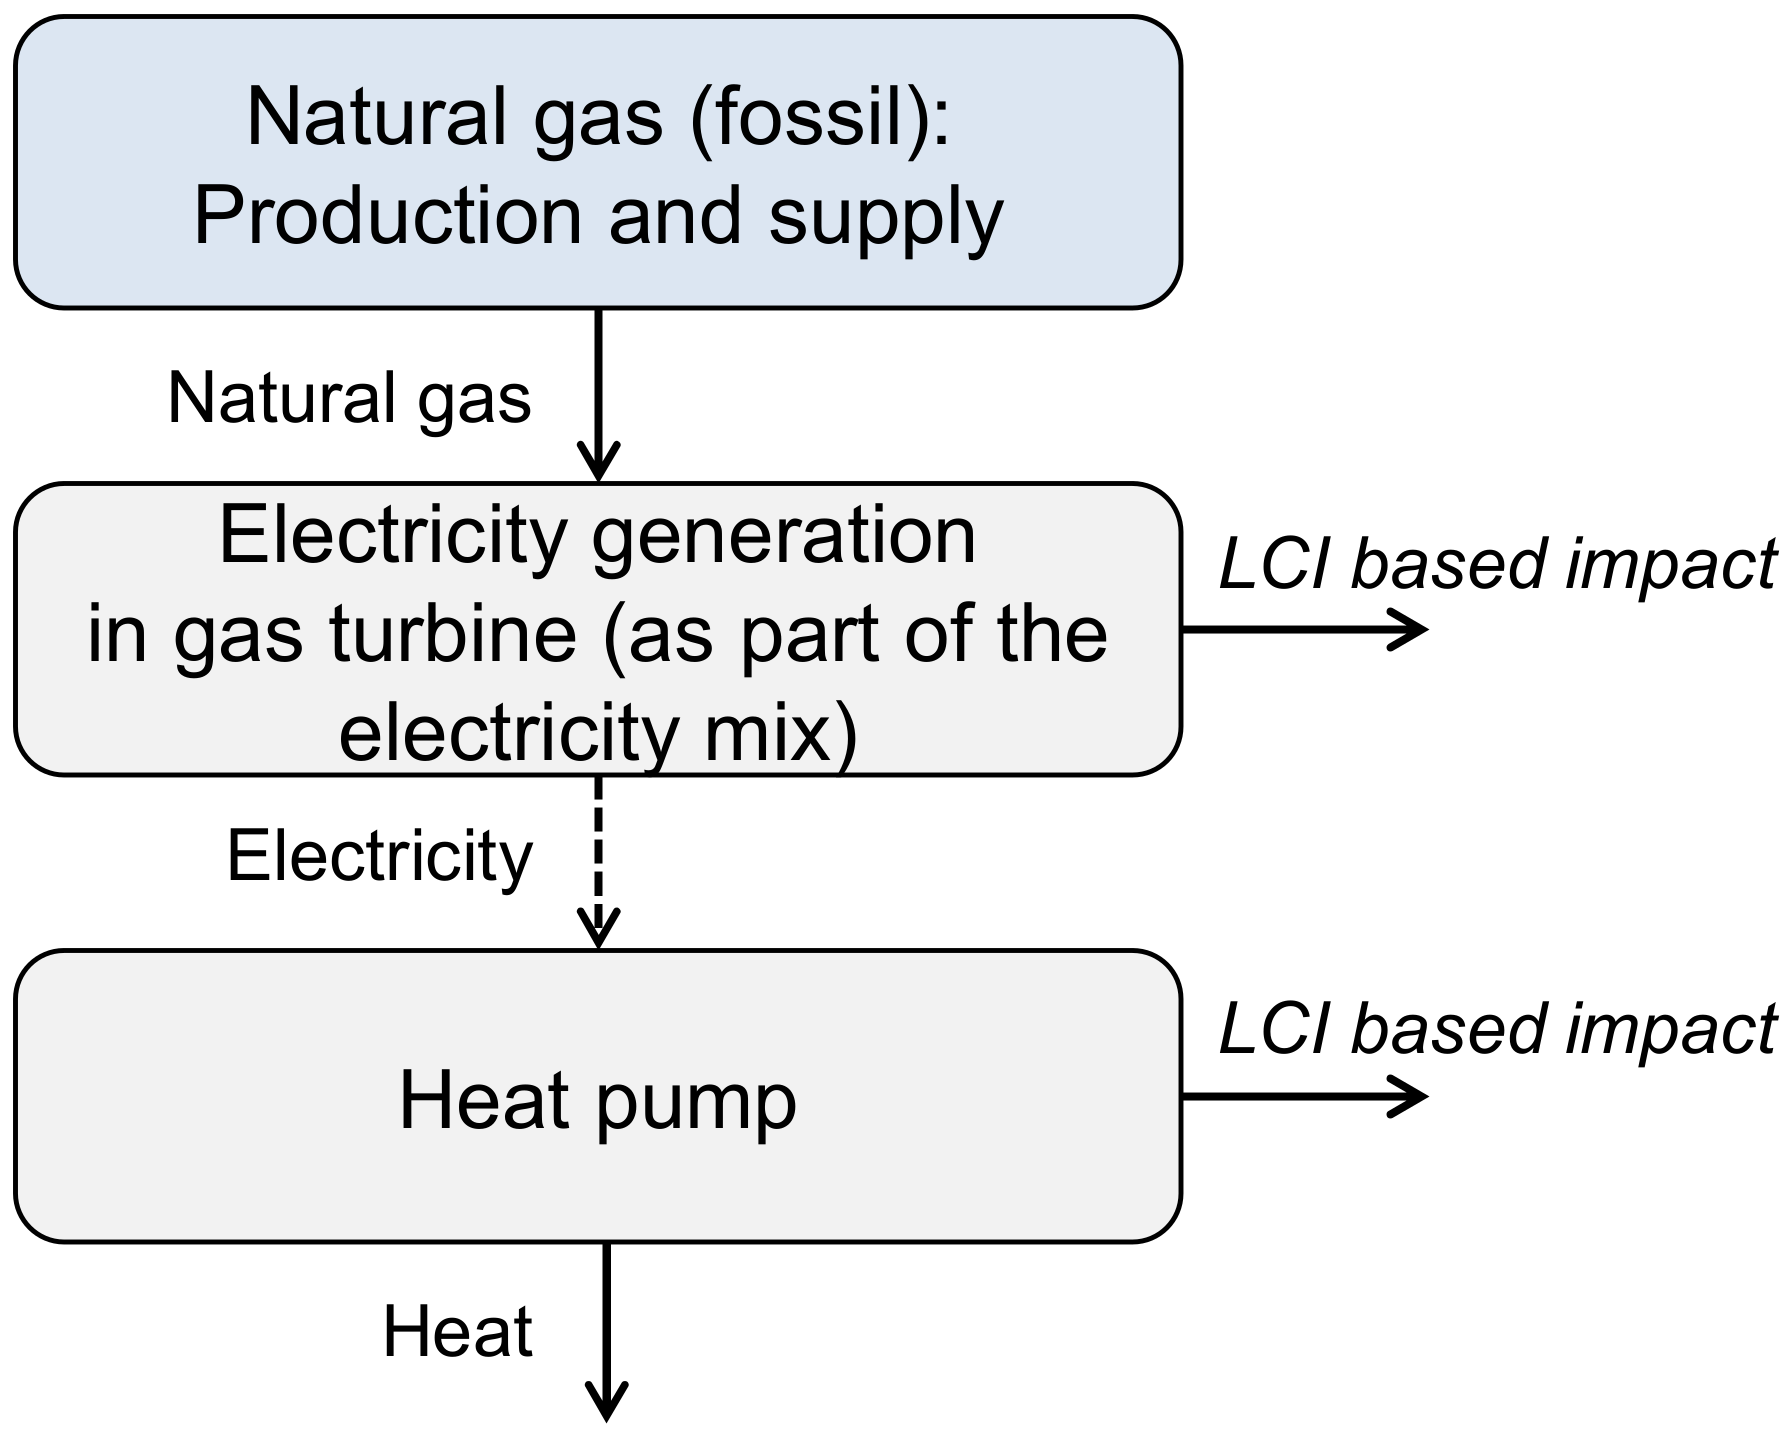
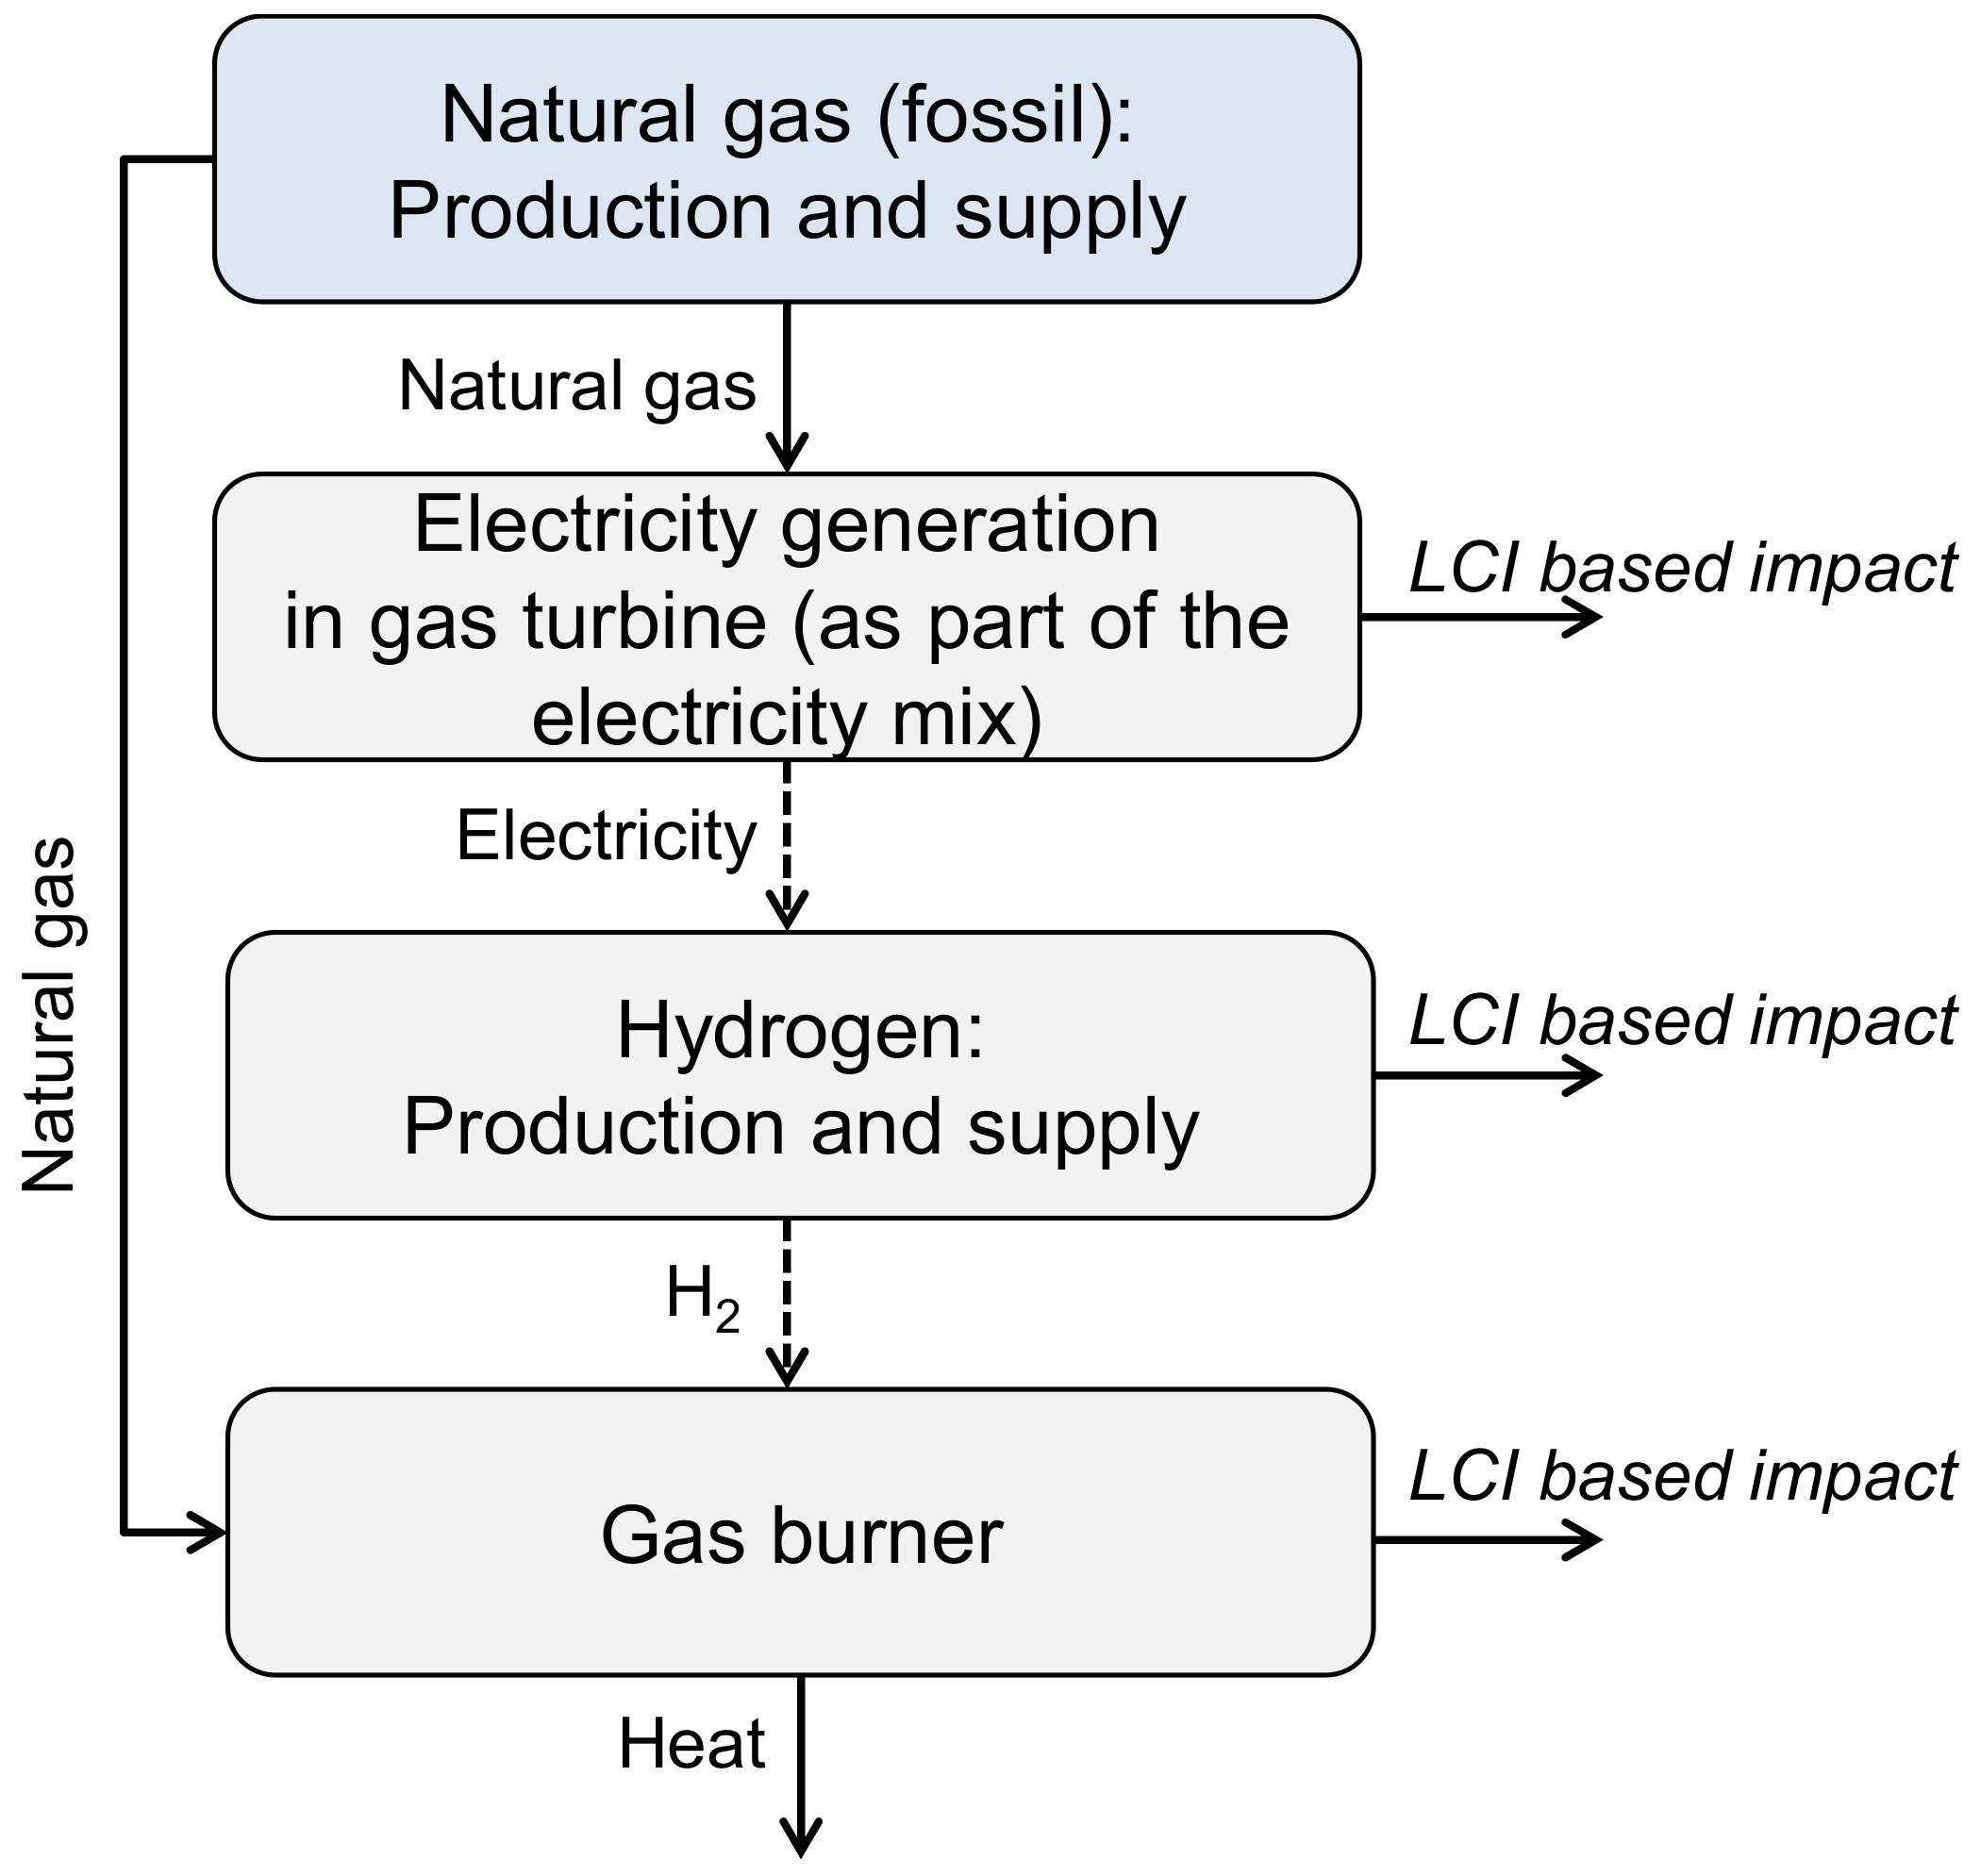
To analyse the influence of different life cycle phases in this section, the operation phase is subdivided into direct impacts of the foreground technologies (i.e., direct, on-site operation-dependent emissions) and indirect impacts occurring outside the system boundary of the ESM (e.g., impacts from the production and supply of natural gas). The impacts of the operation that stem from upstream processes are calculated as the difference between the total life cycle impacts of the operation and the direct emissions.
Figure 11 shows the relative contribution of these phases for each impact category considered for 2015 (first bar) and for the ‘Reference’ (second bar) and the ‘Target’ (third bar) scenarios in 2050. In general, in can be observed that the relative shares of those life cycle phases vary strongly between the different indicators. They also vary, albeit to a lesser extent, in the time between scenarios.
Direct emissions play the dominant role (>50% of absolute impacts) for four out of fifteen indicators in 2015 (‘climate change’, ‘marine eutrophication’, ‘terrestrial eutrophication’, ‘photochemical ozone creation’). For most of these indicators, however, there is a shift in the relevance of the life cycle phases towards the construction of energy technologies. In 2050, direct emissions account for an increasingly small proportion of total impacts in most of these impact categories.
For example, the share of direct CO2 eq emissions in the ‘Target’ scenario is reduced from 73% in 2015 to 56% in 2050. The limited shift of the LCA phases for ‘terrestrial eutrophication’ can be explained by the fact that road freight and passenger transport as well as the bioenergy conversion sector, which emit most of NH3, NO3 and NOx, do so at a relatively similar share in 2015 and in 2050 in both scenarios. Especially in the ‘Target’ scenario, emissions such as NOx, CH4 and other volatile organic compounds that contribute to ‘photochemical ozone creation’ are slightly shifted to the construction phase of the energy technologies, especially in road passenger transport.
For the three indicators ‘freshwater and terrestrial acidification’, ‘non-carcinogenic effects’ and ‘respiratory effects, inorganics’, the share of direct emissions in total impacts is still above 10% in 2015. On the other hand, for all other indicators, direct emissions make only a small to no contribution (<5%) to total impacts. This is the case in all ‘resources’ type impact categories and for some impact categories that address ‘human health’ as well as ‘ecosystem quality’. Here the effects either occur mostly in the construction phase of the energy technologies or in processes upstream of the operation phase.
This analysis shows that solely considering direct impacts during the operation phase significantly underestimates the total environmental impacts of the energy system. However, the amount of underestimation depends strongly on the respective indicator and on the configuration of the energy system itself, but is expected to become increasingly relevant as scenarios become more ambitious in terms of climate protection.

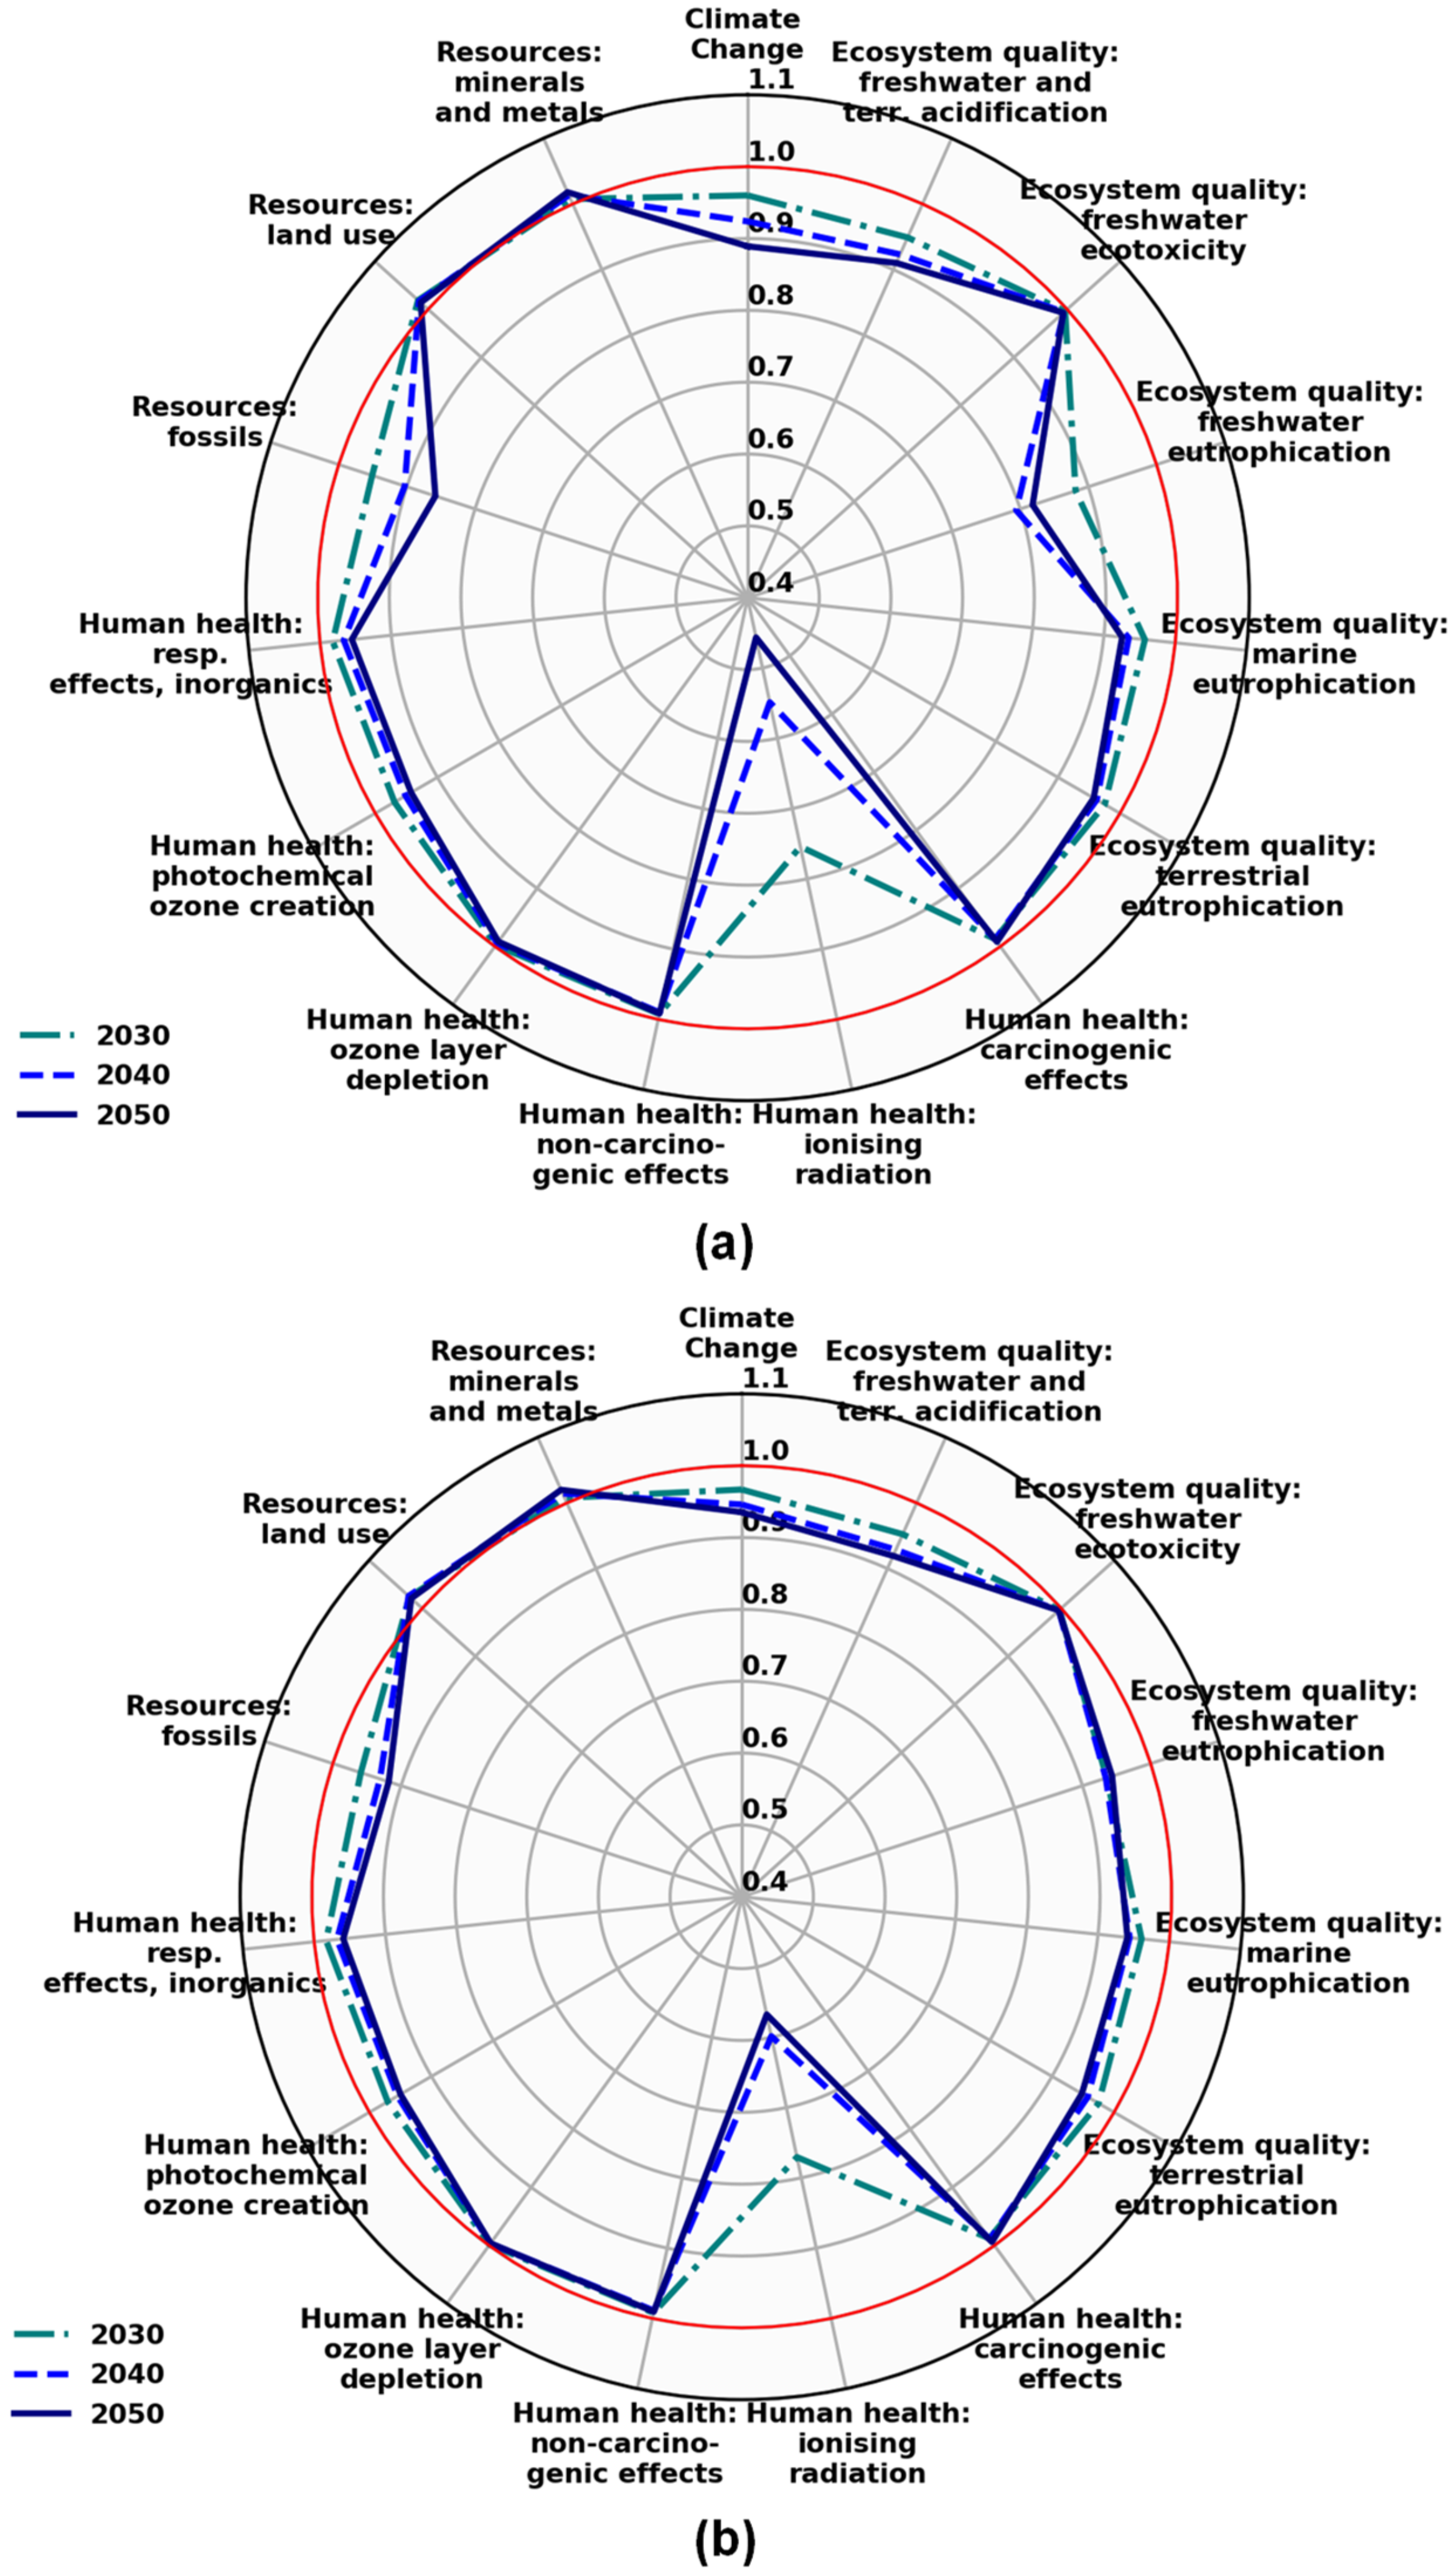
3.4. Influence of the Global Background Electricity Mix on the Scenarios

Figure 12 shows the influence of the global background electricity mix of the 2 °C scenario relative to the 5 °C scenario from Teske et al. [2] on the indicator values of the ‘Target’ (Figure 12a) and the ‘Reference’ (Figure 12b) scenarios. The influence of the global background electricity mix on the individual indicators varies in its extent between the ‘Target’ and the ‘Reference’ scenario, as the electricity intensity of all upstream processes (in construction and operation) differs for the processes and technologies relevant in the scenarios. As illustrated in Figure 11, the construction phase is more dominant in the ‘Target’ scenario than in the ‘Reference’ scenario. Thus, there is a more pronounced influence on the former (Figure 12a). For most indicators, the influence increases with the development of the transformation of the global electricity mix towards deeper defossilisation.
In the ‘Target’ scenario, the effect of the background scenario is largest (>10%) for the indicators ‘climate change’, ‘fossils’, ‘freshwater eutrophication’ and ‘ionizing radiation’, whereas in the ‘Reference’ scenario this effect occurs only for the latter. For the indicator ‘freshwater eutrophication’, the positive effect in the 2 °C scenario in 2050 weakens somewhat again (especially visible in the ‘Target’ scenario), since the Si-based open ground and roof-top PV systems increasingly deployed in the 2 °C scenario show relatively high values for this indicator compared to other conventional power plants more dominant in 2040 (e.g., gas-fired power plants). The strongest effect can be seen for the indicator ‘ionising radiation’, as the 2 °C background scenario, in contrast to the 5 °C background scenario, phases out the use of nuclear and coal-fired power plants, the strongest sources of ionising radiation in power generation. A detailed sectoral and technological analysis of the effect of the background power mix on environmental impacts is subject to future assessments.
In general, the influence of the background electricity mix on the foreground scenario is particularly relevant for scenarios that are more ambitious in terms of CO2 emission reduction and thus have a high proportion of impacts embedded in upstream processes, especially in the construction of the necessary infrastructure. This will be even more relevant for scenarios with CO2 targets on direct emissions beyond a 95% reduction, which are increasingly relevant in the community.

4. Discussion

4.1. Uncertainties Regarding Life Cycle Inventory Data

In line with most previous literature (see Section 1), the ecoinvent database provides most of the LCIs used for this study. The coverage of technologies in ecoinvent 3.3 is good for the electricity sector, although rather limited for non-electricity technologies from the conversion sector (e.g., biofuels, synthetic fuels), transport sector (e.g., BEVs and FCEVs as well as PHEVs) and heat sectors (e.g., industrial heat pumps and solar collectors) and not always fitted to German technologies. In FRITS, some of these shortcomings have been corrected in terms of the level of detail, novelty and completeness of technologies, for example by incorporating LCIs from e.g., BioenergieDat, the SYSEET project, more recent PV data and so far missing technologies such as state of the art electrolysers and heat pumps. In the processes of the bioenergy conversion sector, however, there is still an under-representation of the LCIs on secondary biomass (e.g., biowaste).
Some technologies from the supplemented database had to be assigned to technologies from the model, although their properties do not fully match with respect to the process/technology itself or its scale (e.g., performance class). Future steps will therefore evolve from the best possible completion of technologies in the ESM towards a better harmonization and representation. In some cases, only a single LCI data set is available per technology class, but in reality the system is described by many different subtechnologies for which differentiated LCIs are favorable for future studies.
The LCIs are based on current technologies and future technological developments are considered by adjusting the energy efficiencies (see Section 2.3.4). However, it can be expected that emission factors will change for existing technologies, e.g., due to increased partial load operation or updated emission control systems. Also, for future technologies with different fuel inputs (e.g., biogas in Otto engines) the database has to be extended by respective inventories. Furthermore, material inputs may evolve over time. In future studies, this must be countered either by a further integration of LCIs from the secondary literature that describe a prospective development of the technology under consideration or by the inclusion of generally valid learning curve models (similar to economic learning curve models) to enable the inclusion of material efficiency improvements in existing LCIs and background production processes.
Future global changes in production schemes in the background database were adapted for the electricity mix, which appears to be more relevant as the degree of ambition of the foreground scenario increases and the background becomes increasingly defossilised. Yet, it is to be expected that heat and transport mixes as well as industrial and material extraction processes will also change fundamentally if a defossilisation of the entire energy system is to be achieved.

4.2. Methodological Limitations

Due to the regional structure of the LCI database, it is not possible to distinguish which operation-dependent (indirect) and infrastructure processes and their environmental impacts can be assigned to the geographical system boundary of the ESM (in this case Germany). Further regionalisation of the background database would help to assign processes and impacts to specific regions and would facilitate the inclusion of region-specific scenarios for sectors such as heat and transport. However, this requires not only an adaption in the structure of the database such as the introduction of regionally differentiated markets (e.g., for heat and transport) but also the integration of new LCIs of future relevant processes and scenarios regarding their deployment.
Higher regionalisation of the background database would also have the advantage that double counting and thus the overestimation of environmental impacts at the level of the overall scenario could be better avoided, since the regions considered in the model and the processes depicted in it could be better identified and deleted from the LCI database before the impacts are calculated. The overestimation of impacts due to double counting increases with the inclusion of more sectors (e.g., next to electricity also heat, transport, etc.) and regions (e.g., worldwide) in the ESM. In future studies, input-output tables could be used in order to obtain information on country-specific international trade flows, which in turn could be integrated into LCI databases to increase the regional resolution (e.g., of material, heat and transport supply).
However, such adaptions of the background database are difficult to operationalise with the current software tools. Thus matrix-based approaches, such as those presented in Mendoza Beltran et al. [42], Vandepaer et al. [43] or Fernández Astudillo et al. [6], are becoming increasingly relevant, which also meet the transparency criteria proclaimed by parts of the research community [44,45].
The models used to derive the indicators of the ILCD method are subject to regular quality assessment [39]. While the quality of the indicators ‘climate change’ and ‘respiratory effects, inorganics’ analysed in Section 4.1 is considered to be high, the implications of the indicator ‘minerals and metals’ (next to others) must be treated with great caution. This is because the characterisation factors for each metal are derived from the ratio of annual production to reserves, which fluctuate over time as they are defined by economic considerations not directly related to the depletion problem [46].
Apart from the uncertainty of specific indicators, the linearised approach of the LCIA methods cannot take into account scale variations of impacts, e.g., due to saturation or threshold effects or interactions between different environmental impacts. These issues are partly addressed by the current work of the LCI initiative to improve the LCIA by incorporating further environmental aspects and using harmonised environmental models [47]. Furthermore, impacts are subject to spatial variability, which argues for the use of a spatially differentiated database and regionalized impact assessment methods.
A thorough assessment of all the uncertainties of the assessment stemming from various sources, however, is far beyond the scope of this study. Nevertheless, these aspects point the way for the future development of FRITS.

5. Conclusions and Outlook

The coupling of LCA-based indicators with ESMs enriches the impact assessment of the long-term transformation of energy systems initiated by climate policy. FRITS can provide policy makers and stakeholders with additional information on environmental co-benefits and adverse side effects usually not covered by ESMs. Since it is possible to consider the entire energy system and not only individual energy sectors, the results give a comprehensive picture of the environmental impacts of transformation pathways and can also provide input for subsequent MCDM approaches. FRITS is, in particular, well suited for the assessment of very ambitious climate protection strategies that are characterised by a high share of sector coupling and a prominent role of synthetic gases and fuels for (seasonal) energy storage and the defossilisation of transport and (process) heat. FRITS is transferable to other ESMs that have a different technological and regional scope than the MESAP model used in this paper. It can thus be the basis for future assessments of various mitigation strategies.
The results of the case study show that the ambitious climate protection pathway represented by the ‘Target’ scenario results in a decrease of environmental impacts relative to 2015 and in comparison to the ‘Reference’ scenario for most indicators. However, the ‘Target’ scenario is associated with a significant increase in material and land use and aggravates some human health and ecosystem related impacts. The most controversial picture emerges for the bioenergy conversion sector as it contributes significantly to the adverse side effects but also to the co-benefits of the ‘Target’ scenario compared to 2015 and to the ‘Reference’ scenario. The electricity sector accounts for a large consumption of mineral resources but is also one of the main drivers for most of the co-benefits. In absolute terms, road transport (passenger and freight transport) might become the largest source of environmental impacts in the future.
Most of the environmental impacts lie outside the typical system boundaries of ESMs, i.e., they cannot be assessed by the consideration of direct emissions from the energy and transport system alone. Thus, the life cycle perspective is highly important in order to assess all relevant environmental impacts and to disclose the risk of burden shifting to other sectors or regions.
The case study presented here mainly discusses results at indicator and sector level. Future assessments could also be conducted at a deeper technological level for individual life cycle phases and specific indicators and elementary flows. This allows for the detection of environmental hot spots on technology level, to identify needs for action with respect to research and development for individual energy and transport technologies and for regulation measures. However, this type of assessment is still in its beginnings and is subject to high uncertainties. The necessary efforts go beyond the mere integration of new, prospective LCIs. They require the integration of comprehensive scenarios into background databases considering not only future electricity, heat and transport processes, but also future developments in industrial and raw material extraction processes. In general, an open database and platform for coupling ESMs to LCA and vice versa, the integration of results from ESMs into LCAs would greatly facilitate the exploitation of the benefits of combining both methods.
In order to derive increasingly robust, scientifically sound decision support for a sustainable transformation of the energy system, future versions of FRITS will integrate further adaptions of the background database and improvements of the quality of LCIs that represent the foreground technologies.

Supplementary Materials

The Excel supplement available online at https://www.mdpi.com/2071-1050/12/19/8225/s1 contains the following Tables: Table S1: ‘Product systems’, Table S2: ‘Fuel shares’, Table S3: ‘Assignment to ESM techs’, Table S4: ‘Background electricity mixes’.

Author Contributions

Conceptualization, T.J., T.N. and S.S.; methodology, T.J. and T.N.; software, T.N. and T.J.; formal analysis, T.J.; investigation, T.J., S.S. and J.B.; data curation, T.J., S.S. J.B., T.N. and M.S.; writing—original draft preparation, T.J.; writing—review and editing, T.J., T.N., S.S., J.B., M.B., M.H. and C.W.; visualization, T.J. and T.N. All authors have read and agreed to the published version of the manuscript.

Funding

This work has been partly funded by the Helmholtz Initiative ‘EnergieSystem 2050’.

Acknowledgments

The authors would like to thank Petra Zapp (FZJ-STE) and Marcel Weil (KIT ITAS) for many fruitful discussions. Furthermore, we would like to thank Heidi Hottenroth (INEC) for providing the updated PV datasets. Manuel Baumann acknowledges the Networking Fund of the Helmholtz Association within the Network of Excellence on post-Lithium batteries (ExNet-0035), and Deutsche Forschungsgemeinschaft (422053626).

Conflicts of Interest

The authors declare no conflict of interest.

Appendix A. Adaption of the Background Database and Technology Selection

The ecoinvent database distinguishes processes in transformation activities and markets (consumption mixes). The aggregation of activities in markets simplifies the identification and modification of relevant parameters such as the shares of technologies that provide the same output in a given geographical region. In this study, the electricity markets are manipulated, most of which are at country level or higher such as provinces (see Treyer and Bauer [48] for more information on the electricity markets in ecoinvent v3). The markets for different regions in ecoinvent are first assigned to regions of the scenario (Table A1).
PV technologies in ecoinvent supply electricity at the low-voltage level. For our study, we instead connect PV to the high-voltage level market to properly integrate it in the markets. Furthermore, an equal share of open-ground and rooftop PV in all regions is assumed, since the scenario does not differentiate between the two types. The transmission grid markets and the emissions generated during transmission have not been adjusted and kept at the original level of the inventory data. Power generation technologies that are relevant in the future according to the scenario but are missing in ecoinvent are added to the database’s electricity markets. This includes, in particular, concentrated solar power (included from ecoinvent v3.5 and adapted for v3.3) and the use of hydrogen in gas turbines. Data sets for other technologies, e.g., ocean energy, which are missing in ecoinvent and have little relevance in the scenario, are not integrated into the database.
Table A1. Matching of scenario regions to market regions in the ecoinvent database.
Scenario RegionCorresponding Regions of the Electricity Markets in Ecoinvent v3.3
AfricaZA, TZ
ChinaCN-GD, CN-GX, CN-GZ, CN-HA, CN-YN, CN-ZJ, CN-AH, CN-BJ, CN-CQ, CN-FJ, CN-GS, CN-HB, CN-HE, CN-HL, CN-HN, CN-HU, CN-JL, CN-JS, CN-JX, CN-LN, CN-NM, CN-NX, CN-QH, CN-SA, CN-SC, CN-SD, CN-SH, CN-SX, CN-TJ, CN-XJ, CN-XZ, CN-ZJ
EurasiaBA, BG, CY, HR, LT, LV, MK, MT, RO, RS, RU, SI, UA
IndiaIN
Latin AmericaBR, CL, PE
Middle EastIR, SA
OECD EuropeAT, BE, CH, CZ, DK, EE, ES, FI, FR, GB, GR, HU, IE, IS, IT, LU, NL, NO, PL, PT, SE, SK, TR
OECD North AmericaCA-AB, CA-BC, CA-MB, CA-NB, CA-NF, CA-NS, CA-NT, CA-NU, CA-ON, CA-PE, CA-QC, CA-SK, CA-YK, MX, ASCC, FRCC, HICC, MRO, TRE, WECC, NPCC, SPP, RFC, SERC
OECD PacificAU, JP, KR
Other AsiaID, MY, TH, TW
In a next step, the detailed subtechnologies (e.g., different size classes of onshore wind turbines) of the database have to be mapped to a technology class (e.g., wind onshore) of the global scenario. If all the markets assigned to a scenario region (see Table A1) contain more than three technologies of a group (e.g., lignite power plant), the number of technologies selected is limited to a maximum of three of the same type. This selection is based on the amount of electricity produced annually in the individual markets documented in the ecoinvent database, multiplied by the share of electricity produced by these technologies in these markets. While three are selected to consider inner-regional differences (e.g., in full load hours, emission factors, sub-technology types) within a technology class, the method is open to more representative data sets for a region. If there is no specific technology in the markets assigned to the scenario region, the corresponding Rest-of-the-World (RoW) data set is used as proxy (see Table S4 in the supplementary material for the documentation of the specific technologies per scenario region and the electricity production shares). The markets are parameterized for the scenario years 2015, 2020, 2030, 2040 and 2050. The resulting LCA impacts for the (foreground) technologies between those years are obtained using linear interpolation.

References

  1. UNFCCC. Adoption of the Paris Agreement; United Nations Framework Convention on Climate Change: Paris, France, 2015. [Google Scholar]
  2. Teske, S. Achieving the Paris Climate Agreement Goals; Springer Science and Business Media: Luxemburg, 2019. [Google Scholar]
  3. Pauliuk, S.; Arvesen, A.; Stadler, K.; Hertwich, E.G. Industrial ecology in integrated assessment models. Nat. Clim. Chang. 2017, 7, 13–20. [Google Scholar] [CrossRef]
  4. Xu, L.; Fuss, M.; Poganietz, W.-R.; Jochem, P.; Schreiber, S.; Zoephel, C.; Brown, N. An Environmental Assessment Framework for Energy System Analysis (EAFESA): The method and its application to the European energy system transformation. J. Clean. Prod. 2020, 243, 118614. [Google Scholar] [CrossRef]
  5. Luderer, G.; Pehl, M.; Arvesen, A.; Gibon, T.; Bodirsky, B.L.; De Boer, H.S.; Fricko, O.; Hejazi, M.; Humpenöder, F.; Iyer, G.; et al. Environmental co-benefits and adverse side-effects of alternative power sector decarbonization strategies. Nat. Commun. 2019, 10, 5229. [Google Scholar] [CrossRef] [PubMed] [Green Version]
  6. Astudillo, M.F.; Vaillancourt, K.; Pineau, P.-O.; Amor, B. Human Health and Ecosystem Impacts of Deep Decarbonization of the Energy System. Environ. Sci. Technol. 2019, 53, 14054–14062. [Google Scholar] [CrossRef]
  7. Volkart, K.; Mutel, C.; Panos, E. Integrating life cycle assessment and energy system modelling: Methodology and application to the world energy scenarios. Sustain. Prod. Consum. 2018, 16, 121–133. [Google Scholar] [CrossRef]
  8. Pehl, M.; Arvesen, A.; Humpenöder, F.; Popp, A.; Hertwich, E.G.; Luderer, G. Understanding future emissions from low-carbon power systems by integration of life-cycle assessment and integrated energy modelling. Nat. Energy 2017, 2, 939–945. [Google Scholar] [CrossRef]
  9. Santos, M.; Ferreira, P.; Araújo, M.; Portugal-Pereira, J.; Lucena, A.; Schaeffer, R. Scenarios for the future Brazilian power sector based on a multi-criteria assessment. J. Clean. Prod. 2017, 167, 938–950. [Google Scholar] [CrossRef]
  10. García-Gusano, D.; Garraín, D.; Dufour, J. Prospective life cycle assessment of the Spanish electricity production. Renew. Sustain. Energy Rev. 2017, 75, 21–34. [Google Scholar] [CrossRef]
  11. Volkart, K.; Weidmann, N.; Bauer, C.; Hirschberg, S. Multi-criteria decision analysis of energy system transformation pathways: A case study for Switzerland. Energy Policy 2017, 106, 155–168. [Google Scholar] [CrossRef]
  12. García-Gusano, D.; Iribarren, D.; Martín-Gamboa, M.; Dufour, J.; Espegren, K.; Lind, A. Integration of life-cycle indicators into energy optimisation models: The case study of power generation in Norway. J. Clean. Prod. 2016, 112, 2693–2696. [Google Scholar] [CrossRef] [Green Version]
  13. Shmelev, S.; Bergh, J.V.D. Optimal diversity of renewable energy alternatives under multiple criteria: An application to the UK. Renew. Sustain. Energy Rev. 2016, 60, 679–691. [Google Scholar] [CrossRef]
  14. Sokka, L.; Sinkko, T.; Holma, A.; Manninen, K.; Pasanen, K.; Rantala, M.; Leskinen, P. Environmental impacts of the national renewable energy targets—A case study from Finland. Renew. Sustain. Energy Rev. 2016, 59, 1599–1610. [Google Scholar] [CrossRef]
  15. Berrill, P.; Arvesen, A.; Scholz, Y.; Gils, H.C.; Hertwich, E.G. Environmental impacts of high penetration renewable energy scenarios for Europe. Environ. Res. Lett. 2016, 11, 14012. [Google Scholar] [CrossRef]
  16. Menten, F.; Tchung-Ming, S.; Lorne, D.; Bouvart, F. Lessons from the use of a long-term energy model for consequential life cycle assessment: The BTL case. Renew. Sustain. Energy Rev. 2015, 43, 942–960. [Google Scholar] [CrossRef] [Green Version]
  17. Igos, E.; Rugani, B.; Rege, S.; Benetto, E.; Drouet, L.; Zachary, D.S. Combination of equilibrium models and hybrid life cycle - input–output analysis to predict the environmental impacts of energy policy scenarios. Appl. Energy 2015, 145, 234–245. [Google Scholar] [CrossRef] [Green Version]
  18. Hertwich, E.G.; Gibon, T.; Bouman, E.A.; Arvesen, A.; Suh, S.; Heath, G.A.; Bergesen, J.D.; Ramírez, C.; Vega, M.I.; Shi, L. Integrated life-cycle assessment of electricity-supply scenarios confirms global environmental benefit of low-carbon technologies. Proc. Natl. Acad. Sci. USA 2014, 112, 6277–6282. [Google Scholar] [CrossRef] [Green Version]
  19. Kouloumpis, V.; Stamford, L.; Azapagic, A. Decarbonising electricity supply: Is climate change mitigation going to be carried out at the expense of other environmental impacts? Sustain. Prod. Consum. 2015, 1, 1–21. [Google Scholar] [CrossRef]
  20. Pereira, J.P.; Parady, G.; Castro-Dominguez, B. Japan’s energy conundrum: Post-Fukushima scenarios from a life cycle perspective. Energy Policy 2014, 67, 104–115. [Google Scholar] [CrossRef]
  21. Hammond, G.P.; Howard, H.R.; Jones, C.I. The energy and environmental implications of UK more electric transition pathways: A whole systems perspective. Energy Policy 2013, 52, 103–116. [Google Scholar] [CrossRef]
  22. Iribarren, D.; Iribarren, D. Prospective energy security scenarios in Spain: The future role of renewable power generation technologies and climate change implications. Renew. Energy 2018, 126, 202–209. [Google Scholar]
  23. Jacobson, M.Z.; Delucchi, M.A.; Bauer, Z.A.; Goodman, S.C.; Chapman, W.E.; Cameron, M.A.; Bozonnat, C.; Chobadi, L.; Clonts, H.A.; Enevoldsen, P.; et al. 100% Clean and Renewable Wind, Water, and Sunlight All-Sector Energy Roadmaps for 139 Countries of the World. Joule 2017, 1, 108–121. [Google Scholar] [CrossRef] [Green Version]
  24. Ram, M.; Bogdanov, D.; Aghahosseini, A.; Gulagi, A.; Oyewo, A.S.; Child, M.; Caldera, U.; Sadovskaia, K.; Farfan, J.; Barbosa, L.S.N.S.; et al. Global Energy System based on 100% Renewable Energy—Power, Heat, Transport and Desalination Sectors; Lappeenranta University of Technology and Energy Watch Group: Lappeenranta, Berlin, Germany, 2019. [Google Scholar]
  25. BMWi. Energiekonzept Für eine Umweltschonende, Zuverlässige und Bezahlbare Energieversorgung. Available online: https://www.bmwi.de/Redaktion/DE/Downloads/E/energiekonzept-2010.pdf?__blob=publicationFile&v=5 (accessed on 25 October 2010).
  26. Schlenzig, C. Energy planning and environmental management with the information and decision support system MESAP. Int. J. Glob. Energy Issues 1999, 12, 81. [Google Scholar] [CrossRef]
  27. Teske, S.; Sawyer, S.; Schäfer, O.; Pregger, T.; Simon, S.; Naegler, T.; Schmid, S.; Özdemir, E.D.; Pagenkopf, J.; Kleiner, F.; et al. Energy [R]evolution—A Sustainable World Energy Outlook 2015; Greenpeace International: Amsterdam, The Netherlands, 2015. [Google Scholar]
  28. Simon, S.; Naegler, T.; Gils, H.C. Transformation towards a Renewable Energy System in Brazil and Mexico—Technological and Structural Options for Latin America. Energies 2018, 11, 907. [Google Scholar] [CrossRef] [Green Version]
  29. Gils, H.C.; Simon, S.; Soria, R. 100% Renewable Energy Supply for Brazil—The Role of Sector Coupling and Regional Development. Energies 2017, 10, 1859. [Google Scholar] [CrossRef] [Green Version]
  30. Pregger, T.; Naegler, T.; Weimer-Jehle, W.; Prehofer, S.; Hauser, W. Moving towards socio-technical scenarios of the German energy transition—lessons learned from integrated energy scenario building. Clim. Chang. 2019, 1–20. [Google Scholar] [CrossRef]
  31. Gils, H.C.; Simon, S. Carbon neutral archipelago—100% renewable energy supply for the Canary Islands. Appl. Energy 2017, 188, 342–355. [Google Scholar] [CrossRef] [Green Version]
  32. Wernet, G.; Bauer, C.; Steubing, B.; Reinhard, J.; Moreno-Ruiz, E.; Weidema, B. The ecoinvent database version 3 (part I): Overview and methodology. Int. J. Life Cycle Assess. 2016, 21, 1218–1230. [Google Scholar] [CrossRef]
  33. Schebek, L.; Biemann, K.; Ciroth, A.; Düpmeier, C.; Eltrop, L.; Simon, S.; Viebahn, P.; Zschunke, T.; Wagner, H.-J. BioEnergieDat—Die OpenSource Datenplatform für BioEnergie in Deutschland. 2013. Available online: https://nexus.openlca.org/database/bioenergiedat (accessed on 19 April 2018).
  34. UVEK LCI Data 2018. Bundesamt für Umwelt BAFU. Available online: https://nexus.openlca.org/database/UVEK%20LCI%20Data (accessed on 23 May 2018).
  35. UBA. Systemvergleich Speicherbarer Energieträger aus Erneuerbaren Energien; Umweltbundesamt: Dessau-Roßlau, Germany, 2020. [Google Scholar]
  36. GreenDelta. 2019. Available online: https://github.com/GreenDelta/olca-ipc.py (accessed on 31 January 2019).
  37. International Energy Agency World Energy Outlook 2017. World Energy Outlook 2017; International Energy Agency: Paris, France, 2017. [Google Scholar]
  38. BMWi. Langfristszenarien für die Transformation des Energiesystems in Deutschland—Modul 3: Referenzszenario und BasisszenarioStudie im Auftrag des Bundesministeriums für Wirtschaft und Energie. Available online: https://www.bmwi.de/Redaktion/DE/Downloads/B/berichtsmodul-3-referenzszenario-und-basisszenario.pdf?__blob=publicationFile&v=4 (accessed on 28 August 2019).
  39. EC-JRC. Supporting information to the characterisation factors of recommended EF Life Cycle Impact Assessment method. 2018. Available online: https://eplca.jrc.ec.europa.eu/permalink/supporting_Information_final.pdf (accessed on 30 August 2019).
  40. Rao, S.; Klimont, Z.; Smith, S.J.; Van Dingenen, R.; Dentener, F.; Bouwman, A.F.; Riahi, K.; Amann, M.; Bodirsky, B.L.; Van Vuuren, D.P.; et al. Future air pollution in the Shared Socio-economic Pathways. Glob. Environ. Chang. 2017, 42, 346–358. [Google Scholar] [CrossRef]
  41. Viebahn, P.; Soukup, O.; Samadi, S.; Teubler, J.; Wiesen, K.; Ritthoff, M. Assessing the need for critical minerals to shift the German energy system towards a high proportion of renewables. Renew. Sustain. Energy Rev. 2015, 49, 655–671. [Google Scholar] [CrossRef] [Green Version]
  42. Beltran, A.M.; Cox, B.; Mutel, C.; Van Vuuren, D.P.; Vivanco, D.F.; Deetman, S.; Edelenbosch, O.; Guinée, J.; Tukker, A. When the Background Matters: Using Scenarios from Integrated Assessment Models in Prospective Life Cycle Assessment. J. Ind. Ecol. 2018, 24, 64–79. [Google Scholar] [CrossRef] [Green Version]
  43. Vandepaer, L.; Panos, E.; Bauer, C.; Amor, B. Energy System Pathways with Low Environmental Impacts and Limited Costs: Minimizing Climate Change Impacts Produces Environmental Cobenefits and Challenges in Toxicity and Metal Depletion Categories. Environ. Sci. Technol. 2020. [Google Scholar] [CrossRef] [PubMed]
  44. Pauliuk, S. Making sustainability science a cumulative effort. Nat. Sustain. 2019, 3, 2–4. [Google Scholar] [CrossRef]
  45. Pauliuk, S.; Majeau-Bettez, G.; Mutel, C.L.; Steubing, B.; Stadler, K. Lifting Industrial Ecology Modeling to a New Level of Quality and Transparency: A Call for More Transparent Publications and a Collaborative Open Source Software Framework. J. Ind. Ecol. 2015, 19, 937–949. [Google Scholar] [CrossRef] [Green Version]
  46. Drielsma, J.A.; Russell-Vaccari, A.J.; Drnek, T.; Brady, T.; Weihed, P.; Mistry, M.; Simbor, L.P. Mineral resources in life cycle impact assessment—defining the path forward. Int. J. Life Cycle Assess. 2015, 21, 85–105. [Google Scholar] [CrossRef] [Green Version]
  47. Jolliet, O.; Antón, A.; Boulay, A.-M.; Cherubini, F.; Fantke, P.; Levasseur, A.; McKone, T.E.; Michelsen, O.; i Canals, L.M.; Motoshita, M.; et al. Global guidance on environmental life cycle impact assessment indicators: Impacts of climate change, fine particulate matter formation, water consumption and land use. Int. J. Life Cycle Assess. 2018, 23, 2189–2207. [Google Scholar] [CrossRef] [Green Version]
  48. Treyer, K.; Bauer, C. Life cycle inventories of electricity generation and power supply in version 3 of the ecoinvent database—part II: Electricity markets. Int. J. Life Cycle Assess. 2014, 21, 1255–1268. [Google Scholar] [CrossRef]
Figure 1. Methodological steps in the FRamework for the assessment of environmental Impacts of Transformation Scenarios (FRITS). The details of each step are described in more detail in the indicated sections.
Sustainability 12 08225 g001
Figure 2. Adaption of life cycle inventory (LCI) data to avoid double counting of impacts in FRITS. Light blue boxes indicate technologies or flows of energy carriers that are not part of the energy system model (ESM). Light grey boxes show technologies or flows of energy carriers that are part of the (foreground) model. Dashed arrows represent flows that are excluded from the original LCI data sets on which the arrow points in order to avoid double counting of impacts.
Sustainability 12 08225 g002
Figure 3. Adaption of LCI data sets in FRITS to model admixtures of fuels that can be produced in the foreground and background system. The specifications of Figure 2 apply.
Sustainability 12 08225 g003
Figure 4. Final energy demand by energy carrier and share of renewable energy sources (RES) in the end-use sectors in the ‘Target’ (a) scenario [30] and the ‘Reference’ (b) scenario [38].
Sustainability 12 08225 g004
Figure 5. Installed capacities in the electricity sector including in the in the ‘Target’ (a) scenario [30] and the ‘Reference’ (b) scenario [38].
Sustainability 12 08225 g005
Figure 6. Ratio of impacts of the ‘Target’ scenario relative to the impacts in 2015. The red line separates adverse side effects (increasing impacts, impact ratio > 1) from co-benefits (decreasing impacts, impact ratio < 1).
Sustainability 12 08225 g006
Figure 7. Ratio of impacts of the ‘Target’ scenario relative to the impacts of the ‘Reference’ scenario. The red line indicates the line of ‘equal impacts’.
Sustainability 12 08225 g007
Figure 8. Main drivers for climate change in the ‘Target’ and ‘Reference’ scenarios. (a) Impact caused by the sub-sectors, (b) Impact caused by the end-use applications.
Sustainability 12 08225 g008
Figure 9. Main drivers for respiratory effects, inorganics in the ‘Target’ and ‘Reference’ scenarios. (a) Impact caused by the sub-sectors, (b) Impact caused by the end-use applications.
Sustainability 12 08225 g009
Figure 10. Main drivers for abiotic resource depletion in the ‘Target’ and ‘Reference’ scenarios. (a) Impact caused by the sub-sectors, (b) Impact caused by the end-use applications.
Sustainability 12 08225 g010
Figure 11. Relative contributions of life cycle phases to total impacts. The first bar chart for each indicator is for the base year 2015, the second and third for the ‘Reference’ and ‘Target’ scenarios, respectively, in 2050.
Sustainability 12 08225 g011
Figure 12. Influence of the global background electricity mix on total environmental impacts in (a) the ‘Target’ and (b) the ‘Reference’ scenario. The figures show the impacts calculated with the 2 °C background scenario relative to impacts calculated with the 5 °C background scenario. The red line indicates the line of ‘equal impacts’.
Sustainability 12 08225 g012
Table 1. Overview of recent studies that carry out environmental ex-post assessments of energy scenarios. The studies are sorted by their publication date (most recent publication on top).
StudyGeographical ScopeTime HorizonSectors AssessedLCI-Database 1Prospectivity of LCI Data 2
ElectricityHeatTransport
Xu et al. [4]Europe2050 Ecoinvent ✓ (F,B)
Luderer et al. [5]World2010–2050 EXIOBASE, Ecoinvent✓ (F,B)
Fernández Astudillo et al. [6]Quebec (Canada)2050Ecoinvent✓ (F)
Volkart et al. [7]World2060Ecoinvent✓ (F)
Pehl et al. [8]World2010–2050 EXIOBASE, Ecoinvent✓ (F,B)
Santos et a al. [9]Brazil2050 Secondary literature
García-Gustano et al. [10]Spain2015–2050 Ecoinvent, secondary literature
Volkart et al. [11] Switzerland2035Ecoinvent✓ (F,B)
García-Gustano et al. [12]Norway2010–2050 Ecoinvent
Shmelev and van den Bergh [13]UK2050 Secondary literature
Sokka et al. [14]Finland2020 Secondary literature
Berrill et al. [15] Europe2050 EXIOBASE, Ecoinvent✓ (F,B)
Menten et al. [16]France2007–2030Ecoinvent
Igos et al. [17]Luxembourg2010–2025 WIOD, Ecoinvent
Hertwich et al. [18]World2015–2050 EXIOBASE, Ecoinvent✓ (F,B)
Kouloumpis et al. [19]UK2010-2070 Ecoinvent✓ (F)
Portugal Pereira et al. [20]Japan2030 GEMIS
Hammond et al. [21]UK1990–2050 Secondary literature
1 ‘Secondary literature’ means that the authors use indicator values from literature without further harmonization of the data. 2 F: Adaptions to future developments (e.g., increasing efficiencies) included for the foreground technologies; B: Adaptions to future developments (e.g., evolving electricity mix) in the background database. LCI: life cycle inventory.
Table 2. Overview of main sectors, sub-sectors and end-use applications that are explicitly considered in the foreground system of MESAP.
Main SectorSub-SectorsEnd-Use Applications
ResidentialSpace Heat (SH)Space Heat (SH)
Hot Water (HW)Hot Water (HW)
Combined Heat and Power Auto-Production (CHP)
Electric Appliances 1
Commerce, Trade and Services Space Heat & Hot Water (SH/HW)Space Heat & Hot Water (SH/HW)
Process Heat (PH)Process Heat (PH)
Combined Heat and Power Auto-Production (CHP)
Electric Appliances 1
IndustrySpace Heat & Hot Water (SH/HW)Space Heat & Hot Water (SH/HW)
Process Heat (PH)Process Heat (PH)
Combined Heat and Power Auto-Production (CHP)
Electric Appliances 1
TransportRoad Passenger TransportRoad Passenger Transport
Road Freight TransportRoad Freight Transport
Rail Transport Rail Transport
NavigationNavigation 2
AviationAviation 2
ConversionPower Plants
CHP (public)
Heating Plants
Synthetic Fuels and Gases 3
Bioenergy Conversion 4
StorageElectricity Storage
Import RES Power Imports
1 All electric appliances except those generating useful heat (e.g., electric heat pumps); 2 domestic only; 3 generation of synthetic gases (H2, CH4) and synthetic fuels (Power-to-Liquid), 4 generation of fuels and gases of biogenic origin (biomass-to-liquid, biogas, biofuels and solid biomass).
Table 3. Overview of the sub-sectors and specifications of the technologies they contain, where the construction is not included in the foreground system.
Sub-SectorsSpecifications of the Technologies
NavigationNavigation (inland shipping)
AviationAirplanes (passenger, freight)
Rail TransportRail transport (passenger, freight)
Road Freight TransportLight and heavy duty vehicles (LDVs, HDVs)
Table 4. Overview of the indicators from the ILCD 2.0 2018 method used in this study.
IndicatorsUnits
Climate change totalkg CO2 eq
Freshwater and terrestrial acidificationmol H+ eq
Freshwater ecotoxicityCTUe
Freshwater eutrophicationkg P eq
Marine eutrophicationkg N eq
Terrestrial eutrophicationmol N eq
Non-carcinogenic and carcinogenic effectsCTUh
Ionising radiationkg U235 eq
Ozone layer depletionkg CFC-11 eq
Photochemical ozone creationkg NMVOC eq
Respiratory effects, inorganicsdisease incidence
FossilsMJ
Land use occupation and transformationpoints
Minerals and metalskg Sb eq

