Article

Deep-Learning-Based Stress-Ratio Prediction Model Using Virtual Reality with Electroencephalography Data

School of Architecture, Hanyang University, Seoul 04763, Korea
*
Author to whom correspondence should be addressed.
Sustainability 2020, 12(17), 6716; https://doi.org/10.3390/su12176716
Submission received: 29 June 2020 / Revised: 5 August 2020 / Accepted: 17 August 2020 / Published: 19 August 2020

Abstract

:
The Reich Chancellery, built by Albert Speer, was designed with an overwhelming ambience to represent the worldview of Hitler. The interior of the Reich Chancellery comprised high-ceiling and low-ceiling spaces. In this study, the change in a person’s emotions according to the ceiling height while moving was examined through brain wave experiments to understand the stress index for each building space. The Reich Chancellery was recreated through VR, and brain wave data collected per space were processed through a first and second analysis. In the first analysis, beta wave changes related to the stress index were calculated, and the space with the highest fluctuation was analyzed. In the second analysis, the correlation between 10 different types of brain waves and waveforms was analyzed; deep-learning algorithms were used to verify the accuracy and analyze spaces with a high stress index. Subsequently, a deep-learning platform for calculating such a value was developed. The results showed that the change in stress index scores was the highest when entering from the Mosaic Hall (15 m floor height) to the Führerbunker (3 m floor height), which had the largest floor height difference. Accordingly, a stress-ratio prediction model for selecting a space with a high stress level was established by monitoring the architectural space based on brain wave information in a VR space. In the architectural design process, the ratio can be used to reflect user sensibility in the design and improve the efficiency of the design process.

1. Introduction

1.1. Research Background and Purpose

According to historians, the chancellor of Germany, Adolf Hitler (1933–1945), had architects create monuments that were a physical embodiment of his worldview and instruments for campaigns against the democratic order. One representative monumental structure [1], the Neue Reichskanzlei, was constructed in 1939 by architect Albert Speer on Hitler’s orders [2]. The building was built to showcase the might of Hitler’s Germany through its enormity and put pressure on bureaucrats and diplomats based on vertical balance. In 1939, the president of Czechoslovakia attended a political meeting in the Neue Reichskanzlei and passed through its long corridors and high-rise spaces. The spatial dimensions and aesthetics of the chancellery triggered a heart attack in the president. This is one example that shows the overwhelming feeling of the residence [3]. This phenomenon is known as Stendhal syndrome, a phenomenological theory defined by Stendhal in the early 19th century that describes the condition experienced while looking at a work of art at a museum, which includes an increased heart rate, feeling weak in the knees and experiencing ecstasy. This phenomenon has been detected by monitoring brain waves in the medical realm for the purposes of psychological therapy [4].
As such, the residence designed by Speer fulfilled Hitler’s grandiose vision (Figure 1). Therefore, in this study, we conducted brain wave experiments to understand the variations in emotions in humans as they move from a low-ceiling space to a high-ceiling space. The emotional information on a person in each situation was analyzed through a fusion of architecture and electroencephalogram (EEG) sensors. We took Hitler’s residence as the subject of the case study.
Traditionally in the field of architecture, to infer the spatial experience of a user, which is acquired via a sensor for measuring the physical elements of a building, surveys of the user’s reaction and questionnaires are widely conducted. It is possible to develop a method for directly monitoring brain wave information and analyzing emotional information in a space [5].
In this study, we reproduced Hitler’s Neue Reichskanzlei or New Reich Chancellery, which is currently in a state of ruin, on a VR platform for a subject to experience. Thereafter, we measured, via EEG signals, the psychological stability index and stress index, which are emotional information indices depicting a subject’s feelings in a building space, and built a deep-learning-based stress-ratio prediction model that could be quantitatively evaluated.

1.2. Research Scope and Method

There were two research methods for understanding the stress index for each building space. First, the amount of change in the beta waves of an EEG signal related to the stress index was calculated, and information on the space exhibiting the largest change was expressed in terms of time information from the VR experience. Second, deep learning was used to compute various EEG variables, and batch processing was performed for accuracy improvement. Pattern analysis was performed using deep-learning algorithms to analyze the correlation between ten bits of EEG information and waveforms. During this process, a section with low stability and high stress was identified by considering the correlation between the alpha wave, which indicates psychological stability, and the beta wave, which indicates stress. Thus, the stress ratio was considered in the computation. The stress ratio is defined as the ratio of stress to psychological stability. Subsequently, a deep-learning platform was developed to verify the accuracy and calculate the region with a high stress index. Through a comparative review of the two methods, the region in the VR space where stress was high was identified, and a practical use plan was suggested by monitoring the architectural space of the EEG information.

2. Theoretical Considerations

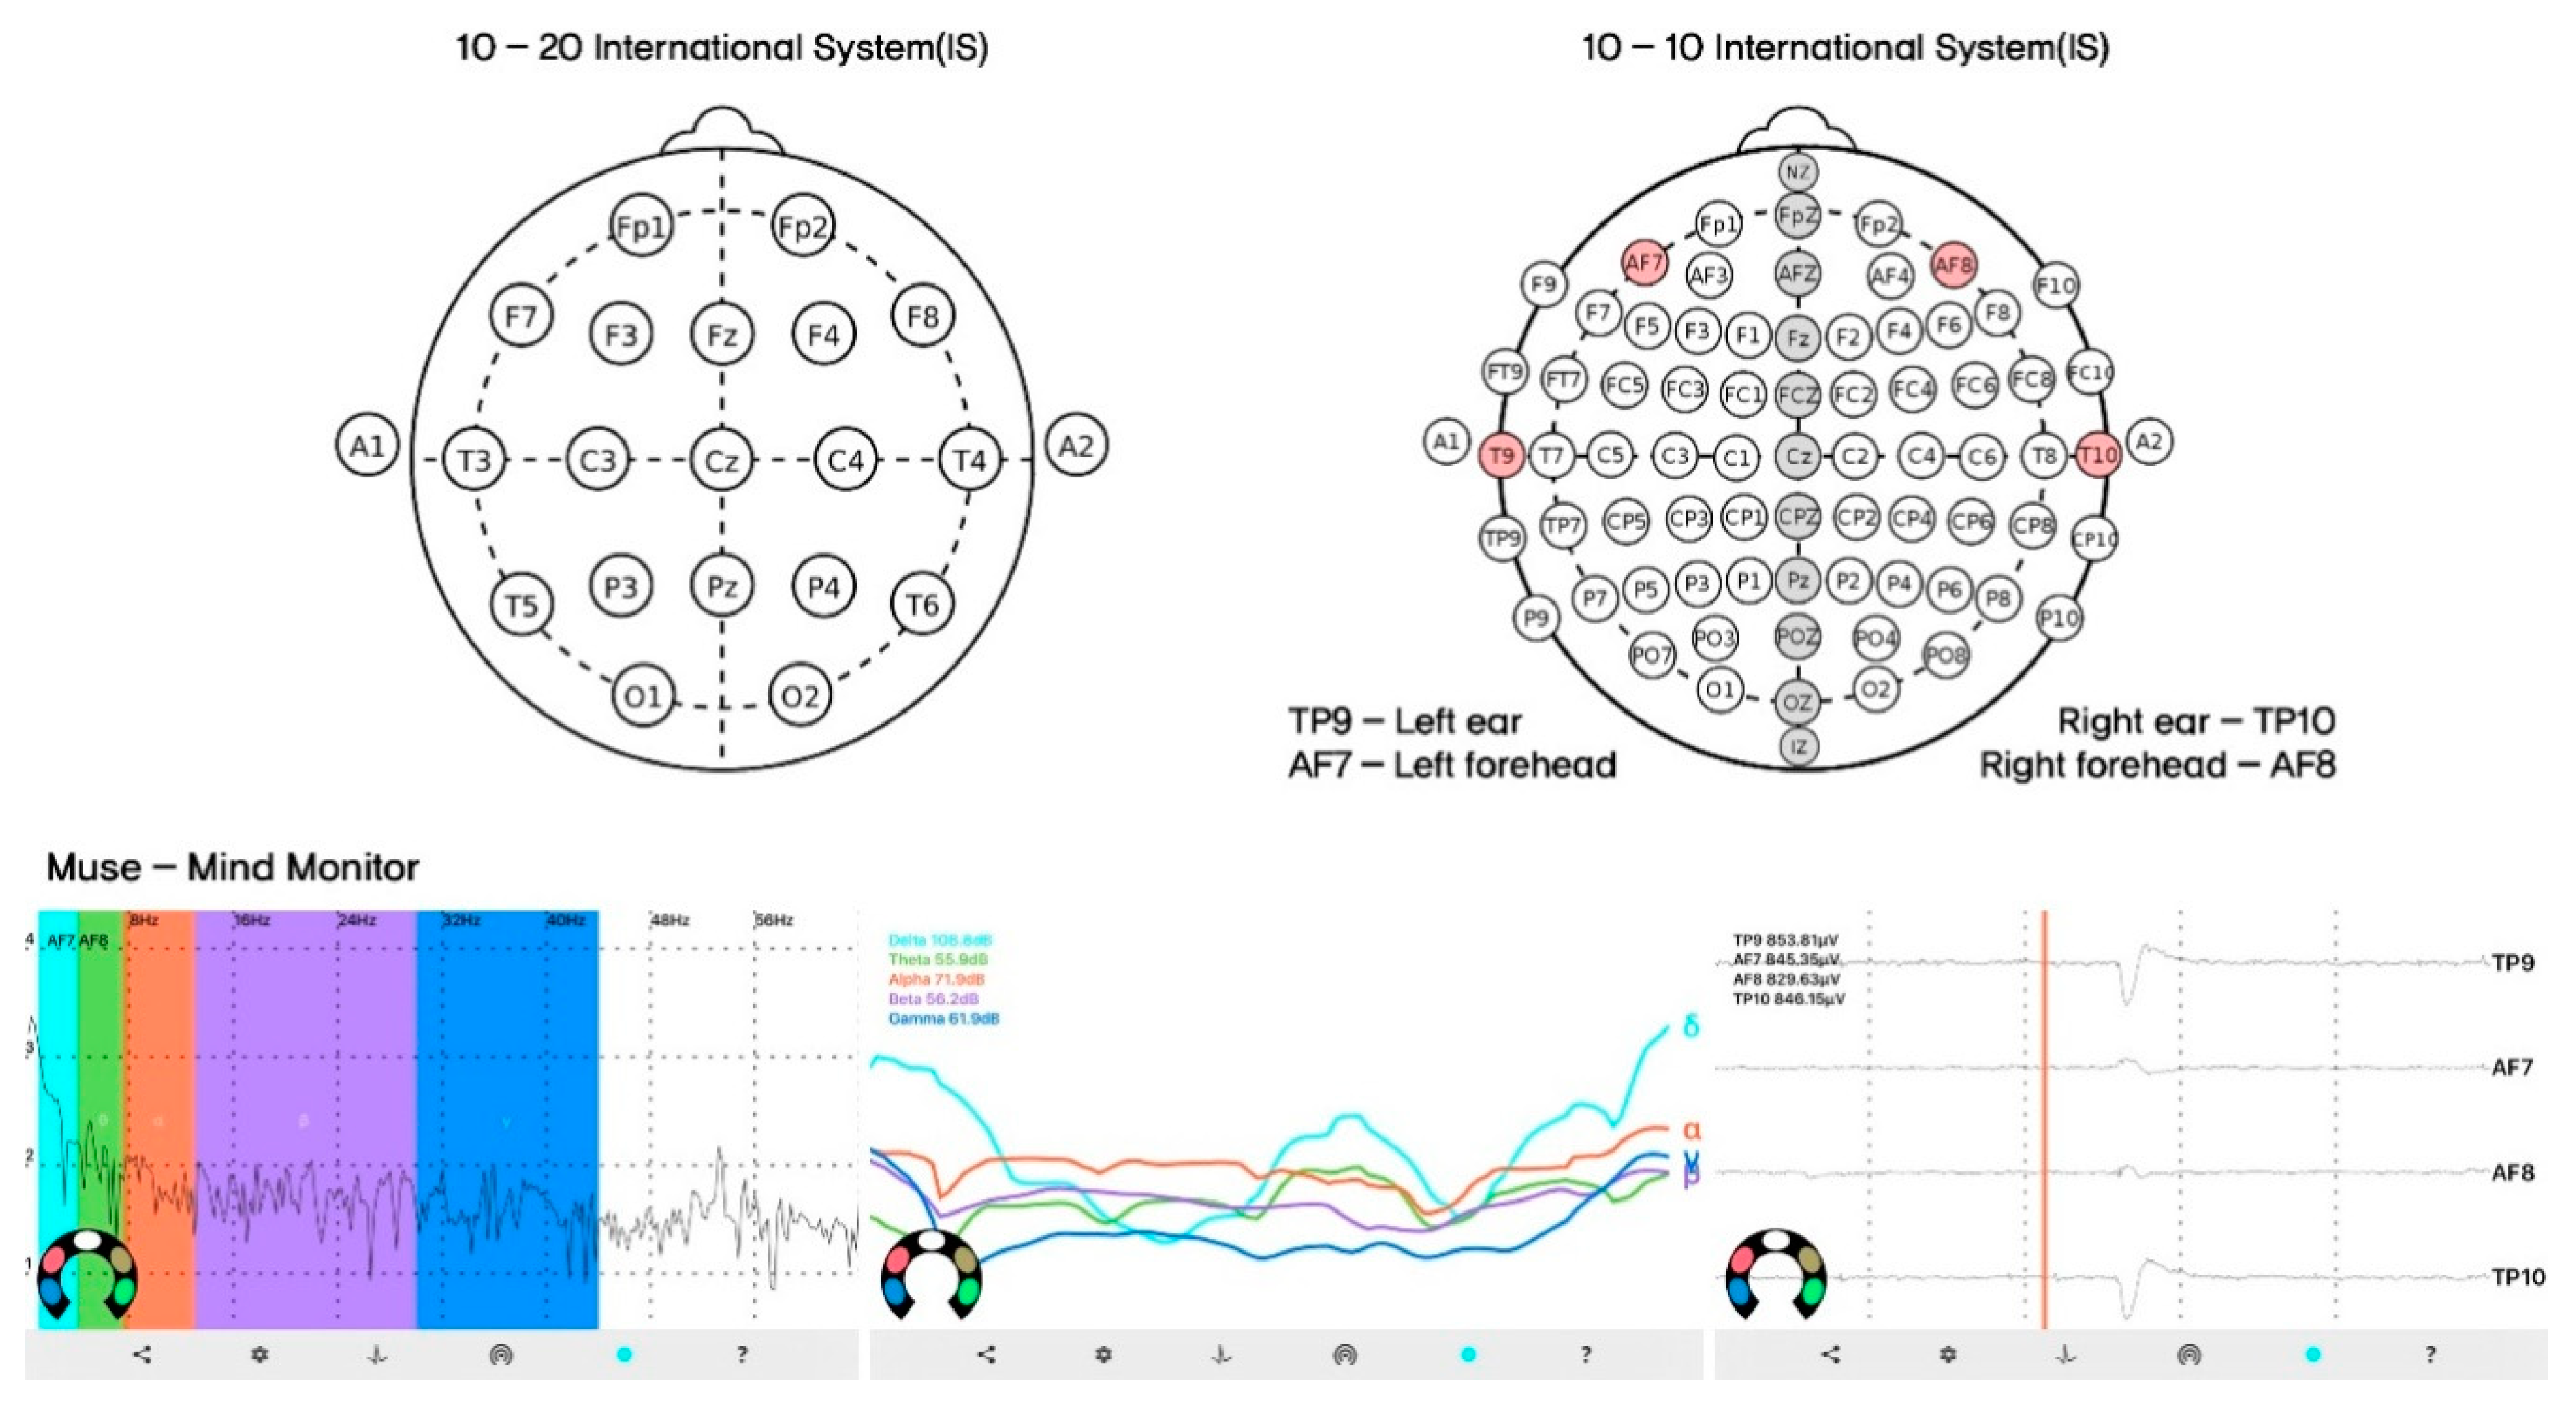
2.1. Electroencephalogram

An electroencephalogram (EEG) is a measurement of periodic changes in a person’s brain nerves, and because it changes according to the state of human consciousness, it is also called “brain potential” or “brain conduction”. In general, an EEG is categorized into delta (δ) waves [6], theta (θ) waves [7], alpha (α) waves [8], beta (β) waves [9] and gamma (γ) waves [10].
Furthermore, an EEG amplifies and records the microelectrical activity of the brain via electrodes attached to the scalp with a cap to detect the emotional, cognitive and psychological states that cause certain behaviors [11]. Through this, an unconscious level of cognitive activity can be identified and predicted. In particular, as an objective indicator of brain function and activity level, an EEG is a suitable tool for measuring human sensibility because no other indicators exist that can respond more sensitively to stimulation than an EEG [12].
Previous studies on brain waves have been generally conducted in the medical, biotechnology and architecture fields.
In the medical and biotechnology fields, most studies on the relationship between brain waves and stress have focused on the quantification of stress levels using an EEG to analyze brain waves in the stress state and the rest state for quantification [13]. Furthermore, the stress level was distinguished and quantified using an EEG [14]. Another study analyzed the brain waves affecting stress based on fNIRS (functional near-infrared spectroscopy)–EEG [15]. In addition, one study attempted to improve the accuracy of categorizing stress by converging the EEG and fNIRS measurements [16].
In the architectural field, brain waves are commonly used to measure sensibility according to architectural color; changes according to the variation in architectural environmental elements such as lighting, temperature and humidity; and the responses to changes in visual elements such as specific patterns or shapes.
Studies on measuring sensibility according to spatial color analyzed brain waves by changing the colors of architectural elements such as the floor, ceiling and walls and examined the color arrangements of spaces that are appropriate for relevant space programs [6,17,18]. Studies on measuring the changes in brain waves according to the variation in physical architectural elements such as lighting, temperature and humidity have examined the correlation between environmental changes and spatial satisfaction [19,20]. In addition, studies examining the brain waves’ response to changes in visual elements, such as a specific pattern or shape, analyzed emotions by measuring brain waves within specific distances of a city [21,22].
Previous studies investigated the correlation between spatial design elements and brain waves; however, the correlation between stress and brain waves according to the shape or pattern of construction elements for architectural design was not analyzed. References [21,22] are currently conducting studies on specific patterns or shapes; however, there are limitations in analyzing psychological changes according to a specific distance from an urban perspective and applying it to architecture.
Thus, it is necessary to analyze brain waves with respect to architectural elements to increase the efficiency of design and realize a design quality that reflects the user’s sensibility during the construction design process.
Accordingly, in the experiment, EEG data were measured, and the change in the stress level according to the characteristics of the space was analyzed when the subject experienced the given space in VR. In particular, there has been an increased need for deep-learning-based technologies for predicting or categorizing definite or meaningful patterns in big data [23] on brain waves, which are collected as 60 Hz or more of unstructured pieces of data per second.

2.2. Virtual Reality

Virtual reality is a technology that simulates an immersive three-dimensional environment or situation similar to or entirely different from reality using a computer. When a dangerous situation or a situation that cannot be experienced in the real world needs to be reproduced, it is possible to build a virtual space in a VR platform and implement a suitable and safe environment to experience it. In architecture, in addition to simulating a computer-generated environment and situation, VR allows users to indirectly experience spaces in a building that will be built in the future [24]. Therefore, VR has been widely used as a tool for practice and research purposes in various fields [25]. One typical example is Unity, which is a VR-capable three-dimensional development platform used to develop interactive three-dimensional content based on the game engine developed by Unity Technologies. It is one of the most widely used tools for game development [26].

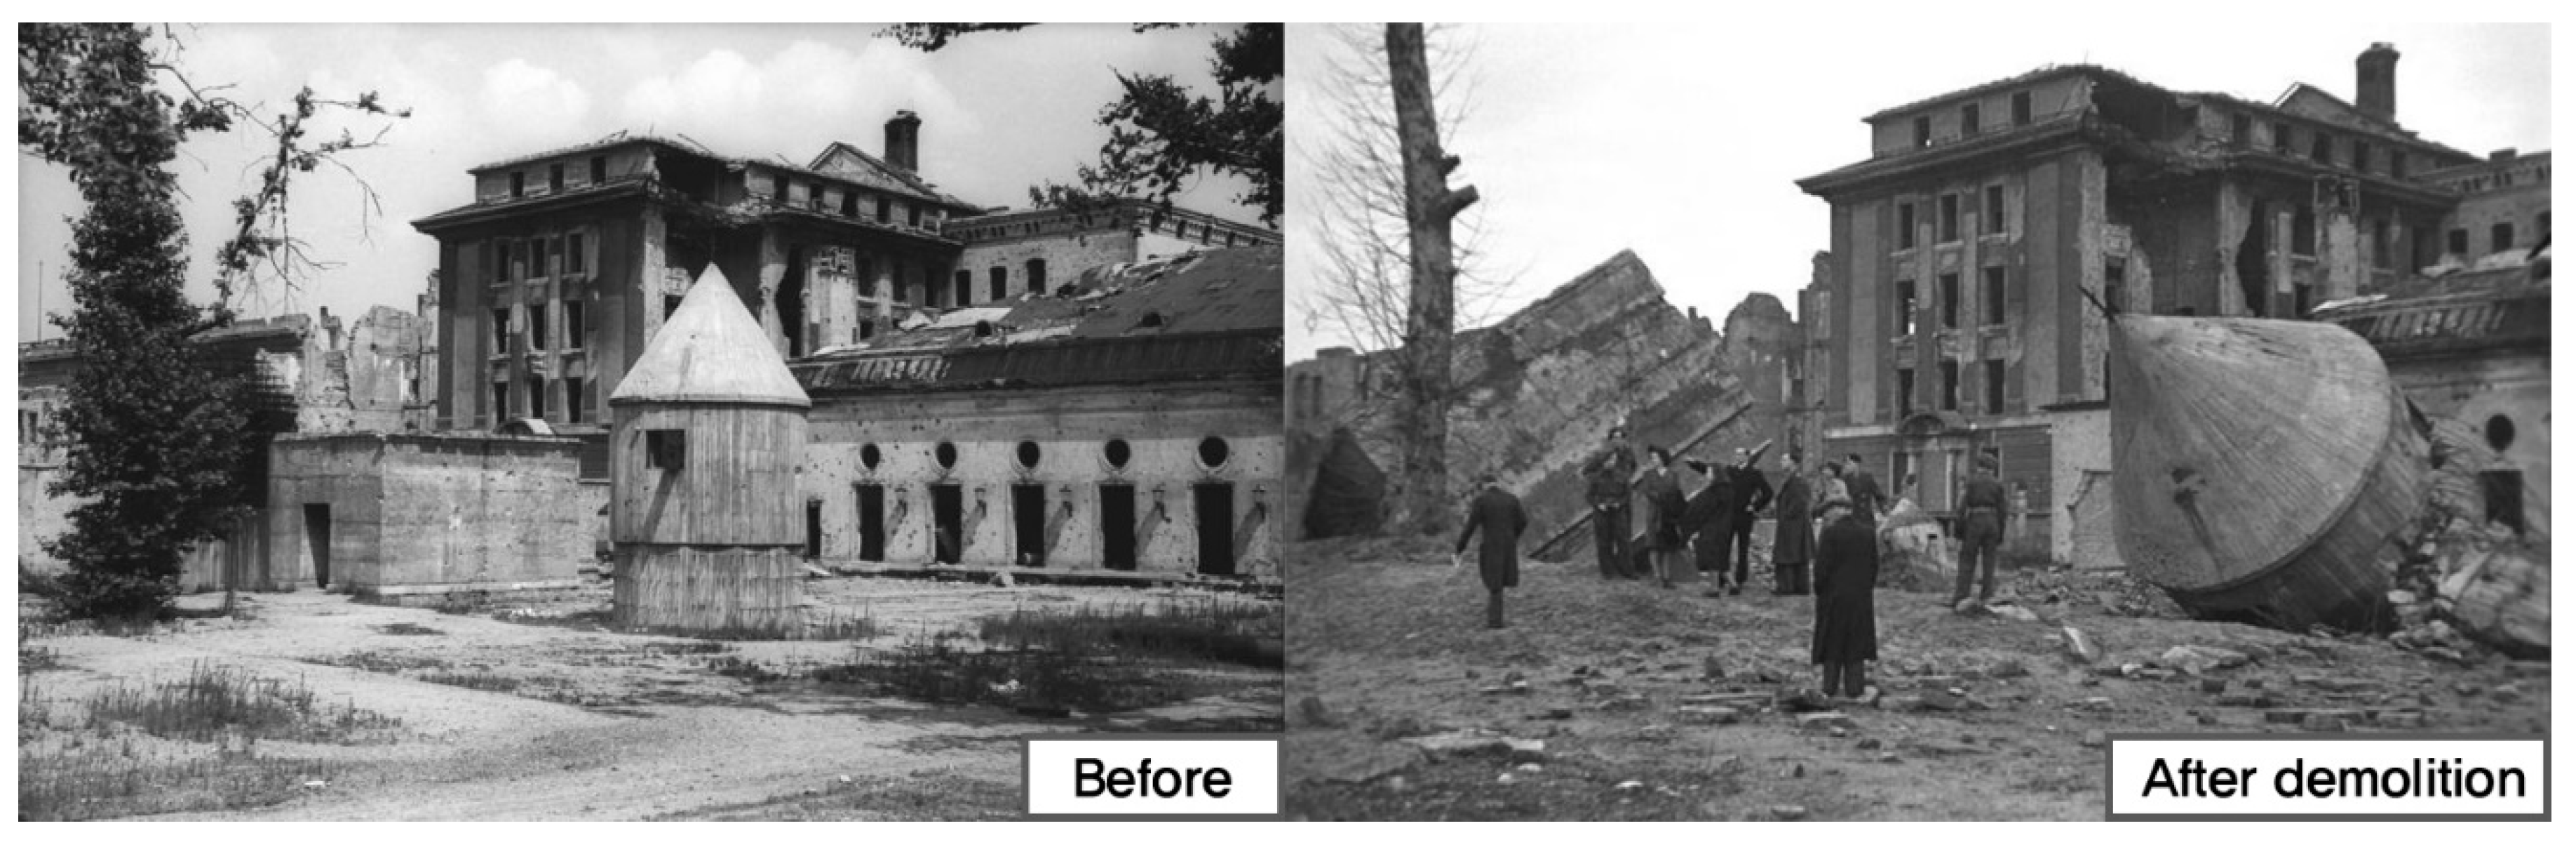
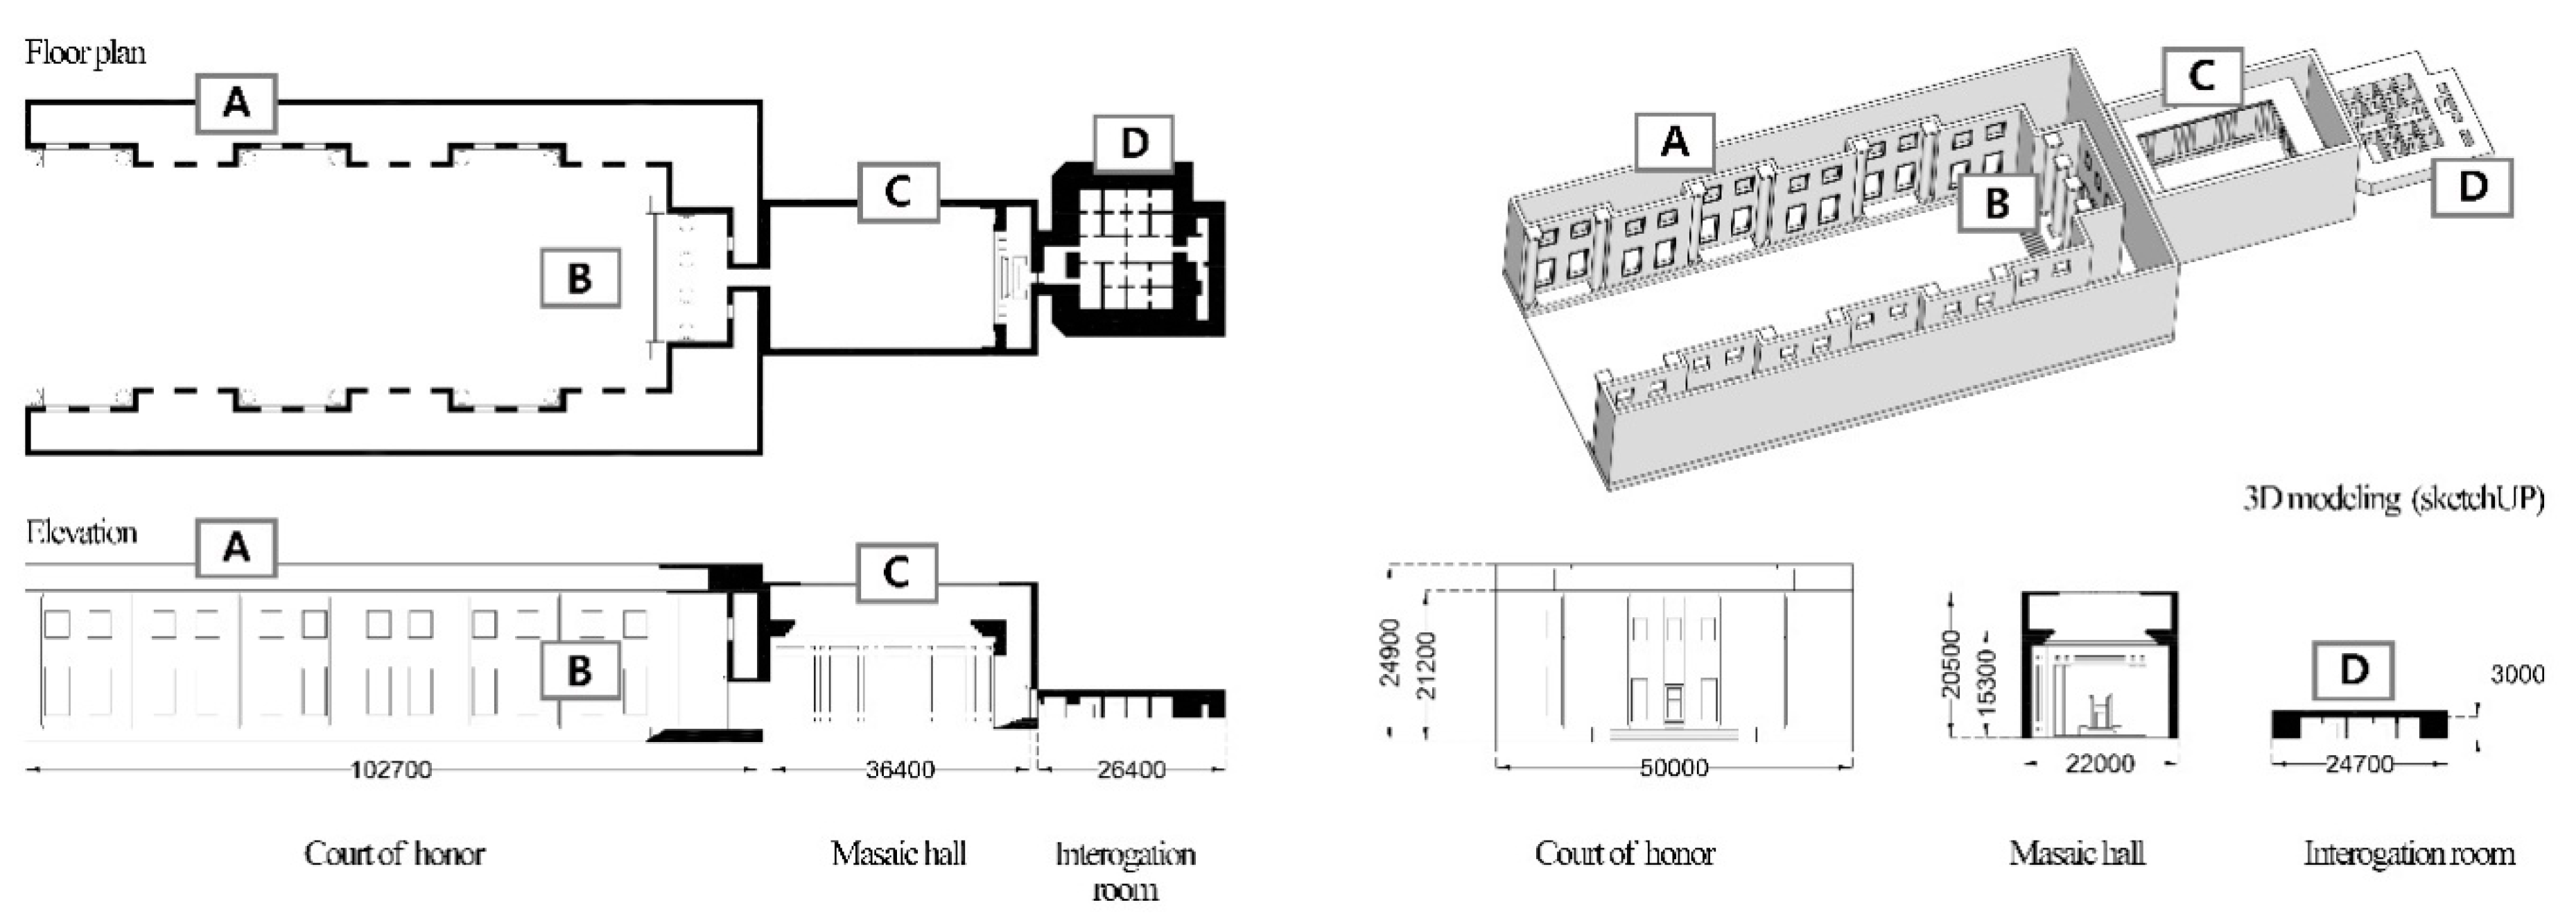
2.3. Features of Hitler’s Chancellery

The building designed by Albert Speer was based on the concept of “the world in the world”. It was designed to control access within Hitler’s authority by reflecting his governing philosophy. The chancellery had a sophisticated architecture, giving the impression of a space occupied by a powerful ruler. It was built to show the might of Hitler’s Germany and exhibited “greatness” based on vertical balance. Thus, bureaucrats and diplomatic envoys would often express fear when standing in its shadow. An example is the case where Emil Hácha, the president of Czechoslovakia, visited the building in March 1939. The building consisted of plain walls with a 25 m tall floodlight that blocked its space from the outside and four large, smooth pillars arranged around the stairs to add to the overpowering aesthetics of the building. Some theorize that Hácha experienced difficulty breathing as he ascended the staircase that led to the high, narrow entrance through the empty space made by the skylight. Subsequently, he passed the next section of the building, the Mosaic Hall, which was an empty space without furniture or carpets. Weak light bled from the ceiling through translucent glass; however, it was a cold space without shadows and had no purpose other than to have a psychological impact on visitors. The president, who failed to overcome the pressure as he walked through the long corridor after he walked across the rooms, suffered a seizure in Hitler’s study and then signed a document known as the Czechoslovakia declaration of submissive surrender [5]. As such, the design of the Neue Reichskanzlei perfectly satisfied Hitler’s vision, and it is possible to understand how overwhelming the building was (Figure 1).

2.4. Research Contributions

Several experiments are being conducted in the field of architecture to develop and use VR [27] as a method for reconstructing heritage sites because it is not limited by space and time. Based on this method, a space that does not exist or is unsafe for conducting an experiment in can be constructed using VR [28]; thus, the user can indirectly experience a real sense of the space. Furthermore, in recent years, research on the use of the biometric information of users in a VR environment that simulates environments that are otherwise not directly accessible to humans has been gradually increasing [29]. In a previous study, we used a visualization technique employing a VR space. We performed EEG analysis of human experiences according to changes in a residential area consisting of single-person households. We found no significant differences between a human being’s emotional response to the actual space and that to the virtual space [25]. In this study, we analyzed the changes in the EEG signals in a VR space and the user’s psychological state and attempted to verify the hypothesis that the user’s state changes with variations in the floor height of the building through EEG data. This can verify that the psychological state of a human changes with the environment. For example, the huge domelike structure of St. Peter’s Basilica and the high ceilings and arrangement of heavy columns of ancient Roman ruins have different impacts on human psychology. These structures often make people feel overwhelmed [30]. Therefore, this study aimed to explain the effect of Hitler’s chancellery on visitors by analyzing human psychology through changes in EEG signals with rapid variations in floor height.

3. Experimental Outline and Equipment

3.1. Outline

We reconstructed the Neue Reichskanzlei in a VR platform using historical data. The test subject wore VR gear and EEG measurement equipment and passed through predetermined spaces. The EEG signals were measured, and the stress indices of the subject, which changed depending on the conditions in each situation, were analyzed. VR is not limited by space or time, and any space needed by users can be constructed and experienced. Therefore, in this experiment, the Neue Reichskanzlei, which does not exist anymore (Figure 2, was reproduced and experienced in a virtual space using VR. In the VR experiment, a headset that supports the mixed reality (MR) method was used to indirectly experience the virtual space. As the subject moved and passed through certain virtual spaces during the experiment, the equipment attached to his head measured the EEG signals. Furthermore, because the subject had to wear VR and EEG measurement equipment simultaneously, a piece of equipment with a convenient headband was used to measure the EEG signals.
For the experiment, three spaces of different heights were virtually constructed. The first space was the Court of Honor, with a wall height of 25 m. The second was the Mosaic Hall, with a height of 15 m. The last space was the Führerbunker, with a floor height of 3 m. The subject wore VR and EEG equipment and physically moved in a 130 m straight line to get a more realistic and immersive experience as he moved from the Court of Honor on the high floor to the low bunker in the virtual space. Afterward, the EEG data measured through the experiment were collected based on time-series information. After completing data collection, two analysis methods were employed to determine the stress that the subject felt in a specific space. From the first analysis, a comparative analysis of the types of beta waves, which indicate stress among the spectral information of the EEG signals, was conducted to select the region with the highest stress index. In the second analysis, the stochastic gradient descent (SGD) algorithm and the multivariable linear regression of TensorFlow, which is a deep-learning platform, were used to analyze correlations among the alpha, beta, theta and delta waves to derive regions of stress in order from highest to lowest. The analysis was conducted by considering the correlation between the waveform showing psychological stability, such as an alpha wave, and the stress waveform, such as a beta wave, to find a stress ratio with low stability and high stress (Figure 3).

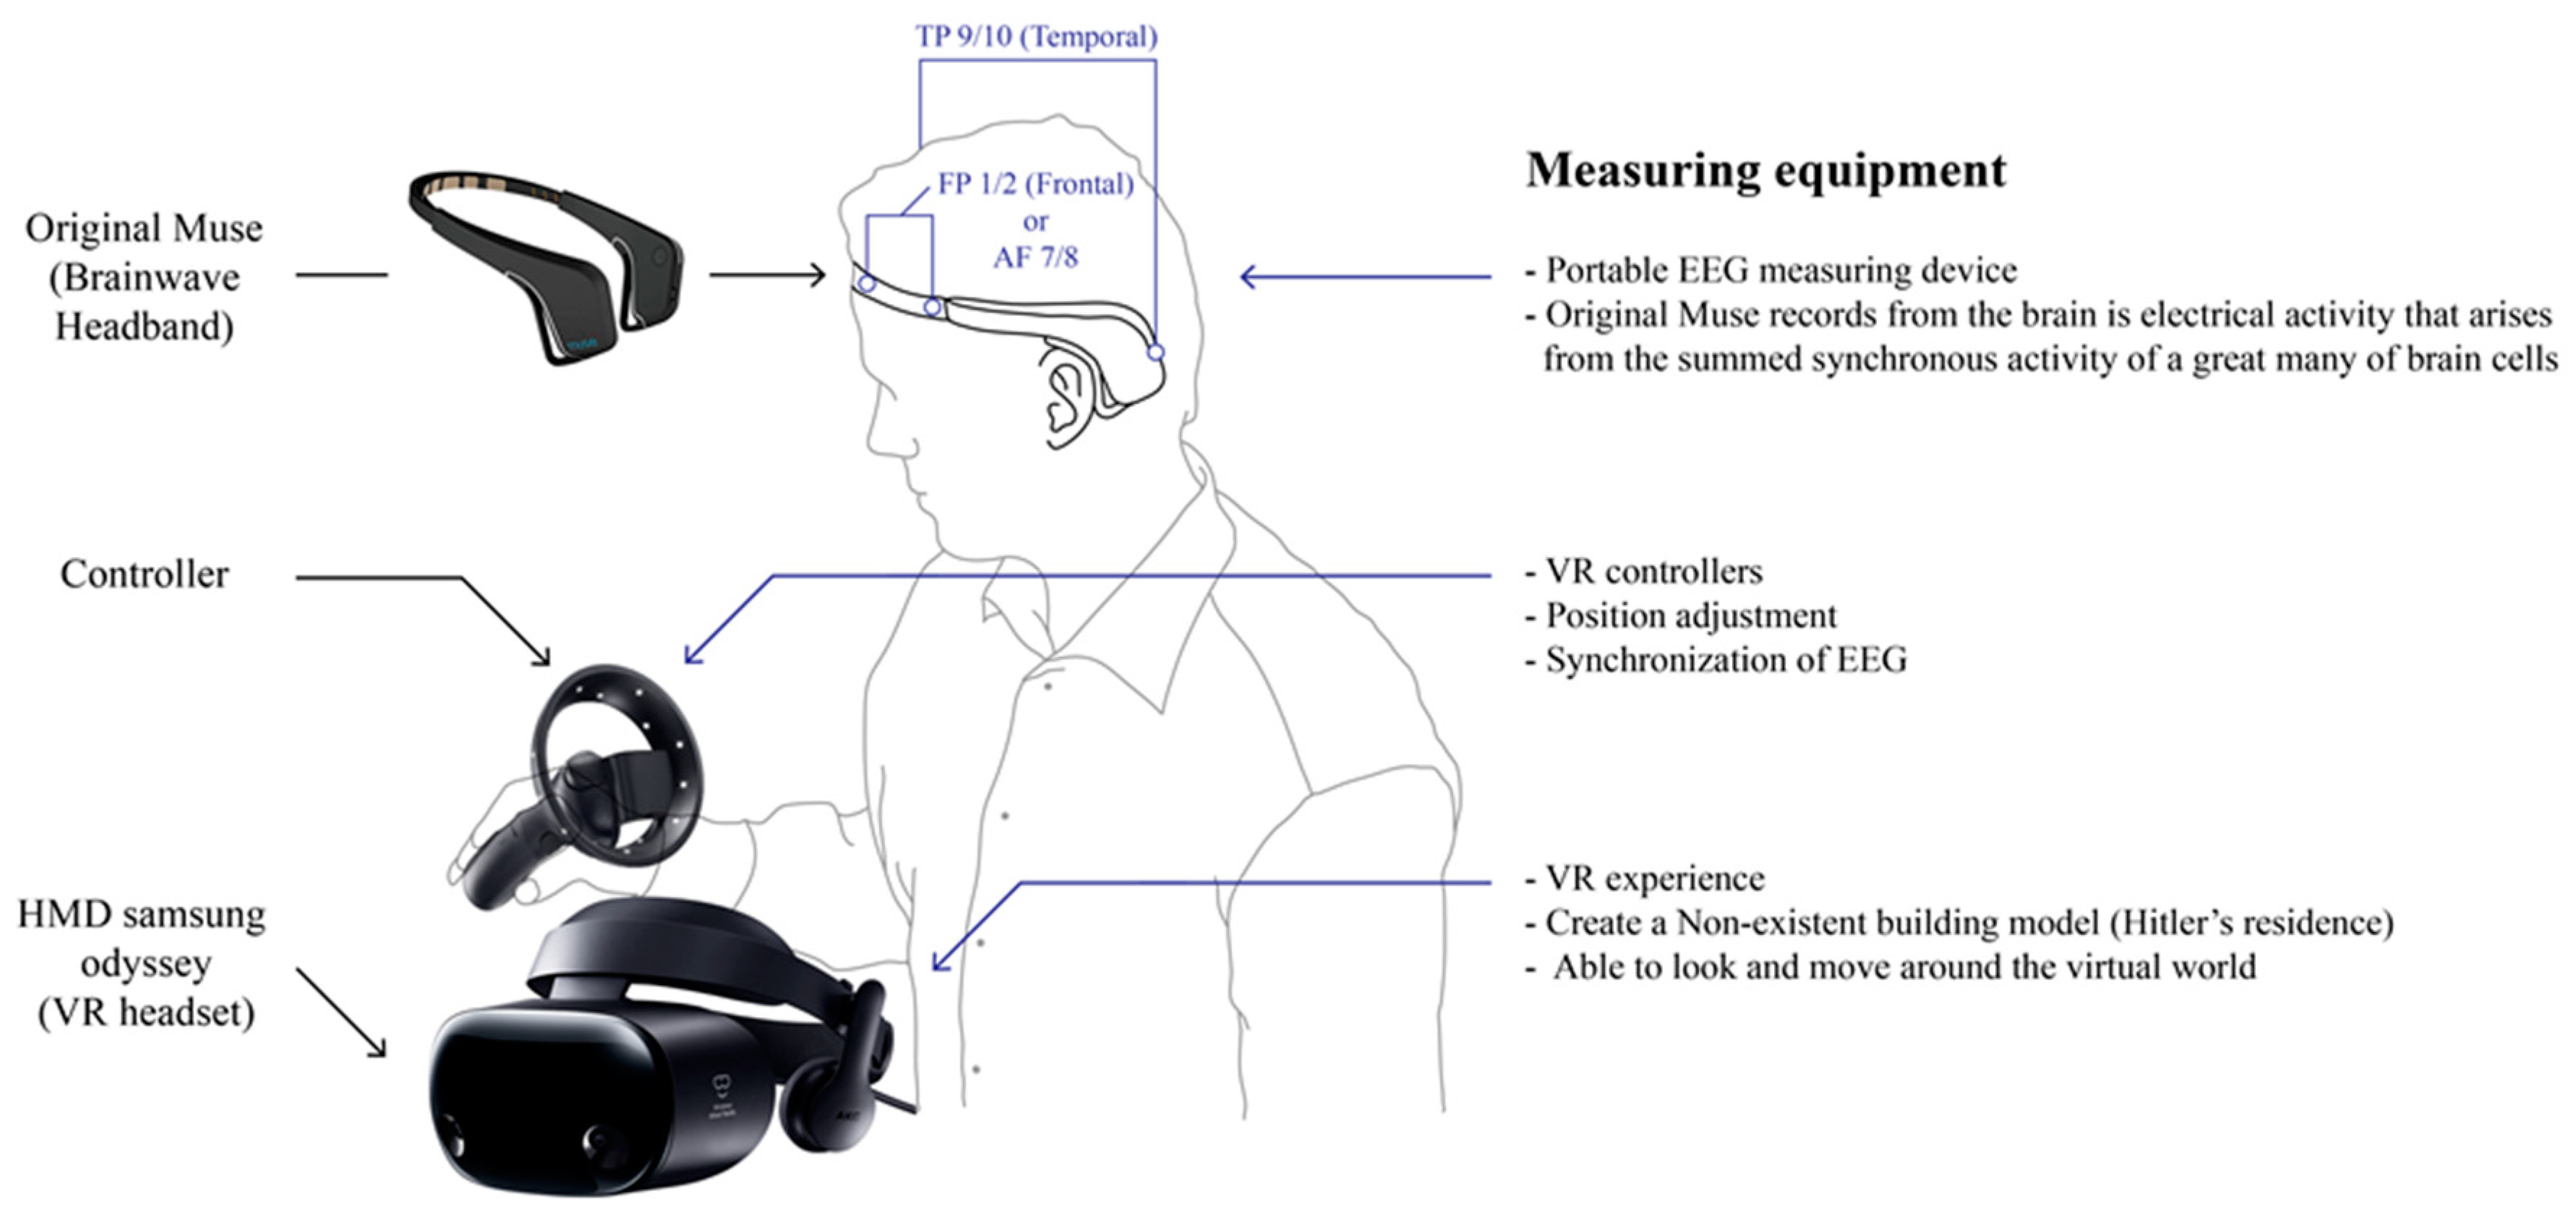
3.2. Experimental Equipment

3.2.1. Virtual Reality Instruments

The VR experiment, which was conducted in parallel with the measurement of EEG data, should be conducted in a wide space with a straight line that is long enough that the subject can experience the virtual space while moving directly to a predetermined space at a distance equal to the actual distance. Therefore, the experiment was conducted on a designated long track in the stadium at Kookmin University.
Furthermore, because the method was not at room scale, which requires measurement in a limited space such as the existing VR equipment, an MR method, which can be utilized in an actual space, was used and supported by equipment such as an infrared camera to conduct the experiment. The virtual space for the EEG data measurement and VR experiments was constructed in Unity. The subject wore a Samsung head-mounted display (HMD) Odyssey headset with MR support. HMD refers to equipment that is mounted on the head and completely blocks the user’s sight, allowing them to concentrate on the VR simulation. It is also called a face-mounted display [31]. The user may utilize a smartphone, laptop or desktop to run the software, and the visual screen changes as the user moves. With this feature, VR can be input with content that responds to user behavior [32]. Therefore, for this experiment, we had the HMD-wearing user move forward and cross a certain virtual space.

3.2.2. EEG Measurement Tool

Muse [33], an EEG device from InteraXon, was used to measure EEG data. Because the experiment required the user to wear VR equipment and EEG measurement equipment simultaneously, he was given a convenient headband for more comfortable EEG measurements. Because it is dry-type equipment, which is different from conventional equipment that is complex and difficult to attach to a gel- or saline-type device, the device can quickly measure EEG signals and verify data. In a previous study, we used equipment that measured 14 channels. The EEG data yielded few errors due to physical interference between the two pieces of equipment caused by proximity while wearing the headsets. To minimize interference between the EEG device and the VR device and to ensure comfort, a simple device with fewer channels was selected. Muse can collect EEG data from four channels in the frontal (AF7, AF8) and temporal lobes (TP9, TP10) [9]. The locations of channels for EEG data measurement and analysis that were provided by the equipment, such as AF7, AF8, TP9 and TP10, were arranged according to the electrode placement system and typically categorized into the 10–20 international system (IS), 10–10 IS (10%) and 10–5 IS (5%). The number is defined based on the distance between the electrodes and expressed as a percentage, and the 10–20 IS, 10–10 IS and 10–5 IS include the maximum standard positions of 21, 81 and 345, respectively.
Figure 4 compares the electrode locations on the two coordinate systems that are most frequently used in studies and visualizes the locations of the electrodes used in the actual equipment. The electrode location of the Muse equipment for EEG measurement was arranged according to the 10–10 IS and classified according to the part of the cerebrum, left or right, on which the electrode was located [34]. “Frontal polar” is the intersection with the frontal lobe, and “temporal” (T) is the intersection with the temporal lobe. Furthermore, the odd-numbered electrodes were placed on the left side of the head, the even-numbered electrodes on the right side and the lowercase letter z indicates the part passing through the center of the head [35]. For EEG measurements, signals were measured at the AF7, AF8, TP9 and TP10 regions of the frontal and temporal lobes by a single-pole induction method based on the earlobe (A1) part of the subject. The measured data were extracted for visualization (Figure 4).

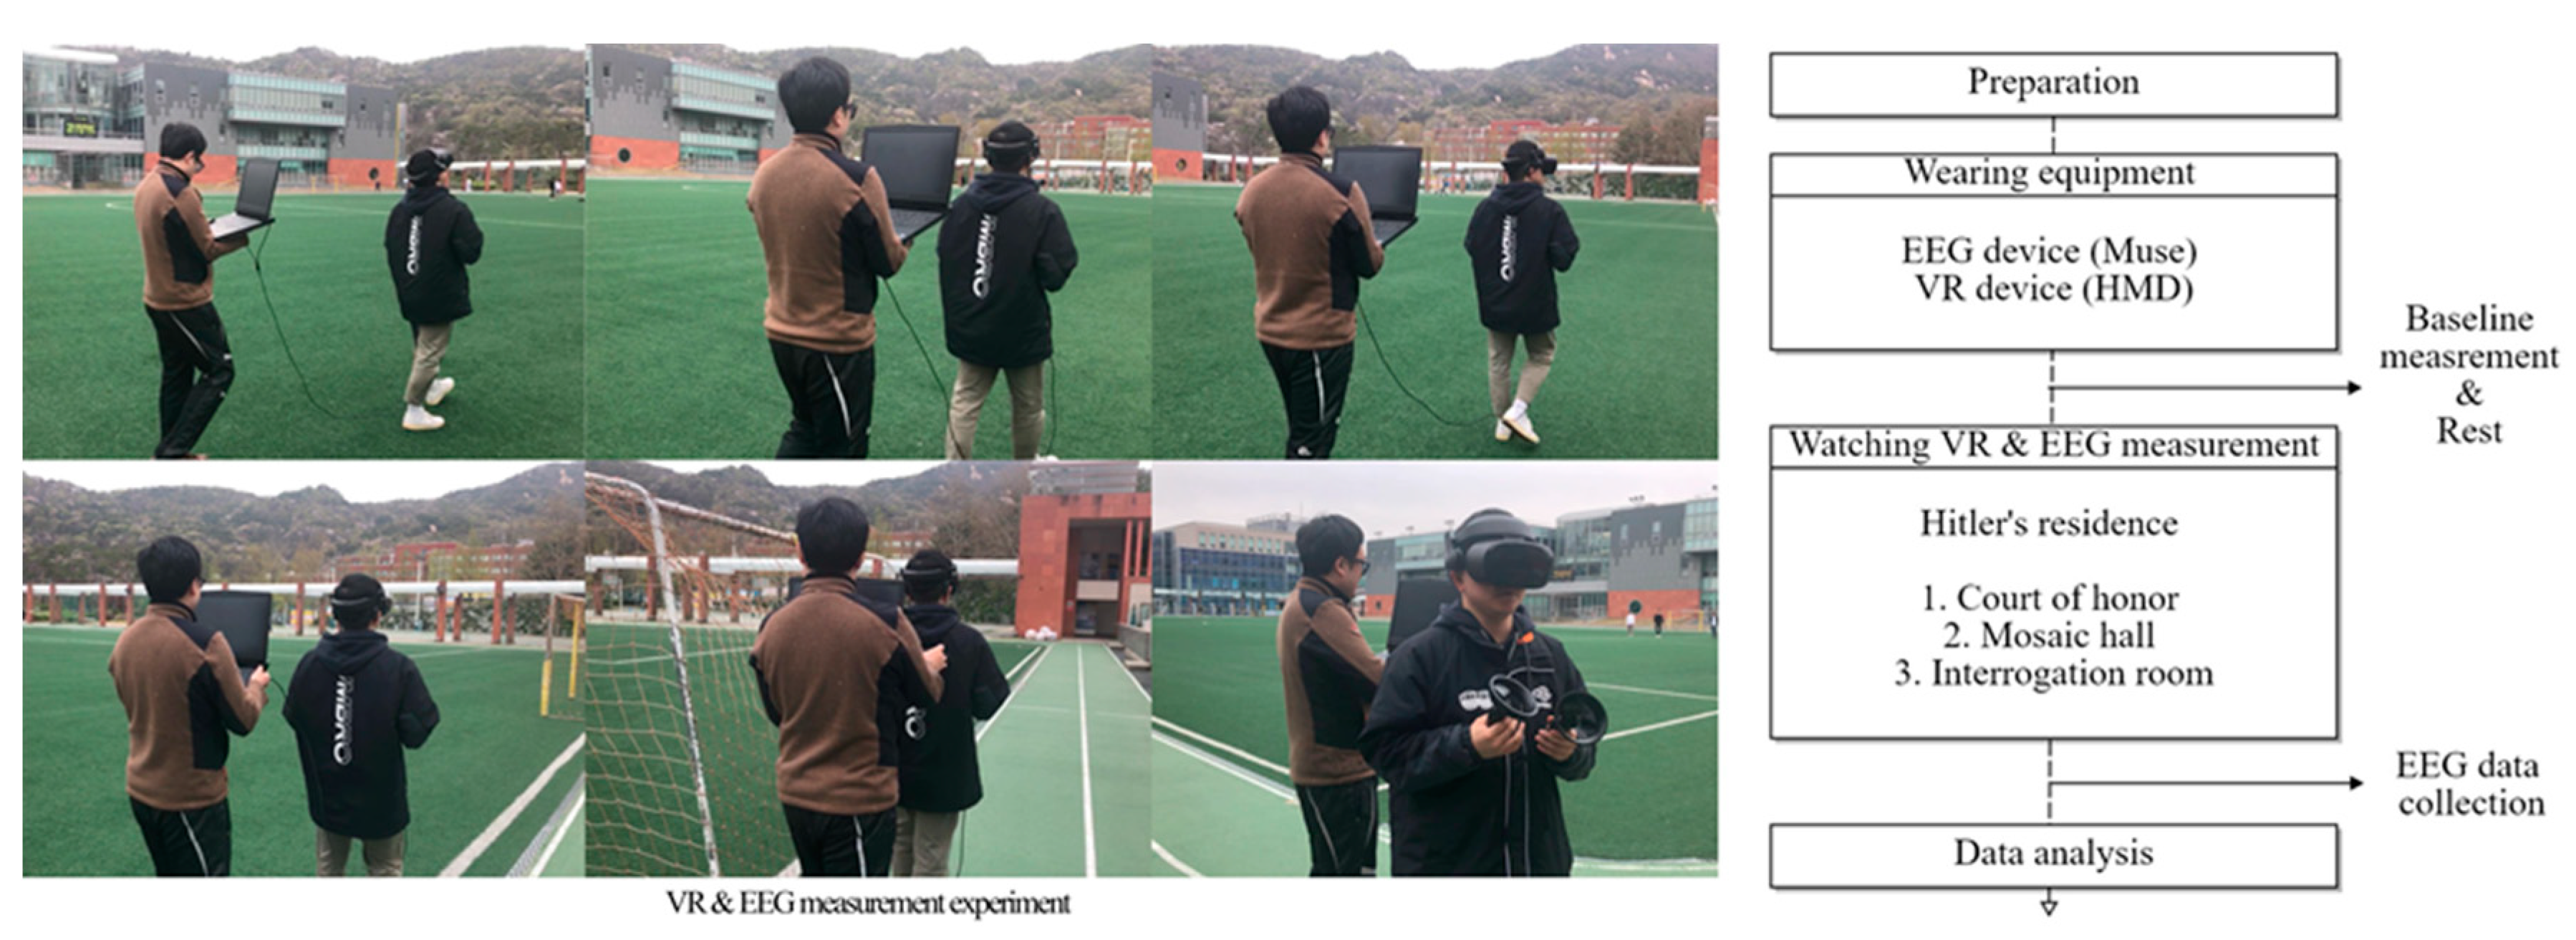
3.3. Experimental Measurement and Methods

3.3.1. Experimental Measurement

The number of subjects for the experimental measurement of brain waves was set to one. We examined changes in brain waves according to the variation in the pattern of building spaces, in which the variables of brain waves were analyzed per frequency using a deep-learning algorithm to find a section with a high level of stress. Therefore, the number of subjects was set to one for the experiment. The subject was a 38-year-old male.
To obtain stable data from the brain wave equipment, a calibration process was required before conducting the experiment. The calibration process, which synchronized the brain wave equipment and the subject, required approximately 30 s. The subject was instructed to clear his mind with his eyes open and remain in a relaxed state for 15 s and then remain in the same state for another 15 s with his eyes closed.
Considering the biorhythm of the subject, the experiment was conducted on 19 April at 12:30 p.m. at the stadium of Kookmin University, in which the subject could walk 120 m of a virtual space in 120 m of an actual space, thus minimizing the discrepancy between the actual space and the VR space.
When the VR program of Hitler’s chancellery began, the brain wave equipment started recording data when the monitoring button was pressed. The subject moved through the space in a walkthrough manner from the outside of the building through the inner halls and then into the interrogation room, during which time the process and brain wave data were recorded for analysis.
The subject walked 120 m for 3 min and 47 s. Therefore, the data were collected for 3 min and 47 s, and the sampling rate of the EEG equipment was set to 50 Hz such that 50 pieces of data per second were measured using one piece of data per second using the OSC Stream average option of the Mind Monitor application.
The equipment used in this experiment is described in Figure 5. The EEG data generated from the four channels in the frontal lobe (AF8, AF9) and two channels in the temporal lobe (TP9, TP10) were collected through the headband (original Muse) for the EEG measurement, and the user could experience the VR space by wearing the headset (Samsung HMD Odyssey). The experiment was conducted by taking measurements using the EEG equipment and the VR equipment simultaneously, and the controller of the VR device was used to synchronize the two pieces of equipment. With this, it was possible to adjust the shape of the subject’s position in the building. This approach also synchronized the two tasks of processing the EEG data measured over time. Furthermore, it was possible to accurately determine the time point of data that appeared in the EEG signal, the location of the building and the location of the subject in VR. Thus, it was easy to process data when the two data points were compared and analyzed after measurement was completed.

3.3.2. EEG Experimental Method

The experiment was conducted on a designated long track in a stadium with sufficient space to prevent interference from surrounding elements during data measurement. Before starting the experiment, the subject was asked to assemble at a designated point for a smooth process and wait in place for several minutes to wear the experimental gear. The experiments of EEG measurement and data acquisition in the virtual space were conducted by directing the subject to simultaneously wear the Samsung HMD Odyssey VR headset and the Muse EEG data measurement headband (Figure 6). Once he was wearing the equipment, the virtual space of Hitler’s chancellery reconstructed in Unity was connected to the VR equipment, and the Muse headband was linked to a smartphone to prepare for data measurement. After data measurement, the subject walked approximately 100 m inside the virtual building. The EEG signals generated while the subject passed through three different spaces were measured and collected.
The virtual space prevented the subject from deviating from the experimental path and guided the subject in the planned direction using virtual walls. The subject, however, was allowed to turn his head to any position to experience the VR space.
Figure 7 shows the plan and elevation of the residence building reconstructed in the virtual space. The first space was a large courtyard called the Court of Honor. It was an open square space surrounded by 25 m tall walls and blocked from the outside, and only the ceiling was open to the sky. The second space that appeared when the subject passed through the Court of Honor was the Mosaic Hall, with a total height of 20 m and an interior space of approximately 15 m, which was nearly 10 m lower than that of the Court of Honor. There were no windows on the interior walls in the Mosaic Hall, and only an eagle-shaped mosaic statue with a torch decorated with oak leaves was displayed. Furthermore, the floor was made of smooth marble, off of which the ceiling was reflected, and the high ceiling directly above the floor had a translucent glass window so that the subject could feel somewhat cold when he entered the space [4]. After passing through the Mosaic Hall and the narrow passageway, the subject would naturally move to the 3 m tall bunker. As such, the subject passed through three spaces of 25, 15 and 3 m in height. The EEG signals generated according to the change in height of the indoor floor were measured and analyzed. To analyze the EEG data of the subject according to the measured spatial location closely, the EEG and VR image data were measured and compared simultaneously.

4. Experimental Results and Analysis

Two analyses were conducted in this experiment. In the first analysis, the results were ranked according to one type of beta wave to derive the point where the highest beta wave was generated, and the corresponding time information and VR information were recorded. In the second analysis, the point with high stress was derived by considering the correlation between the characteristics of waveforms using a deep-learning algorithm and all EEG data for alpha, beta, delta, theta and gamma waves.
The brain wave data analysis was performed using an offline postprocessing method instead of real-time implementation. The brain wave data were collected through VR and analyzed.

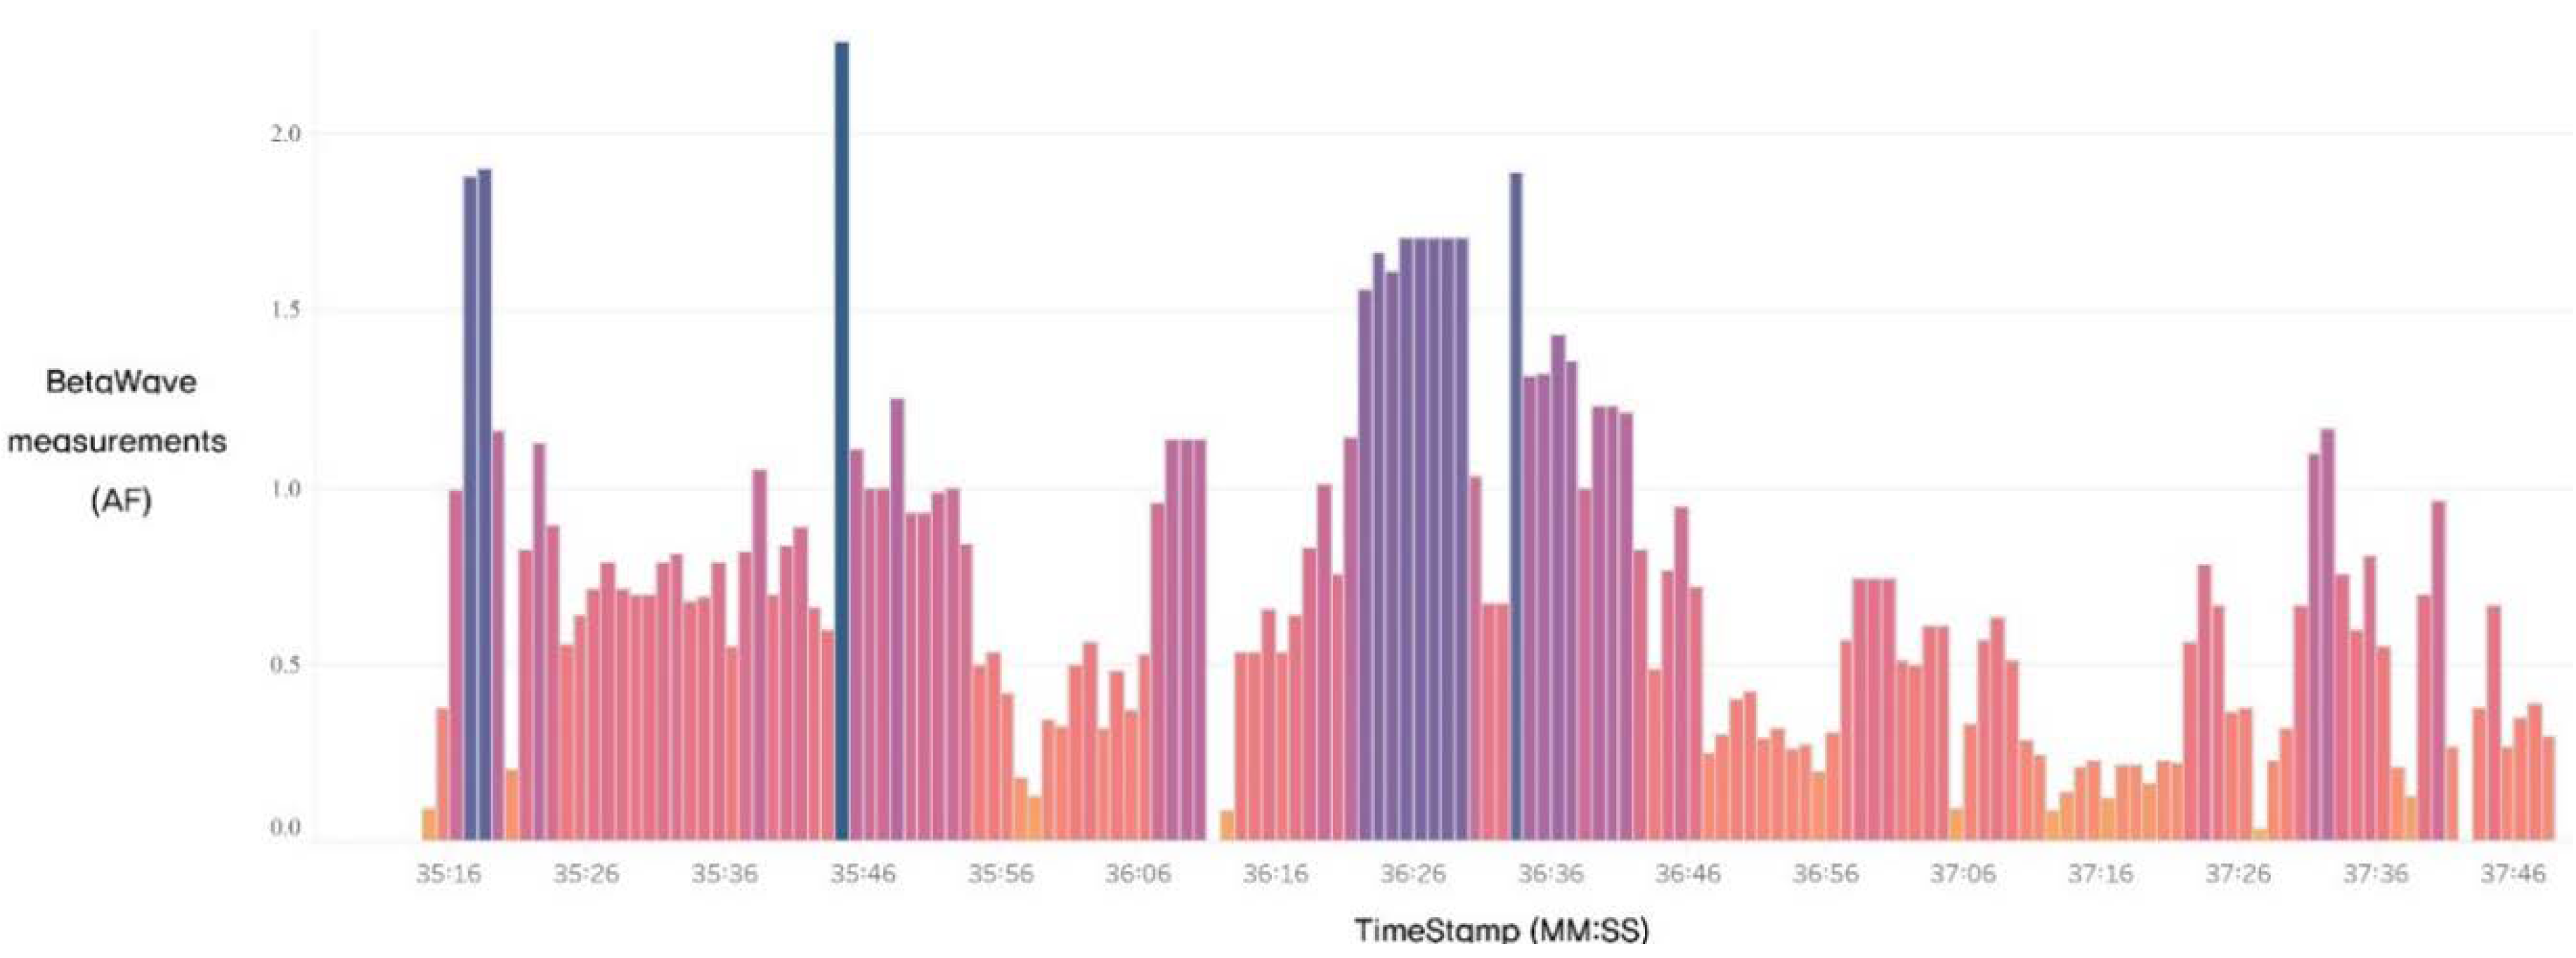
4.1. First Analysis (Beta Waves Only)

Muse, which is a brain wave measuring device, performed preprocessing of the raw EEG data using the Mind Monitor, which is a brain wave streaming application.
Among the embedded libraries of Mind Monitor, data on alpha, beta, theta, delta and gamma waves were extracted per frequency from the raw data of the EEG through independent component analysis (ICA). Then, the brain wave data from the subject were preprocessed for the first and second experiments.
The ICA extracted brain waves per frequency from the raw EEG data. Executing the ICA consisted of a total of four steps, of which steps 1 through 3 involved preprocessing for the ICA, and step 4 involved the actual execution of the ICA. Step 1 was the centering step, where the dispersed brain wave data were centered. The mean of the data was calculated and subtracted from the dataset, and the mean was reduced to 0. Step 2 was the whitening step, in which the dispersion in all directions and standard deviation were normalized and converted to a covariance matrix. Step 3 was the dimensionality reduction step, in which the dimensionality of data was reduced to remove unimportant data while maintaining the covariance matrix. Step 4 was the actual ICA step, in which the brain wave data from the EEG were extracted per frequency [36].
The ICA process separated reiterated brain wave data per frequency. The experiment was conducted using data organized based on each frequency from the sampling rate based on raw data to the mean data per second through an optimized process.
The data that underwent ICA per frequency were then used to deduce the priority of the stress index for spaces by implementing a deep-learning recommender system using Keras or TensorFlow among deep-learning frameworks instead of an RNN (Recurrent Neural Networks)-based long short-term memory algorithm [37,38].
Among the four types of EEG data collected through the Muse headband, except for the results near the temporal lobe, which are sensitive to auditory response, data were extracted based on the AF (Atrial Fibrillation) to analyze the measurement results.
The results were summarized, visualized and expressed using the visualization software Tableau [39,40] so that five types of EEG signals—alpha, beta, delta, theta and gamma waves—could be compared (Figure 8).
Among the five measured EEG data types, the beta wave data, which are wavelengths that predominantly exhibit tension, excitement and stress, were analyzed separately (Figure 9). By plotting the beta wave data, we confirmed the increasing trend of the stress index of the subject in a specific space.
To objectively find the space where the stress measurement values increased significantly with the largest change, the amount of change in each spatial dataset was calculated and analyzed as time-series data.
The resulting value was calculated from the beta wave data analyzed by comparing it with the recorded VR image data from the subject. The amount of change in the EEG data on the beta waves was visualized. The location of the space where the difference in stress variation was large was confirmed through the following drawings and graphs (Figure 10). The location could also be confirmed visually through the display on the right side of the VR space.
The results of the stress index change analysis were as follows: Because the amount of change immediately after the experiment could be extremely contaminated, data from this time were excluded (the remaining data are summarized in Figure 9). Thus, the stress change amount increased by +280% at 12:35:44, as shown in Figure 10A, and the stress index ranked fourth. The location in Figure 10A was the scene where the subject saw the magnificently arranged staircase and four huge pillars before entering the Mosaic Hall from the Court of Honor (corridor).
At 12:36:12, as shown in Figure 10B, the amount of change was +508%, showing the second-highest index change; this was the scene where the space changed from the Court of Honor (corridor), which was the largest space, through the narrow door leading to the Mosaic Hall.
At 12:37:05, as shown in Figure 10C, the scene where the subject entered the Mosaic Hall with a large wall mosaic decoration, smooth marble floors and high glass ceilings was depicted. It exhibited a +253.4% change. It was found that the stress index increased by +513.9% at 12:37:27 in Figure 10D, which was the part where the subject entered the bunker from the Court of Honor and showed the highest stress index during the experiment.
Finally, Figure 10E at 12:37:38 was the location where the subject stayed in the bunker-type narrow barrel cover, and the change was +435.5%. The results confirmed that the stress indices of the subject increased the most significantly when he was entering the bunker, which was a relatively low space, from a large space with a high floor height.
However, in the case of the first analysis, a partial method was used to check the amount of change by considering only one type of beta wave. Therefore, in the second analysis, a deep-learning algorithm was used to consider all the variables of the EEG signals to analyze the pattern and then find the rank of the section with high stress.

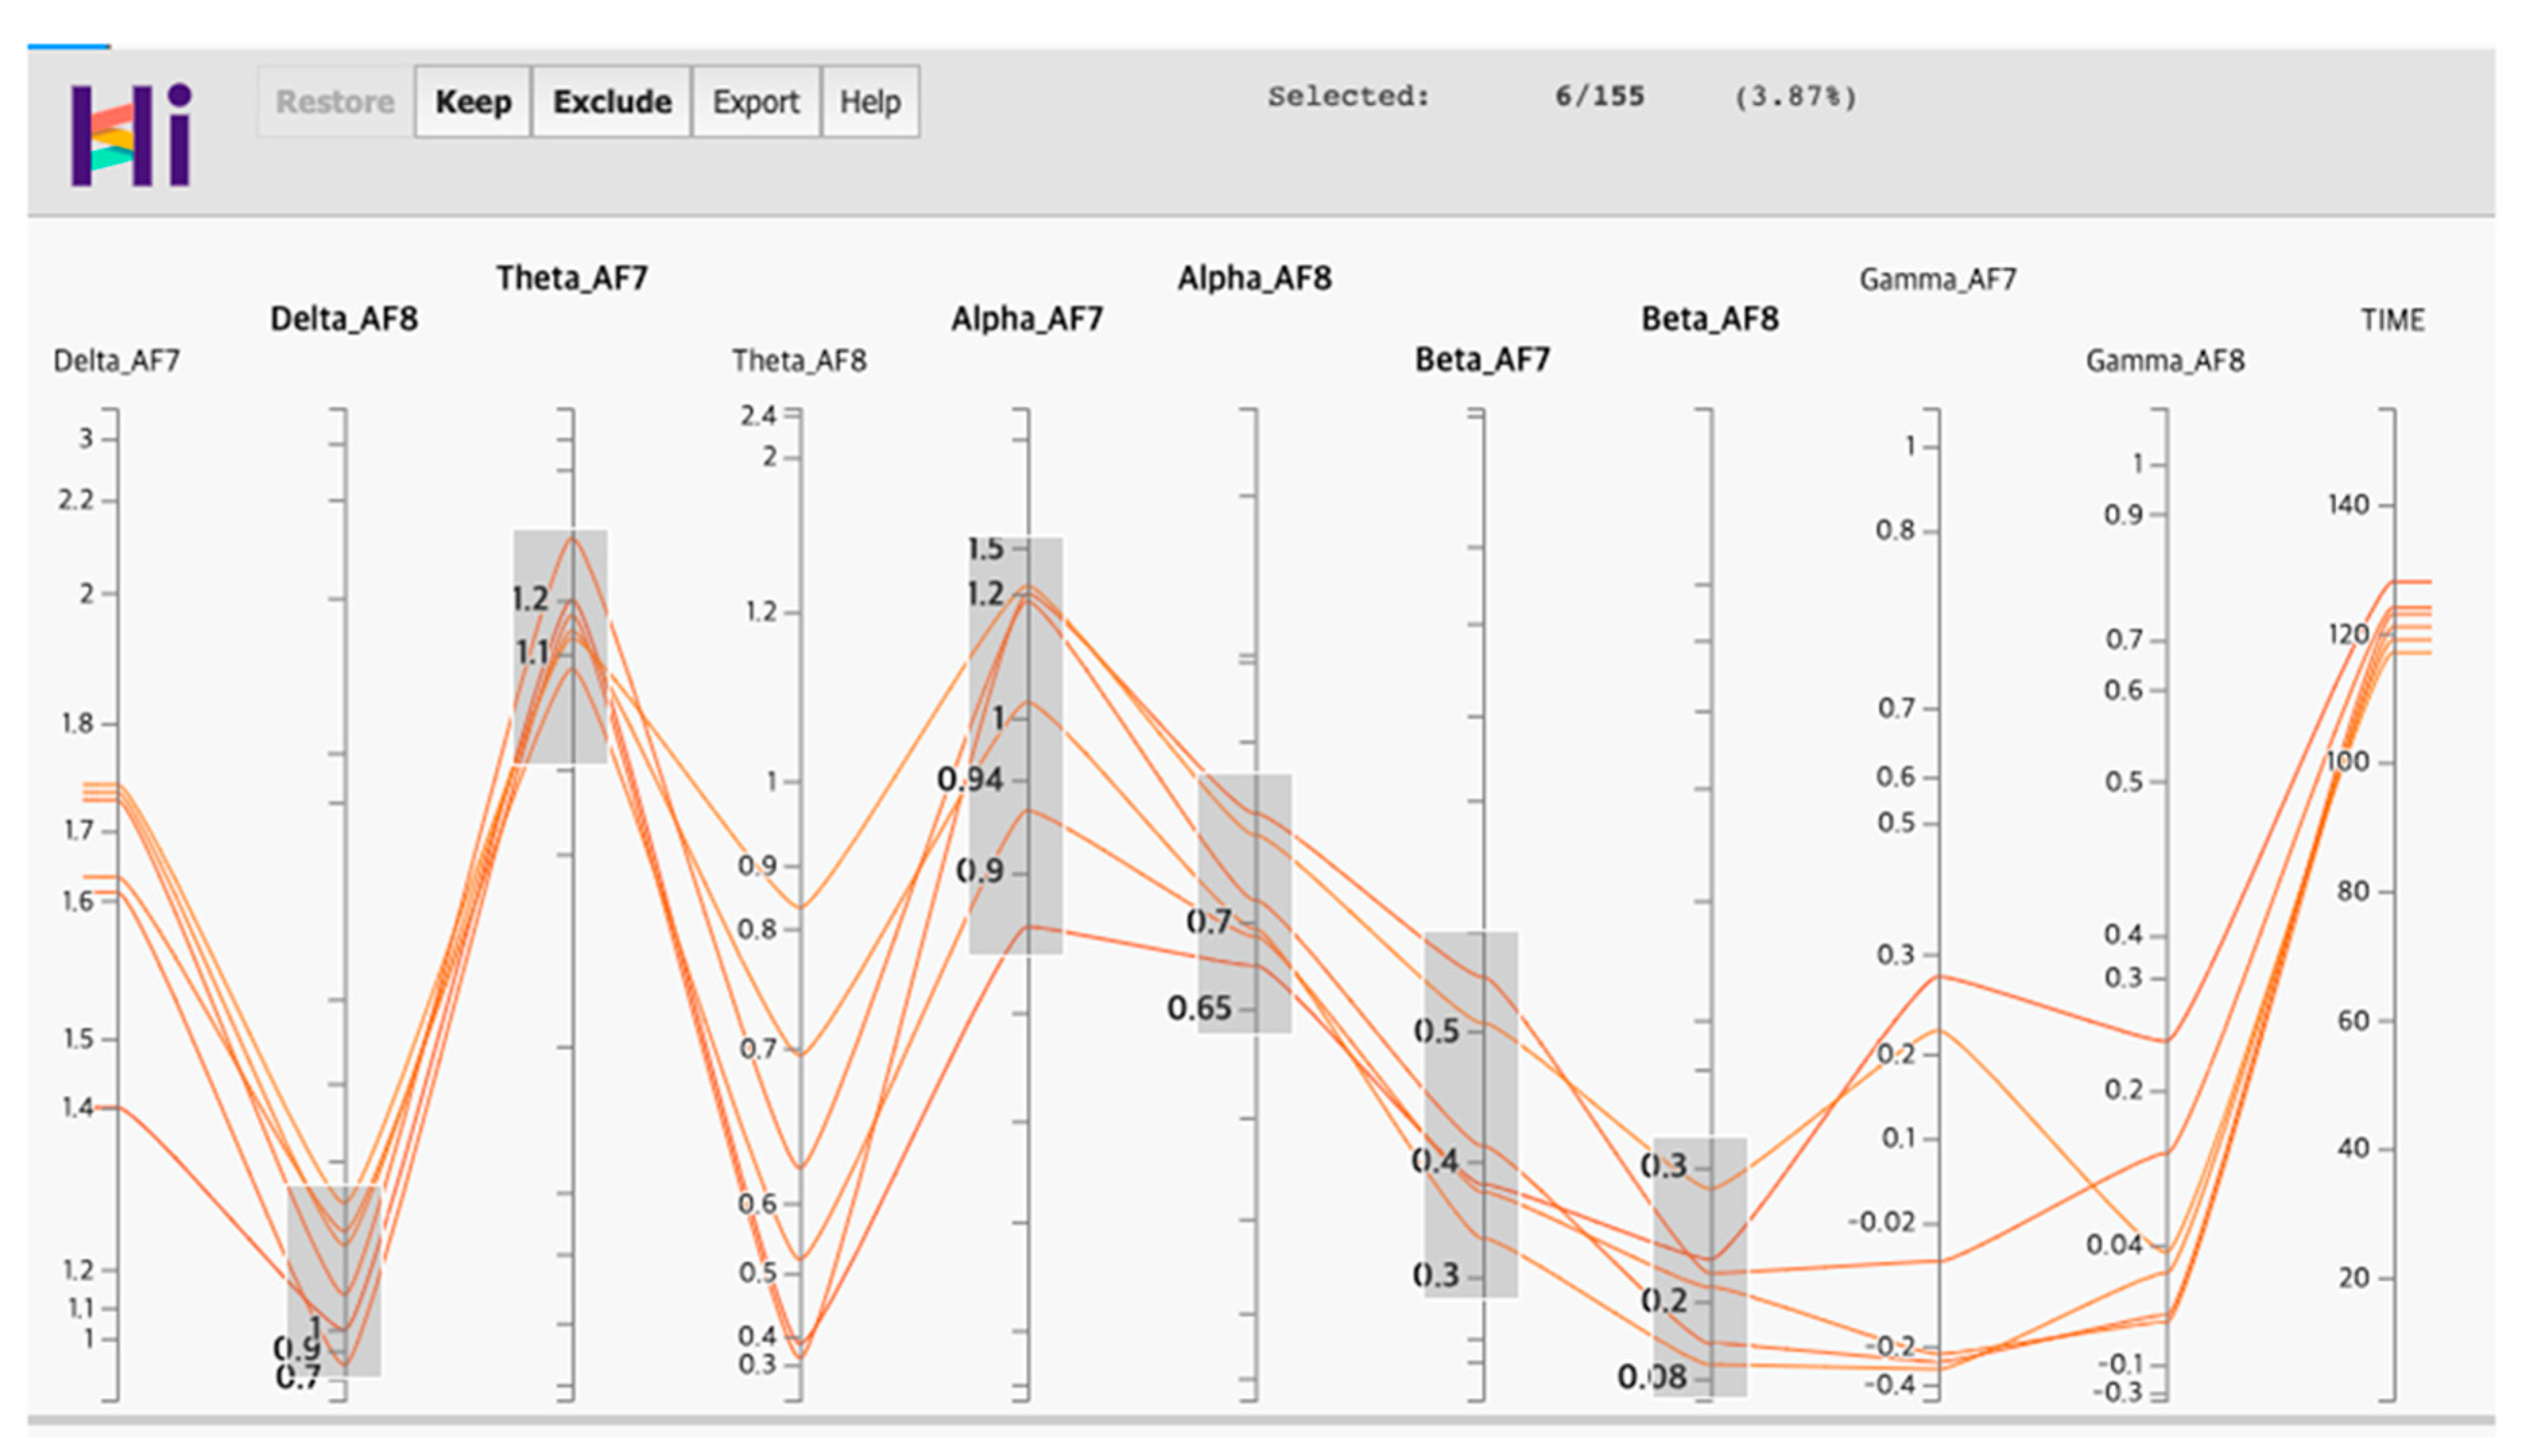
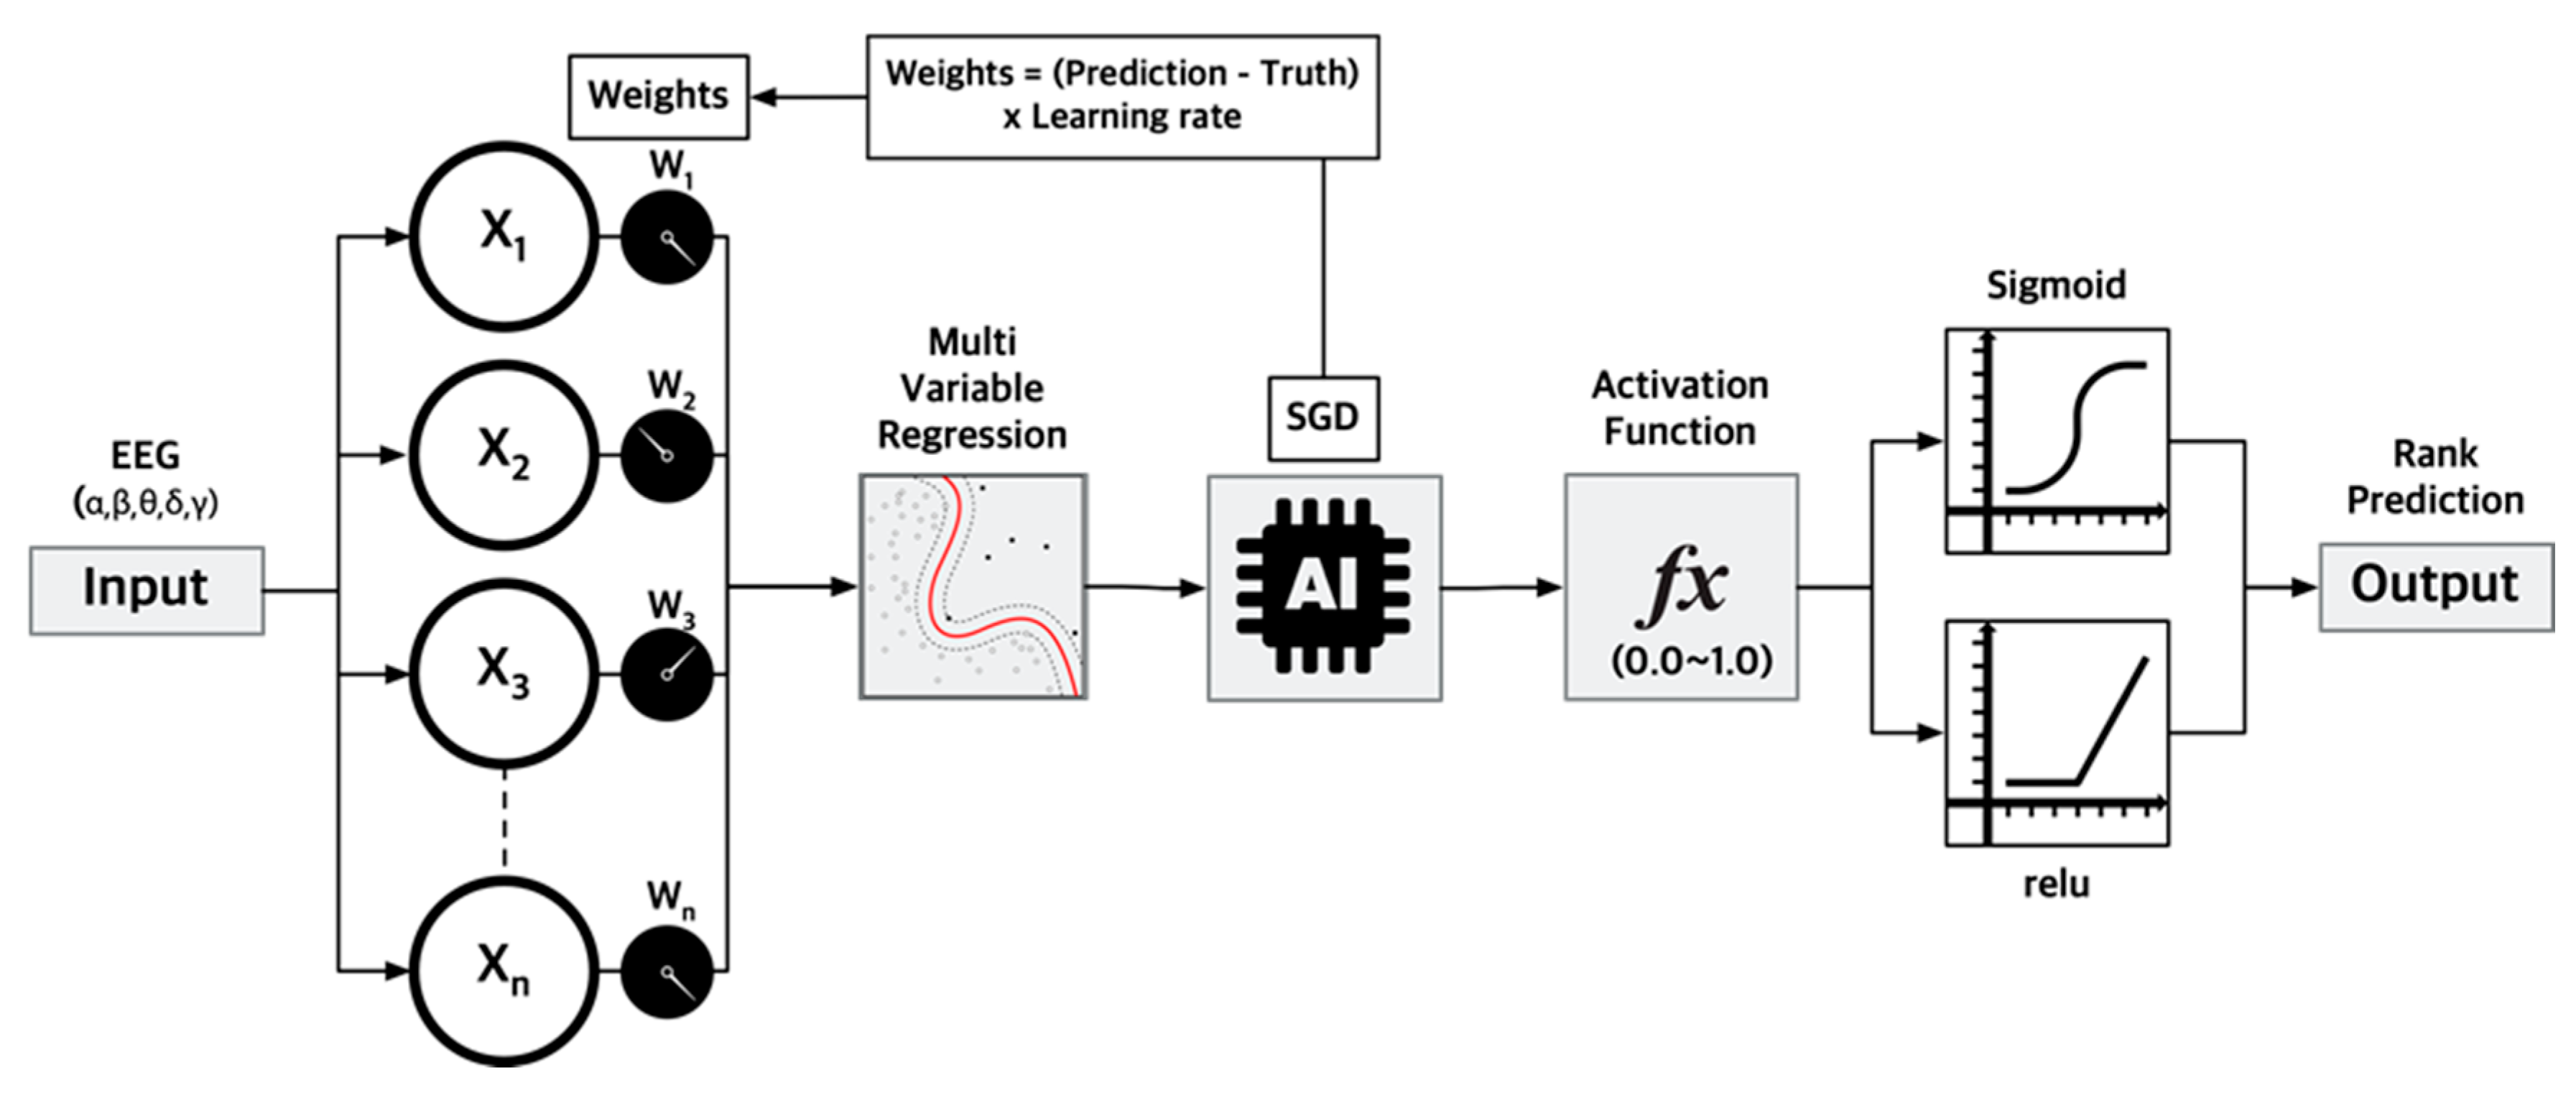
4.2. Secondary Analysis (Alpha, Beta, Theta, Gamma and Delta Waves)

In the first analysis, a high beta wave value that matched the time-series information was calculated. First, to understand the correlation pattern among the collected EEG data, the flow of the pattern of data was analyzed using HiPlot, which was released by the Facebook AI team in early February 2020. HiPlot [41] is an AI interactive visualization tool that serves as a decision-making aid to identify correlations and patterns in data when using parameters with different characteristics before running the AI algorithm.
The graph shown in Figure 11 was expressed by arranging the range values according to the values of each requirement on the x- and y-axes on the 10 EEG parameters necessary for deep-learning training in this experiment. Figure 11 shows that the alpha waves (Alpha_AF7, Alpha_AF8) and beta waves (Beta_AF7, Beta_AF8) were inversely proportional to each other. Delta_AF7 and Theta_AF7 in the left brain position and Delta_AF8 and Theta_AF8 in the right brain position were also inversely proportional.
The general theory is that the beta wave is closely related to stress indicators. For example, when the stress indices of two cases are the same, if the stability index of one case is higher than that of the other case, the feeling of stress for the two conditions will be different. If the sense of stability is high and the stress index is the same, the subject will feel better than when the stability is low. This is called the stress ratio. Data with a low sense of stability and high stress tend to be more effective than finding a case where the stress index is only partially high. Therefore, based on the multivariable linear regression of deep learning, an algorithmic process was developed to calculate the priority of the stress index (Figure 12).
In the next process, the SGD technique and the sigmoid activation function were used to find the region with high stress from multiple inserted parameter values. The SGD technique is an algorithm that calculates the difference between the predicted value and the actual value through deep learning and helps the model with high accuracy in weights. It is used to find the value of the optimal weight for implementing the multivariable linear regression effectively. We used a deep-learning algorithm to consider all 10 insertion variables of the alpha, beta, theta, delta and gamma waveforms of the EEG signals. The sigmoid function is an activation function that can be compared to the ReLU (Rectified Linear Unit) function. It is used to generate results in percentiles between 0.0 and 1.0. The sigmoid function is mainly used for ranking tasks and classifying data, whereas the ReLU function is primarily used for predicting specific values based on past data patterns. We used this function because the experiment required the role of ranking in regions where the stress ratio for emotional information obtained from the EEG data was poor (Figure 13).
➀ (Figure 13) determined the high-stress ranking, ➁ (Figure 13) was the number of training data points, and ➂ (Figure 13) was a weight value that increased the accuracy during repeated training. ➃ (Figure 13) was a scatterplot in which stress information was placed against time information on the x-axis. Based on the scatterplot, the deviation from the rest of the EEG information was used by the deep-learning algorithm to classify the worst time zone information, accuracy and distribution location according to the stress ratio in ➄ (Figure 13). The stress was expressed as “outstanding (>25%)”, “average (25–75%)” and “below average (<75%)”. If the stress was high, it was expressed as “outstanding”, and if the stress was in the region of less than 75% of the samples, it was expressed as “below average”.
The accuracy gradually increased as the training progressed, and the final accuracy value was 90.96%. The number of iterations of the epoch, which indicated the number of trainings in the deep-learning model, was set to 10,000 times. As the number of times increased, the accuracy gradually increased, and the resulting value maintained the highest accuracy of the system after 9300 iterations (Figure 14).
As a result of the first and second analyses of the emotional information from the EEG signals in the VR space, the amount of stress rapidly changed during the transition process of the space when only the beta wave was considered. The secondary analysis predicted the actual stress ratio through the correlation of parameters when alpha, theta, delta and gamma waves were used along with the beta wave. The results showed that the stress indices were intensely high at the entrance and at the beginning of the Mosaic Hall, and they ranked from first to fourth. In the case of the fifth rank, the corresponding index was obtained after the height of the floor in the bunker rapidly decreased (Table 1). Unlike the first analysis, the second analysis showed that the deep-learning algorithm understood and operated the correlation between the attenuated or increasing parameters according to the quantitative index of a positive waveform, such as the alpha wave. The stress index seemed to be concentrated in a specific space (Figure 15).
A t-test was performed to analyze the information on the net stress in the first and second analyses. The t-test results showed that the mean difference in the scores from the first and second analyses was −1.26, where the score in the second analysis was higher than that of the first analysis. The difference in the standard deviation was 0.0542. The paired sample t-test, which shows whether such a difference has a statistical significance, showed that the possibility of the null hypothesis for the first and second analyses being accepted was very low (p < 0.001); thus, the alternative hypothesis had to be accepted. It could be inferred that the net stress index from the second analysis improved with statistical significance when compared to that of the first analysis (Table 2).

5. Conclusions

We analyzed the amount of stress change in a virtual space by reconstructing Adolf Hitler’s Neue Reichskanzlei (translation: New Reich Chancellery) using VR, synchronizing VR equipment and measuring the EEG signals. The virtual chancellery was composed of three spaces with different floor heights—the Court of Honor, the Mosaic Hall and the bunker. Subsequently, an EEG experiment was conducted to help the subject experience the virtual building while measuring the EEG signals from the subject and collecting data. Using the acquired EEG data, data were preprocessed by considering the characteristics of big data, and two analysis methods were used to analyze the emotional state and identify regions with high stress. The following conclusions were drawn:
  • The results of similar data demonstrated that the building was indeed designed to induce feelings of grandiosity and trepidation and that the feelings experienced by the president of Czechoslovakia, who had a heart attack in the residence, were obtained.
  • The results of the stress index analysis based on the EEG data revealed that when the subject sensed changes in pressure in the high floor space as he moved from a higher floor to a lower floor, he experienced changes in space, which were reflected by an increase in the stress index, indicating that the subject was in a psychologically tense state.
  • Comparing EEG data from the subject moving from the Court of Honor with a 25 m tall floor to the Führerbunker with a 3 m tall floor, the total intensity of the beta wave, which is related to stress, was found to be relatively large when the spaces changed. The graph of the experimental results showed that the most significant change in stress was observed when the subject entered the Führerbunker, with a 3 m high floor, from the Mosaic Hall, with a 15 m high floor, owing to these spaces having the largest floor difference.
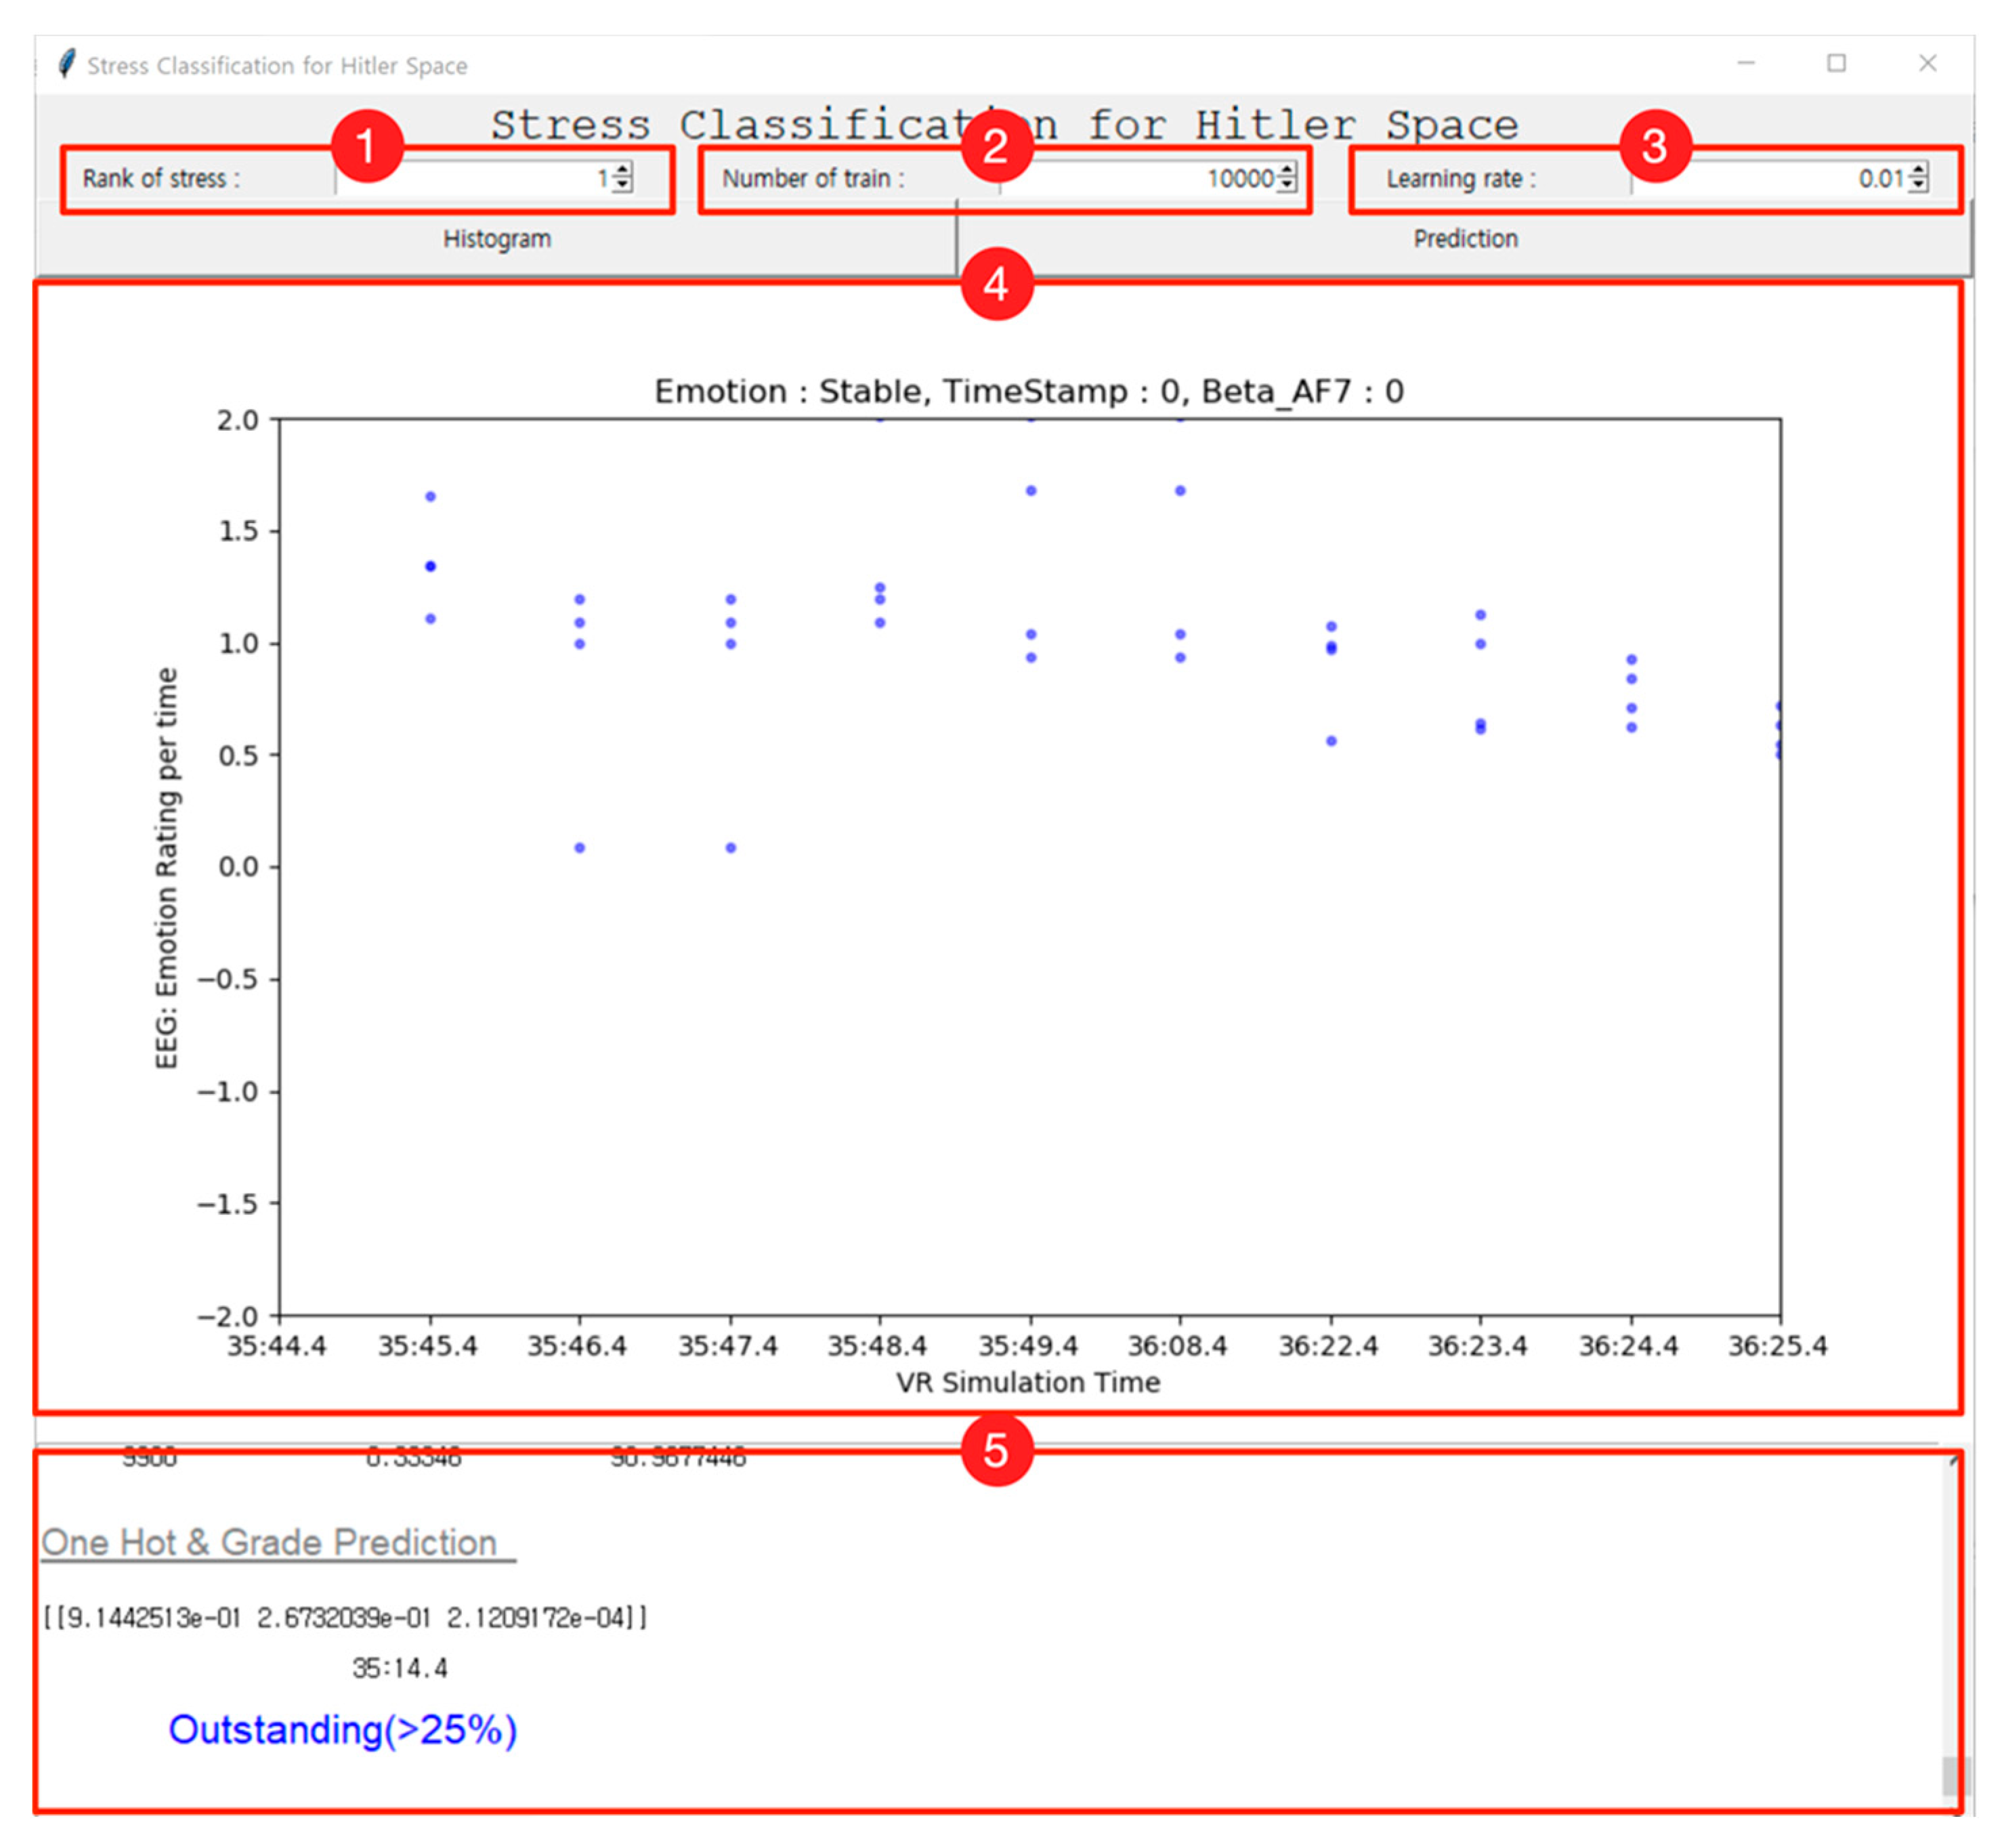
  • Two methods were used to analyze the emotions that the user felt in the VR space based on the EEG signals: a method of expressing unpleasant regions according to time information based on the beta wave that represented stress among the EEG signals and a method of operating deep learning to predict the stress ratio through a correlation analysis of all EEG signals by ranking the regions according to the level of stress. A comparison of the results of the two analysis methods revealed different results from each datum. The first analysis showed that the amount of changes in the beta wave index were high during spatial transitions. In the second analysis (stress ratio analysis), the index was found to be high in the spatial transition at the entrance to and inside the Mosaic Hall. Particularly notably, the corresponding index was high in the space where the subject entered a 15 m high floor through a narrow entrance. Both results were meaningful for analyzing an architectural space. However, in the VR space, we found it necessary to analyze the positive indices through the linking process of the EEG signals or the stagnation of pupils on certain architectural design elements. Therefore, in future research, a VR experiment of a building space must be performed by fusing eye-tracking equipment with VR and EEG equipment. Accordingly, the effective pattern must be calculated by integrating the process for data collection by the sensors of each piece of equipment through integration with deep learning.
Furthermore, to minimize physical contact between the EEG and VR gear during experiments where several pieces of equipment are used simultaneously, research and development must be conducted by constructing a combination of two pieces of equipment, an HTC Vive with EEG sensors, inside the VR head strap. Additionally, to allow for data stabilization, EEG measurements must be conducted using gel-type sensor nodes. Instead of the example in this study, a domestic place such as the National Intelligence Service’s anticommunist room, which is a representative site of dark tourism that can be experienced in a space in reality, must be used. By selecting such a place, the elements of each space and the human sensibility felt in that space can be compared in a future study.

Author Contributions

Conceptualization, S.Y.J. and S.Y.K.; methodology, S.Y.J. and H.J.J.; Introduction, S.Y.K.; Theoretical Background, H.J.J.; Research Methodology S.Y.J.; Results, H.J.J.; writing—original draft preparation, S.Y.J. and S.Y.K.; writing—review and editing, H.J.J. All authors have read and agreed to the published version of the manuscript.

Funding

This work was supported by the National Research Foundation of Korea(NRF) grant funded by the Korea government. (2019R1A2C1088896).

Conflicts of Interest

The authors declare no conflict of interest.

References

  1. Kim, Y.; Jun, M. A Study on characteristics of monumental expressions in the contemporary architecture. J. Arch. Inst. Korea Plan. Des. 1999, 19, 499–504. [Google Scholar]
  2. NDR. Umtriebig und Umstritten: Architekt Cäsar Pinnau. Abgerufen am 9. 2020. Available online: https://www.ndr.de/geschichte/Caesar-Pinnau-ein-umstrittener-Architekt,pinnau104.html (accessed on 5 April 2020).
  3. Florian Müller-Klug: Hitlers Büros in Berlin—Teil 1: Die Reichskanzlei und die Neue Reichskanzlei. In: Clio Berlin Blog, 14. 2014. Available online: https://clioberlin.de/blog-architektur/70-hitlers-bueros-in-berlin-teil-1-reichskanzlei-und-neue-reichskanzlei.html (accessed on 20 April 2020).
  4. Dobesberger, J.; Walser, G.; Unterberger, I.; Embacher, N.; Luef, G.; Bauer, G.; Benke, T.; Bartha, L.; Ulmer, H.; Ortler, M.; et al. Genital automatisms: A video-EEG study in patients with medically refractory seizures. Epilepsia 2004, 45, 777–780. [Google Scholar] [CrossRef] [PubMed]
  5. Sudjic, D. The Edifice Complex: The Architecture of Power; Penguin; Jakkajungsin: Seoul, Korea, 2011. [Google Scholar]
  6. Hwang, Y.; Kim, S.; Kim, J. An analysis of youth EEG based on the emotional color scheme images by different space of community facilities. J. Korean Inst. Int. Des. 2013, 22, 171–178. [Google Scholar] [CrossRef]
  7. Song, M.; Yoon, S.; Kim, K. A Study on the impacts of the experiential factors of architectural media interaction on the selective attributes. J. Arch. Inst. Korea 2016, 36, 67–68. [Google Scholar]
  8. Strijkstra, A.M.; Beersma, D.G.; Drayer, B.; Halbesma, N.; Daan, S. Subjective sleepiness correlates negatively with global alpha (8–12 Hz) and positively with central frontal theta (4–8 Hz) frequencies in the human resting awake electroencephalogram. Neurosci. Lett. 2003, 340, 17–20. [Google Scholar] [CrossRef]
  9. Song, M.; Shin, H.; Baek, G.; Kim, H.; Kook, C. A basic study on the characteristics of the electroencephalogram corresponded with the evaluating words of sound scape sound source. KIEAE J. 2011, 11, 49–56. [Google Scholar]
  10. Basar, E.; Basar-Eroglu, C.; Karakas, S.; Schurmann, M. Are cognitive processes manifested in event-related gamma, alpha, theta and delta oscillations in the EEG? Neurosci. Lett. 1999, 259, 165–168. [Google Scholar] [CrossRef]
  11. Krigolson, E.; Williams, C.; Norton, A.; Hassall, D.; Colino, L. Choosing MUSE: Validation of a Low-Cost, Portable EEG System for ERP Research. Front. Neurosci. 2017, 11, 1–10. [Google Scholar] [CrossRef] [Green Version]
  12. Lee, G.; Kim, D.; Choi, C. Electroencephalogram; Korea Medical Book Publishing Company: Seoul, Korea, 2001; pp. 1–5. [Google Scholar]
  13. Al-Shargie, F.M.; Tong, B.T.; Nasreen, B.; Masashi, K. Mental stress quantification using EEG signals. In Proceedings of the International Conference for Innovation in Biomedical Engineering and Life Sciences, Putrajaya, Malaysia, 6–8 December 2015; Springer: Singapore, 2015; pp. 15–19. [Google Scholar]
  14. Al-Shargie, F.; Tong, B.T.; Nasreen, B.; Masashi, K. Towards multilevel mental stress assessment using SVM with ECOC: An EEG approach. Med. Biol. Eng. Comput. 2018, 56, 125–136. [Google Scholar] [CrossRef]
  15. Al-Shargie, F.; Tong, B.T.; Masashi, K. Assessment of mental stress effects on prefrontal cortical activities using canonical correlation analysis: An fNIRS-EEG study. Biomed. Opt. Express 2017, 8, 2583–2598. [Google Scholar] [CrossRef]
  16. Al-Shargie, F.; Masashi, K.; Nasreen, B.; Sarat, C.D.; Ahmad, F.M.H.; Tong, B.T. Mental stress assessment using simultaneous measurement of EEG and fNIRS. Biomed. Opt. Express 2016, 7, 3882–3898. [Google Scholar] [CrossRef] [Green Version]
  17. Kim, J.Y.; Lee, H.S. A Study on Interior Wall Color based on Measurement of Emotional Responses. Korean Soc. Emot. Sensib. 2009, 12, 205–214. [Google Scholar]
  18. Rhu, J.S.; Lee, J.S. Correlation Analysis of Emotional Adjectives and EEG to Apply Color to the Indoor Living Space. J. Korean Soc. Color Stud. 2015, 29, 25–35. [Google Scholar]
  19. Kim, H.S.; Lym, J.H.; Kim, H.T.; Kim, H.S.; Gwak, W.T.; Kim, J.H. Effect of Thermal Environment and Illuminance on the Occupants Works based on the Electroencephalogram and Electrocardiogram Analysis. Sci. Emot. Sensib. 2014, 17, 95–106. [Google Scholar] [CrossRef]
  20. Kim, Y.J.; Shin, D.J.; Kim, J.Y. A study on the characteristics on brain wave of indoor space lighting by EEG experiment. J. Korea Inst. Spat. Des. 2019, 14, 71–79. [Google Scholar]
  21. Maghelal, P.; Prathiba, N.; Jody, R.N.; Byoung-Suk, K. Investigating the Use of Virtual Reality for Pedestrian Environments. J. Arch. Plan. Res. 2011, 28, 104–117. [Google Scholar]
  22. Hollander, J.B.; Foster, V. Brain Responses to Architecture and Planning: A Neuro-Assessment of the Pedestrian Experience in Boston, Massachusetts. Arch. Sci. Rev. 2016, 59, 474–481. [Google Scholar] [CrossRef]
  23. McKinsey Global Institute. Big Data: The Next Frontier for Innovation, Competition and Productivity. Available online: https://bigdatawg.nist.gov/pdf/MGI_big_data_full_report.pdf (accessed on 5 April 2020).
  24. Shin, Y. A basic study for the sense of real improvement in virtual reality. J. Arch. Inst. Korea Plan. Des. Sect. 2005, 21, 11–18. [Google Scholar]
  25. Kim, J.; Chang, S.; Jun, H. Comparison of reality and virtual reality spatial electroencephalogram measurement data. J. Arch. Inst. Korea 2018, 38, 107–110. [Google Scholar] [CrossRef]
  26. Moon, J. The study on the applicability of virtual reality headset to space design field through focus group interviews. J. Integr. Des. Res. 2014, 13, 33–44. [Google Scholar] [CrossRef]
  27. Lin, C.H.; Hsu, P.H. Integrating procedural modelling process and immersive VR environment for architectural design education. MATEC Web Conf. 2017, 104. [Google Scholar] [CrossRef]
  28. Mccomas, J.; Pivik, J.; Laflamme, M. Children’s transfer of spatial learning from virtual reality to real environments. Cyberpsychol. Behav. 1998, 1, 115–122. [Google Scholar] [CrossRef]
  29. Ken, P.; Matthias, J.G.; Sarah, P.; Lukas, M.; Daniel, B.; Florian, A. Behavioural Biometrics in VR: Identifying People from Body Motion and Relations in Virtual Reality. In Proceedings of the 2019 ACM CHI Conference on Human Factors in Computing Systems (CHI’19), Glasgow, Scotland, UK, 4–9 May 2019; pp. 110:1–110:12. [Google Scholar] [CrossRef]
  30. Colin, E. Places of the Heart: The Psychogeography of Everyday Life; Bellevue Literary Press, NYU School of Medicine: New York, NY, USA, 2016. [Google Scholar]
  31. Freeman, D.; Reeve, S.; Robinson, A.; Ehlers, A.; Clark, D.; Spanlang, B.; Slater, M. Virtual reality in the assessment, understanding, and treatment of mental health disorders. Psychol. Med. 2017, 47, 2393–2400. [Google Scholar] [CrossRef] [PubMed]
  32. An, T.; Kim, M. Single person household and producing VR content Korean single person household and HMD. Korea Inst. Des. Res. Soc. 2016, 1, 21–28. [Google Scholar]
  33. Muse Headband. Available online: https://choosemuse.com (accessed on 2 February 2019).
  34. Balconi, M.; Crivelli, D. Handbook of Sport Neuroscience and Psychophysiology; Routledge: Abingdon-on-Thames, UK, 2019; pp. 40–69. [Google Scholar]
  35. Park, J.; Kang, S.; Lee, B.; Kang, U.; Lee, Y. Design of user concentration classification model by EEG analysis based on visual SCPT. J. Korea Soc. Comput. Inf. 2018, 23, 129–135. [Google Scholar]
  36. Denoising EEG Brainwaves with Machine Learning. Available online: https://blog.goodaudience.com/denoising-eeg-brainwaves-with-machine-learning-239598740f09 (accessed on 20 February 2020).
  37. Salazar, A.; Vergara, L.; Miralles, R. On including sequential dependence in ICA mixture models. Signal Process. 2010, 90, 2314–2318. [Google Scholar] [CrossRef]
  38. Safont, G.; Salazar, A.; Vergara, L.; Gómez, E.; Villanueva, V. Multichannel dynamic modeling of non-Gaussian mixtures. Pattern Recog. 2019, 93, 312–323. [Google Scholar] [CrossRef]
  39. Som, M.G.; Heo, G.; Choi, J.I. Development of Visualization and Statistical Analytics System for Electric Power using Tableau. Proc. Korean Inst. Inf. Sci. Eng. Conf. 2017, 3, 16–18. [Google Scholar]
  40. Tableau. Available online: www.Tableau.com (accessed on 4 February 2020).
  41. Zhao, H. Facebook HiPlot ‘Makes Understanding High Dimensional Data Easy’, SyncedReview. Available online: https://syncedreview.com/2020/02/03/facebook-hiplot-makes-understanding-high-dimensional-data-easy/ (accessed on 4 February 2020).
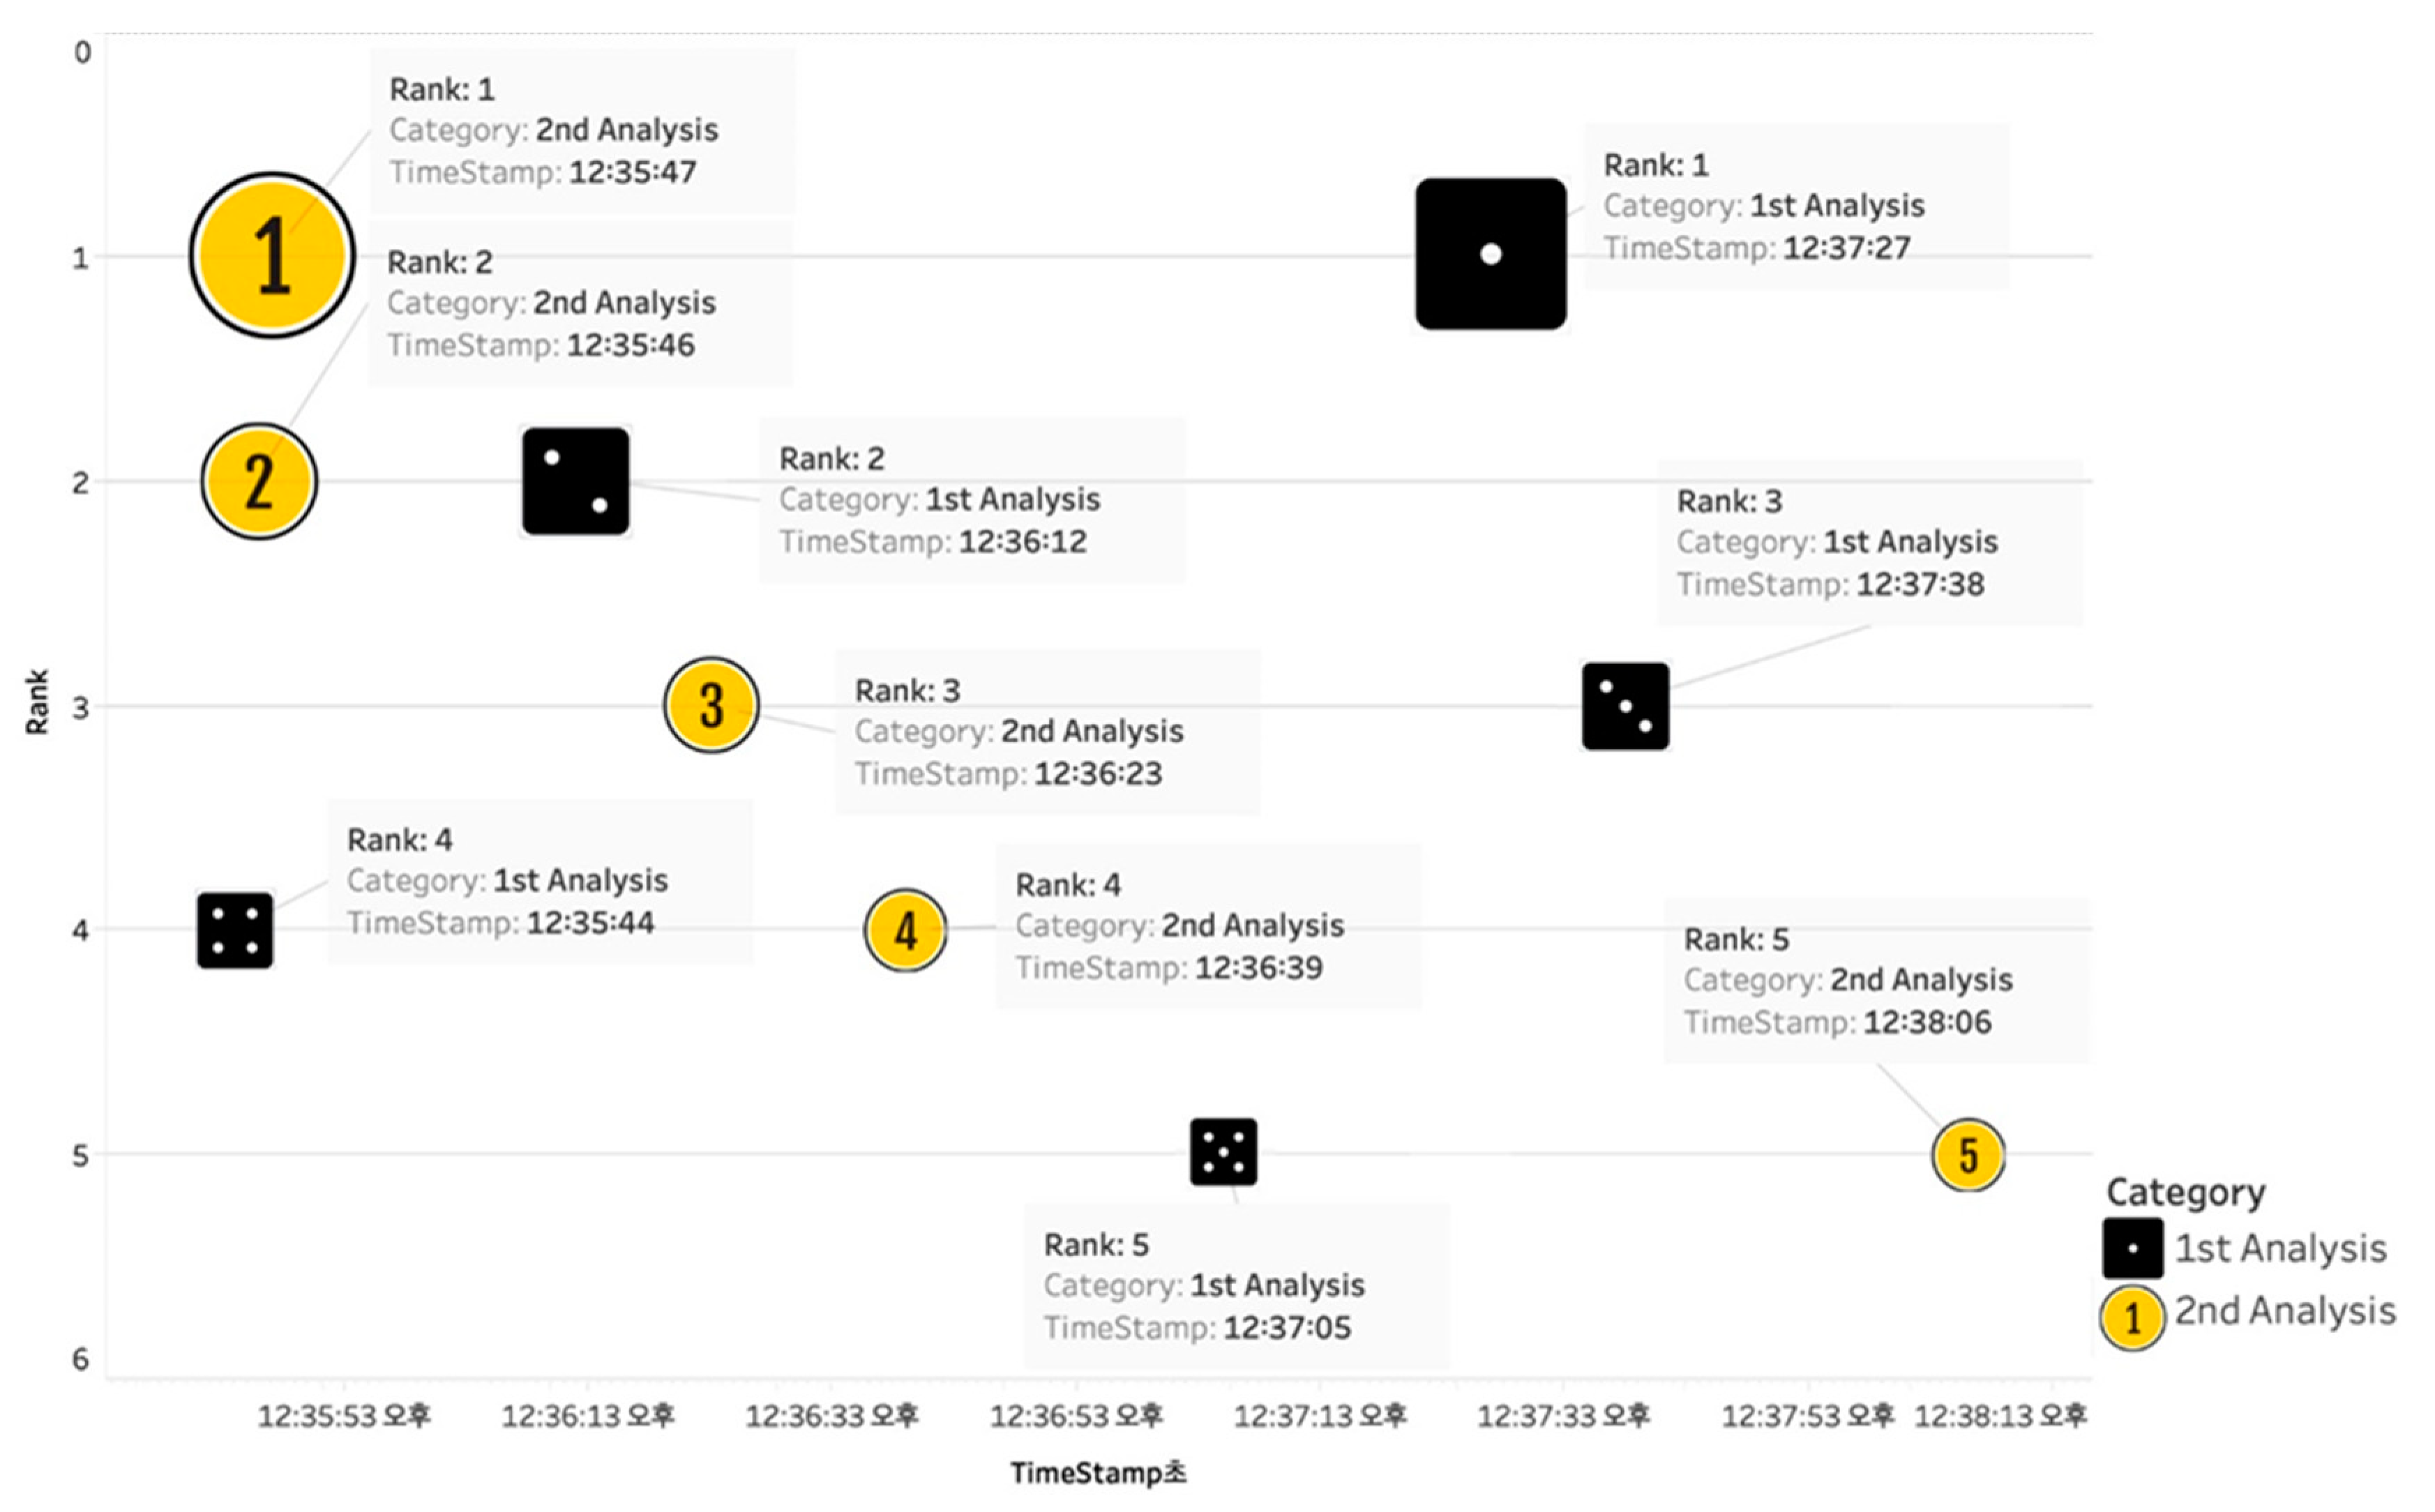
Figure 1. The Neue Reichskanzlei: Adolf Hitler’s New Reich Chancellery ((A)—Court of honor: Bundesarchiv, Bild 183-E00418/CC-BY-SA 3.0; (B)—Court of honor and Mosaic hall transition space: Bundesarchiv, Bild 146-1985-064-29A/CC-BY-SA 3.0; (C)—Mosaic hall: Bundesarchiv, Bild 183-K1216-501/CC-BY-SA 3.0; (D)—Führerbunker: © Robert Conrad, Bunker Neue Reichskanzlei, Bild 6086).
Sustainability 12 06716 g001
Figure 2. The demolished Führerbunker in the garden of the razed Reich Chancellery, Berlin (Bundesarchiv, Bild 183-V04744/CC-BY-SA 3.0; Bundesarchiv, Bild 183-M1204-319/CC-BY-SA 3.0).
Sustainability 12 06716 g002
Figure 3. Diagram of the main research process.
Sustainability 12 06716 g003
Figure 4. Electroencephalogram (EEG) international system (IS) electrode placement (Muse) and Muse Monitor.
Sustainability 12 06716 g004
Figure 5. Experimental measurement.
Sustainability 12 06716 g005
Figure 6. Experiment and measurement process.
Sustainability 12 06716 g006
Figure 7. The Neue Reichskanzlei and three-dimensional orthographic projection ((A)—Court of honor; (B)—Court of honor and Mosaic hall transition space; (C)—Mosaic hall; (D)—Mosaic hall and Führerbunker transition space).
Sustainability 12 06716 g007
Figure 8. Visualization of EEG (AF) data.
Sustainability 12 06716 g008
Figure 9. Beta wave visualization data.
Sustainability 12 06716 g009
Figure 10. Beta wave variation graph and location ((A)—Court of honor; (B)—Court of honor and Mosaic hall transition space; (C)—Mosaic hall; (D)—Mosaic hall and Führerbunker transition space; (E)—Führerbunker).
Sustainability 12 06716 g010
Figure 11. Correlation analysis of the EEG input data using HiPlot.
Sustainability 12 06716 g011
Figure 12. Process of the deep-learning-based algorithm to calculate the priority of the stress index.
Sustainability 12 06716 g012
Figure 13. Deep-learning platform for calculating stress rankings for VR experience data.
Sustainability 12 06716 g013
Figure 14. Primary deep-learning programming and training accuracy verification of the platform.
Sustainability 12 06716 g014
Figure 15. Comparison of the first and second analytical data.
Sustainability 12 06716 g015
Table 1. Comparison of the first and second analytical data.
RankingHigh Stress Time in First ExperimentSpace LocationHigh Stress Time in Second ExperimentSpace Location
112:37:27 p.m.Mosaic hall and Führerbunker transition space12:37:27 p.m.Court of honor and Mosaic hall transition space
212:36:12 p.m.Court of honor and Mosaic hall transition space12:36:12 p.m.Court of honor and Mosaic hall transition space
312:37:38 p.m.Führerbunker12:37:38 p.m.Mosaic Hall
412:35:44 p.m.Court of Honor 12:35:44 p.m.Mosaic Hall
512:37:05 p.m.Court of honor and Mosaic hall transition space12:37:05 p.m.Führerbunker
Table 2. Comparison of t-test results.
Paired Samples t-test
StatisticDf.pMean DifferenceSE Difference
First AnalysisSecondary analysisStudent’s t−23.2154<0.001−1.260.0542

