Influence of Indoor Climate on Employees in Office Buildings—A Case Study

 ,
,  , ,
, ,
Abstract
1. Introduction
2. Materials and Methods
2.1. Site Description
2.2. Objective Measurement
2.3. Subjective Evaluation
3. Results and Discussion
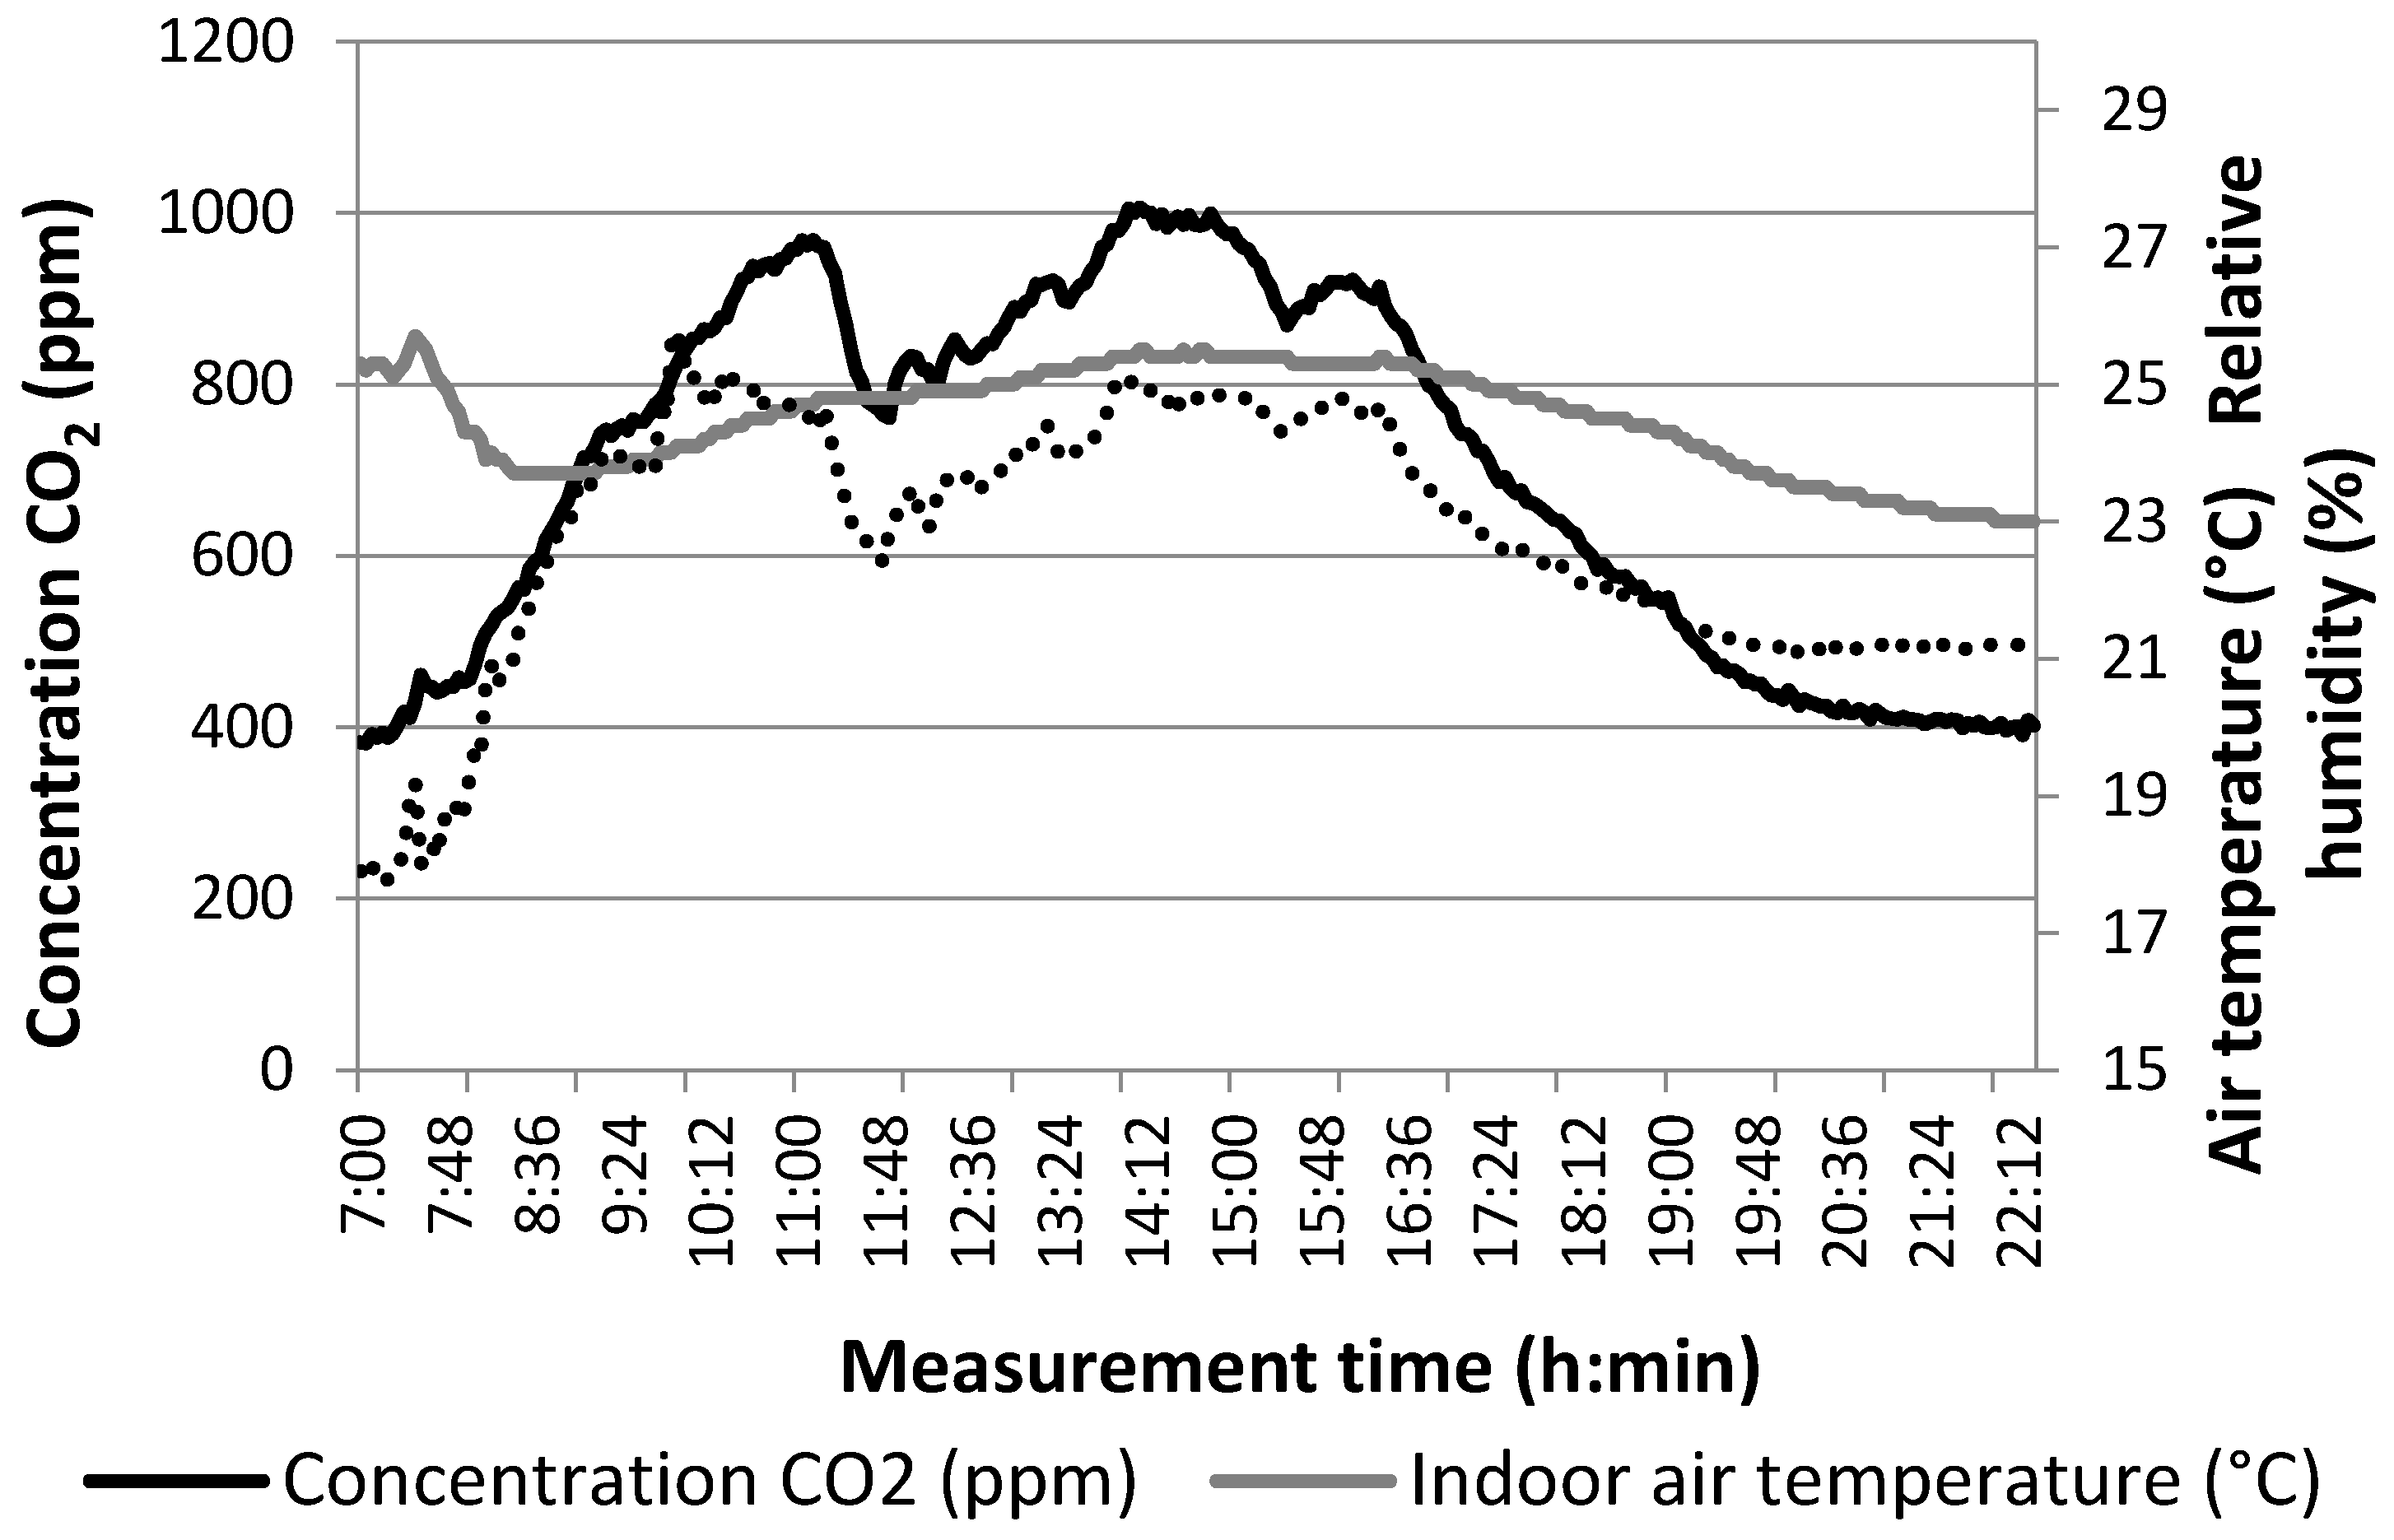
3.1. Office A
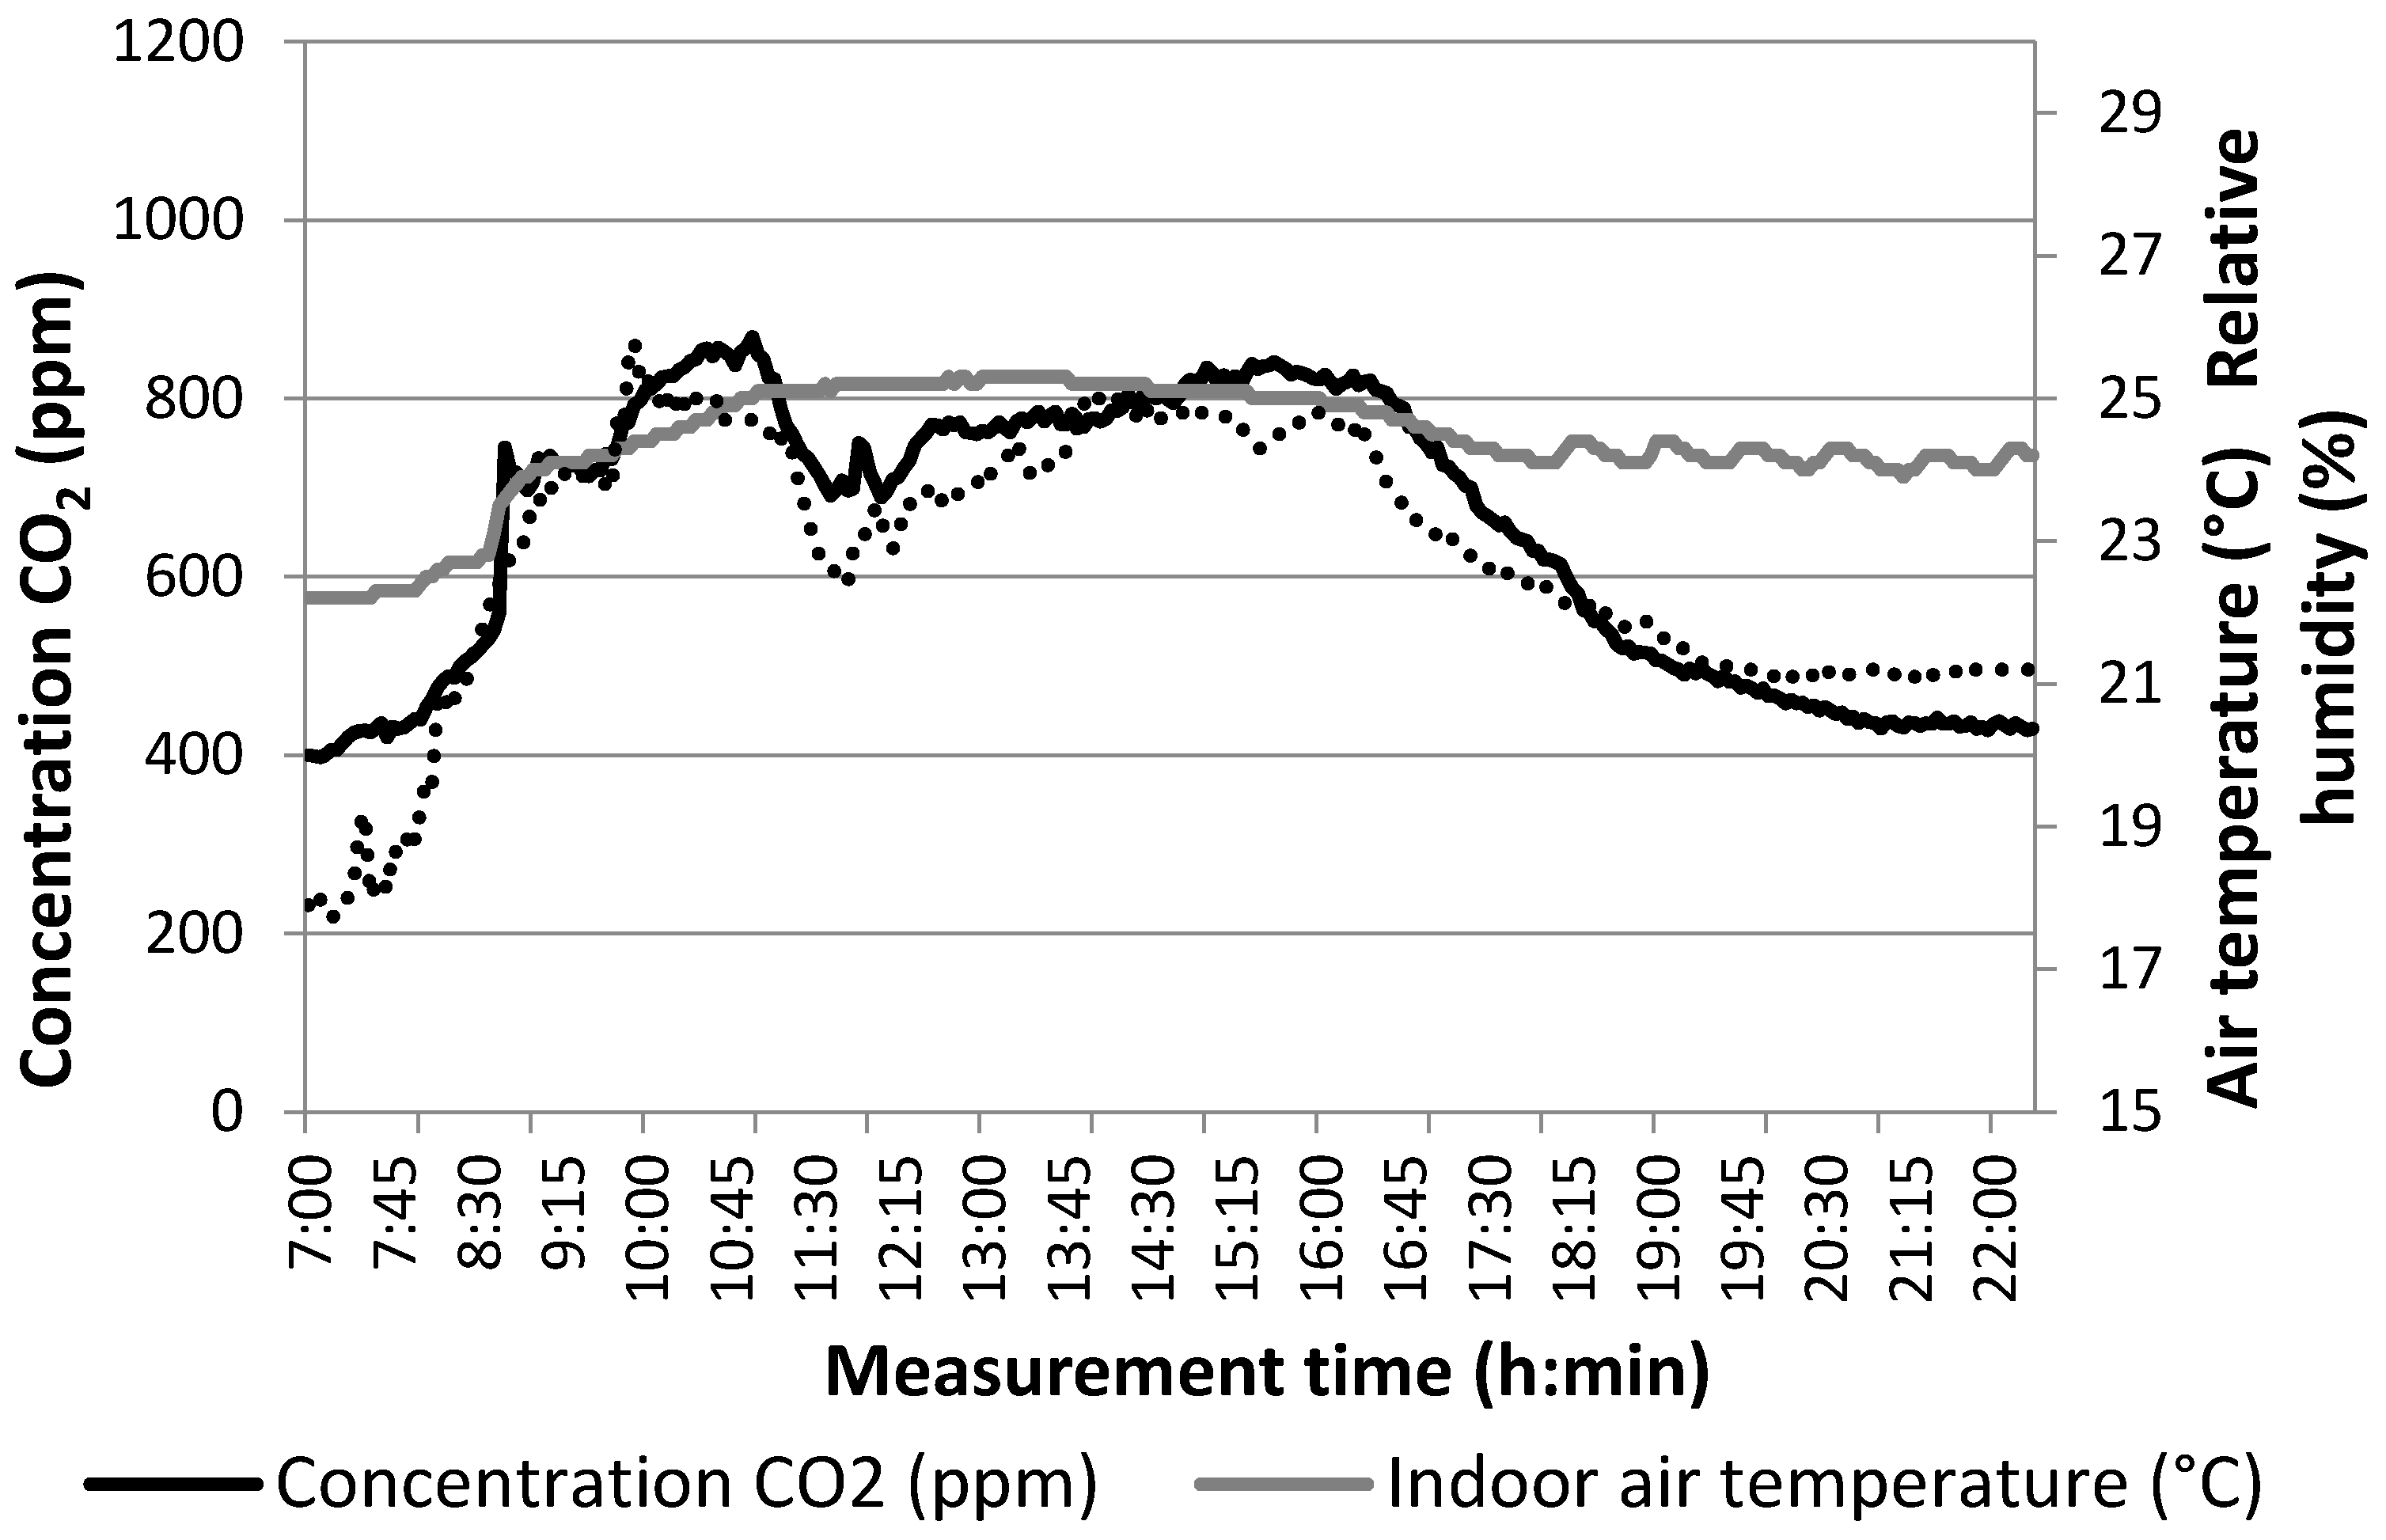
3.2. Office B
3.3. Office C
3.4. Human Pulse
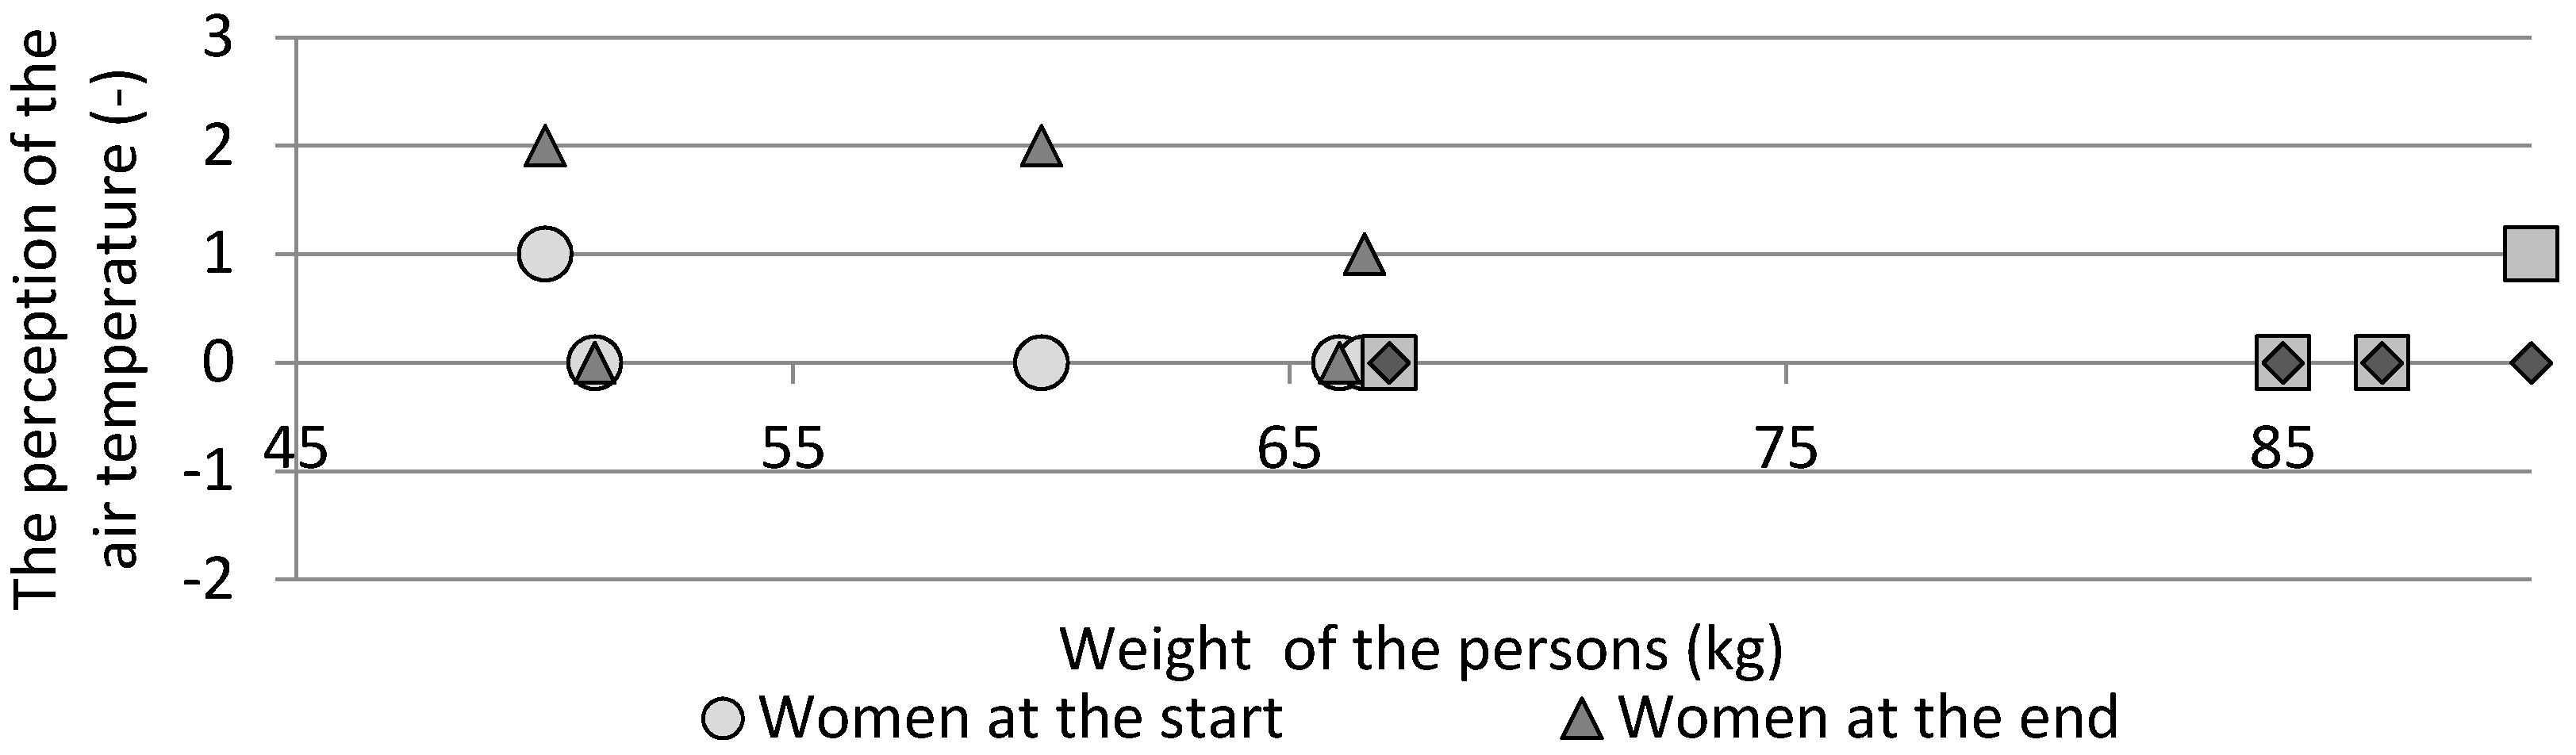
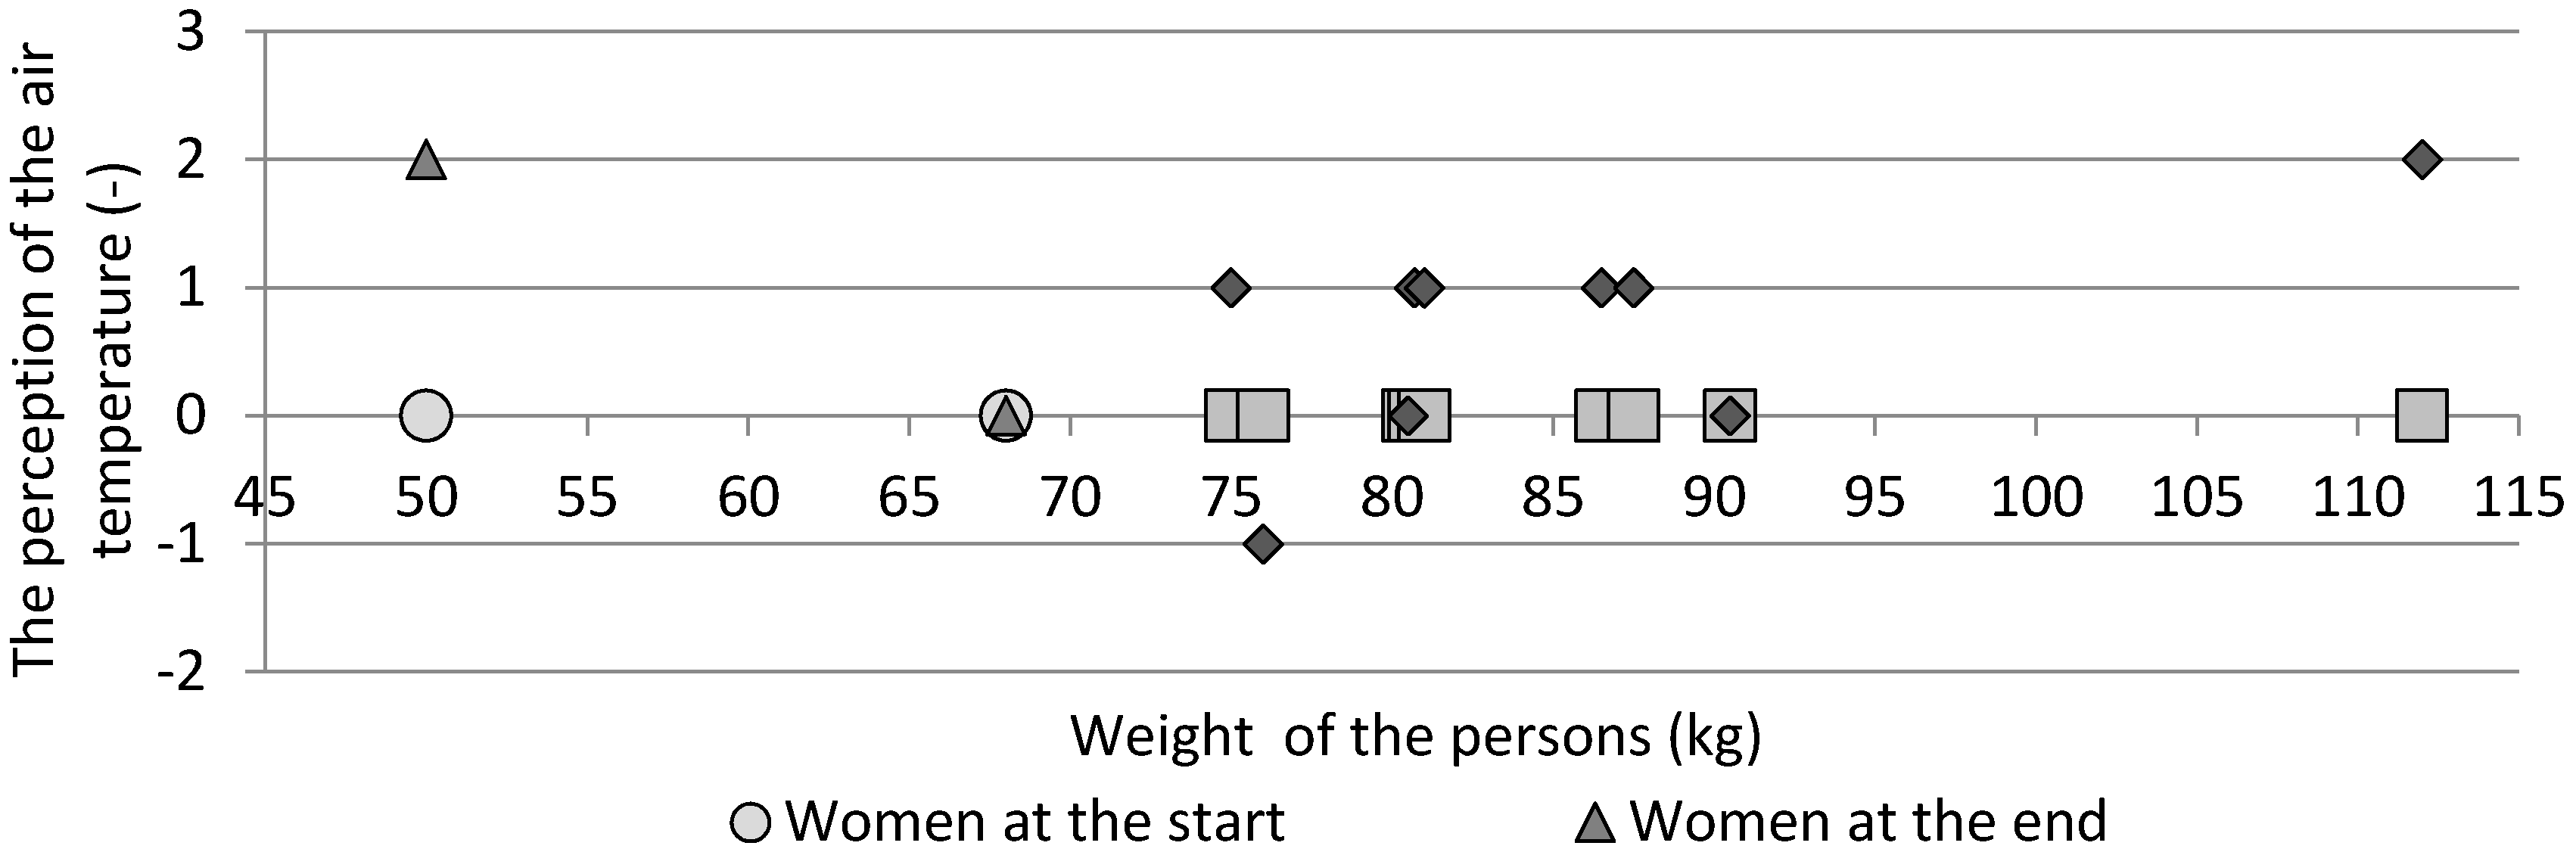
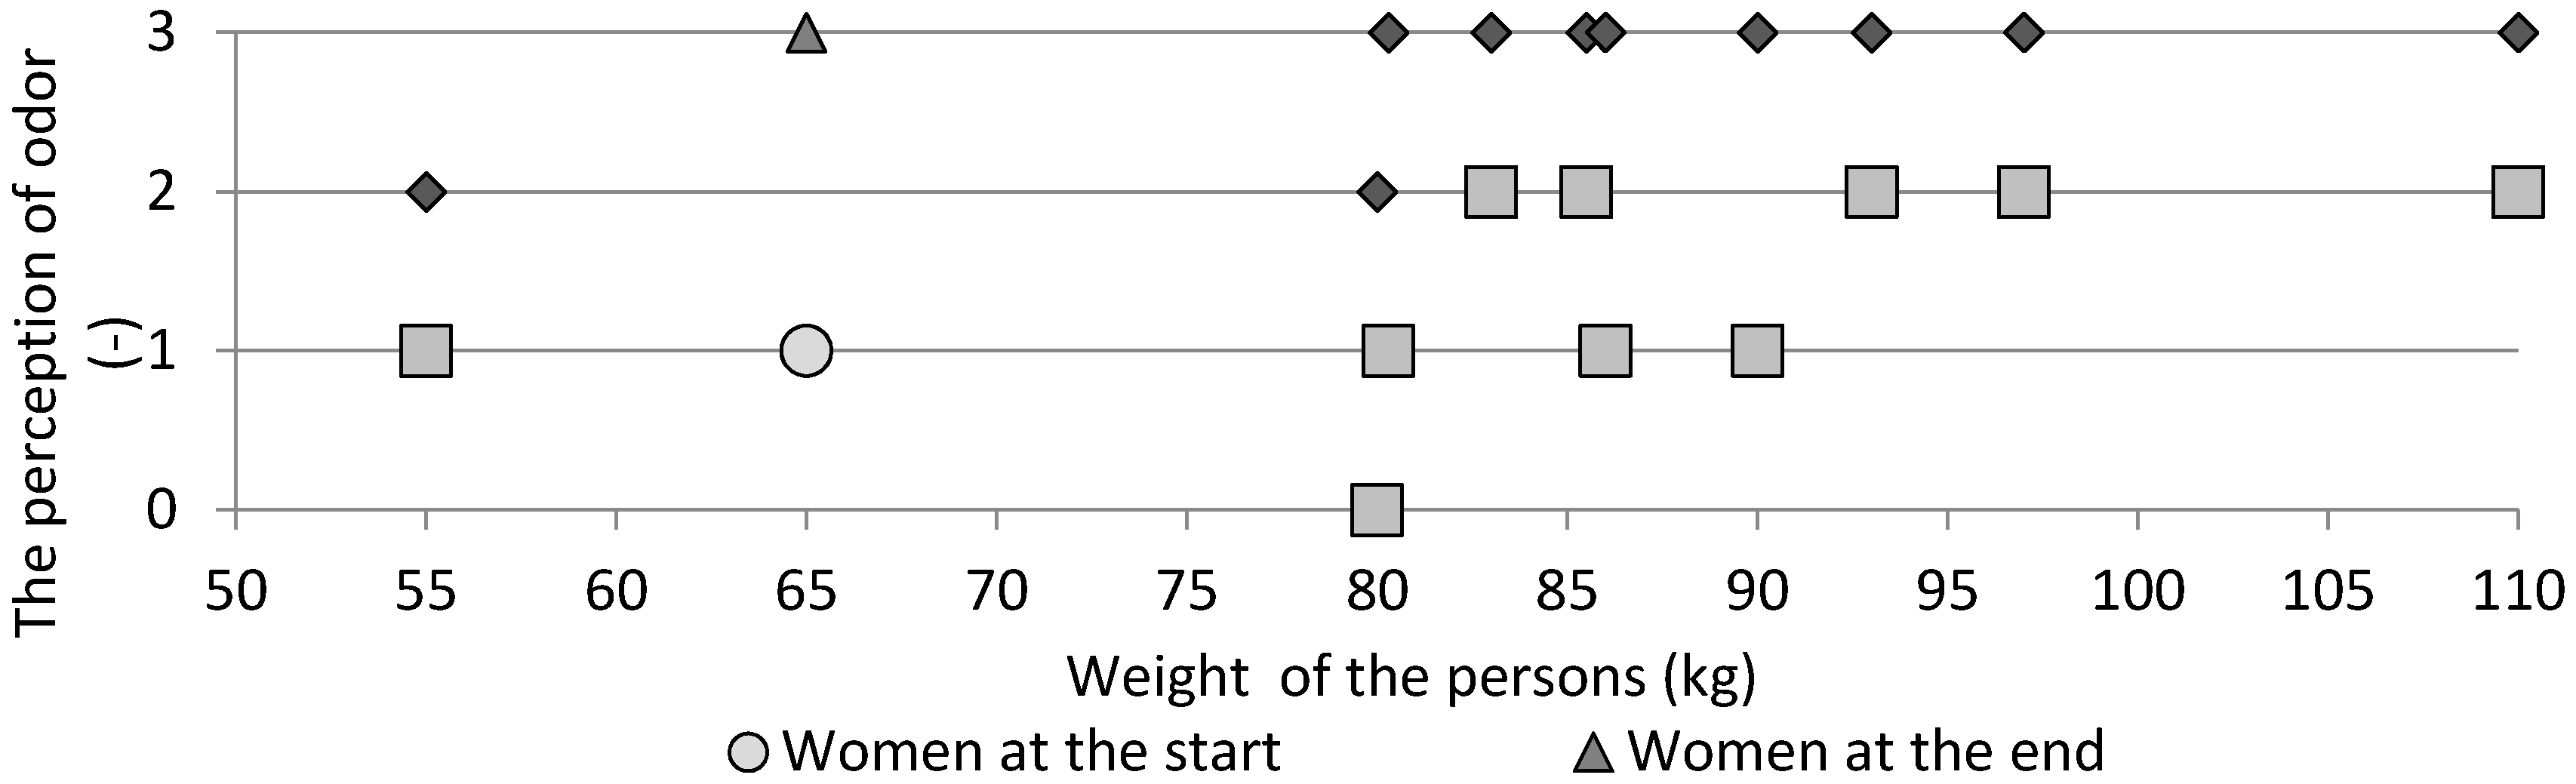
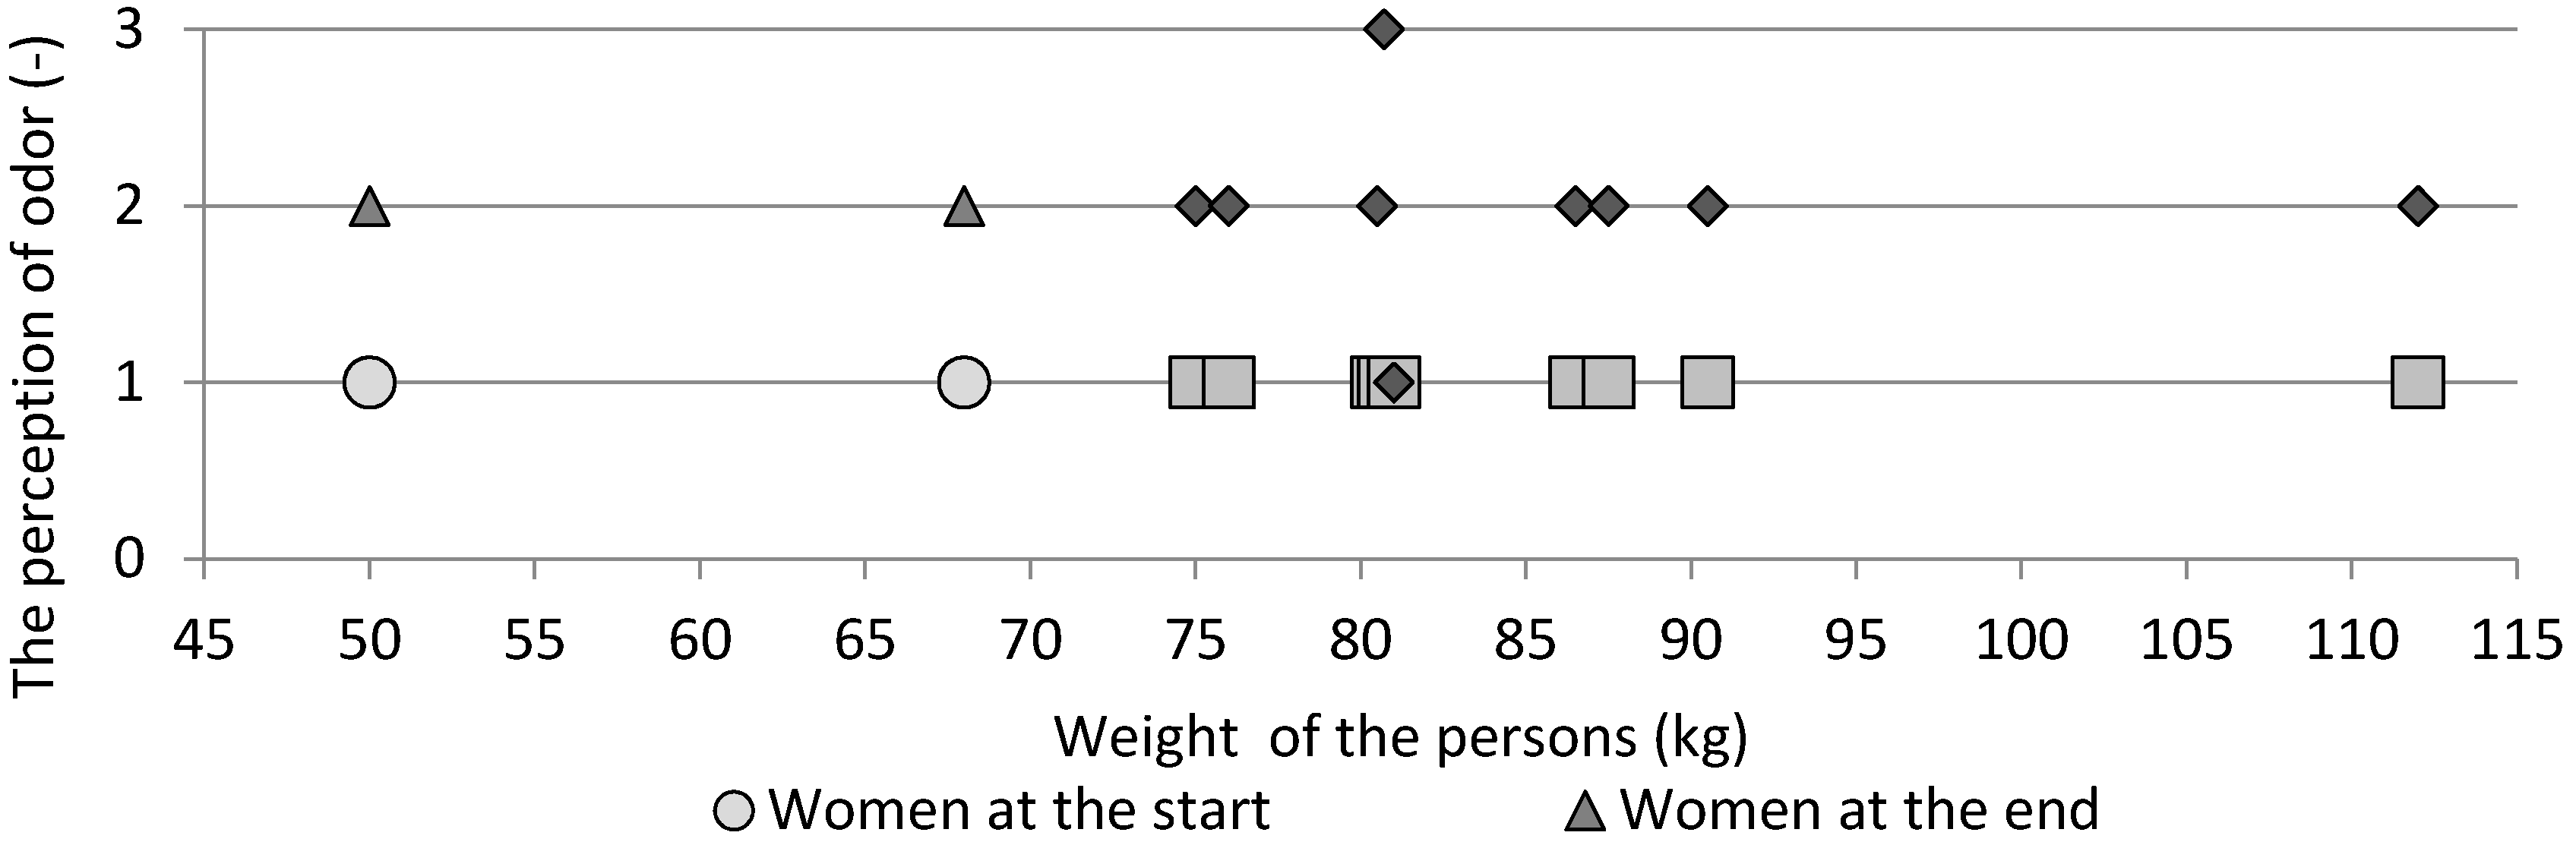
3.5. Subjective Evaluation
4. Conclusions
Author Contributions
Funding
Acknowledgments
Conflicts of Interest
References
- Shiram, S.; Rammamurthy, K.; Ramakrishnan, S. Effect of occupant-induced indoor CO2 concentration and bioeffluents on human physiology using a spirometric test. Build. Environ. 2019, 149, 58–67. [Google Scholar] [CrossRef]
- Liu, Y.; Wang, Z.; Zhang, Z.; Hong, J.; Lin, B. Investigation on the indoor environment quality of health care facilities in China. Build. Environ. 2018, 141, 273–287. [Google Scholar] [CrossRef]
- Mahyuddin, N.; Awbi, H. The spatial distribution of carbon dioxide in an environmental test chamber. Build. Environ. 2010, 45, 1993–2001. [Google Scholar] [CrossRef]
- Hsu, Y.C.; Kung, P.Y.; Wu, T.N.; Shen, Y.H. Characterization of indoor-air bioaerosols in Southern Taiwan. Aerosol Air Qual. Res. 2012, 12, 651–661. [Google Scholar] [CrossRef]
- Datta, A.; Suresh, R.; Gupta, A.; Singh, D.; Kulshrestha, P. Indoor air quality of non-residential urban buildings in Delhi, India. Int. J. Sustain. Built Environ. 2017, 6, 412–420. [Google Scholar] [CrossRef]
- Budaiová, Z.; Vilčeková, S. Assessing the effect of indoor environmental quality on productivity at office work. Sel. Sci. Pap. J. Civ. Eng. 2015, 10, 37–46. [Google Scholar] [CrossRef]
- Mahyuddin, N.; Awbi, H. A review of CO2 measurement procedures in ventilation research. Int. J. Vent. 2012, 10, 353–370. [Google Scholar] [CrossRef]
- Erdmann, C.A.; Apte, M.G. Mucous membrane and lower respiratory building related symptoms in relation to indoor carbon dioxide concentrations in the 100-building BASE dataset. Indoor Air. 2004, 14 (Suppl. 8), 127–134. [Google Scholar] [CrossRef]
- Tsai, D.H.; Lin, J.S.; Chan, C.C. Office workers’ sick building syndrome and indoor carbon dioxide concentrations. J. Occup. Environ. Hyg. 2012, 9, 345–351. [Google Scholar] [CrossRef]
- WHO. Indoor Air Quality: Biological Contaminants: Report on a WHO Meeting, Ruatavaara, 29 Augustȁ32 September 1988; European series. No. 31; WHO Regional Publications: Copenhagen, Denmark, 1988. [Google Scholar]
- Zamani, M.E.; Jalaluding, J.; Shaharom, N. Indoor air quality and prevalence of sick building syndrome among office workers in two different offices in Selangor. Am. J. Appl. Sci. 2013, 10, 1140. [Google Scholar] [CrossRef]
- Seppänen, O.A.; Fisk, W.J.; Mendell, M.J. Association of ventilation rates and CO2 concentrations with health and other responses in commercial and institutional buildings. Indoor Air. 1999, 9, 226–252. [Google Scholar] [CrossRef]
- Vehviläinen, T.; Lindholm, H.; Rintamäki, H.; Pääkkönen, R.; Hirvonen, A.; Niemi, O.; Vinha, J. High indoor CO2 concentrations in an office environment increases the transcutaneous CO2 level and sleepiness during cognitive work. J. Occup. Environ. Hyg. 2016, 13, 19–29. [Google Scholar] [CrossRef] [PubMed]
- Allen, J.G.; MacNaughton, P.; Cedeno-Laurent, J.G.; Cao, X.; Flanigan, S.; Vllarino, J.; Rueda, F.; Donnelly-McLay, D.; Spengler, J.D. Airplane pilot flight performance on 21 manoeuvres in a flight simulator under varying carbon dioxide concentrations. J. Expo. Sci. Environ. Epidemiol. 2018, 29, 457–468. [Google Scholar] [CrossRef]
- Allen, J.G.; MacNaughton, P.; Satish, U.; Santanam, S.; Vallarino, J.; Spengler, J.D. Associations of cognitive function scores with carbon dioxide, ventilation, and volatile organic compound exposures in office workers: A controlled exposure study of green and conventional office environments. Environ. Health Perspect. 2016, 124, 805–812. [Google Scholar] [CrossRef] [PubMed]
- Satish, U.; Mendell, M.J.; Shekhar, K.; Hotchi, T.; Sullivan, D.; Steufert, S.; Fisk, W.J. Is CO2 an indoor pollutant? Direct effects of low-to moderate CO2 concentrations on human decision-making performance. Environ. Health Perspect. 2012, 120, 1671–1677. [Google Scholar] [CrossRef] [PubMed]
- Kajtár, L.; Herczeg, L. Influence of carbon-dioxide concentration on human well-being and intensity of mental work. QJ Hung. Meteorol. Serv. 2012, 116, 145–169. [Google Scholar]
- Voznyak, O.; Sukholova, I.; Myroniuk, K. Research of device for air distribution with swirl and spread air jets at variable mode. East.-Eur. J. Enterp. Technol. 2015, 6, 15–23. [Google Scholar]
- Tagliaro, C.; Ciaramella, A. Experiencing smart working: A case study on workplace change management in Italy. J. Corp. Real Estate 2016, 18, 194–208. [Google Scholar] [CrossRef]
- Hua, Y.; Yang, E. Building spatial layout that supports healthier behavior of office workers: A new performance mandate for sustainable buildings. Work 2014, 49, 373–380. [Google Scholar] [CrossRef] [PubMed]
- EN 15251:2007. Indoor environmental input parameters for design and assessment of energy performance of buildings addressing indoor air quality, thermal environment, lighting and acoustics.


| Room | Floor Area (m2) | Volume of Room (m3) | Number of Men (-) | Number of Women (-) | Volume of Room (m3/Person) | Volumetric Air Flow Rate (m3/(h. Person)) |
|---|---|---|---|---|---|---|
| A | 60.00 | 156.00 | 4 | 5 | 17.33 | 19.4 |
| B | 73.90 | 206.92 | 10 | 1 | 18.81 | 40.5 |
| C | 86.00 | 223.60 | 9 | 2 | 20.33 | 47.8 |
| Office | Indoor Air Temperature [°C] | Relative Humidity [%] | CO2 Concentration [ppm] | ||||||
|---|---|---|---|---|---|---|---|---|---|
| Min. | Max. | Mean | Min. | Max. | Mean | Min. | Max. | Mean | |
| A | 22.9 | 25.0 | 24.5 | 20.1 | 26.4 | 23.9 | 374 | 1162 | 863 |
| B | 22.8 | 25.5 | 24.5 | 17.7 | 25.8 | 22.8 | 379 | 1006 | 702 |
| C | 22.2 | 25.3 | 22.4 | 19.6 | 23.7 | 21.6 | 396 | 869 | 651 |
| Office | Sex | Weight of Person [kg] | Heart-Beat Intensity (Pulse) of Occupants in Offices [pulse/min] | Increase/Decrease of Pulse [%] | |||
|---|---|---|---|---|---|---|---|
| Coming into the Office | Departure for Lunch | Return from Lunch | Departure from the Office | ||||
| A | Woman | 50 | 75 | 74 | 76 | 77 | 2.67 |
| Woman | 51 | 82 | 81 | 82 | 84 | 2.44 | |
| Woman | 60 | 65 | 63 | 60 | 56 | −13.85 | |
| Woman | 66 | 69 | 62 | 62 | 77 | 11.59 | |
| Woman | 66 | 64 | 63 | 70 | 65 | 1.56 | |
| Man | 67 | 70 | 71 | 71 | 72 | 2.86 | |
| Man | 85 | 96 | 90 | 107 | 76 | −20.83 | |
| Man | 87 | 63 | 71 | 72 | 60 | −4.76 | |
| Man | 90 | 87 | 66 | 92 | 63 | −27.59 | |
| B | Man | 55 | 78 | 55 | 64 | 57 | −26.92 |
| Woman | 65 | 68 | 71 | 69 | 90 | 32.35 | |
| Man | 80 | 67 | 62 | 75 | 65 | −2.99 | |
| Man | 80 | 57 | 57 | 61 | 61 | 7.02 | |
| Man | 83 | 98 | 95 | 93 | 84 | −14.29 | |
| Man | 85 | 65 | 53 | 60 | 55 | −15.38 | |
| Man | 86 | 76 | 76 | 94 | 108 | 42.11 | |
| Man | 90 | 65 | 60 | 58 | 63 | −3.08 | |
| Man | 93 | 60 | 66 | 54 | 56 | −6.67 | |
| Man | 97 | 87 | 85 | 84 | 86 | −1.15 | |
| Man | 110 | 95 | 86 | 84 | 87 | −8.42 | |
| C | Woman | 50 | 72 | 73 | 80 | 70 | −2.78 |
| Woman | 68 | 64 | 70 | 77 | 72 | 12.50 | |
| Man | 75 | 72 | 66 | 75 | 61 | −15.28 | |
| Man | 76 | 80 | 88 | 75 | 65 | −18.75 | |
| Man | 80 | 78 | 60 | 74 | 62 | −20.51 | |
| Man | 80 | 75 | 69 | 91 | 88 | 17.33 | |
| Man | 81 | 60 | 67 | 78 | 66 | 10.00 | |
| Man | 86 | 76 | 88 | 79 | 86 | 13.16 | |
| Man | 87 | 98 | 93 | 96 | 96 | −2.04 | |
| Man | 90 | 85 | 66 | 74 | 63 | −25.88 | |
| Man | 112 | 72 | 71 | 98 | 82 | 13.89 | |
© 2020 by the authors. Licensee MDPI, Basel, Switzerland. This article is an open access article distributed under the terms and conditions of the Creative Commons Attribution (CC BY) license (http://creativecommons.org/licenses/by/4.0/).
Share and Cite
Kapalo, P.; Vilčeková, S.; Mečiarová, Ľ.; Domnita, F.; Adamski, M. Influence of Indoor Climate on Employees in Office Buildings—A Case Study. Sustainability 2020, 12, 5569. https://doi.org/10.3390/su12145569
Kapalo P, Vilčeková S, Mečiarová Ľ, Domnita F, Adamski M. Influence of Indoor Climate on Employees in Office Buildings—A Case Study. Sustainability. 2020; 12(14):5569. https://doi.org/10.3390/su12145569
Chicago/Turabian StyleKapalo, Peter, Silvia Vilčeková, Ľudmila Mečiarová, Florin Domnita, and Mariusz Adamski. 2020. "Influence of Indoor Climate on Employees in Office Buildings—A Case Study" Sustainability 12, no. 14: 5569. https://doi.org/10.3390/su12145569
APA StyleKapalo, P., Vilčeková, S., Mečiarová, Ľ., Domnita, F., & Adamski, M. (2020). Influence of Indoor Climate on Employees in Office Buildings—A Case Study. Sustainability, 12(14), 5569. https://doi.org/10.3390/su12145569