Article

Studying the Formation of the Charging Session Number at Public Charging Stations for Electric Vehicles

1
Department of Motor Transport Operation, Tyumen Industrial University, 625000 Tyumen, Russia
2
Department of Environmental Economics, Ural Federal University, 620002 Ekaterinburg, Russia
*
Author to whom correspondence should be addressed.
Sustainability 2020, 12(14), 5571; https://doi.org/10.3390/su12145571
Submission received: 5 June 2020 / Revised: 29 June 2020 / Accepted: 9 July 2020 / Published: 10 July 2020
(This article belongs to the Section Environmental Sustainability and Applications)

Abstract

:
The energy industry is a leader of introduction and development of energy supply technologies from renewable energy sources. However, there are some disadvantages of these energy systems, namely, the low density and inconsistent nature of the energy input, which leads to an increase in the cost of the produced electric energy in comparison to the traditional energy complexes using hydrocarbon fuel resources. Therefore, the smart grid technology based on preliminary calculation parameters of the energy system develops in cities. This area should also be used to organize the charging infrastructure of electric vehicles, as the electrification of road transport is one of the global trends. As a result, a current task of the transport and energy field is the development of scientifically based approaches to the formation of the urban charging infrastructure for electric vehicles. The purpose of the article is to identify the features of the application flow formation for the charge of the electric vehicle battery. The results obtained provide a basis for building a simulation model for determining the required number of charging stations in the city, taking into account the criteria of minimizing operating costs for electric vehicle owners and energy companies.

1. Introduction

Nowadays, an important trend in the industrial and transport development is an environmental concern and reduction of the technogenic load [1,2,3,4,5,6]. A wide range of strategies is implemented, including an improvement of traditional hydrocarbon fuels [4,7] and the use of renewable energy sources for power supply of the cities [8,9,10,11,12,13,14,15,16]. In 2018, the share of renewable energy was 26% of the total amount of electric energy produced. By 2050 this value should increase up to 86% according to the plan for the transformation of world energy systems [17,18]. This plan also includes the electrification of various industries, in particular transport. By 2040, the share of electric vehicle sales will be more than 57% [19], and by 2050 the number of electric vehicles in the world fleet will exceed 1 billion units [20]. An increase in the number of operated electric vehicles requires the creation of an appropriate charging infrastructure. In 2018, the number of charging stations for electric vehicles exceeded 5 million units, of which 540,000 units are public charging stations [21]. Moreover, in the same year, the number of electric vehicles was 5.6 million units [22]. At the present time, this uncontrolled emergent of charging stations can lead to a slight increase in energy consumption. In 2030, when the number of electric vehicles reaches 160 million units, the peak demand can increase up to 3 GW [20,23,24,25,26]. This trend necessitates the creation of a smart charging infrastructure, which can not only charge electric vehicles, but also transfer the energy stored to the city’s power grid [20,21,27]. In this case, charging stations networks must be controlled and developed on the basis of previously performed calculations and justification of the parameters. Thus, a current scientific task in the field of transport and energy is to develop a methodology for the justification of the parameters of the urban charging infrastructure for electric vehicles.
An important stage of the charging infrastructure development is modeling the optimal location of charging stations. The choice of location is usually based on the achievement of the target function [28]:
  • minimization of the total costs when using the charging infrastructure;
  • minimization of the operating costs for electric vehicle drivers;
  • maximization of the demand coverage.
In researches, these functions are achieved using models developed by Daskin M.S. [29,30]. These are a fixed-cost location model, p-median model, and maximum coverage model. Frade I., Gimenez-Gaydou D. and others applied the model of maximum coverage when they were determining the location of slow charging stations in the city [28,31]. Based on this model, Wang Y. and Lin C. developed the location model for charging stations with various types of charging using mixed integer programming and refueling logic of traditional vehicles [32]. When the model of maximum demand coverage is used on the territory of cities, researchers also take into account the walking distance of destinations or mileage when searching for a free charging station. This approach is described by Lam A.S., Leung Y, and Chu X. [33].
In context of the electric vehicles’ involvement in commercial transportation, researchers develop a network of battery replacement stations that can reduce the time for recharging the battery. In this case, the critical criterion is the requirement for spare batteries. However, Mak H., Rong Y. and Shen M.Z. note the importance of accounting for demand, which is currently controversial [34]. Therefore, they proposed to solve this problem using two models aimed at minimizing the expected costs of creating infrastructure or meeting the maximum demand. One reason to organize the charging infrastructure for commercial vehicles is minimization of the operating costs for owners, just corresponding to the p-median model. This model in particular was adapted to locate electric taxi battery exchange stations in Seoul [35]. He S. proved the applicability of this model also to the organization of public charging infrastructure in Beijing [36]. As a result, minimizing the operating costs for electric vehicle owners is an important target function which is the basis for creating a model of the optimal location of the charging stations. This target function, combined with minimizing capital expenditures for the infrastructure, was considered by Ghamami M., Nie Y. and Zockaie A. In their research, the authors propose installing charging stations at the departure and destination points (offices and residential complexes) of people travelling around the city [37]. The routes of electric vehicle owners is also the basis of the analytical method for planning the location of charging stations for electric vehicles developed by Hanabusa H. and Horiguchi R. [38,39]. In this case, the location of the charging station depends on the time and cost of each route, which also includes the duration of the battery charge. Charging time is also a component of the target function in the study [40]. However, there are researchers who suggest the elimination of charging time from electric vehicle route by installing charging stations in car parking near recreational facilities, work, and so on. Chen T.D., Kockelman K.M., Khan M., used this approach the model of the charging station location in Seattle [41]. Dashora Y., Barners J.W. and others proposed to have charging stations in car parking of laboratories and company offices for charging plug-in electric vehicles [42].
There is another approach to the optimal location of the charging stations based on the study of the transport network features and traffic flow [43]. Additionally, some studies consider how the location of the existing car service centers influence the capital costs of installing a fast charging station [44,45,46].
The parameters of the charging infrastructure include not only the optimal location of the charging stations, but also the calculation of their required number [28]. The application of the above approaches can increase the number of considered objects with a low utilization rate. Previous studies showed that the number of charging stations was usually taken in accordance with the regulatory documents or the socio-economic image of potential electric vehicle owners. At present, methods for calculating the required number of charging stations on intercity highways have already been proposed [47]. Within the city, the calculation of the charging station number was proposed by Wang Y., et al. [48]. It is based on data on the amount of fuel consumed by traditional vehicles and the parameter for recalculating the amount of energy consumed when electric cars are used for travelling.
The methodology for determining the required number of charging stations and their optimal location in the city was considered by Sweda T. and Klabjan D. [49]. They proposed using agent-based modeling to solve this problem. Source data for this model are the behavior of each individual electric vehicle owner, features of transport network, parking and so on. This technique is visual and effective. However collecting data on how people travel around the city and adapting the model to various scenarios of urban functioning is difficult. The most common method used in calculating the required number of charging stations is stochastic modeling based on queuing systems theory. This approach is presented in [50,51]. The functioning system of the charging infrastructure is described using mathematical models. The input flow of electric vehicles for charging the battery is described by Poisson distribution. The battery charging time in the existing model is determined by exponential distribution. However, the development of the charging infrastructure and the increase in the electric vehicle number allow one to more accurately describe the features of the input flow and the service process.
Studying the existing charging infrastructure and determining the required number and type of charging stations is used in research in the area of charging network organization for passenger public transport. Conti V., Orchi S. noted that this approach to planning charging infrastructure necessitates a more efficient and less costly network operation [52]. This study considers the influence of the busload factor, average speed of electric buses and the road gradient on the bus line on the number and type of chargers. However, Fusco G., Alissandrini A. proposed to preliminarily study the electric energy consumption by electric buses and its effect on the number and type of charging stations on the bus line [53]. The consumption of electric energy by an electric bus on a bus line depended on the speed and the road gradient, the length of the bus line, the number of passengers, and the operation of auxiliary equipment. De Fillipo G. examined the reverse pattern and evaluated the effect of the type and number of chargers on the electric energy consumption by an electric bus [54]. Thus, the study of the existing charging infrastructure is one of the approaches used for further modeling the network of charging stations. However, this methodology has not been identified in studies on the organization of charging infrastructure for electric vehicles.
Therefore, the research aim is to develop a comprehensive methodology for designing a charging infrastructure for electric vehicles, which will include:
  • calculation of the required number of charging stations on the basis of data on the existing charging infrastructure operation and a simulation model of its development;
  • determining the location of the charging stations in the city on the basis of data on their quantity and development over time, features of the electric network (use of renewable energy sources), distance of coverage.
This article presents the results of the first research stage. The aim of the paper is to substantiate appropriate mathematical models for the adequate description of the features of the input flow for servicing by charging stations. The obtained results will provide a simulation model for calculating the required number of charging stations and their optimal location in the city.

2. Materials and Methods

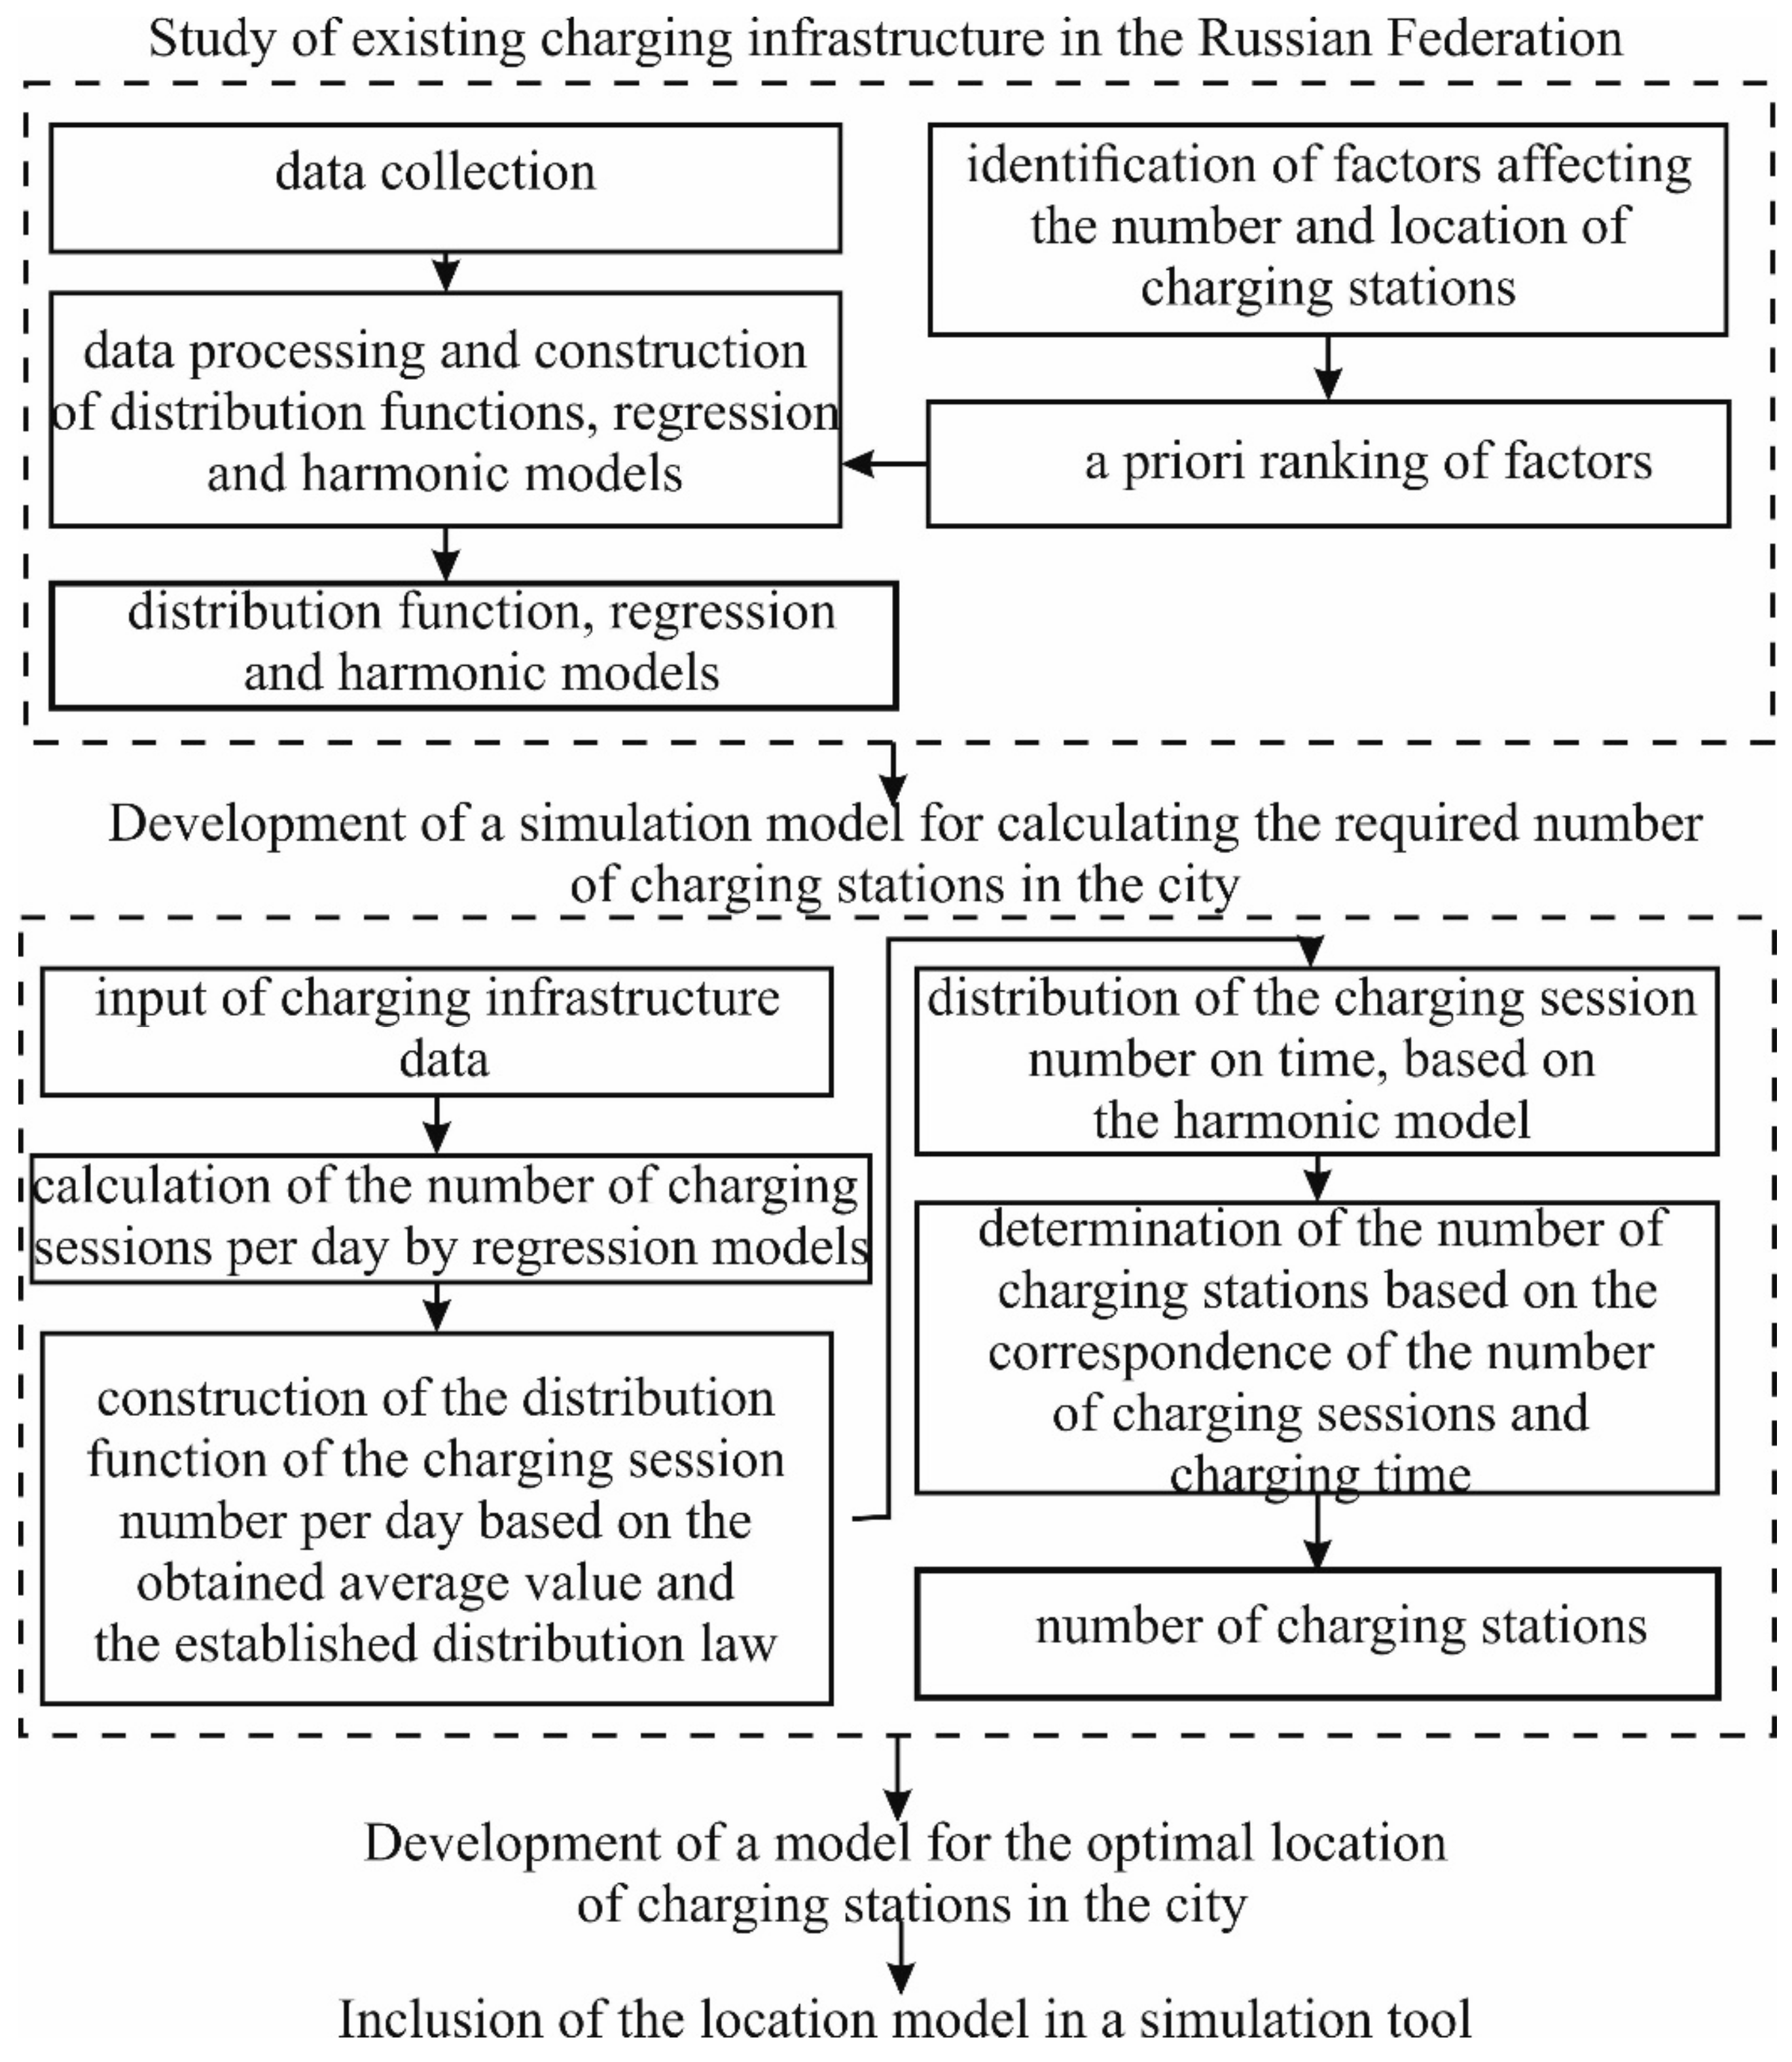
2.1. Research Methodology

The research methodology is presented in Figure 1.
It includes four main stages of the study, which contain many sub-steps. The article presents the results of the first stage. These are regression models that determine the average number of charge sessions per day. This value is the mathematical expectation of the distribution function, which describes the probability of the application process. At the last stage, the obtained value is distributed according to the time of day using the harmonic model. Thus, the developed models provide the calculation of the possible number of charging sessions within an hour. The correspondence between the obtained value and the average charge time of the vehicle will enable the calculation of the required number of charging stations in the city. Further, the value is taken into account in the model of the location of charging stations. The research methodology ensures the software development for the design of urban charging infrastructure in the city.

2.2. The Methodology of the First Research Stage

At the current stage of the study, the authors have developed a system for determining the required number of the charging stations in the city (Figure 2).
Authors conducted the analysis of the previous studies aimed at determining the number of charging stations. It’s showed that the intensity of electric vehicle flow and charging time are the system parameters that depend on many factors. In this research, these parameters are determined on the basis of empirical data, taking into account factors indicated at the lowest level of the system. The number of these factors was reduced to ten as a result of their a priori ranking [55,56]. These factors presented in Table 1 were put forward for ranking.
The consistency of the results was assessed using the Candell concordance coefficient [55]. The hypothesis of nonrandom agreement of experts was verified using the Pearson criterion. The number of experts was determined by Equation (1):
Nexpert = 0.5·(3/d + 0.5)
where d—possible error of the results of the expert assessment (it is 0.15).
The significant factors were introduced in mathematical models describing the input flow of electric vehicle for charging. This stage of the study included the collection and processing of data on:
  • the number of charging sessions performed at various times of the day at public urban charging stations;
  • brands, models and capacities of electric vehicle batteries;
  • the number of electric vehicles that are charged from public charging stations.
Data were collected during a year in three cities of the Russian Federation that have the most developed public charging infrastructure: Moscow and the Moscow Region, St. Petersburg and Tyumen. The obtained data were processed using Microsoft Office Excel and MATLAB in accordance with the theory of mathematical modeling.
In this study, the intensity of the electric vehicle flow for charging is taken as their quantity serviced per hour. This value is zero for an extended period of the day. Therefore, the authors described the number of charging sessions performed during the day at the first stage of the research, and then they determined the timewise distribution of this value.
The flow of electric vehicle for charging is stochastic in its nature. Therefore, the most likely number of charging sessions performed during the day can be described using the distribution function. Moreover, the mathematical expectation of the distribution function depends on the factors located at the lowest level of the system (Figure 1). The number of charged electric vehicles for each time of the day is calculated using the utilization factor of the stations described by the harmonic model.
The distribution function of the charging session number during the day was obtained in accordance with the following algorithm:
  • calculation of the minimum sample size;
  • search of sampling errors by the Thompson criterion;
  • determination of the interval number, grouping data;
  • selection of the distribution law by type of histogram and obtained statistical characteristics;
  • verification of the conformity of the theoretical law with the empirical Pearson criterion.
Regression models were obtained using the methods of correlation and regression analysis in accordance with the following algorithm:
  • determining the interval number and grouping data of the sample used to construct the distribution function;
  • calculation of the minimum sample size for each study interval;
  • search of sampling errors by the Thomson criterion;
  • calculation of the expectation of the charging session number in each interval of the grouped data;
  • development of patterns based on the data;
  • choice of the general form of the regression equation;
  • calculation of the coefficients for the regression equation;
  • verification of the conformity of the regression equation with the initial data by the Fisher dispersion relation and the average approximation error;
  • calculation of the correlation ratio and assessment of its significance according to the student criterion.
A harmonic model was obtained on the basis of data on the number of charging sessions performed at each time of the day. The following algorithm was used:
  • calculating the utilization rate of the charging station at each time of the day (it is the probability of a charging session);
  • determination of the parameters of each harmonic curve obtained by expanding the empirical series. These are amplitude, initial phase and period;
  • linearization of the equation of each harmonic curve;
  • verification of the conformity of the equation to the initial data by the Fisher dispersion relation and the average approximation error;
  • calculation of the correlation ratio and assessment of its significance according to the Fisher criterion.

3. Results

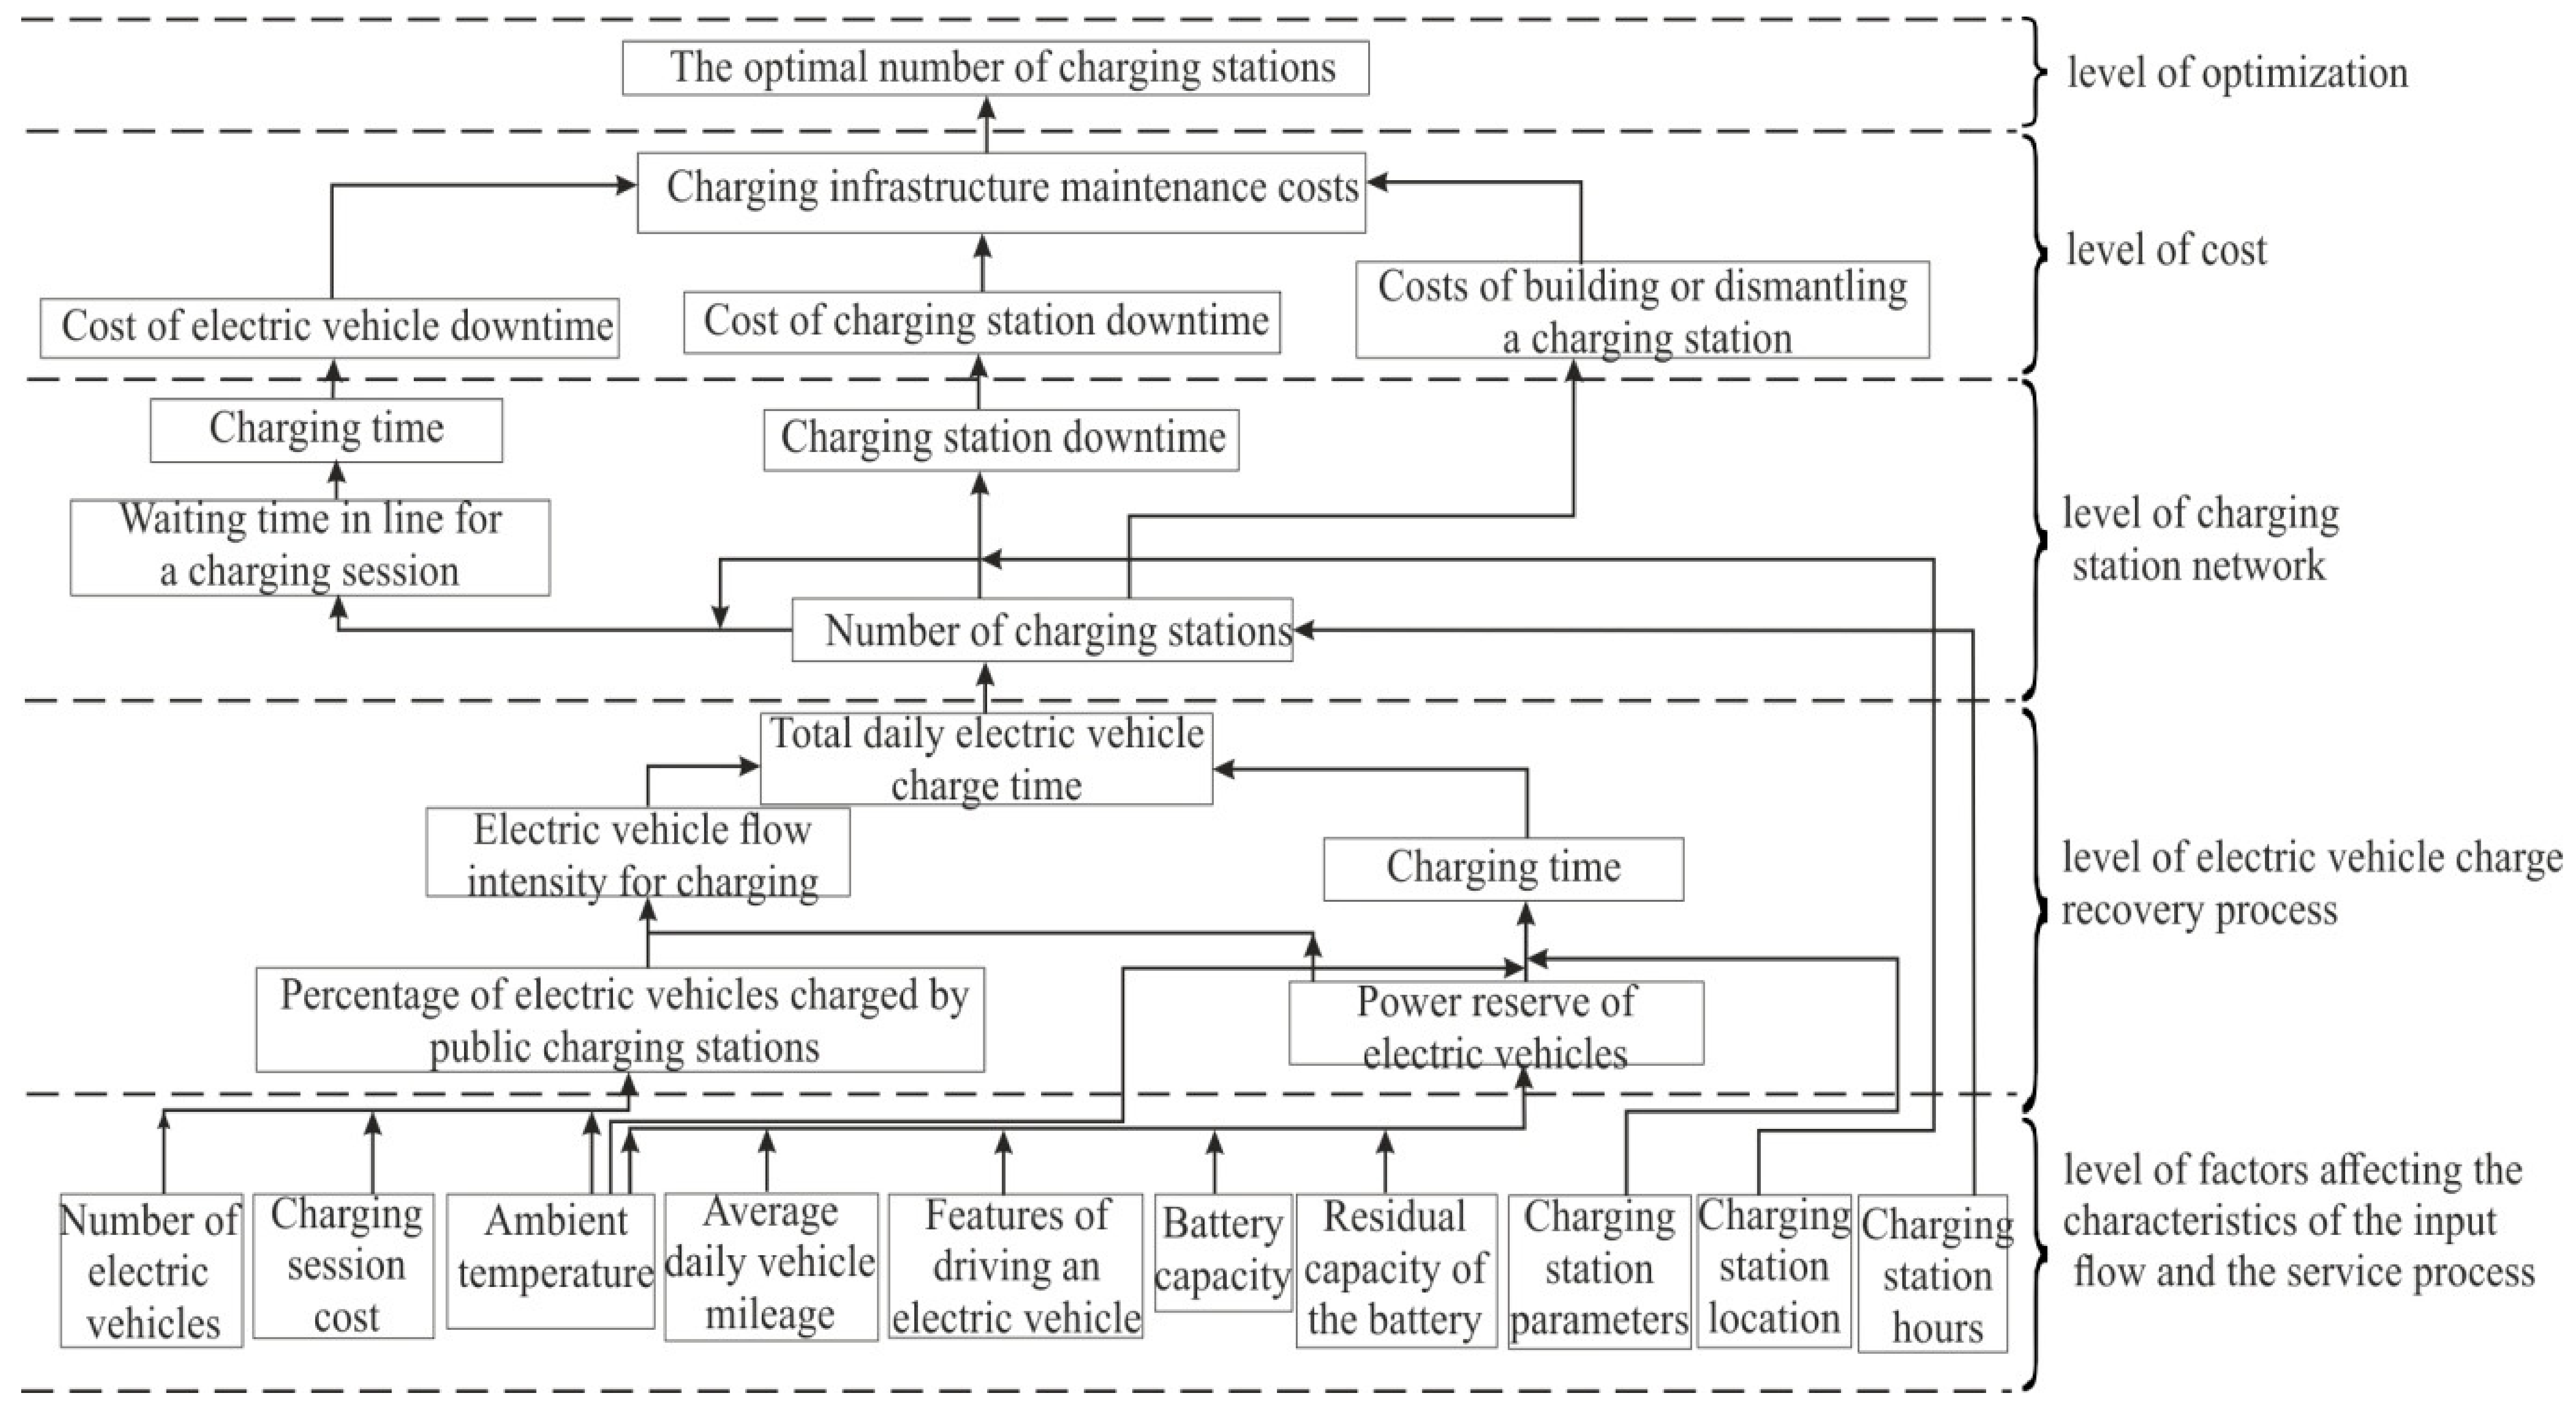
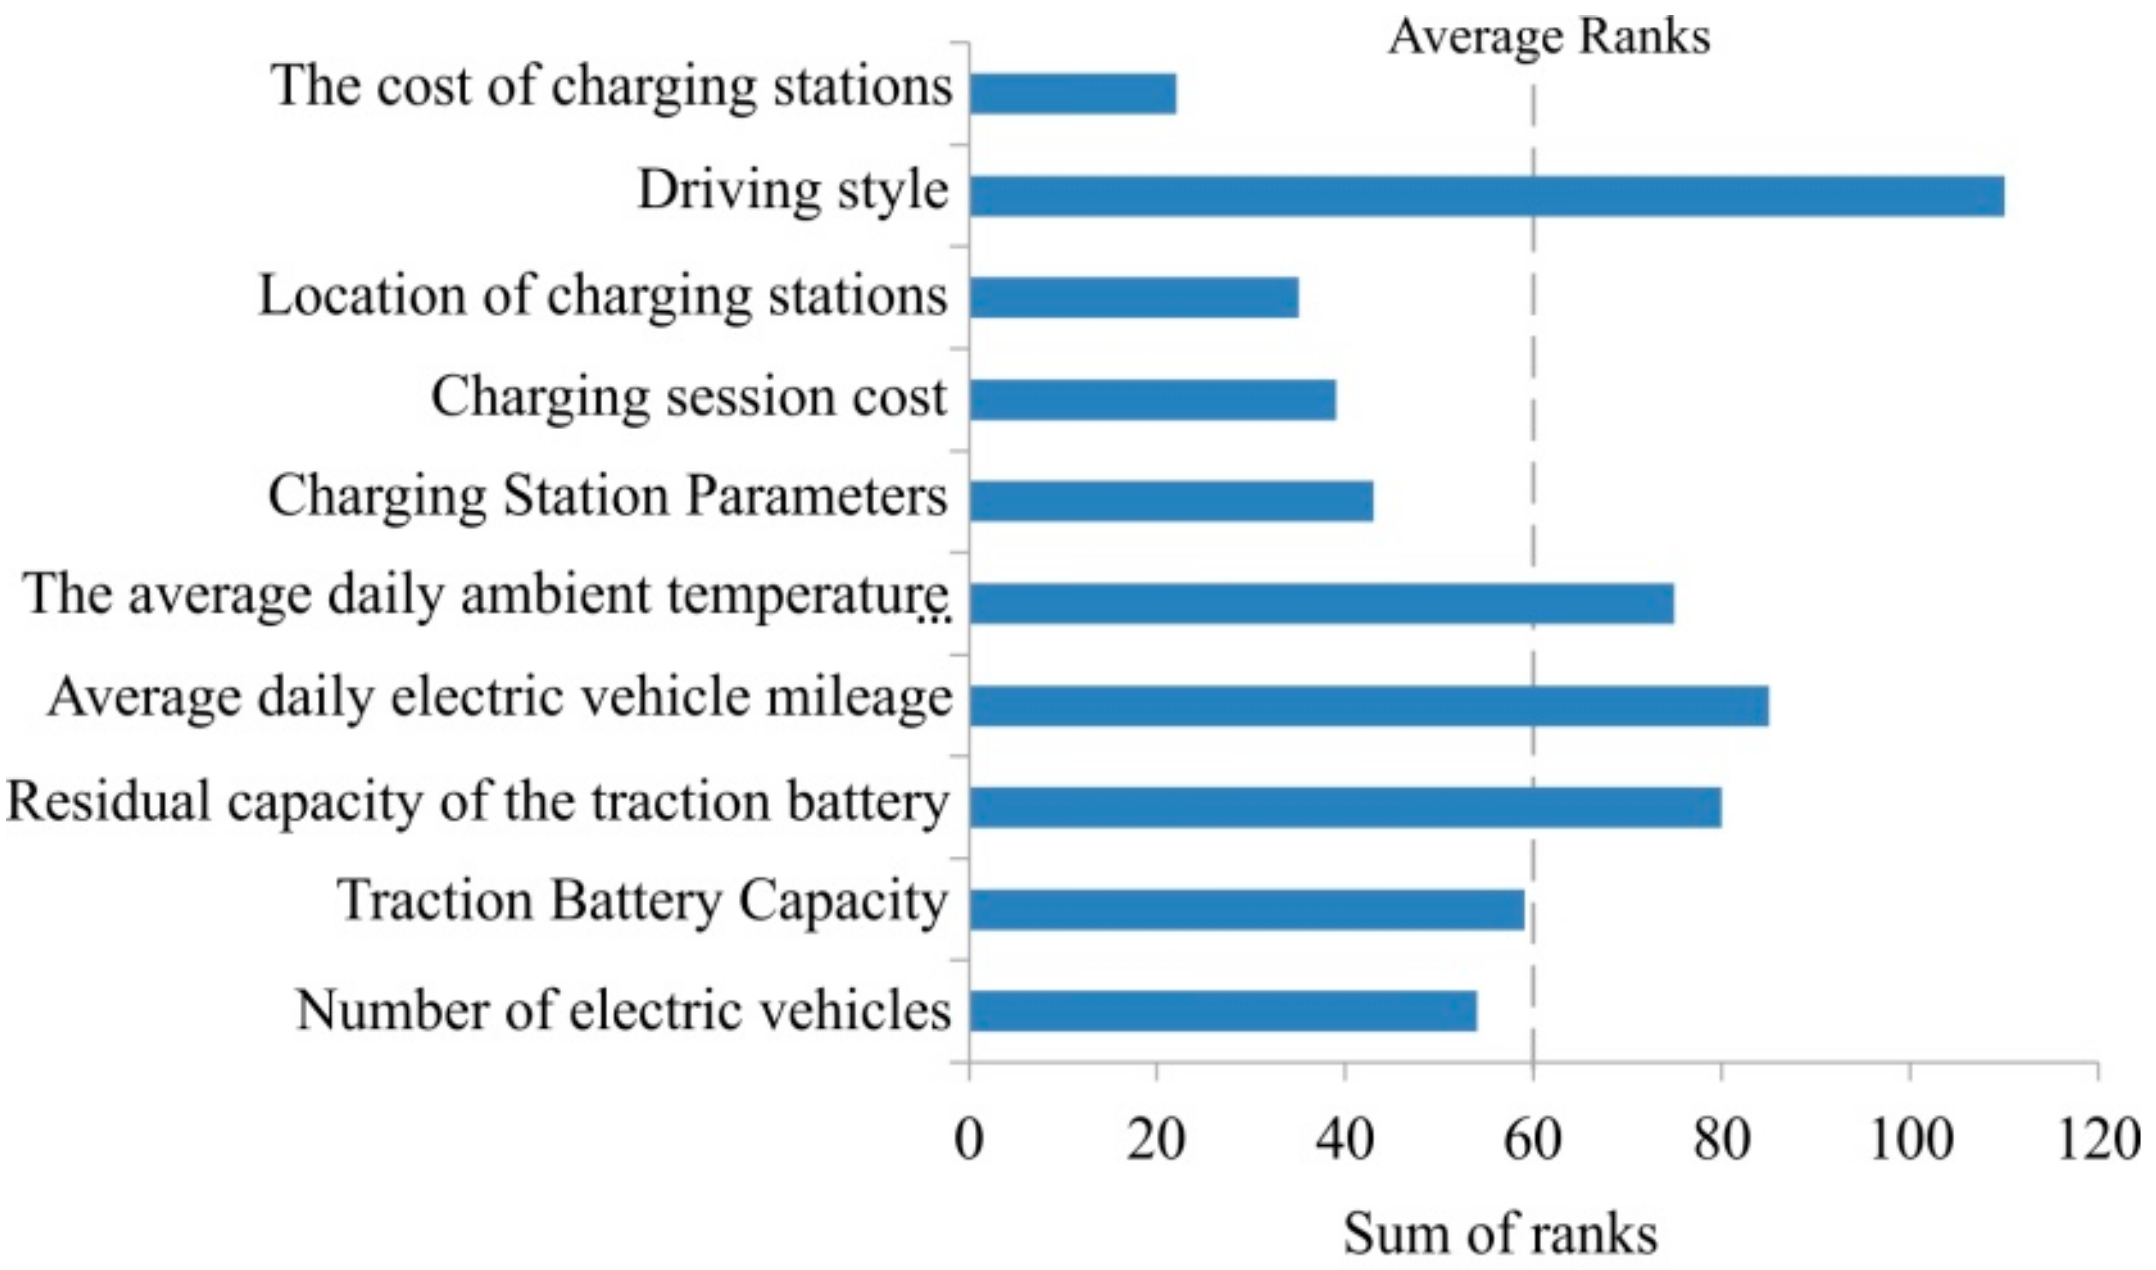
3.1. A Priori Ranking of Factors

The purpose of a priori factor ranking is to identify the most significant of them, according to experts’ evaluation. At this stage of the research, 11 highly qualified specialists in the study area participated in the assessment of factors (the number of experts was determined by Equation (1)). The results were processed and shown using the diagram presented in Figure 3.
As a result of a priori ranking, the authors found that factors significantly affecting the number of charging stations in the city have a sum of ranks less than the average value (it is 60). These are the number of registered electric vehicles; capacity of batteries; parameters, location and cost of charging stations; price of a charging session. The degree of expert coherence (Candell concordance coefficient) was 0.55. This value is different from zero and indicates the agreement of the respondents. The calculated value of the Pearson criterion was 54.43. It is more than the tabulated value. It confirms the hypothesis that the agreement of experts is not random.
The results obtained at this research stage will be used to study the patterns of change in the intensity of the electric vehicle flow for charging and the charging time.

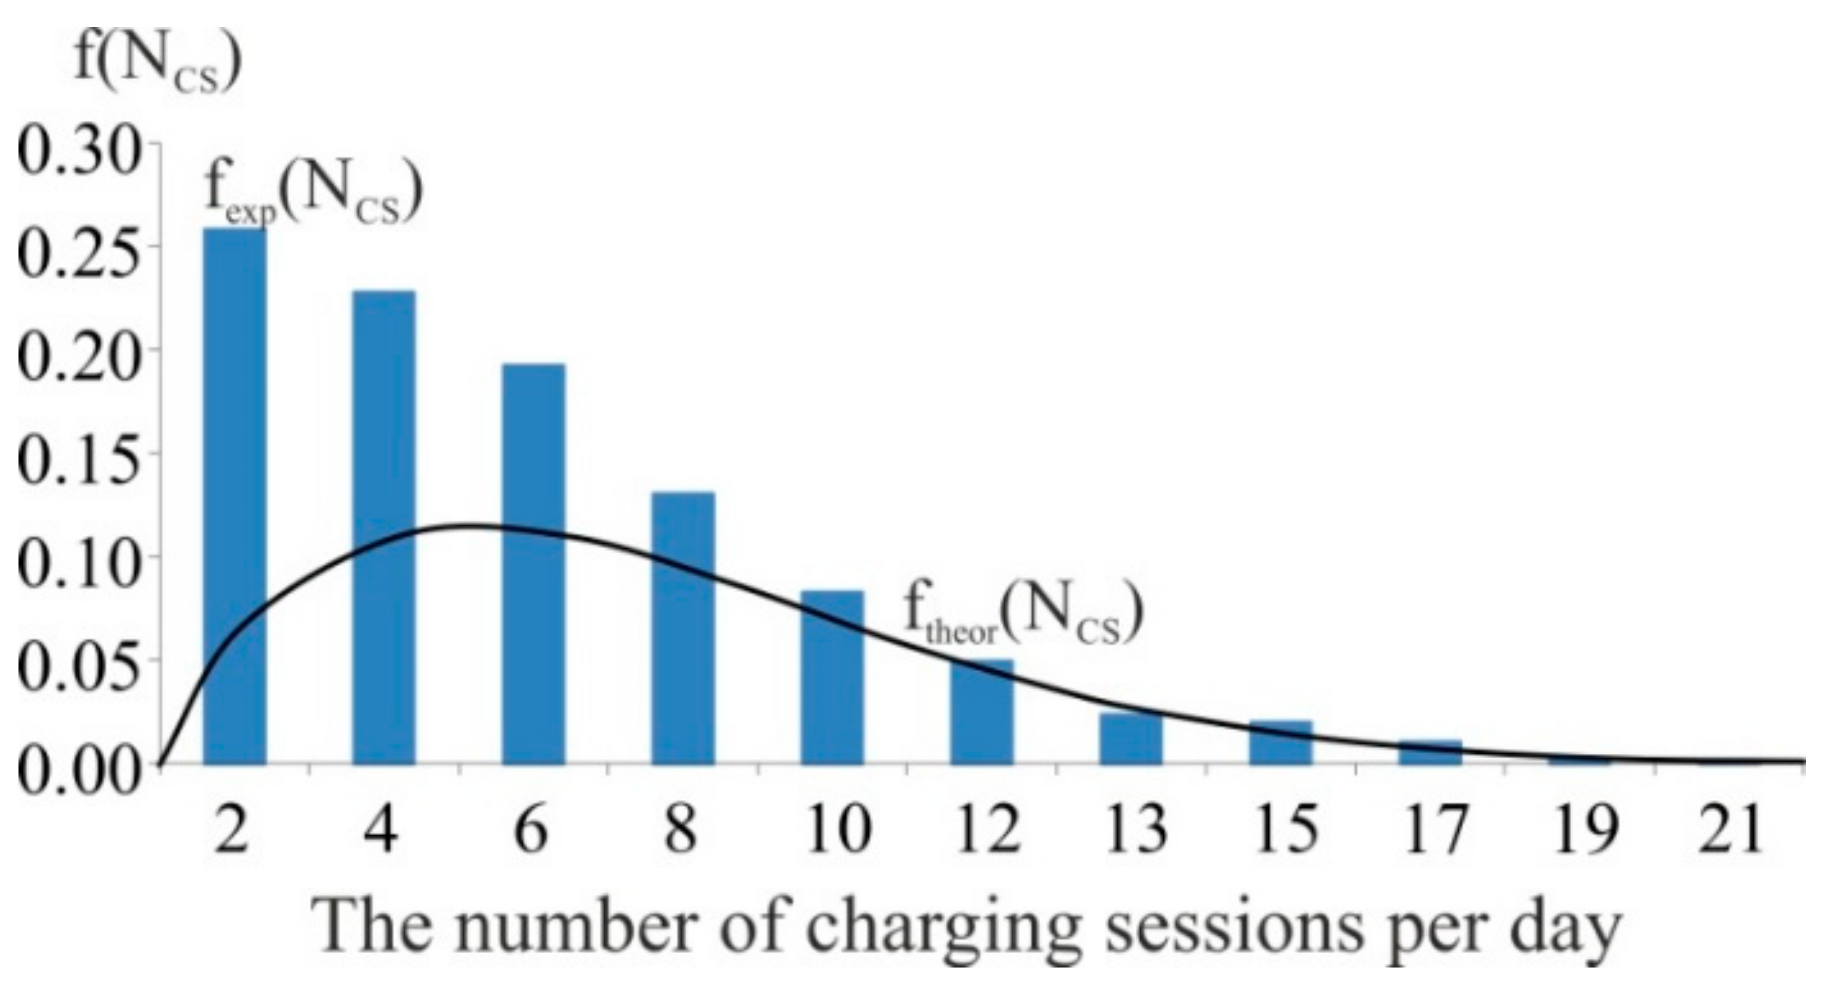
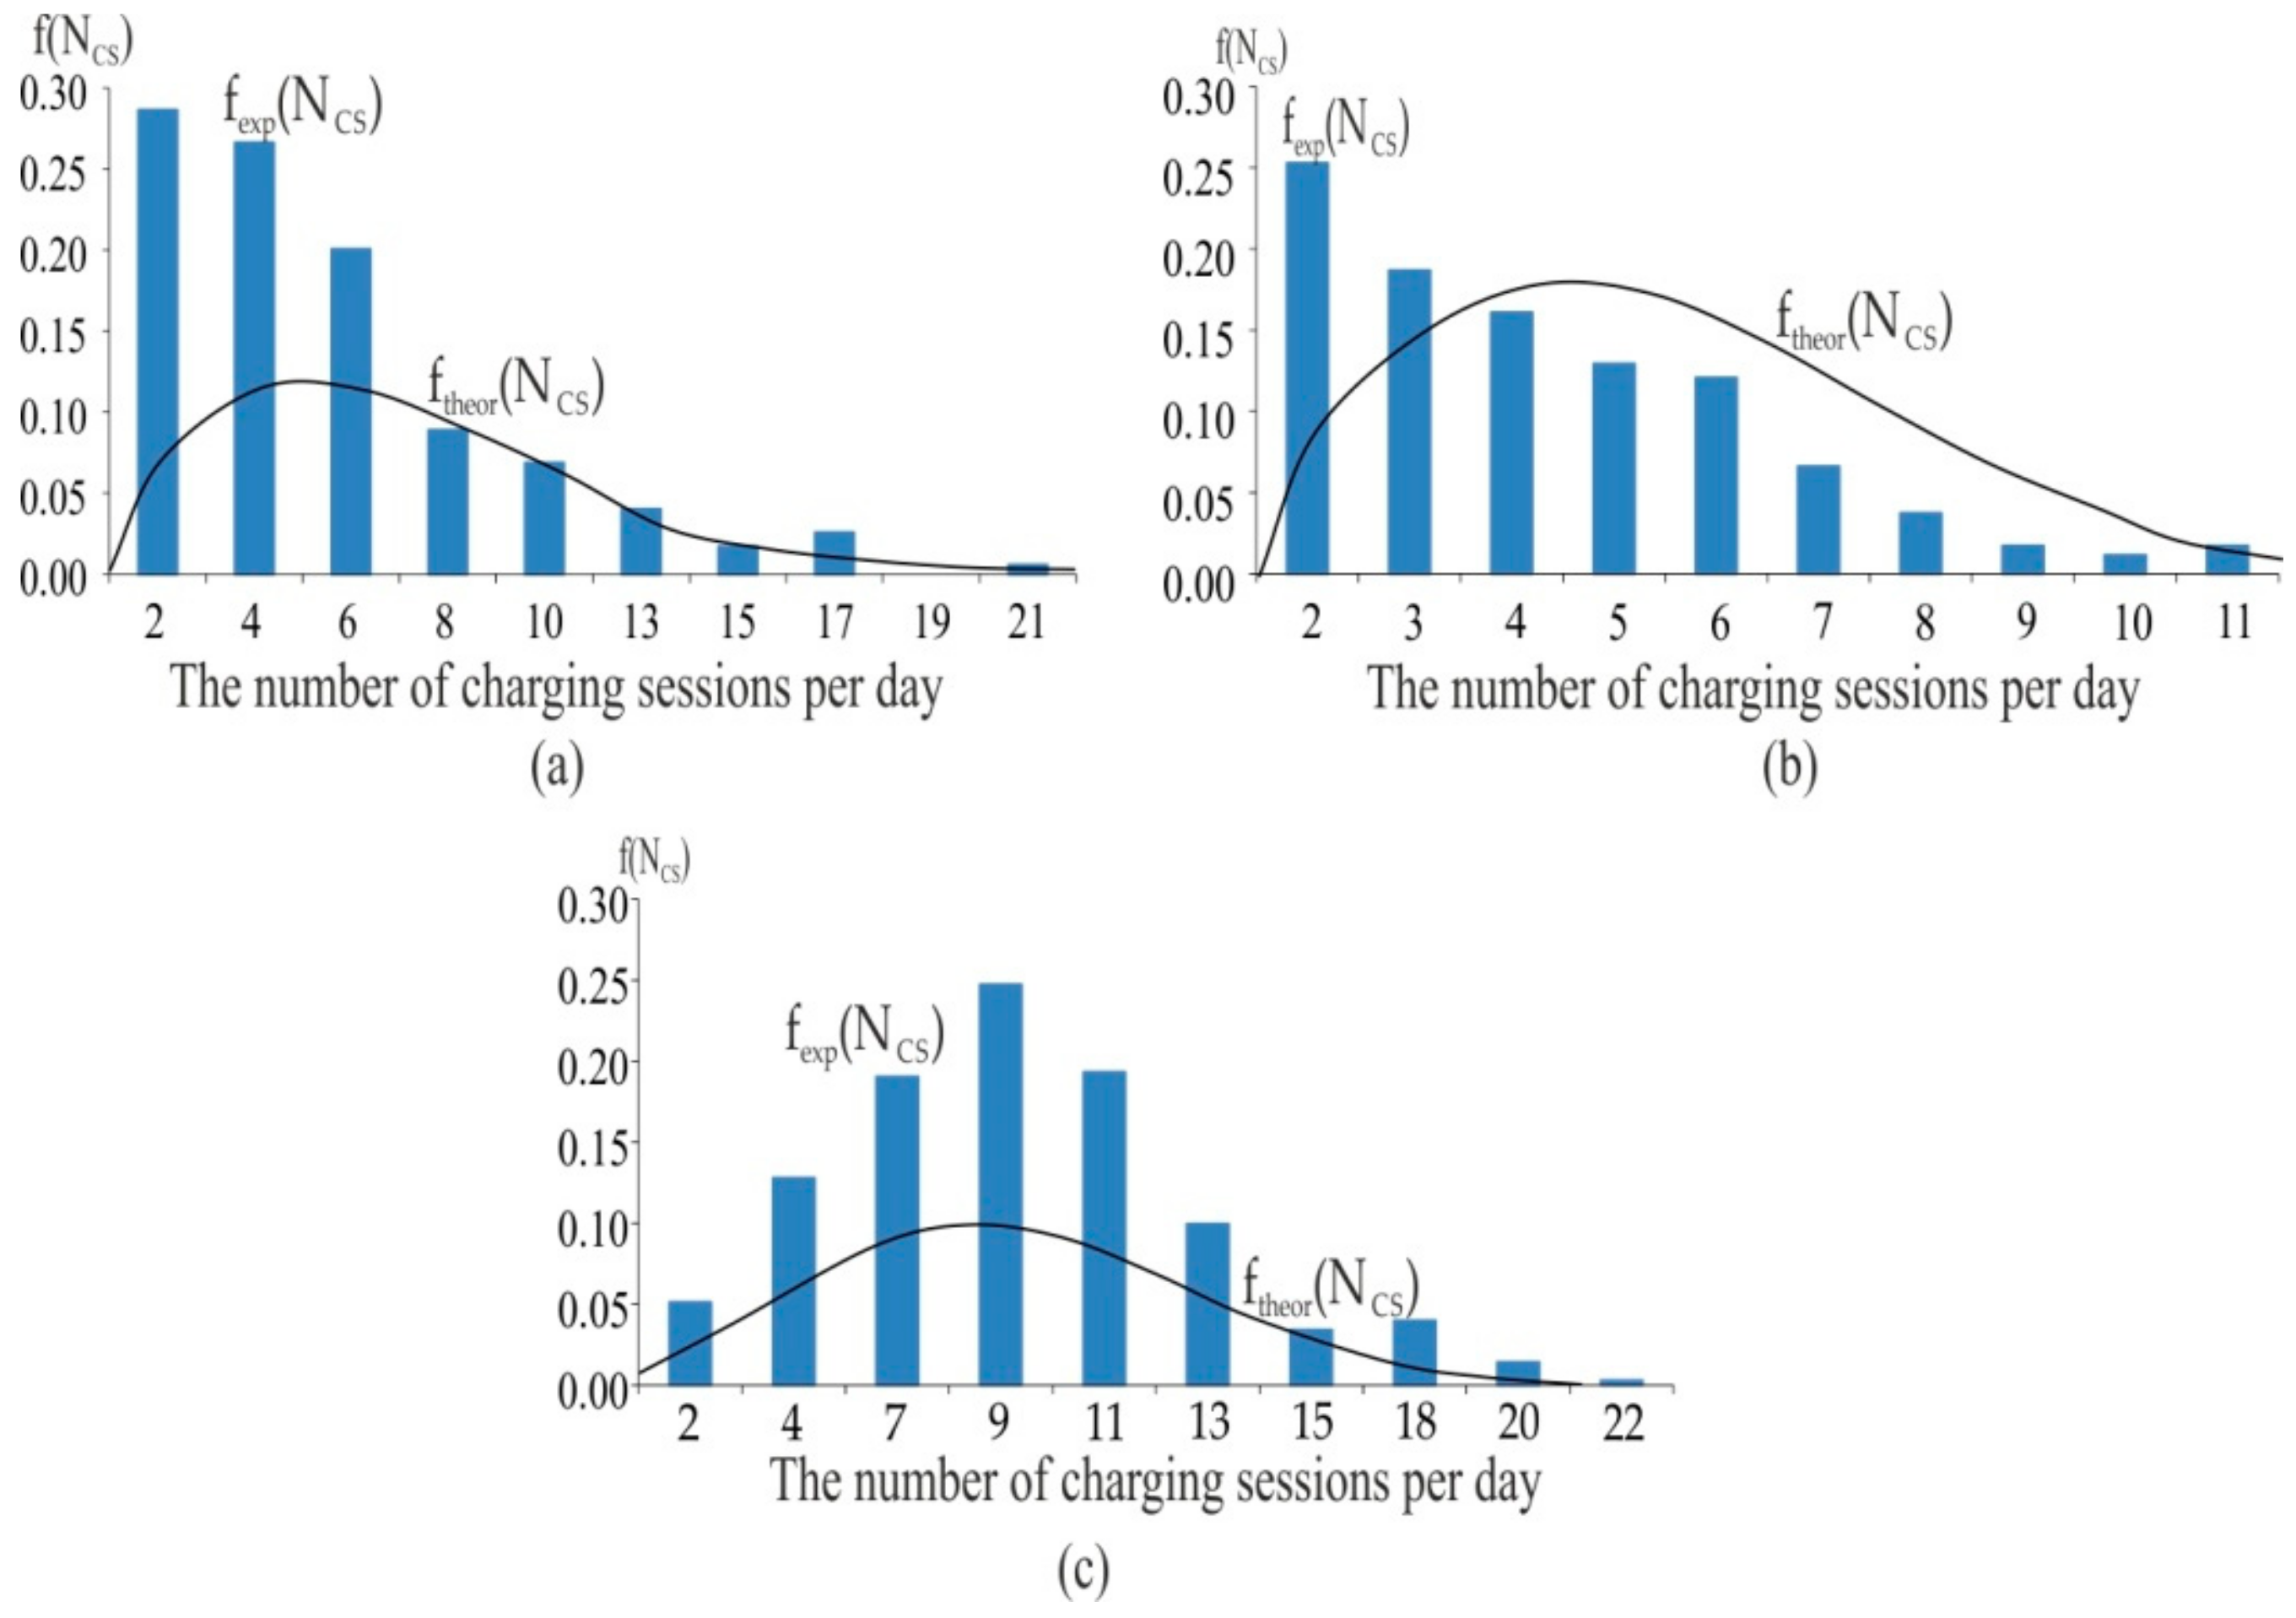
3.2. Distribution Function Describing the Change in the Number of Charging Sessions per Day

The flow of electric vehicles for charging is stochastic. Therefore, the most likely number of charging sessions performed during the day can be determined using the distribution function f (Ncs) presented in Figure 4. Initially, the authors obtained the experimental distribution function fexp (Ncs). Then, they proposed a type of theoretical distribution function ftheor(Ncs).
The sample size was 1049 values, which were grouped into 11 intervals. The data processing results are presented in Table 2.
The authors concluded that the experimental distribution function corresponded to Weibull’s theoretical distribution function. This was confirmed using the Pearson criterion, whose calculated value was more than the critical value.
An analysis of the experimental distribution functions for Moscow, St. Petersburg and Tyumen (Figure 5) showed that the mathematical expectation varies from 4 to 9 charging sessions per day.
Charging stations located in large cities have a small quantity of charging sessions per day. These results require adjustment of the number of charging stations in the city. The change in the expectation of the presented distribution functions can be explained by the influence of the factors presented in the system of determining the required number of charging stations for electric vehicles in cities (Figure 1). Changes in these values are described using regression models.

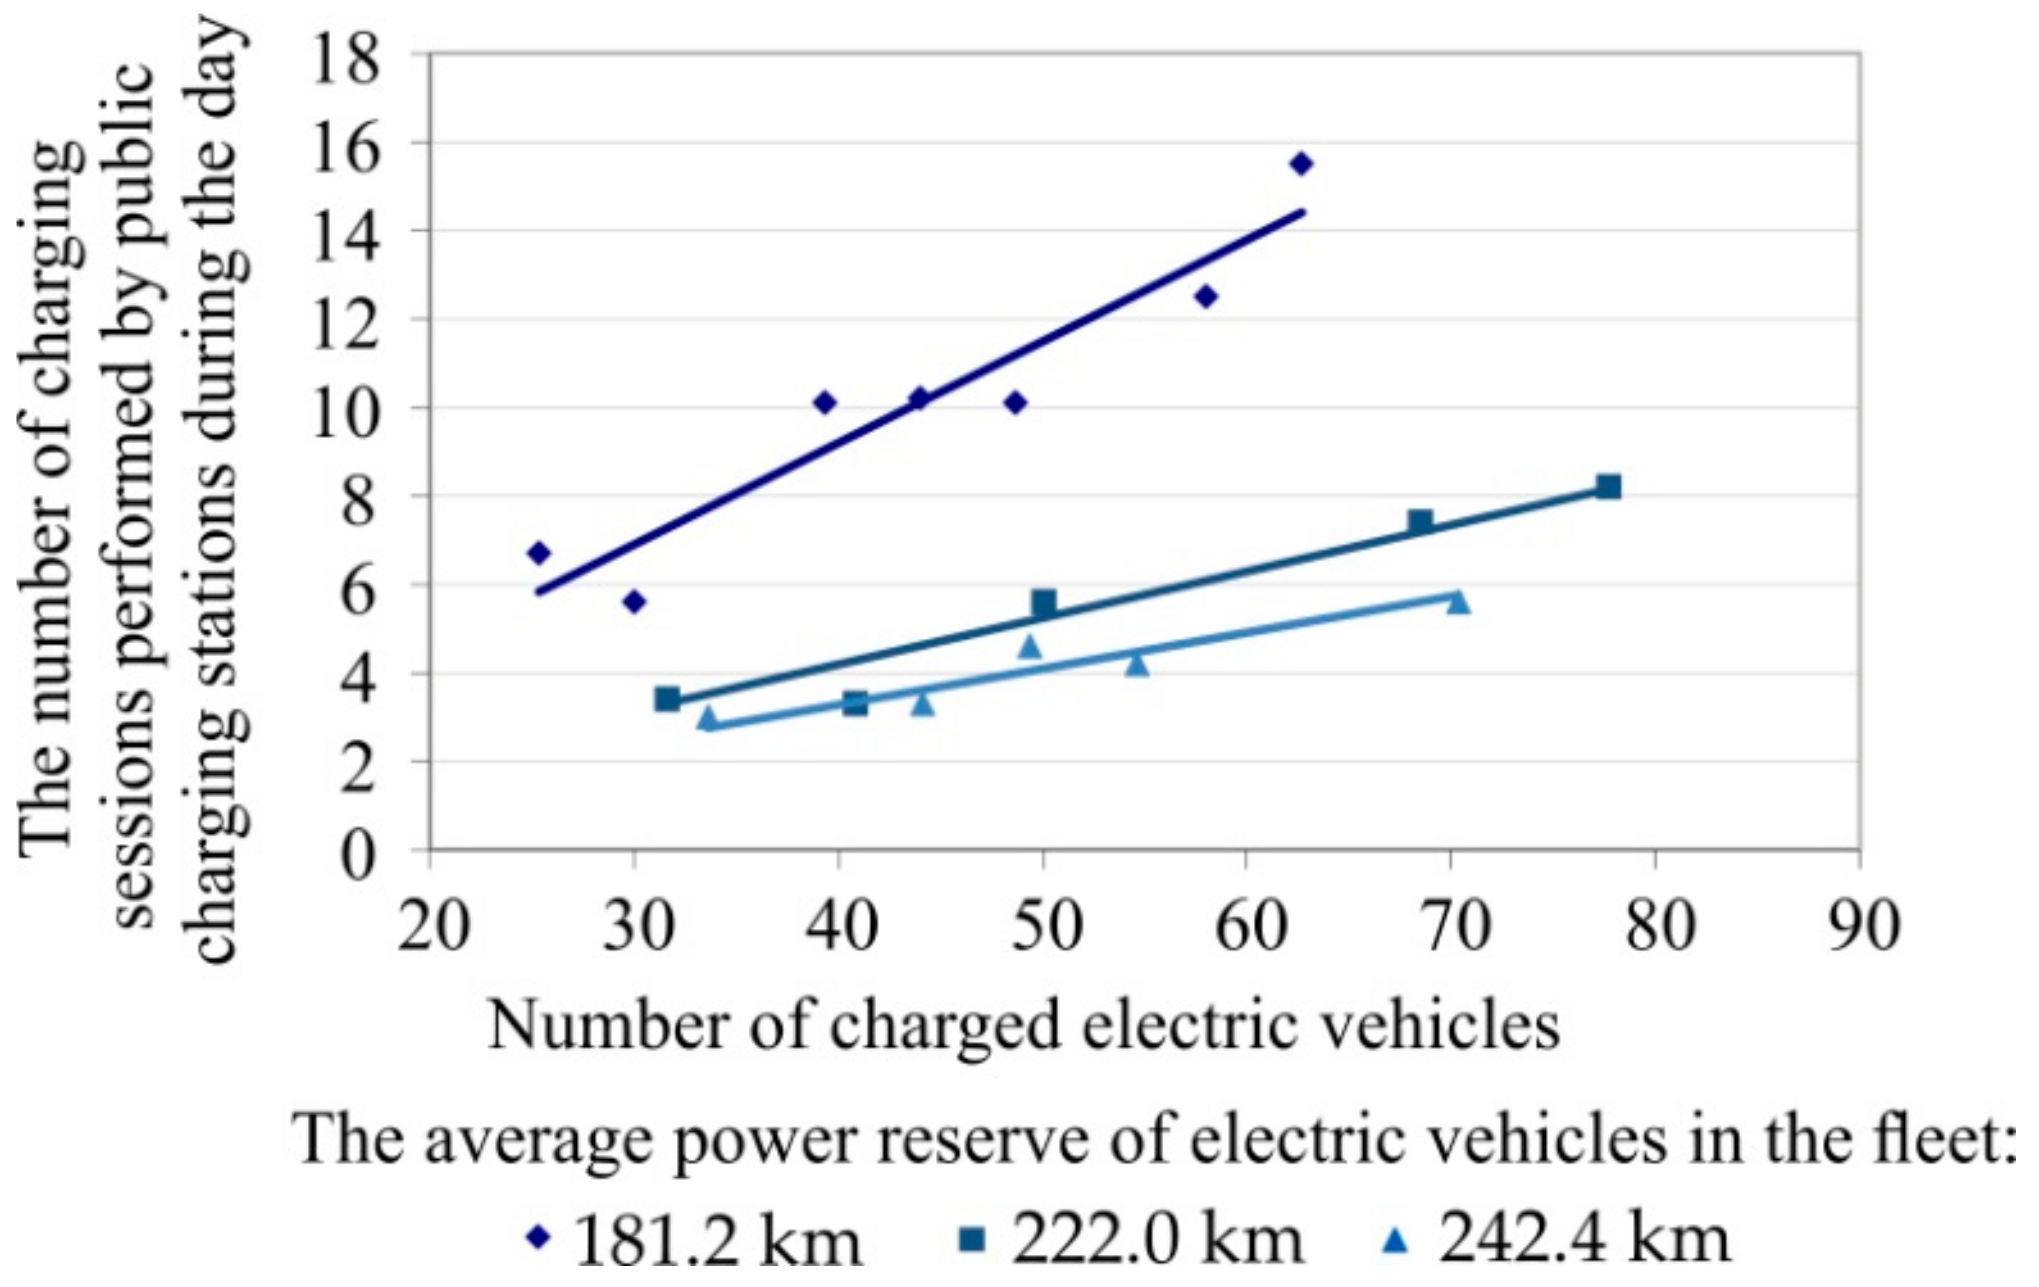
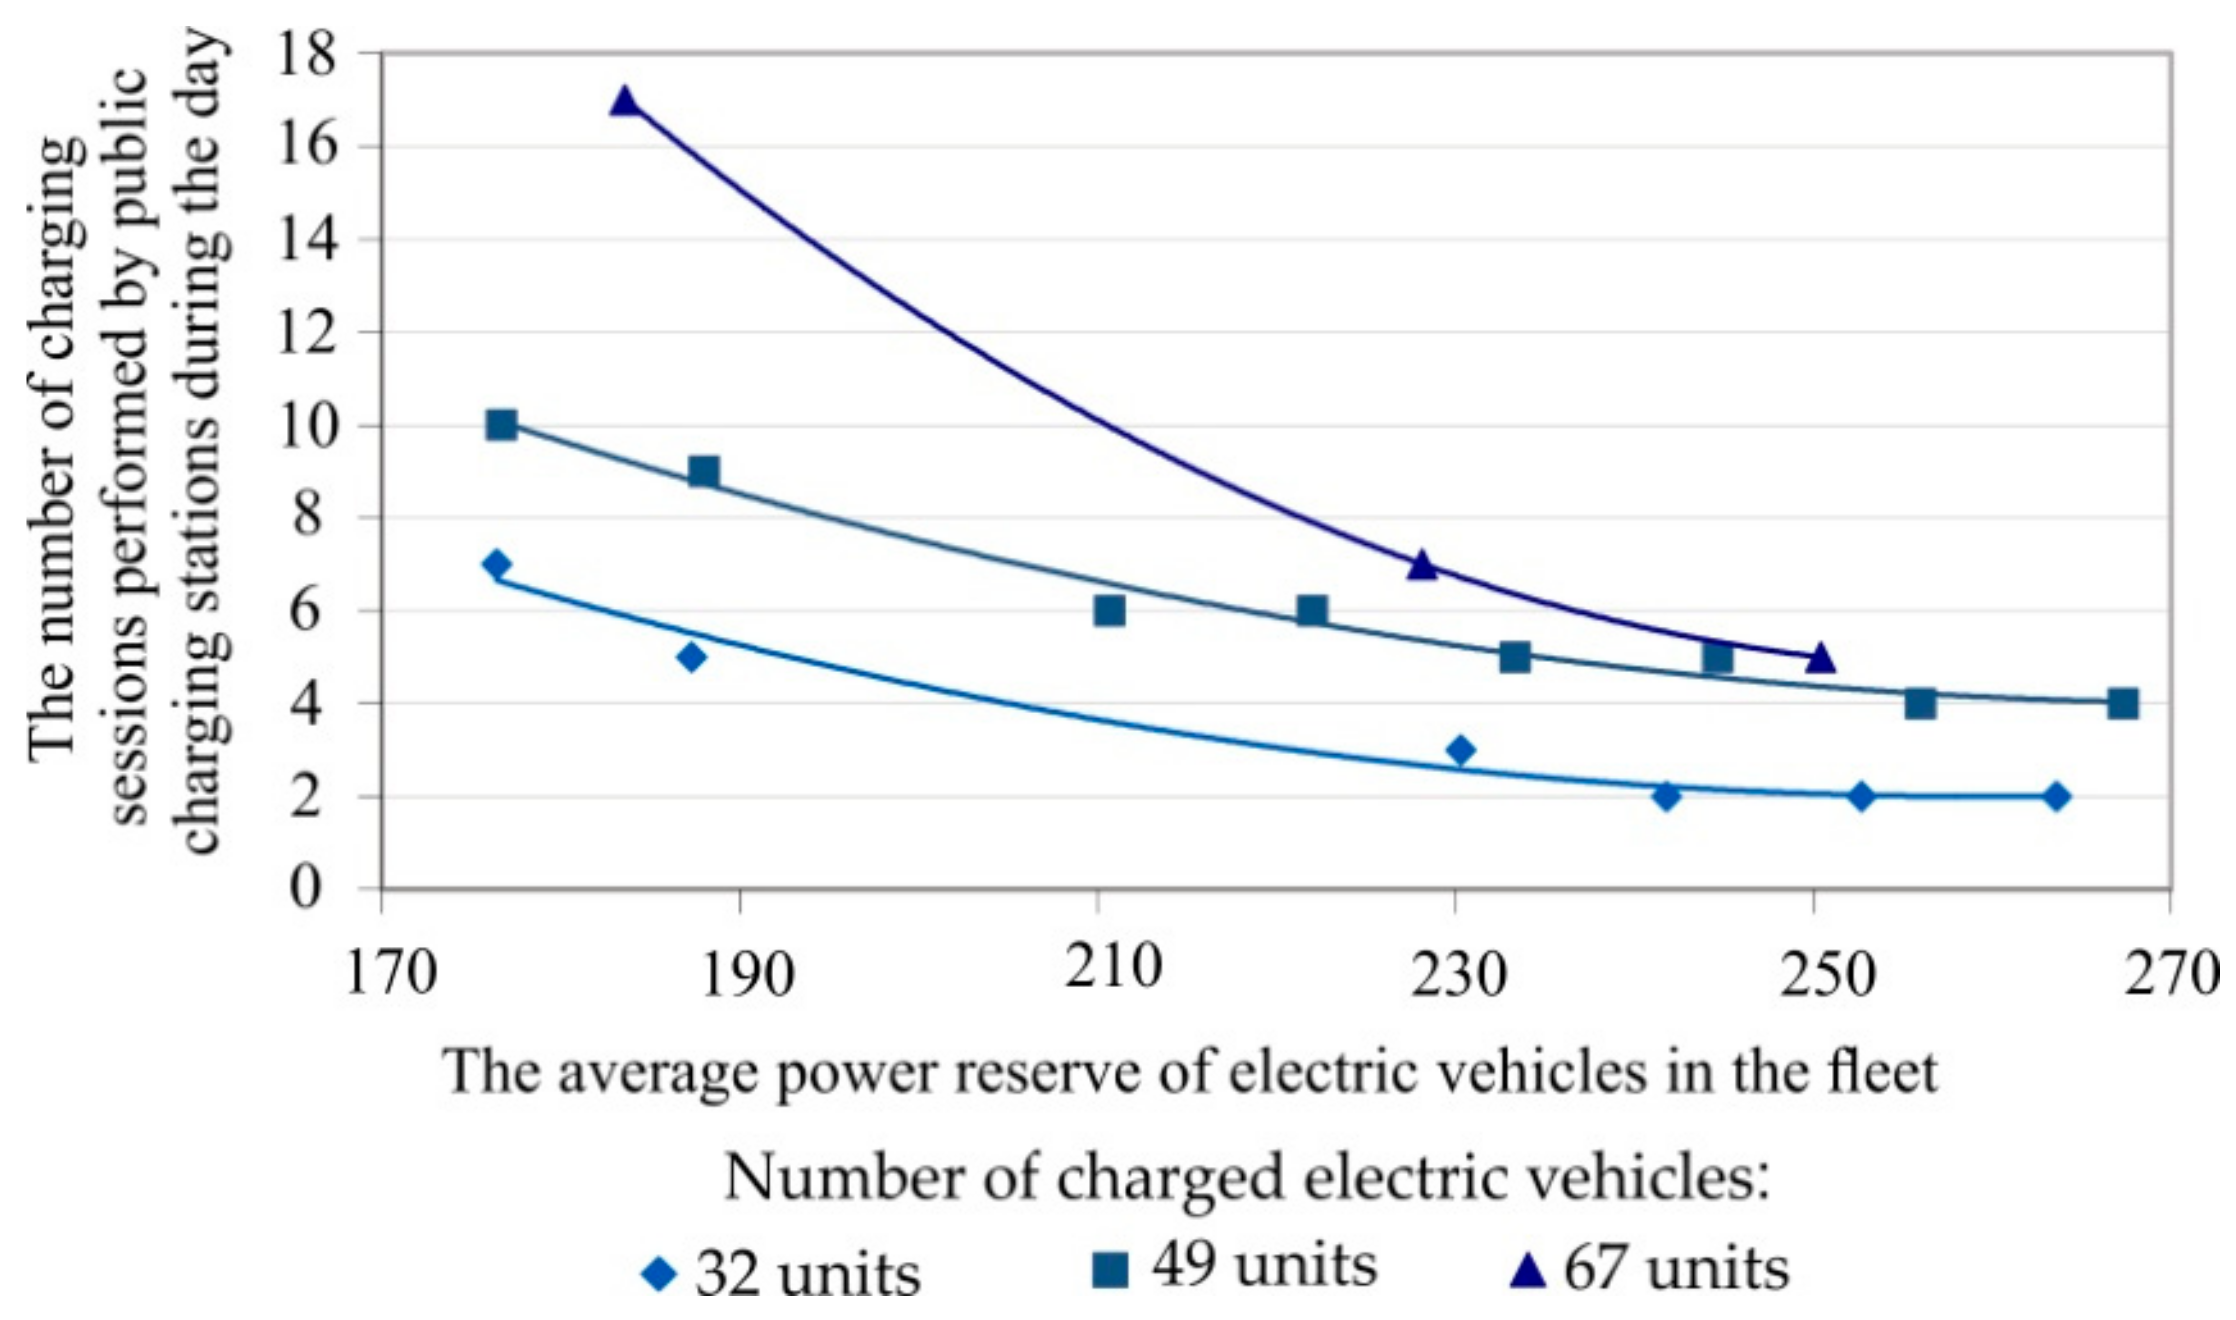
3.3. Regression Models

The input flow of electric vehicles for charging is described using the following factors:
  • number of electric vehicles in operation;
  • cost of a charging session;
  • capacity of electric vehicle batteries in the fleet.
These factors affect the number of charging sessions performed during the day by city public charging stations through additional parameters located at the second level of the system (Figure 1). These parameters are the share of electric vehicles charged from the public charging infrastructure and their power reserve.
The lack of a developed charging infrastructure increases the share of charging sessions performed from “sockets” in personal households, which is observed in the Russian Federation. Also, this trend can be considered when the cost of the charging session is set high. However, at present, we have only established patterns in the number of charging sessions performed by public charging stations from the number of electric vehicles (Figure 6).
The impact of the cost and share of electric vehicles charged from the public charging infrastructure will be considered at the next stage of the study. Currently, the authors have found that as the number of electric vehicles using public charging stations increases, the number of charging sessions performed during the day also rises. Accordingly, this process requires an increase in the number of charging stations in the city. However, as the average capacity of electric vehicle batteries, affecting their average power reserve, increases, the number of charging sessions performed by public charging stations during the day decreases. It may have the opposite effect on the required number of charging stations. Therefore, the obtained patterns require a mathematical description and joint application in a simulation model. The authors put forward a hypothesis about the type of model (2) for the mathematical description of this pattern:
NCSN = c·NEV
where NEV—the number of electric vehicles charged from the public charging infrastructure, vehicle; c—model parameter, charge session/vehicle.
The obtained data were processed using correlation and regression analysis. The results of these procedures are statistical characteristics and parameters of the model (2) presented in Table 3.
In this case, the number of charging sessions and the number of electric vehicles have a high strength of correlation estimated using a correlation coefficient above 0.9. This is confirmed by high values of the calculated student’s criterion. The developed model (2) has a high degree of adequacy, since the Fisher dispersion ratio is greater than the Fisher test and the average approximation error is less than 15%.
The number of charging sessions also depends on the capacity of electric vehicle batteries, which affect the average power reserve. In this study, the average power reserve was determined on the basis of data about models, capacities of batteries and power reserve in accordance with the world driving cycle (WLTP). The average power reserve of electric vehicles, which varied from 177 to 273 km, was obtained depending on the composition of the fleet. Data on the number of charging sessions performed by charging stations during the day were grouped into 8 intervals in accordance with the average electric power reserve. Then, the average power reserve of electric vehicles and the corresponding mathematical expectations of the number of charging sessions were found for each interval. The values for various quantities of electric vehicles were additionally determined in each interval of data divided by the power reserve. However, the amount of data did not satisfy the required error of up to 10% in all intervals of values. Therefore, in some cases, the number of presented values of changes in the charging sessions from the average power reserve may be less than eight. As a result of the described process for experimental data processing, the patterns presented in Figure 7 were obtained.
As the average power reserve of electric vehicles increases, the number of charging sessions performed by charging stations during the day decreases. At the same time, as the number of charged electric vehicles increases, the number of sessions performed by charging stations during the day also rises. The authors put forward a hypothesis about the type of model (3) for the mathematical description of the pattern presented in Figure 6:
NCSL = 1/(a + b·L)
where L—the average power reserve of electric vehicles in the fleet, km; a, b—model parameters, 1/charging session, 1/(km charging session).
The data obtained were processed using correlation and regression analysis, which allowed the authors to identify statistical characteristics and model parameters (3). The results of the analysis are presented in Table 4.
Values of a correlation coefficient of more than 0.95 indicate a high tightness of bonds. The high value of the Fisher dispersion ratio, which exceeds the Fisher test, allows authors to conclude that the model is adequate. This suppose also confirms the value of the average approximation error, which is less than 10–15%.

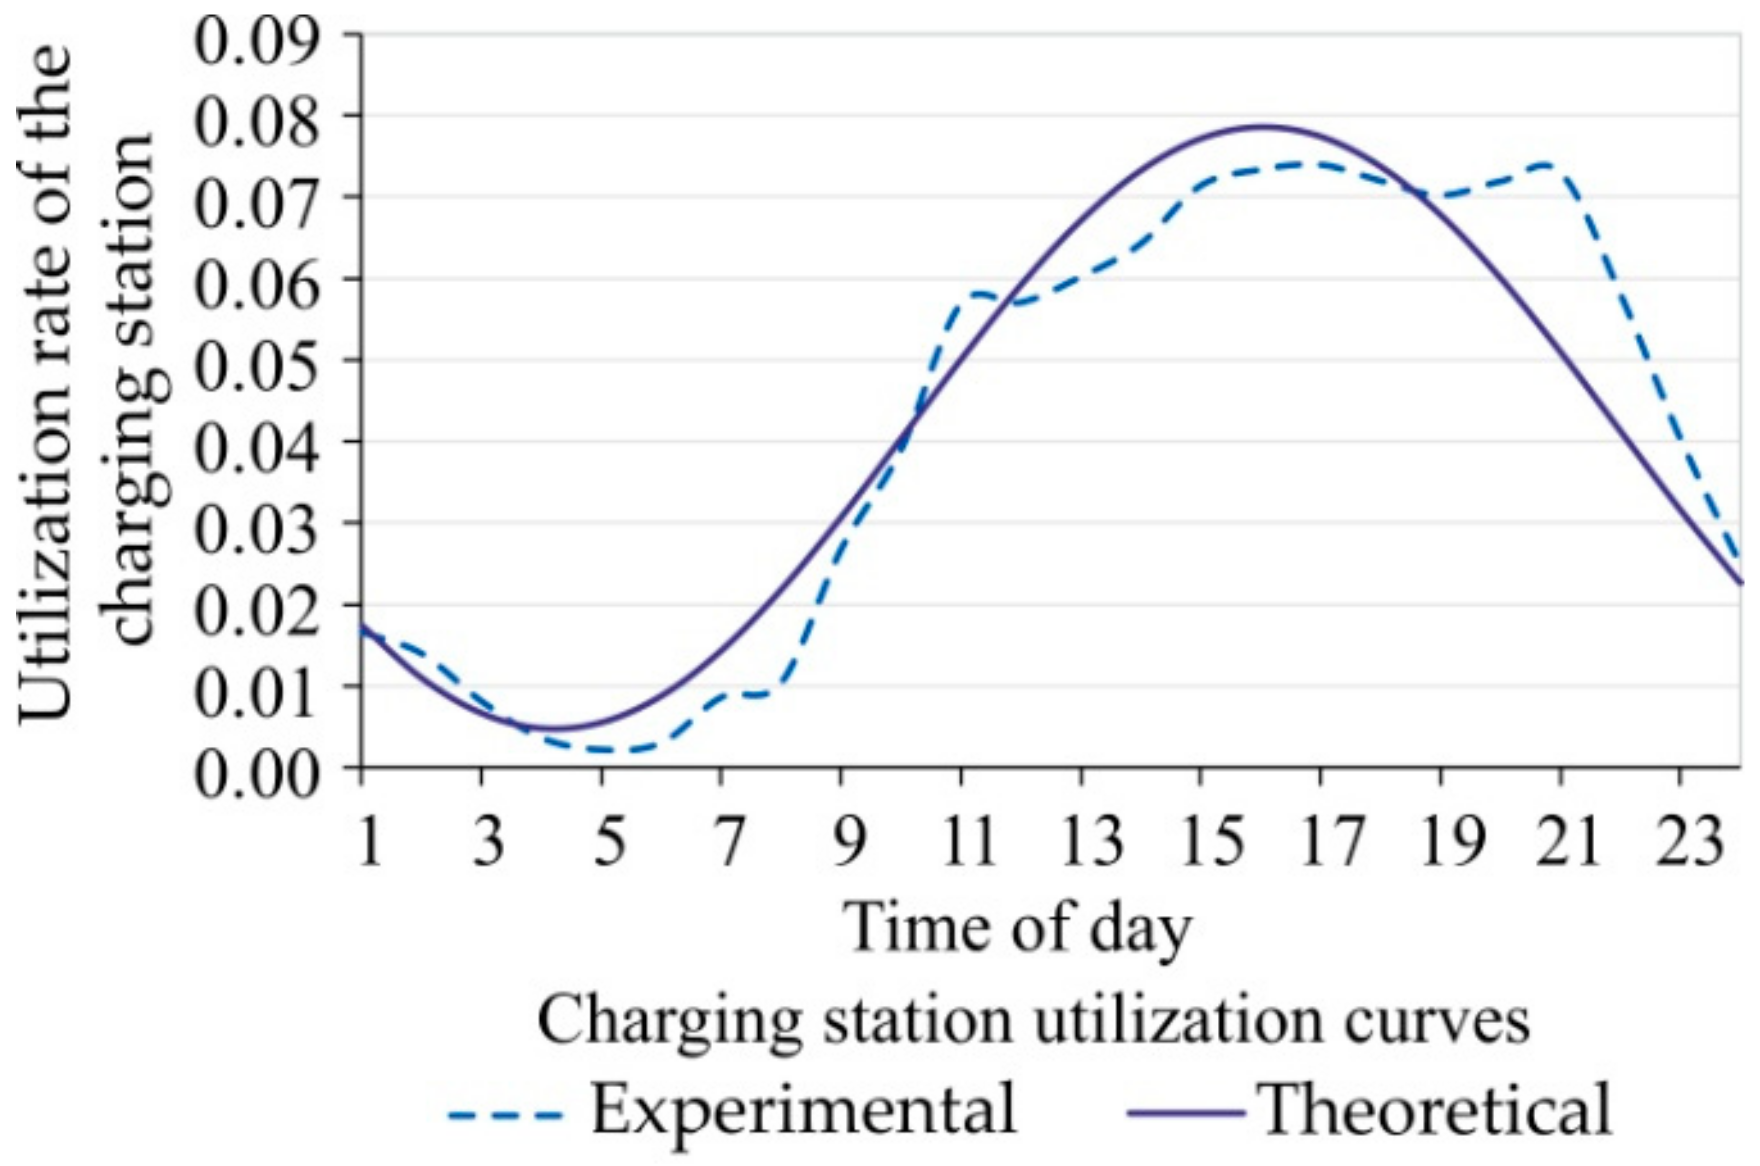
3.4. Harmonic Model of Changing the Utilization Rate of the Charging Station

The obtained number of the charging sessions performed by public charging stations during the day must be distributed over time in accordance with the utilization coefficient. This coefficient was obtained by processing the experimental data and calculating the probability of a charging session. As a result, the calculated values of the probability of using the charging station at different times of the day became the utilization coefficient. A change in the coefficient was described by the harmonic model (Figure 8) for their further application in the developed simulation model for calculating the optimal number of charging stations.
The greatest probability of a charging session is typical for the time period from 14 to 17. At the same time, the least probability of using a charging station is observed from 3 to 5 a.m. The theoretical curve of the change in the utilization coefficient of the charging station is described using a harmonic model of the form (4):
K = 0.0417 + 0.0369·cos (60·(11·t − 4.16))
where t—time of day.
The strength of paired correlations, which was estimated using the correlation ratio, was 0.95. Verification of the model also showed its adequacy since the value of the Fisher dispersion ratio (11.4) exceeds the tabulated value (9.26). The average approximation error was 8.03%, which does not exceed 10–15%.

4. Discussion

The obtained mathematical models provide a simulation instrument to determine the required number of charging stations for electric vehicles in the city. A review of literary sources selected 26 articles that examined the parameters of the charging infrastructure for electric vehicles. 20 of them is about optimal location of charging stations in the city and the rest of them is about a calculation of required number of charging stations. Daskin M.S. showed that calculating the number of objects is a prerequisite for building any model [29]. The absence of this research stage increases the number of infrastructure facilities.
In some studies, methods for determining the number of charging stations are based on the principles of energy equivalence [48]. These methods include the conversion of the amount of fuel consumed by vehicles into electrical energy necessary for the operation of electric vehicles, using the proportionality coefficient. In this case, the estimated number of charging stations corresponds to the stage of a complete transition to electric vehicles, and the development of a phased plan for the development of charging infrastructure is impossible.
A gradual transition and increase in the number of electric vehicles are a condition that is taken into account in some models. These models include the socio-economic factors and the image of a potential electric vehicle owner. The image of a potential owner is based on the level of education, income, gender, age, average travel distance during the day, the number of vehicles in the family [31]. The survey results enable the calculation of the required number of charging stations in each city area identified during the study. A similar approach was used in [28]. In this case, the initial calculation data are the number of vehicles in the family, the average travel distance during the day, the power reserve of operated electric vehicles, and the number of registered electric vehicles. Further, the calculation is performed in each selected geographical area of the city. These methods ensure the phased planning for the development of the charging infrastructure and improve the accuracy of the results. These methods are static. Therefore, calculating the number of charging stations is difficult for a rapidly growing fleet of electric vehicles. A solution to this problem was achieved in [49]. The authors suggested using an agent model to calculate and locate charging stations in the city. The initial data are the territorial plan of the city, the number of registered electric vehicles, the likelihood of increasing the number of electric vehicle owners through verbal advertising, traffic flows in the city, the behavior of electric vehicle owners. As a result, the developed model demonstrates the concentration areas of electric vehicles, which enable the calculation of the required number of charging stations and their location in the city. The application of this approach has a high accuracy of results and a dynamic model change. However, in this case, the collection of source data is difficult.
The method of dynamic modeling, which provides for the probability of a charging session, is a simulation tool based on the theory of queuing systems [50,51]. The input flow is described by the intensity of the electric vehicles for charging, which in most papers obeys Poisson’s law. Moreover, the calculation of the number of charging stations is based on the search for a correspondence between the intensity of electric vehicles for charging and charging time (as a rule, it is described using the exponential law). This approach is a dynamic method and ensures the development of a phased plan for the development of charging infrastructure, as shown in Table 5. However, the input flow should be described by the data obtained during the operation of the existing charging infrastructure, and take into account the features of the object location in the simulation model. Based on this methodological gap in the collection of data on the input flow to charging stations, the authors of this article had to develop the input flow of electric vehicle for charging taking into account features of the existing charging infrastructure operation.
Despite various approaches to determining the number of charging stations, authors analyzed the factors presented in Table 5 and identified the significant factors in calculating the number of charging stations in urban areas. These factors were taken into account in regression models and patterns that confirmed the hypotheses identified in early studies [28,31]. As the charged electric vehicles number increases, the number of charging sessions also rises. However, as the average electric vehicle power reserve increases, the number of charging sessions decreases. The law describing the distribution function of the intensity of electric vehicles for charging differs from those received previously [50,51]. In this research, the distribution function obeys the Weibull law.
During the study, the authors additionally developed a mathematical model for changing the utilization coefficient of the charging station during the day to increase the accuracy of the results. Further development of the method for calculating the number of charging stations involves identifying patterns of change in charging time from the parameters of stations and rechargeable electric vehicles, as well as creating a simulation model to find the best option in automatic mode.

5. Conclusions

This study describes the features of the formation of the input flow of electric vehicles for charging. The obtained results will be used for determining the required number of charging stations in cities based on the theory of queuing systems. The developed methodology will also enable determining the optimal location of charging stations and adjusting the obtained infrastructure parameters taking into account the power supply of the city electric network from renewable energy sources. This approach, based on the processing of existing data on the functioning of the charging infrastructure for electric vehicle, was not found before. Although it became widespread in the organization of the charging infrastructure for passenger public transport. Therefore, the research aim is to develop a comprehensive methodology for designing a charging infrastructure for electric vehicles, which will include:
  • calculation of the required number of charging stations on the basis of data on the existing charging infrastructure operation and a simulation model of its development;
  • determining the location of the charging stations in the city on the basis of data on their quantity and development over time, features of the electric network (use of renewable energy sources), distance of coverage.
This article presents the results of the first research stage. An analysis of previous researches, the developed system for determining the required number of charging stations and a priori factor ranking showed significant factors affecting the parameters of the charging infrastructure. These are the capacity of batteries, the cost of the charging session and the number of electric vehicles in the fleet. The influence of these factors on the input flow of electric vehicles for charging was determined using the parameters of a second level system. These parameters were the power reserve of electric vehicles (depending on the capacity of the traction batteries of electric vehicles) and the number of electric vehicles charged from the public charging infrastructure (a value that determines the proportion of electric vehicles in the fleet charged from public charging stations). The influence of these parameters on the input flow was described using regression models. A decrease in the power reserve of electric vehicles (25.2–33.7%) and an increase in the number of charged electric vehicles (40.0–62.5%) rise the number of charging sessions performed by public charging stations during the day (54.3–60.3%). Therefore, the determination of the required number of charging stations using only the obtained mathematical models is difficult and requires the development of a simulation model. In general, the number of charging sessions performed by public charging stations during the day is stochastic and varies from 2 to 22 charge sessions per day. Therefore, this parameter was described using the distribution function of Weibull (this is confirmed by the results of processing the experimental data). The obtained values of the charging session number performed by public charging stations during the day must be distributed over time in accordance with the utilization coefficient. A change in the coefficient was described by the harmonic model for their further application in the developed simulation model for calculating the optimal number of charging stations.
Thus, the results of the first research stage will be included in the simulation model for calculating the required number of charging stations in the city. The correspondence between the result of the obtained models and the charge time of the traction battery of the electric vehicle will determine the required number of charging stations. Then this value together with the features of the city’s electric network, walking distance and other data will be taken into account in the model of location of charging stations in the city. Further implementation of the research involves the study of existing charging stations and their development prospects, as well as the creation of a simulation model for calculating the parameters of the urban charging infrastructure.

Author Contributions

All the authors contributed equally to the present work. Conceptualization and Methodology, I.A.; Formal Analysis and Investigation, A.G.; Writing—Original Draft Preparation, A.G.; Supervision, I.A.; Writing—Review and Editing, E.M., Validation, E.M. All authors have read and agreed to the published version of the manuscript.

Funding

This research received no external funding.

Acknowledgments

The work was supported by the Ministry of Science and Higher Education, contract № 0825-2020-0014. The work was supported by Act 211 of the Government of the Russian Federation, contract № 02.A03.21.0006.

Conflicts of Interest

The authors declare no conflict of interest.

References

  1. Avtar, R.; Tripathi, S.; Aggarwal, A.K.; Kumar, P. Population-Urbanization-Energy Nexus: A Review. Resources 2019, 8, 136. [Google Scholar] [CrossRef] [Green Version]
  2. Genon, G.; Panepinto, D.; Viggiano, F.; Magaril, E.; Abrzhina, L.; Magaril, R. Sustainability in automotive transport: Russian and Italian experience concerning actual situation and intervention tools. Int. J. Sustain. Dev. Plan. 2016, 11, 603–615. [Google Scholar] [CrossRef]
  3. Stroe, C.-C.; Panaitescu, V.N.; Ragazzi, M.; Rada, E.C.; Ionescu, G. Some considerations on the environmental impact of highway traffic. Rev. Chim. 2014, 65, 152–155. [Google Scholar]
  4. Magaril, E.; Magaril, R. Fuel quality: Challenges to the sustainable development of automobile transport and approach to solution. E3S Web Conf. 2016, 6, 03001. [Google Scholar] [CrossRef] [Green Version]
  5. Ionescu, G.; Apostol, T.; Rada, E.C.; Ragazzi, M.; Torretta, V. Critical analysis of strategies for PM reduction in urban areas. UPB Sci. Bull. Ser. D Mech. Eng. 2013, 75, 175–186. [Google Scholar]
  6. Istrate, I.A.; Oprea, T.; Rada, E.C.; Torretta, V. Noise and air pollution from urban traffic. WIT Trans. Ecol. Environ. 2014, 191, 1381–1389. [Google Scholar] [CrossRef]
  7. Magaril, E. The solution to strategic problems in the oil refining industry as a factor for the sustainable development of automobile transport. WIT Trans. Ecol. Environ. 2014, 190, 821–832. [Google Scholar] [CrossRef] [Green Version]
  8. International Renewable Energy Agency. Global Energy Transformation: A Roadmap to 2050 (2019 Edition); International Renewable Energy Agency: Abu Dhabi, UAE, 2019. [Google Scholar]
  9. Gitelman, L.; Magaril, E.; Kozhevnikov, M.; Rada, E.C. Rational behavior of an enterprise in the energy market in a circular economy. Resources 2019, 8, 73. [Google Scholar] [CrossRef] [Green Version]
  10. Panepinto, D.; Zanetti, M.C.; Gitelman, L.; Kozhevnikov, M.; Magaril, R.; Magaril, R. Energy from Biomass for Sustainable Cities. IOP Conf. Ser. Earth Environ. Sci. 2017, 72, 012021. [Google Scholar] [CrossRef] [Green Version]
  11. Al-Kayiem, H.H. Hybrid techniques to enhance solar thermal: The way forward. Int. J. Energy Prod. Manag. 2016, 1, 50–60. [Google Scholar] [CrossRef] [Green Version]
  12. Burakova, A.D.; Burakova, L.N.; Anisimov, I.A.; Burakova, O.D. Evaluation of the operation efficiency of solar panels in winter. IOP Conf. Ser. Earth Environ. Sci. 2017, 72, 012022. [Google Scholar] [CrossRef] [Green Version]
  13. Anisimov, I.A.; Burakova, L.N.; Burakova, A.D.; Burakova, O.D. Assessment of a solar cell panel spatial arrangement influence on electricity generation. Iop Conf. Ser. Earth Environ. Sci. 2017, 66, 012007. [Google Scholar] [CrossRef]
  14. International Renewable Energy Agency. Electrification with Renewable. Driving the Transformation of Energy Services; International Renewable Energy Agency: Abu Dhabi, UAE, 2019. [Google Scholar]
  15. Kush-Brandt, S. Urban Renewable Energy on the Upswing: A Spotlight on Renewable Energy in Cities in REN21’s “Renewables 2019 Global Status Report”. Resources 2019, 8, 139. [Google Scholar] [CrossRef] [Green Version]
  16. Gavrikova, E.; Burda, E.; Gavrikov, V.; Sharafutdinov, R.; Volkova, I.; Rubleva, M.; Polosukhina, D. Clean Energy Sources: Insights from Russia. Resources 2019, 8, 84. [Google Scholar] [CrossRef] [Green Version]
  17. International Renewable Energy Agency. Renewable Capacity Statistics 2018; International Renewable Energy Agency (IRENA): Abu Dhabi, UAE, 2018. [Google Scholar]
  18. Gielen, D.; Boshel, F.; Saygin, D.; Bazilian, M.; Wanger, N.; Gorini, R. The role of renewable energy in the global energy transformation. Energy Strategy Rev. 2019, 24, 38–50. [Google Scholar] [CrossRef]
  19. Funke, S.; Sprei, F.; Ghann, T.; Plotz, P. How much charging infrastructure do electric vehicles need? A review of the evidence and international comparison. Transp. Res. Part D Transp. Environ. 2019, 77, 224–242. [Google Scholar] [CrossRef]
  20. International Renewable Energy Agency. Innovation Outlook: Smart Charging for Electric Vehicles; International Renewable Energy Agency: Abu Dhabi, UAE, 2019. [Google Scholar]
  21. International Renewable Energy Agency. Innovation Landscape Brief: Electric-Vehicle Smart Charging; International Renewable Energy Agency: Abu Dhabi, UAE, 2019. [Google Scholar]
  22. Rietmann, N.; Hugler, B.; Lieven, T. Forecasting the trajectory of electric vehicle sales and the consequences for worldwide CO2 emissions. J. Clean. Prod. 2020, 261, 121038. [Google Scholar] [CrossRef]
  23. International Renewable Energy Agency. The Renewable Route to Sustainable Transport: A Working Paper based on Remap; International Renewable Energy Agency: Abu Dhabi, UAE, 2016. [Google Scholar]
  24. Taljegard, M.; Goranssom, L.; Odenberger, M.; Johnsson, F. Impacts of electric vehicles on the electricity generation portfolio – A Scandinavian-German case study. Appl. Energy 2019, 97, 1637–1650. [Google Scholar] [CrossRef]
  25. Chen, L.; Wu, Z. Study on the effects of EV charging to global load characteristics via charging aggregators. Energy Procedia 2018, 145, 175–180. [Google Scholar] [CrossRef]
  26. Vosooghi, R.; Puchinger, J.; Bischoff, J.; Jankovic, M.; Vouillon, A. Shared autonomous electric vehicle service performance: Assessing the impact of charging infrastructure. Transp. Res. Part D Transp. Environ. 2020, 81, 102283. [Google Scholar] [CrossRef] [Green Version]
  27. Anisimov, I.A.; Burakova, A.D.; Burakova, L.N. Increasing the efficiency of electricity production from renewable source for charging electric vehicles. In Proceedings of the 2018 International Multi-Conference on Industrial Engineering and Modern Technologies, Vladivostok, Russia, 3–4 October 2018; p. 18393143. [Google Scholar] [CrossRef]
  28. Frade, I.; Ribeiro, A.; Goncalves, G.A.; Antunes, A.P. Optimal location of charging stations for electric vehicles in a neighborhood in Lisbon, Portugal. Trans. Res. Rec. J. Trans. Res. Board 2011, 2252, 91–98. [Google Scholar] [CrossRef] [Green Version]
  29. Daskin, M.S. What you should know about location modeling. Nav. Res. Logist. 2008, 405, 283–294. [Google Scholar] [CrossRef]
  30. Daskin, M.S. Network and Discrete Location. Models, Algorithms, and Applications, 2nd ed.; John Wiley & Sons: Hoboken, NJ, USA, 2013; pp. 124–362. [Google Scholar]
  31. Gimenez-Gaydou, D.A.; Ribeiro, A.N.; Gutierrea, J.; Antunes, A.P. Optimal location of battery electric vehicle charging stations in urban areas: A new approach. Int. J. Sustain. Trans. 2016, 10, 393–405. [Google Scholar] [CrossRef]
  32. Wang, Y.W.; Lin, C.C. Locating multiple types of recharging stations for battery-powered electric vehicle transport. Trans. Res. Part E 2013, 58, 76–87. [Google Scholar] [CrossRef]
  33. Lam, A.S.; Leung, Y.W.; Chu, X. Electric vehicle charging station placement: Formulation, complexity, and solutions. IEEE Trans. Smart Grid 2014, 5, 2846–2856. [Google Scholar] [CrossRef] [Green Version]
  34. Mak, H.Y.; Rong, Y.; Shen, Z.M. Infrastructure planning for electric vehicles with battery swapping. Manag. Sci. 2013, 59, 1557–1575. [Google Scholar] [CrossRef] [Green Version]
  35. Ko, J.; Shim, J.S. Locating battery exchange stations for electric taxis: A case study of Seoul, South Korea. Int. J. Sustain. Trans. 2016, 10, 139–146. [Google Scholar] [CrossRef]
  36. He, S.; Kuo, Y.H.; Wu, D. Incorporating institutional and spatial factors in the selection of the optimal locations of public electric vehicle charging facilities: A case study of Beijing, China. Trans. Res. Part C Emerg. Technol. 2016, 67, 131–148. [Google Scholar] [CrossRef]
  37. Ghamami, M.; Nie, Y.; Zockaie, A. Planning charging infrastructure for plug-in electric vehicles in city centers. Int. J. Sustain. Trans. 2016, 10, 343–353. [Google Scholar] [CrossRef]
  38. Hanabusa, H.; Horiguchi, R. A study of the analytical method for the location planning of charging stations for electric vehicles. In Proceedings of the Knowledge-Based and Intelligent Information and Engineering Systems, Kaiserslautern, Germany, 12–14 September 2011; Dengel, A., Hinkelmann, K., Eds.; pp. 596–605. [Google Scholar] [CrossRef]
  39. Dong, J.; Liy, C.; Lin, Z. Charging infrastructure planning for promoting battery electric vehicles: An activity-based approach using multiday travel data. Trans. Res. Part C 2014, 38, 44–55. [Google Scholar] [CrossRef] [Green Version]
  40. Cui, S.; Zhao, H.; Wen, H.; Zhang, C. Locating multiple size and multiple type of charging station for battery electricity vehicles. Sustainability 2018, 10, 3267. [Google Scholar] [CrossRef] [Green Version]
  41. Chen, T.D.; Kockelman, K. The electric vehicle charging station location problem: A parking-based assignment method for Seattle. Trans. Res. Rec. 2013, 13, 1254. [Google Scholar] [CrossRef]
  42. Dashora, Y.; Barnes, J.W.; Pillai, R.; Combs, T.; Hilliard, M.; Chinthavali, M. The PHEV Charging Infrastructure Planning (PCIP) Problem. Int. J. Emerg. Electr. Power Syst. 2010, 11, 2482. [Google Scholar] [CrossRef]
  43. Ge, S.; Feng, L.; Liu, H.; Wang, L. The planning of electric vehicle charging stations in the urban area. In Proceedings of the International Conference on Electronic & Mechanical Engineering and Information Technology (EMEIT-2012), Paris, France, 7 September 2012; Atlantis Press: Paris, France, 2012; p. 356. [Google Scholar] [CrossRef] [Green Version]
  44. Chen, C.; Hua, G. A new model for optimal deployment of electric vehicle charging and battery swapping stations. Int. J. Control Auto. 2014, 7, 247–258. [Google Scholar] [CrossRef]
  45. Wolbertus, R.; Hoed, R. Electric vehicle fast charging needs in cities and along corridors. World Electr. Veh. J. 2019, 10, 45. [Google Scholar] [CrossRef] [Green Version]
  46. Cruz-Zambrzno, M.; Corchero, C.; Igualada-Gonzalez, L. Optimal location of fast charging stations in Barcelona: A Flow-Capturing approach. In Proceedings of the 10th International Conference on the European Energy Market (EEM), Stockholm, Sweden, 27–31 May 2013; p. 13797585. [Google Scholar] [CrossRef] [Green Version]
  47. Nie, Y.; Ghamami, M. A corridor-centric approach to planning electric vehicle charging infrastructure. Trans. Res. Pat. B 2013, 57, 172–190. [Google Scholar] [CrossRef]
  48. Wang, Z.; Liu, P.; Cui, J.; Xi, Y.; Zhang, L. Research on quantitative models of electric vehicle charging stations based on principle of energy equivalence. Math. Prob. Eng. 2013, 2013, 959065. [Google Scholar] [CrossRef]
  49. Sweda, T.; Klabjan, D. An agent-based decision support system for electric vehicle charging infrastructure deployment. In Proceedings of the IEEE Vehicle Power and Propulsion Conference, Chicago, IL, USA, 6–9 September 2011; p. 12339422. [Google Scholar] [CrossRef]
  50. Farkas, C.; Prikler, L. Stochastic modelling of EV charging at charging stations. In Proceedings of the International Conference on Renewable Energies and Power Quality (ICREPQ’12), Santiago De Compostela, Spain, 28–30 March 2012; p. 574. [Google Scholar] [CrossRef]
  51. Li, R.; Su, H. Optimal Allocation of Charging Facilities for Electric Vehicles Based on Queuing Theory. Autom. Electr. Power Syst. 2011, 35, 58–61. [Google Scholar]
  52. Conti, V.; Orchi, S.; Valentini, M.; Nigro, M.; Calo, R. Design and evaluation of electric solutions for public transport. Transp. Res. Procedia 2017, 27, 117–124. [Google Scholar] [CrossRef]
  53. Fusco, G.; Alessandrini, A.; Colombaroni, C.; Valentini, M. A model for transit design with choice of electric charging system. Procedia Soc. Behav. Sci. 2013, 87, 234–249. [Google Scholar] [CrossRef] [Green Version]
  54. Filippo, G.; Marano, V.; Sioshansi, R. Simulation of an electric transportation system at the Ohio State University. Appl. Energy 2014, 11, 1686–1691. [Google Scholar] [CrossRef]
  55. Abdulaed, E.K.; Makharatkin, P.N.; Pumpur, E.V. A priori ranking and an analysis of factors affecting tire wear. Iop Conf. Ser. Earth Environ. Sci. 2019, 378, 01200. [Google Scholar] [CrossRef]
  56. Podvazko, V.; Sivilevicius, H. The use of AHP and rank correlation methods for determining the significance of the interaction between the elements of a transport system having a strong influence on traffic safety. Transport 2013, 28, 389–403. [Google Scholar] [CrossRef]
Figure 1. The scheme of the study.
Sustainability 12 05571 g001
Figure 2. The system for determining the required number of urban public charging stations for electric vehicles.
Sustainability 12 05571 g002
Figure 3. The results of a priori ranking of factors affecting the characteristics of the input flow and the service process.
Sustainability 12 05571 g003
Figure 4. The distribution function of the charging session number performed during the day by the urban charging infrastructure.
Sustainability 12 05571 g004
Figure 5. The distribution function of the charging session performed during the day by public charging stations for electric vehicles in: (a)–Moscow; (b)–St.Petersburg; (c)–Tyumen.
Sustainability 12 05571 g005
Figure 6. The pattern in the number of the charging session performed by public charging stations during the day from the number of electric vehicles using the infrastructure.
Sustainability 12 05571 g006
Figure 7. The pattern in the number of the charging session performed during the day from the average power reserve of electric vehicles in the fleet.
Sustainability 12 05571 g007
Figure 8. Curves of changes in the utilization coefficient of the charging station during the day.
Sustainability 12 05571 g008
Table 1. An example of filling out a table on the ranking of factors affecting the required number of charging stations by an expert.
FactorPoints
(From 1 to 10)
Number of electric vehicles in use7
Traction battery capacity3
Residual capacity of the traction battery6
Average daily vehicle mileage9
Average daily ambient temperature8
Parameters of installed charging stations2
Charging session cost4
Location of charging stations5
Features of driving an electric car (driver behavior)10
The cost of charging stations1
Table 2. Statistical characteristics of the distribution function.
Statistical CharacteristicValue
Expectation, charging session per day5
Variation coefficient 0.61
Skewness0.98
Excess3.36
Calculated value of the Pearson test139.71
Critical value of the Pearson test2.92
Table 3. Statistical characteristics and model parameters (2).
Statistic Characteristic, Model ParameterValue for an Average Power Reserve
181.2222.0242.4
Model parameter c, charge session/vehicle0.230.110.08
Correlation coefficient0.950.970.94
Determination coefficient R20.900.950.89
Table value of student criterion tp2.782.783.18
Calculated value of student criterion t6.728.804.81
Fisher test Fp6.616.615.54
Fisher Dispersion Ratio F8.5917.66.12
Average approximation error,%9.37.07.8
Table 4. Statistical characteristics and model parameters (3).
Statistic Characteristic, Model ParameterValue for EM Quantity
324967
Model parameter a, 1/charging session−0.564−0.227−0.300
Model parameter b, 1/(km charging session)0.0040.0020.002
Correlation coefficient0.960.950.99
Determination coefficient R20.920.910.97
Table value of student criterion tp2.782.444.30
Calculated value of student criterion t6.877.645.98
Fisher test Fp4.543.7818.51
Fisher Dispersion Ratio F10.679.3824.5
Average approximation error,%8.497.126.71
Table 5. Summary of previous study results.
StudyMethod of the Charging Stations Number Calculation Factors Taken into Account in the CalculationAdvantagesDisadvantages
(Wang, Z.; Liu, P.; Cui, J.; Xi, Y.; Zhang, L. 2013)Method of energy equivalence.Daily fuel sales at gas stations.
Daily electricity sales at charging stations.
Coefficient of proportionality.
Number of gas stations.
Average fuel consumption per 100 km by vehicle.
The method enables determining the maximum amount of energy consumed by electric vehicles in the absence of traditional vehicles.The method does not ensure the development of a plan for the phased development of the charging infrastructure in accordance with the increase in the number of operated electric vehicles.
(Gimenez-Gaydou, D.A.; Ribeiro, A.N.; Gutierrea, J.; Antunes, A.P. 2016)Calculation method based on the image of a potential electric vehicle ownerEducation.
Income.
Gender.
Age.
Average travel distance per day.
Number of vehicles in the household.
The method enables determining the optimal number of charging stations in the city during a gradual transition to electric vehiclesThe method is static. The collection and processing of initial data for the calculation is difficult.
(Frade, I.; Ribeiro, A.; Goncalves, G.A.; Antunes, A.P. 2011)Method for calculating the number of charging stations taking into account demandNumber of vehicles in the household.
Number of vehicles/electric vehicles in various areas of the city.
Average tavel distance during the day.
Average power reserve of electric vehicles.
The method enables determining the optimal number of charging stations in the city during a gradual transition to electric vehiclesThe method is static. The collection and processing of initial data for the calculation is difficult.
(Sweda, T.; Klabjan, D. 2011)
Method for calculating the number of charging stations based on agent modelingData on population movements in the city.
Likelihood of verbal advertising influencing the acquisition of an electric vehicle by a new owner.
Layout of the places of work and rest of the population.
The method is dynamic and provides the opportunity to develop several scenarios for the development of charging infrastructure in the gradual transition to electric vehicles.Source data collection is difficult
(Farkas, C.; Prikler, L. 2011)Method for calculating the number of charging stations based on stochastic modelingIntensity of electric vehicles at charging stations.
Charging time.
The method is dynamic and enables adjusting the parameters of charging stations, as well as determining their optimal number in different conditions.In this article, the intensity of electric vehicle for charging and the charging time are accepted on the basis of theoretical laws.
(Li, R.; Su, H. 2011)Method for calculating the number of charging stations based on the theory of queuing systemsNumber of electric vehicles charged from the charging infrastructure.
Average power consumption by an electric vehicle.
Average daily mileage of electric vehicles.
Electric vehicle battery capacity.
Time required for electric vehicle to enter and exit from the charging station.
Average charge time of an electric vehicle.
The method takes into account data on the fleet of electric vehicles and provides for minimizing the cost of building infrastructure with a gradual transition to electric vehicles.The method does not provide accounting for the stochastic process of functioning of the charging infrastructure.

