Employment and Gross Value Added in Agriculture Versus Other Sectors of the European Union Economy


Abstract
1. Introduction
- analysis of employment levels and GVA in the sectors of the economy in 2000 and 2018 as well as the relationship between employment and GVA;
- assessment of GVA per 1 person employed in the investigated sectors and its changes in the analysed years;
- assessment of the scale of surplus employment in agriculture, assuming that GVA per 1 person employed in this sector would be equal to the average level reached in the secondary and tertiary sectors.
2. Background and Literature Review
3. Materials and Methods
- Excess Employment Rate In The Agricultural Sector by country (EERASc),where: GVAp refers to GVA per 1 employed person in the industry and the services sectors in the national economy of the investigated country;
- Excess Employment Rate In The Agricultural Sector compared to EU-17 (EERAS-EU17), facilitating a comparison to the average GVA level per 1 person employed outside agriculture in the most developed EU countries,where: GVAp refers to GVA per 1 employed person in the industry and the services sectors in the EU-17 economy;
- Excess Employment Rate In The Agricultural Sector compared to EU-11 (EERAS-EU11), facilitating a comparison to the average GVA level per 1 person employed outside agriculture in the group of the former socialist countries currently being EU members,where: GVAp refers to GVA per 1 employed person in the industry and the services sectors in the EU-11 economy.
4. Results and Discussion
5. Conclusions
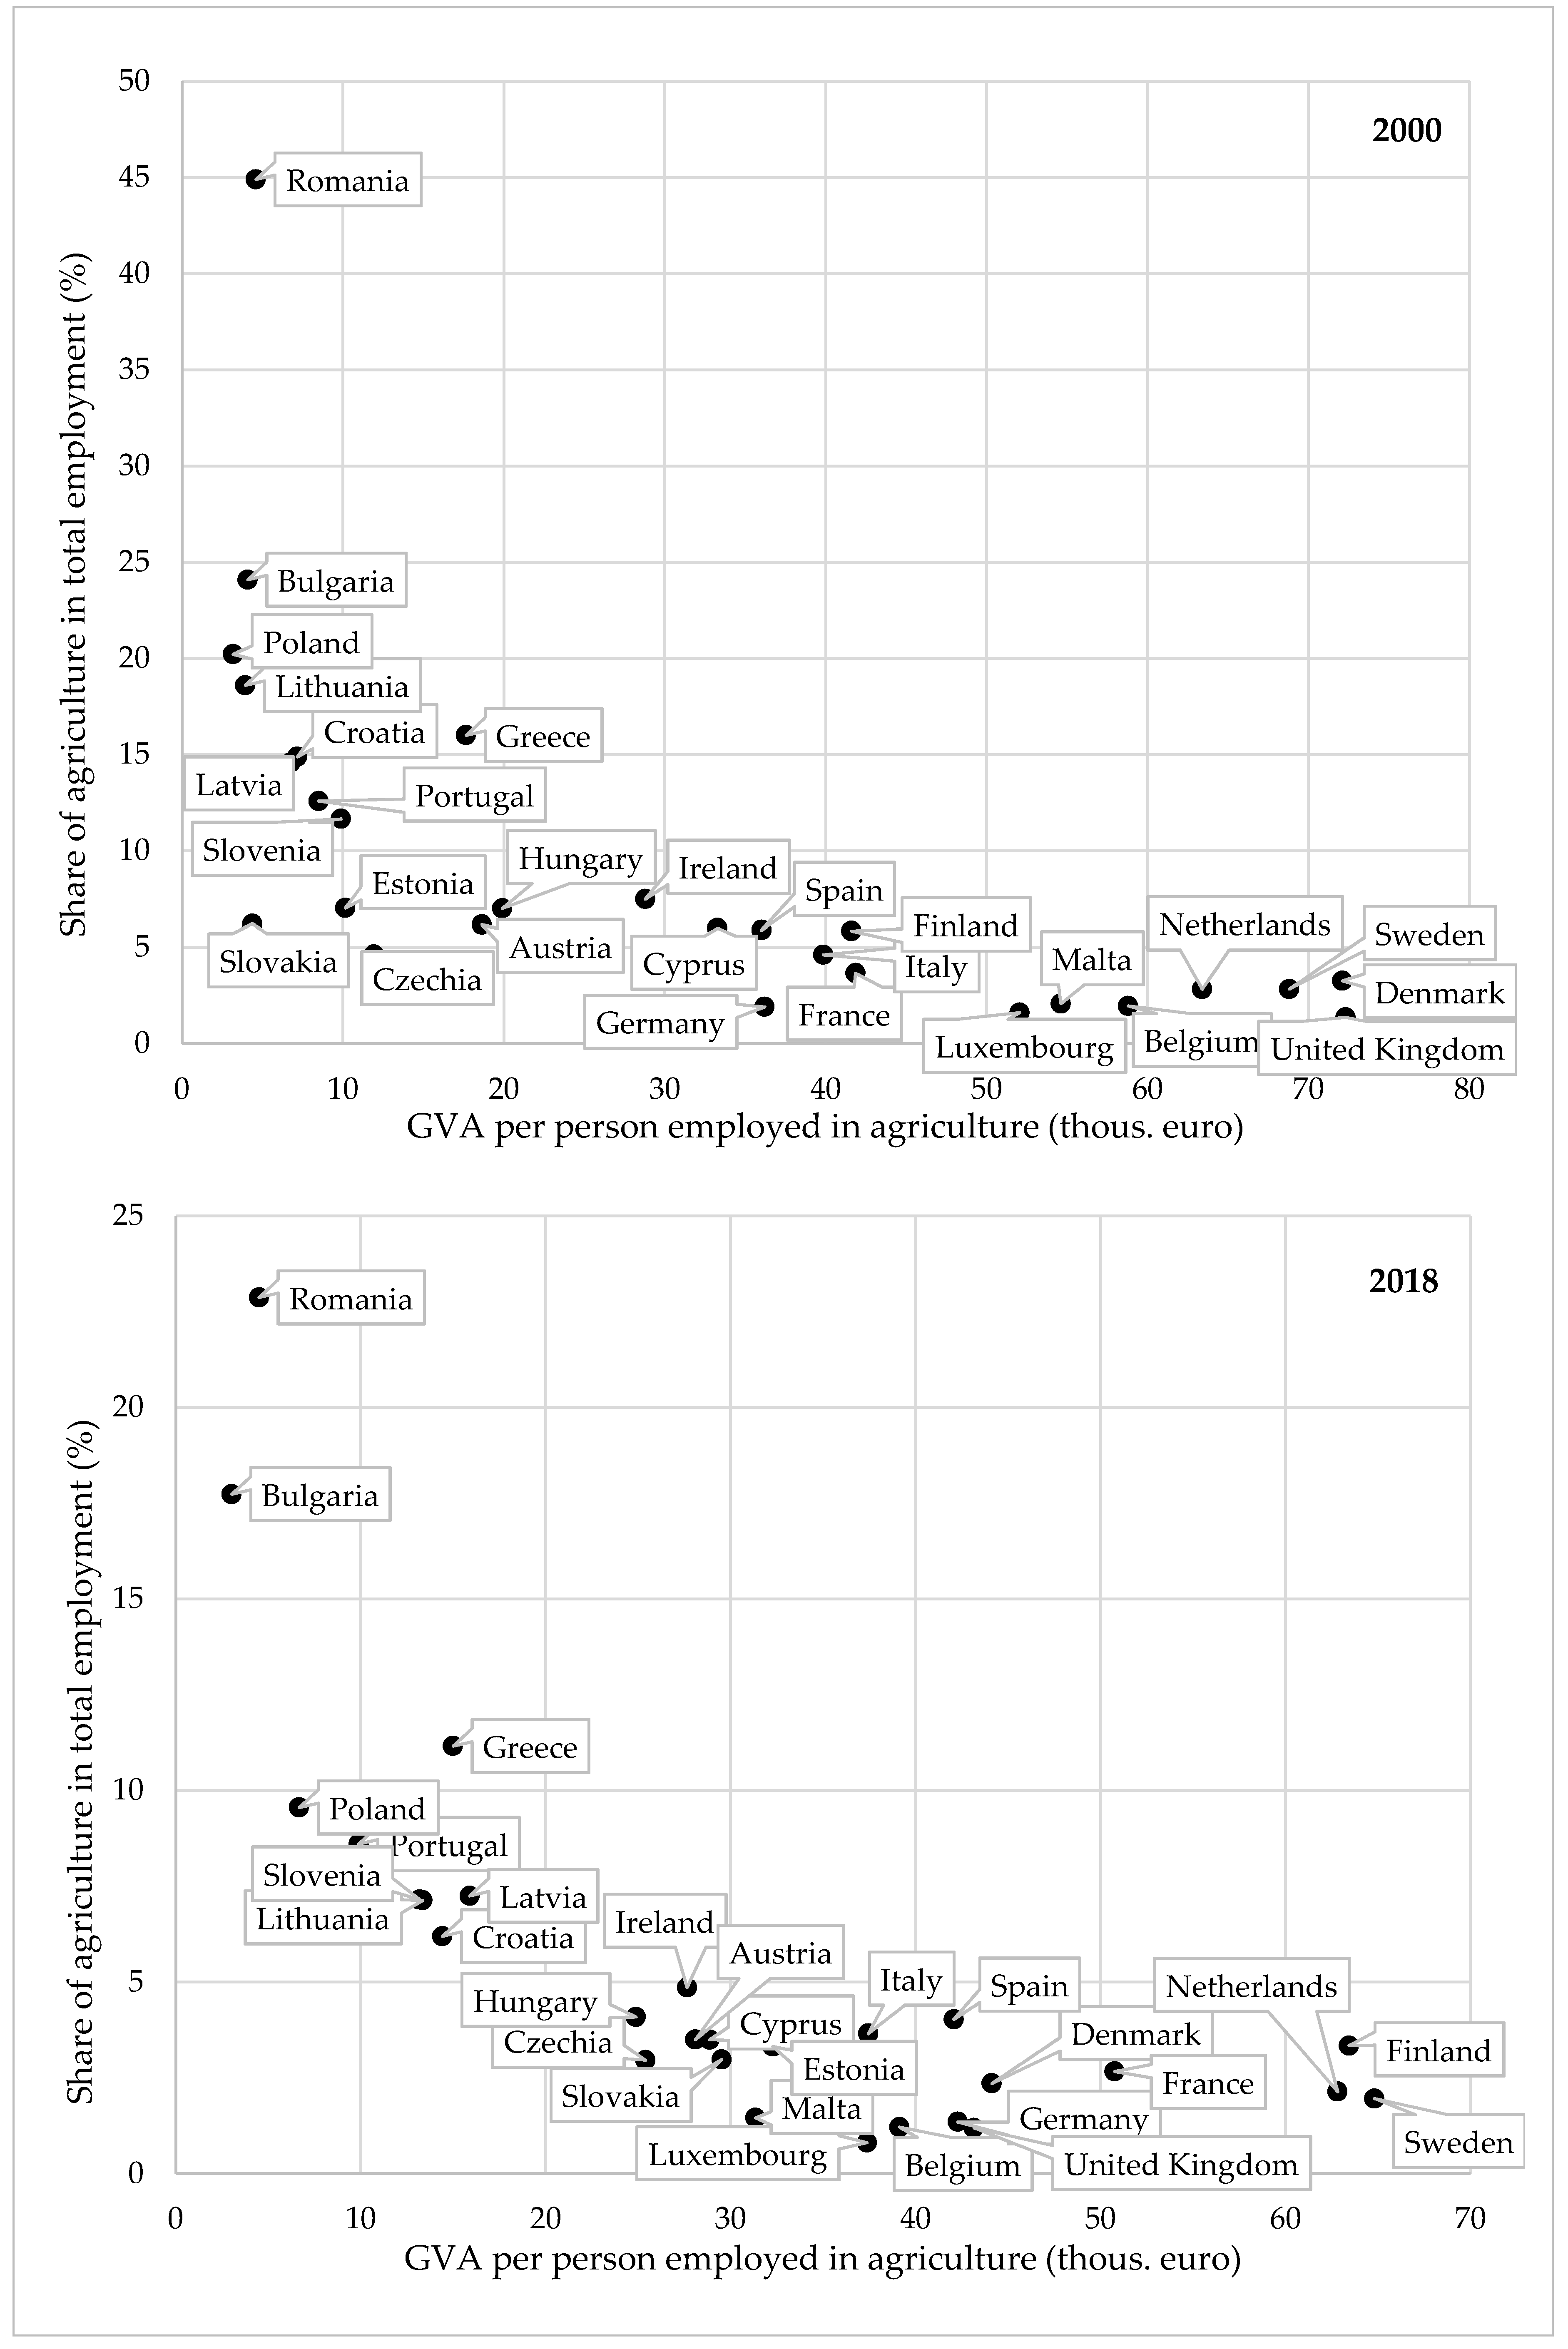
- The highest share of employment in agriculture in the total number of people employed in the national economy of the former socialist countries was recorded in Romania, Bulgaria, Poland, Latvia, Lithuania and Croatia, while among the EU-15 countries it was in Greece and Portugal. The lowest share of people employed in agriculture was found in the Western European countries with strong economies, i.e., Luxemburg, Belgium, Germany and Sweden. However, countries with a low share of agriculture in the employment structure include also representatives of CEECs such as Slovakia, Czechia and Estonia.
- The former socialist countries with a high share of agriculture in the sectoral employment structure have comparable levels of employment in industry (higher than in the Western European countries), while “excess” employment in agriculture in relation to the EU average in those countries roughly corresponds to the “deficit” of employment in the services sector. Thus, it may be expected that the workforce released from agriculture will be absorbed mainly by the services sector.
- In less affluent countries, the low value of GVA per 1 person employed in agriculture compared to the other sectors results to a considerable extent from the excessive number of people employed in agriculture. In richer countries, characterised by the relatively low level of employment in agriculture, the low value of this ratio results first of all from the high GVA generated by the secondary and tertiary sectors (industry and services).
- Assuming the principle that earnings of inputs should result first of all from their productivity and assuming that in the foreseeable future the potential to increase the value added generated by agriculture is limited, it needs to be stated that minimisation of income disparity for farmers is feasible through further evolution of the sectoral employment structure towards minimisation of the share of agriculture in this structure and increasing the share of the nonagricultural sectors, particularly services.
- The prepared estimates for the scale of surplus employment in the agricultural sector indicate a very large scale of such excess employment. In the countries generating a higher GVA at the scale of both entire economies and individual sectors, a reduction of employment levels in agriculture may be impossible due to depletion of reserves in the technical labour efficiency (most EU-17 countries). In the countries with a relatively low GVA (mainly the EU-11), reduction of employment in agriculture with no deterioration of the volume and quality of production may be easier thanks to the existing reserves in the technological and organisational progress. However, in this group the scale of reduction in employment in agriculture would have to be much greater.
- Existing limitations and the required scale of reduction in employment suggest that reaching the level of employment in agriculture guaranteeing GVA per 1 person employed in this sector comparable to that in the industry and the services sectors is not possible within a short time perspective. Nevertheless, any achieved progress in getting closer to that level of employment may reduce the volume of transfer funds directed to agriculture. As a consequence, this would reduce the fiscal burden for the nonagricultural sectors related with financing the CAP, while GVA generated in the secondary and tertiary sectors may be utilised more efficiently.
- Apart from limitation concerning the specific character of agriculture and its labour intensity, the process of changes in the sectoral employment structure will probably be determined by the growth rate in demand for services, structural adaptations of characteristics of the farming population to the demand for workforce in the tertiary sector, as well as the rate of structural transformations in rural areas, particularly modernisation of production and consolidation of the ownership structure as well as agricultural land use.
- Rationalisation of the employment level in agriculture is also a method to improve its economic and social sustainability. Only subsequently may instruments of financial transfers from the nonagricultural sectors to agriculture be considered, because they are a burden to more productive sectors and, in the long term, they may slow down the natural reduction of employment in agriculture. However, in view of the inevitable differences in productivity between agriculture and the nonagricultural sectors, at a certain technologically, economically, ecologically and socially justified level of employment in agriculture, transfers of the surplus generated in the secondary (industry) and tertiary (services) sectors need to at least reduce if not eliminate economic consequences of these differences.
Funding
Conflicts of Interest
References
- Smith, A. An Inquiry into the Nature and Causes of the Wealth of Nations, Introduction to Book IV.; Metalibri: Amsterdam, The Netherland; Lausanne, Switzerland; Melbourne, Australia; Milan, Italy; New York, NY, USA; Sao Paulo, Brasil, 2007; Available online: https://www.ibiblio.org/ml/libri/s/SmithA_WealthNations_p.pdf (accessed on 15 June 2020).
- Rijnhout, L.; Schauer, T. (Eds.) Socially Sustainable Economic. Degrowth. In Proceedings of the Workshop in the European Parliament, Vienna, Austriaon, 16 April 200; Available online: http://www.prisonplanet.pl/files/96577242/file/32862425clubofromedegrowth.pdf (accessed on 15 June 2020).
- Schneider, F.; Kallis, G.; Martinez-Alier, J. Crisis or Opportunity? Economic Degrowth for Social Equity and Ecological Sustainability. Introduction to This Special Issue. J. Clean. Prod. 2010, 18, 511–518. [Google Scholar] [CrossRef]
- Guercio, M.R. Sustainability and Economic De-Growth. Brief for GSDR, 2015. Available online: https://sustainabledevelopment.un.org/content/documents/6534116_Guercio_Sustainability%20and%20economic%20degrowth.pdf (accessed on 15 June 2020).
- Wilkin, J. Ziemia Rolnicza–Dobro wielofunkcyjne (Agricultural Land–A Multifunctional Good). Wieś Rol. 2014, 1, 113–121. [Google Scholar]
- International Capital Flows: Structural Reforms and Experience with the OECD Code of Liberalisation of Capital Movements. Report from the OECD to the G20 Sub-Group on Capital Flow Management: June 2011. Available online: https://www.oecd.org/economy/48972216.pdf (accessed on 15 June 2020).
- Reinhardt, D.; Ricci, L.A.; Tressel, T. International Capital Flows and Development: Financial Openness Matters. J. Int. Econ. 2013, 91, 235–251. [Google Scholar] [CrossRef]
- Van Wincoop, E.; Tille, C. International Capital Flows. NBER Working Paper 2007, No. 12856. Available online: https://www.nber.org/papers/w12856 (accessed on 15 June 2020).
- Kugler, M.; Rapoport, H. International Labor and Capital Flows: Complements or Substitutes? Econ. Lett. 2007, 94, 155–162. [Google Scholar] [CrossRef]
- Measuring International Labour Mobility. Prepared by the Task Force on Measuring Labour Mobility; UNECE: New York, NY, USA, 2018; Available online: https://www.unece.org/fileadmin/DAM/stats/publications/2018/ECECESSTAT20187_WEB.pdf (accessed on 15 June 2020).
- Clark, C. The Conditions of Economic Progress; MacMillan, St. Martin’s Press: London, UK; New York, NY, USA, 1957. [Google Scholar]
- Atkinson, A.B. Inequality: What Can Be Done? Harvard University Press: Cambridge, MA, USA, 2014. [Google Scholar]
- Fisher, A.G.B. Capital and the Growth of Knowledge. Econ. J. 1933, 43, 379–389.5. [Google Scholar] [CrossRef]
- List, F. Das nationale System der politischen Oekonomie; Gustav Fischer-Verlag: Jena, Germany, 1922. [Google Scholar]
- Flejterski, S.; Klóska, R.; Majchrzak, M. Usługi w teorii ekonomii (Services in the Theory of Economics). In Współczesna Ekonomika Usług (Contemporary Economics of Services), 2nd ed.; Flejterski, S., Panasiuk, A., Perenc, J., Rosa, G., Eds.; Polish Scientific Publishers: Warsaw, Poland, 2012. [Google Scholar]
- Kołodziejczak, M. Zmieniająca się Natura Usług. Studium Usług Produkcyjnych w Rolnictwie Krajów Unii Europejskiej (The Changing Nature of Services; a Case Study of Production Services in Agriculture in EU Member Countries); Wydawnictwo Uniwersytetu Przyrodniczego w Poznaniu: Poznań, Poland, 2019. [Google Scholar]
- Fisher, A.G.B. Economic Progress and Social Security; MacMillan & Company Limited: London, UK, 1945. [Google Scholar]
- Kwiatkowski, E. Teoria Trzech Sektorów Gospodarki. Prezentacja i Próba Oceny (Theory of Three Sectors of the Economy Presentation and an Attempt to Evaluate); Polish Scientific Publishers: Warsaw, Poland, 1980. [Google Scholar]
- Kraciuk, J. Paradygmat homo oeconomicus w aspekcie rozwoju ekonomii heterodoksyjnej (Homo Economicus Paradigm in Terms of Development of Heterodox Economics). Pr. Nauk. Uniw. Ekon. We Wrocławiu 2015, 401, 211–219. [Google Scholar]
- Kiełczewski, D. Racjonalność człowieka gospodarującego w ujęciu koncepcji homo sustinens (Rationality of Managing Man in the Concept of Homo Sustinens). Pr. Nauk. Uniw. Ekon. We Wrocławiu Ekon. 2016, 449, 269–276. [Google Scholar] [CrossRef]
- Komorowska, D. Prawidłowości rozwoju rolnictwa a rozwój współczesnego rolnictwa (Regularity of the Development of Agriculture and the Development of Modern Agriculture). Zesz. Nauk. SGGW Probl. Rol. Świat. 2014, 14, 98–110. [Google Scholar]
- Kołodziejczak, W. Nadwyżka zatrudnienia w polskim rolnictwie—Projekcja na tle państw Unii Europejskiej (The Surplus of Employment in Polish Agriculture—A Simulation Against the European Union Countries). Zesz. Nauk. SGGW Probl. Rol. Świat. 2016, 16, 121–149. [Google Scholar]
- Kołodziejczak, W. Zatrudnienie i wartość dodana brutto w sektorach gospodarki państw Unii Europejskiej w latach 2002 i 2016 (Employment and Gross Value Added in the Sectors of the European Union Economy in 2002 and 2016). Zesz. Nauk. SGGW Probl. Rol. Świat. 2018, 18, 270–283. [Google Scholar] [CrossRef]
- Kołodziejczak, W. Reduction of Employment as the Way to Balance Production Processes in the Polish Agriculture. In Agrarian Perspectives XXVII Food Safety—Food Security. In Proceedings of the 27th International Scientific Conference, Czech University of Life Sciences Prague, Faculty of Economics and Management, Prague, Czech Republic, 19–20 September 2018; Tomšík, K., Ed.; Czech University of Life Sciences Prague: Prague, Czech Republic, 2018; pp. 128–135. [Google Scholar]
- Czyżewski, B. Produktywność zasobów w rolnictwie w Polsce wobec paradygmatu zrównoważonego rozwoju (Resource Productivity in Polish Agriculture: Towards the Paradigm of Sustainable Development). Studia Ekon. 2012, 2, 165–188. [Google Scholar]
- Copus, A.K.; Dax, T.; de Lima, P. Epilogue: Rural Cohesion Policy as the Ap-propriate Response to Current Rural Trends. In Territorial Cohesion in Rural Europe: The Relational Turn in Rural Development; Copus, A.K., de Lima, P., Eds.; Routledge: Abingdon, UK, 2018; pp. 236–248. [Google Scholar]
- Nemes, G.; High, C.; Augustyn, A. Beyond the New Rural Paradigm: Project State and Collective Reflexive Agency. In Territorial Cohesion in Rural Europe: The Relational Turn in Rural Development; Copus, A.K., de Lima, P., Eds.; Routledge: Abingdon, UK, 2018; pp. 212–235. [Google Scholar]
- Matthews, A. Agriculture. In Industries in Europe. Competition, Trends and Policy Issues; Johnson, P., Ed.; Edward Elgar: Cheltenham, UK; Northampton, MA, USA, 2003; pp. 26–54. [Google Scholar]
- The Agricultural Income Situation in Less Favoured Areas of the EC. Document, FADN, Commission of the European Communities; Office for Official Publications of the European Communities: Luxembourg, 1991. [Google Scholar]
- Davidova, S.; Bauer, K.; Cuddy, M.P. Integrated Development of Agriculture and Rural Areas in Central European Countries; Lexington Books: London, UK, 2006. [Google Scholar]
- Bolcárová, P.; Kološta, S. Assessment of Sustainable Development in the EU 27 Using Aggregated SD Index. Ecol. Indic. 2015, 48, 699–705. Available online: https://www.sciencedirect.com/science/article/abs/pii/S1470160X14004099 (accessed on 26 June 2020). [CrossRef]
- Grzebyk, M.; Stec, M. Sustainable Development in EU Countries: Concept and Rating of Levels of Development. Sustain. Dev. 2015, 23, 110–123. [Google Scholar] [CrossRef]
- Sébastien, L.; Bauler, T. Use and Influence of Composite Indicators for Sustainable Development at the EU-level. Ecol. Indic. 2013, 35, 3–12. Available online: https://www.sciencedirect.com/science/article/abs/pii/S1470160X13001775 (accessed on 26 June 2020). [CrossRef]
- Burton, C.H.; Turner, C. Manure Management. Treatment Strategies for Sustainable Agriculture, 2nd ed.; Silsoe Research Institute: Bedford, UK, 2003. [Google Scholar]
- Wilson, M.J.; Maliszewska-Kordybach, B. Soil Quality, Sustainable Agriculture and Environmental Security in Central and Eastern Europe; Wilson, M.J., Maliszewska-Kordybach, B., Eds.; Kluwer Academic Publishers: Dordrecht, The Netherlands, 2000. [Google Scholar]
- Borch, K. Emerging Technologies in Favour of Sustainable Agriculture. Futures 2007, 39, 1045–1066. Available online: https://www.sciencedirect.com/science/article/abs/pii/S0016328707000675 (accessed on 26 June 2020). [CrossRef]
- Dwyer, J. Transformation for sustainable agriculture: What role for the second Pillar of CAP? Bio-Based Appl. Econ. 2013, 2, 29–47. [Google Scholar]
- Prager, K.; Posthumus, H. Socio-economic factors influencing farmers’ adoption of soil conservation practices in Europe. In Human Dimensions of Soil and Water Conservation; Napier, T.L., Ed.; Nova Science Publishers: New York, NY, USA, 2010. [Google Scholar]
- Čiegis, R. Sustainable agriculture: Economic aspects. Ekonomika 2004, 68, 7–23. Available online: https://etalpykla.lituanistikadb.lt/object/LT-LDB-0001:J.04~2004~1367179792589/ (accessed on 26 June 2020). [CrossRef]
- Kołodziejczak, W. Hidden Unemployment in Polish Agriculture in 2005-2018-a Simulation of the Scale of the Problem. Rocz. Nauk. Stowarzyszenia Ekon. Rol. Agrobiz. 2020, 22, 170–180. [Google Scholar] [CrossRef]
- Mortensen, D.T.; Pissarides, C.A. Job Matching, Wage Dispersion, and Unemployment; Tatsiramos, K., Zimmermann, K.F., Eds.; Oxford University Press: Oxford, UK, 2011. [Google Scholar]
- Pigou, A.C. Employment and Equilibrium; Macmillan: London, UK, 1949. [Google Scholar]
- Kwiatkowski, E. Mechanizm pełnego zatrudnienia w ujęciu A. C. Pigou—Analiza koncepcji i kierunki jej krytyki (Mechanism of Full Employment in A. C. Pigou’s Approach—Analysis of Concept and Trends in its Critique). Acta Univ. Lodz. Folia Oeconomica 1985, 056, 23–38. Available online: http://cejsh.icm.edu.pl/cejsh/element/bwmeta1.element.hdl_11089_6425?printView=true (accessed on 15 June 2020).
- Dickens, W.T.; Lang, K. Labor Market Segmentation Theory, Reconsidering the Evidence. NBER Working Papers 1992, No. 4087. Available online: www.nber.org/papers (accessed on 15 June 2020).
- Lindbeck, A.; Snower, D.J. The Insiders-Outsiders Theory of Emloyment oad Unemployment; MIT Press: Cambridge, MA, USA; Cambridge, UK, 1988. [Google Scholar]
- Weiss, A. Job Queues and Layoffs In Labor Markets with Flexible Wages. J. Political Econ. 1980, 88, 526–538. [Google Scholar] [CrossRef]
- Weiss, A. Efficiency Wages: Models of Unemployment, Layoffs, and Wage Dispersion; Princeton University Press: Princeton, NJ, USA, 1990. [Google Scholar]
- Pissarides, C. The Search Equilibrium Approach to Fluctuations in Employment. Am. Econ. Rev. 1988, 78, 363–368. [Google Scholar]
- Shapiro, C.; Stiglitz, J. Equilibrium Unemployment as a Worker Discipline Device. Am. Econ. Rev. 1984, 74, 433–444. [Google Scholar]
- Kołodziejczak, W.; Wysocki, F. Identyfikacja charakteru bezrobocia w Polsce w latach 2006-2009 (The Nature of Unemployment in Poland in 2006-2009). Gospod. Nar. 2013, 9, 29–52. [Google Scholar] [CrossRef]
- Górny, A.; Kaczmarczyk, P. Uwarunkowania i Mechanizmy Migracji Zarobkowych w Świetle Wybranych Koncepcji Teoretycznych (Conditions and Mechanisms of Labor Migration in Selected Theoretical Concepts); Prace migracyjne No 49; ISS Uniwersytetu Warszawskiego: Warszawa, Poland, 2003. [Google Scholar]
- Moszyński, M. Międzynarodowe przepływy pracy a procesy integracji europejskiej (International Movements of Labour and the Process of European Integration). Toruńskie Studia Międzynarodowe Międzynarodowe Stos. Ekon. 2010, 1, 113–129. [Google Scholar] [CrossRef]
- Okun, A.M. Potential GNP: Its Measurement and Significance. In Proceedings of the Business and Economic Statistics Section of the American Statistical Association; American Statistical Association: Alexandria, VA, USA, 1962; pp. 89–104. [Google Scholar]
- Kaufman, R.T. An International Comparison of Okun’s Law. J. Comp. Econ. 1988, 12, 182–203. [Google Scholar] [CrossRef]
- Moosa, I.A. A Cross-Country Comparison of Okun’s Coefficient. J. Comp. Econ. 1997, 24, 335–356. [Google Scholar] [CrossRef]
- Prachowny, M.F.J. Okun’s Law: Theoretical Foundations and Revised Estimates by Prachowny. Rev. Econ. Stat. 1993, 75, 331–336. [Google Scholar] [CrossRef]
- Rissman, E.R. What is the Natural Rate of Unemployment? Federal Reserve Bank of Chicago Econ. Perspect. 1986, 10, 3–17. [Google Scholar]
- Haltiwanger, J. The natural Rate of Unemployment. In The New Palgrave; A Dictionary of Economics, t. 3.; The Macmillan Press LTD: London, UK, 1991. [Google Scholar]
- Kołodziejczak, M.; Poczta, W. Changes in the Use of Production Services in Agriculture in the Context of Meeting the Targets of Sustainable Agricultural Development. In Proceedings of the 2018 VII International Scientific Conference Determinants of Regional Development No 1, Stanisław Staszic University of Applied Sciences, Piła, Poland, 12–13 April 2018; Polcyn, J., Ed.; Stanisław Staszic University of Applied Sciences: Piła, Poland, 2018. [Google Scholar]
- Matuszczak, A. Zróżnicowanie Rozwoju Rolnictwa w Regionach Unii Europejskiej w Aspekcie jego Zrównoważenia (Diversification of Agricultural Development in Regions of the European Union in the Aspect of its Sustainability); Polish Scientific Publishers: Warsaw, Poland, 2013. [Google Scholar]
- Zawalińska, K.; Majewski, E.; Wąs, A. Długookresowe zmiany w dochodach z polskiego rolnictwa na tle krajów Unii Europejskiej (Long-Term Changes in the Incomes of the Polish Agriculture Compared to the European Union Countries). Rocz. Nauk. SERiA 2015, 6, 354–364. [Google Scholar]
- Wąsowicz, J. Sektorowe zróżnicowanie wydajności pracy w polskiej gospodarce (Sectoral Disparities of Labour Productivity in the Polish Economy). Studia Ekon. 2013, 160, 190–198. [Google Scholar]
- Sadowski, A. Zrównoważony Rozwój Gospodarstw Rolnych z Uwzględnieniem Wpływu Wspólnej Polityki Rolnej Unii Europejskiej (Sustainable Development of Agricultural Holdings Considering The Influence of Common Agricultural Policy); Wydawnictwo Uniwersytetu Przyrodniczego w Poznaniu: Poznań, Poland, 2012. [Google Scholar]
- Baer-Nawrocka, A. Ewolucja Wspólnej Polityki Rolnej a kwestia parytetu dochodów rolniczych (Farmer’s Income Parity Issue in the Evolution of the Common Agricultural Policy). Pr. Nauk. Uniw. Ekon. We Wrocławiu Polityka Ekon. 2011, 166, 26–36. [Google Scholar]
- Polska wieś 2018. Raport o Stanie Wsi (Rural Poland 2018 The Report on the State of Rural Areas). Available online: https://www.fdpa.org.pl/rural-poland-2018 (accessed on 20 May 2020).
- Czyżewski, A. Systemowe uwarunkowania przełomu jakościowego w polityce rolnej (The System Conditions of a Qualitative Change in Agricultural Policy). Ruch Praw. Ekon. Socjol. 1989, 51, 155–169. [Google Scholar]
- Doward, A. Agricultural labour productivity, food prices and sustainable development impacts and indicators. Food Policy 2013, 39, 40–50. [Google Scholar] [CrossRef]
- Rembisz, W. Relacje wynagrodzenia i wydajności czynnika pracy w rolnictwie na tle gospodarki narodowej i jej sektorów w Polsce w okresie 2005−2012 (Relationship Between Labour Productivity and Its Remuneration in Agriculture in Comparison with National Economy and Its Sectors in Poland in the Period 2005-2012). Wieś Rol. 2016, 2, 41–58. [Google Scholar]
- Góral, J.; Rembisz, W. Remunerations and Labour Productivity in Agriculture Against a Background of other Economy Sectors. Acta Sci. Pol. Oeconomia 2018, 17, 49–58. [Google Scholar] [CrossRef]
- Guth, M.; Smędzik-Ambroży, K.; Czyżewski, B.; Stępień, S. The Economic Sustainability of Farms under Common Agricultural Policy in the European Union Countries. Agriculture 2020, 10, 34. [Google Scholar] [CrossRef]
- Czyżewski, B.; Czyżewski, A.; Kryszak, Ł. The Market Treadmill Against Sustainable Income of European Farmers: How the CAP Has Struggled with Cochrane’s Curse. Sustainability 2019, 11, 791. [Google Scholar] [CrossRef]
- Cochrane, W.W. Farm Prices: Myth and Reality; University of Minnesota Press: Minneapolis, MN, USA, 1958. [Google Scholar]
- EUROSTAT. Statistics Explained. Available online: www.europa.eu (accessed on 20 May 2020).
- Kołodziejczak, W.; Wysocki, F. Determinanty Aktywności Ekonomicznej Ludności Wiejskiej w Polsce (Determinants of Economic Activity of the Rural Population in Poland); Wydawnictwo Uniwersytetu Przyrodniczego w Poznaniu: Poznań, Poland, 2015. [Google Scholar]
- Fisher, A.G.B. Production, primary, secondary and tertiary. Econ. Rec. 1939, 15, 24–38. [Google Scholar] [CrossRef]
- Górny, A.; Kaczmarczyk, P. A Known But Uncertain Path: The Role of Freign Labour in Polish Agriculture. J. Rural Stud. 2018, 64, 177–188. [Google Scholar] [CrossRef]
- Jordan, D.; O’Leary, E. Is Irish Innovation Policy Working? Evidence from Irish High-Technology Businesses. Paper Presented to a Meeting of the Statistical and Social Inquiry Society of Ireland in Dublin, 25 October 2007, Dublin, Ireland, 2007. Available online: https://www.researchgate.net/publication/229047255_Is_Irish_innovation_policy_working_Evidence_from_Irish_high-technology_businesses (accessed on 20 May 2020).
- Statista. The Financial Sector in Luxembourg—Statistics & Factsh. Available online: https://www.statista.com/topics/4189/the-financial-sector-in-luxembourg/ (accessed on 20 May 2020).
- Czyżewski, B.; Kłodowska, M.; Matuszczak, A.; Matuszewska, A.; Śmidoda, D. Social Sustainability in Agricultural Farms with Selected Types of Production in European Union Countries. Ann. Pol. Assoc. Agric. Agribus. Econ. 2018, 20, 35–40. [Google Scholar] [CrossRef]
- Kowalczyk, S.; Sobiecki, R. Europejski model rolnictwa wobec wyzwań globalnych (The European Model of Agriculture In Relation to Global Challenges). Zagadnienia Ekon. Rolnej 2011, 4, 35–58. [Google Scholar]


| Countries | Total | Agriculture | Industry | Services | ||||
|---|---|---|---|---|---|---|---|---|
| 2000 | 2018 | 2000 | 2018 | 2000 | 2018 | 2000 | 2018 | |
| EU-28 | 214,905.4 | 238,919.6 | 7.7 | 4.2 | 20.7 | 17.0 | 71.6 | 78.8 |
| EU-17 | 169,990.5 | 192,225.7 | 3.8 | 2.7 | 19.7 | 15.4 | 76.5 | 81.9 |
| Belgium | 4109.7 | 4817.1 | 2.0 | 1.2 | 17.0 | 11.7 | 81.1 | 87.1 |
| Denmark | 2755.0 | 2963.0 | 3.3 | 2.4 | 15.5 | 10.8 | 81.2 | 86.8 |
| Germany | 39,971.0 | 44,854.0 | 1.9 | 1.4 | 21.2 | 18.5 | 76.9 | 80.1 |
| Ireland | 1695.8 | 2212.0 | 7.5 | 4.9 | 18.7 | 11.1 | 73.8 | 84.0 |
| Greece | 4312.8 | 4146.1 | 16.0 | 11.2 | 12.2 | 9.4 | 71.8 | 79.5 |
| Spain | 16,706.5 | 19,816.7 | 5.9 | 4.0 | 18.4 | 11.3 | 75.7 | 84.7 |
| France | 25,602.0 | 28,114.0 | 3.7 | 2.7 | 14.6 | 10.3 | 81.8 | 87.1 |
| Italy | 23,028.6 | 25,342.3 | 4.6 | 3.7 | 21.1 | 16.9 | 74.2 | 79.5 |
| Cyprus | 314.8 | 423.6 | 6.0 | 3.5 | 12.7 | 9.3 | 81.3 | 87.2 |
| Luxembourg | 264.1 | 448.8 | 1.6 | 0.8 | 14.3 | 8.3 | 84.1 | 90.8 |
| Malta | 146.4 | 235.7 | 2.1 | 1.5 | 24.9 | 11.4 | 73.0 | 87.2 |
| Netherlands | 8203.0 | 9367.0 | 2.8 | 2.1 | 12.3 | 9.1 | 84.9 | 88.7 |
| Austria | 3755.0 | 4489.0 | 6.2 | 3.5 | 18.9 | 15.9 | 74.9 | 80.6 |
| Portugal | 5041.9 | 4914.5 | 12.6 | 8.6 | 21.7 | 17.1 | 65.7 | 74.3 |
| Finland | 2299.8 | 2626.1 | 5.8 | 3.3 | 20.4 | 14.3 | 73.7 | 82.3 |
| Sweden | 4301.0 | 5013.0 | 2.8 | 2.0 | 18.3 | 12.5 | 78.9 | 85.5 |
| UK | 27,483.3 | 32,443.0 | 1.4 | 1.2 | 26.0 | 21.3 | 72.7 | 77.5 |
| EU-11 | 44,914.8 | 46,693.9 | 22.2 | 10.6 | 24.7 | 23.2 | 53.1 | 66.2 |
| Bulgaria | 3239.2 | 3521.6 | 24.1 | 17.7 | 23.6 | 20.2 | 52.3 | 62.0 |
| Czechia | 4859.3 | 5418.1 | 4.6 | 3.0 | 30.4 | 29.0 | 64.9 | 68.1 |
| Estonia | 584.8 | 646.6 | 7.0 | 3.3 | 25.6 | 20.8 | 67.4 | 75.9 |
| Croatia | 1565.0 | 1664.4 | 14.9 | 6.2 | 24.3 | 20.4 | 60.9 | 73.4 |
| Latvia | 923.7 | 900.2 | 14.6 | 7.3 | 18.7 | 15.7 | 66.7 | 77.0 |
| Lithuania | 1399.2 | 1380.6 | 18.6 | 7.1 | 20.4 | 18.3 | 61.0 | 74.6 |
| Hungary | 4115.8 | 4666.6 | 7.0 | 4.1 | 27.6 | 21.4 | 65.4 | 74.5 |
| Poland | 14,516.6 | 16,403.7 | 20.2 | 9.6 | 24.4 | 24.2 | 55.4 | 66.3 |
| Romania | 10,771.6 | 8651.4 | 44.9 | 22.9 | 22.0 | 22.0 | 33.1 | 55.1 |
| Slovenia | 914.7 | 1020.7 | 11.7 | 7.2 | 29.5 | 23.1 | 58.9 | 69.7 |
| Slovakia | 2024.9 | 2419.9 | 6.2 | 3.0 | 28.2 | 24.2 | 65.6 | 72.8 |
| Countries | Total | Agriculture | Industry | Services | ||||
|---|---|---|---|---|---|---|---|---|
| 2000 | 2018 | 2000 | 2018 | 2000 | 2018 | 2000 | 2018 | |
| EU-28 | 12,675,657.4 | 14,560,680.1 | 2.3 | 1.6 | 22.0 | 19.0 | 75.7 | 79.4 |
| EU-17 | 11,890,079.9 | 13,342,320.5 | 2.0 | 1.5 | 21.7 | 18.4 | 76.3 | 80.1 |
| Belgium | 359,293.6 | 409,856.2 | 1.3 | 0.6 | 22.8 | 16.2 | 75.9 | 83.3 |
| Denmark | 259,774.3 | 261,417.5 | 2.5 | 1.2 | 22.0 | 18.2 | 75.5 | 80.6 |
| Germany | 2,513,936.3 | 3,012,310.0 | 1.1 | 0.9 | 25.6 | 25.4 | 73.3 | 73.7 |
| Ireland | 129,894.0 | 303,076.1 | 2.8 | 1.0 | 28.3 | 36.5 | 68.9 | 62.5 |
| Greece | 200,360.3 | 163,705.1 | 6.1 | 4.2 | 14.0 | 14.9 | 79.9 | 80.9 |
| Spain | 860,976.2 | 1,087,968.0 | 4.1 | 3.1 | 20.7 | 15.9 | 75.2 | 81.0 |
| France | 1,678,114.6 | 2,090,925.0 | 2.3 | 1.8 | 18.9 | 13.4 | 78.8 | 84.8 |
| Italy | 1,480,458.6 | 1,584,462.2 | 2.9 | 2.2 | 22.3 | 19.6 | 74.9 | 78.2 |
| Cyprus | 15,679.5 | 18,261.0 | 4.0 | 2.3 | 11.2 | 7.9 | 84.8 | 89.8 |
| Luxembourg | 31,871.7 | 54,377.7 | 0.7 | 0.3 | 12.6 | 7.0 | 86.7 | 92.7 |
| Malta | 7429.3 | 10,897.3 | 2.2 | 1.0 | 24.0 | 10.2 | 73.7 | 88.8 |
| Netherlands | 576,950.0 | 692,777.0 | 2.6 | 1.8 | 18.9 | 15.2 | 78.6 | 83.0 |
| Austria | 234,138.2 | 344,658.8 | 1.8 | 1.3 | 24.2 | 22.1 | 74.0 | 76.6 |
| Portugal | 151,879.7 | 176,705.2 | 3.5 | 2.4 | 20.3 | 17.9 | 76.2 | 79.7 |
| Finland | 165,759.7 | 201,583.0 | 3.4 | 2.8 | 30.0 | 20.5 | 66.7 | 76.8 |
| Sweden | 381,725.5 | 459,631.6 | 2.2 | 1.4 | 25.4 | 18.3 | 72.4 | 80.3 |
| UK | 2,841,838.6 | 2,469,708.9 | 1.0 | 0.7 | 19.8 | 13.6 | 79.2 | 85.7 |
| EU-11 | 785,577.5 | 1,218,359.6 | 6.2 | 3.1 | 26.1 | 25.2 | 67.7 | 71.7 |
| Bulgaria | 25,555.8 | 48,634.1 | 12.5 | 3.9 | 20.9 | 21.6 | 66.6 | 74.5 |
| Czechia | 78,515.3 | 186,727.8 | 3.4 | 2.2 | 30.8 | 30.2 | 65.8 | 67.6 |
| Estonia | 9607.5 | 22,661.9 | 4.3 | 3.1 | 21.9 | 20.5 | 73.8 | 76.5 |
| Croatia | 27,497.2 | 41,856.2 | 6.1 | 3.6 | 24.7 | 20.2 | 69.3 | 76.2 |
| Latvia | 18,669.7 | 25,310.7 | 4.9 | 4.1 | 19.5 | 15.8 | 75.6 | 80.1 |
| Lithuania | 16,311.5 | 40,678.3 | 6.3 | 3.2 | 23.6 | 21.4 | 70.1 | 75.3 |
| Hungary | 99,168.3 | 112,913.7 | 5.8 | 4.2 | 26.6 | 24.8 | 67.6 | 71.0 |
| Poland | 267,223.6 | 434,406.4 | 3.5 | 2.4 | 24.3 | 25.0 | 72.2 | 72.6 |
| Romania | 184,722.5 | 184,952.1 | 12.0 | 4.8 | 27.7 | 25.2 | 60.2 | 70.0 |
| Slovenia | 29,818.0 | 39,838.5 | 3.5 | 2.4 | 28.4 | 26.9 | 68.1 | 70.7 |
| Slovakia | 28,488.1 | 80,379.9 | 1.9 | 2.6 | 27.6 | 24.7 | 70.5 | 72.6 |
| Countries | Total | Agriculture | Industry | Services | ||||
|---|---|---|---|---|---|---|---|---|
| Employment | GVA | Employment | GVA | Employment | GVA | Employment | GVA | |
| EU-28 | 11.2 | 14.9 | −38.5 | −17.9 | −9.1 | −0.8 | 22.4 | 20.4 |
| EU-17 | 13.1 | 12.2 | −20.5 | −16.9 | −11.3 | −4.8 | 21.0 | 17.8 |
| Belgium | 17.2 | 14.1 | −27.2 | −51.5 | −19.4 | −19.2 | 26.0 | 25.2 |
| Denmark | 7.5 | 0.6 | −22.2 | −52.4 | −25.1 | −16.6 | 15.0 | 7.4 |
| Germany | 12.2 | 19.8 | −20.6 | −7.3 | −1.9 | 19.1 | 16.9 | 20.5 |
| Ireland | 30.4 | 133.3 | −15.4 | −18.8 | −22.7 | 201.4 | 48.6 | 111.6 |
| Greece | −3.9 | −18.3 | −33.0 | −43.1 | −25.9 | −13.2 | 6.4 | −17.3 |
| Spain | 18.6 | 26.4 | −18.9 | −5.2 | −27.1 | −2.9 | 32.7 | 36.1 |
| France | 9.8 | 24.6 | −19.8 | −2.8 | −22.5 | −11.6 | 16.9 | 34.1 |
| Italy | 10.0 | 7.0 | −12.7 | −18.0 | −12.2 | −5.8 | 17.8 | 11.8 |
| Cyprus | 34.6 | 16.5 | −21.4 | −31.8 | −1.5 | −17.6 | 44.3 | 23.2 |
| Luxembourg | 70.0 | 70.6 | −14.5 | −38.6 | −0.6 | −4.5 | 83.5 | 82.4 |
| Malta | 61.0 | 46.7 | 13.2 | −35.1 | −26.6 | −37.8 | 92.2 | 76.7 |
| Netherlands | 14.2 | 20.1 | −13.7 | −14.5 | −14.8 | −3.2 | 19.3 | 26.8 |
| Austria | 19.5 | 47.2 | −32.1 | 2.3 | 0.6 | 34.7 | 28.6 | 52.4 |
| Portugal | −2.5 | 16.3 | −33.4 | −22.4 | −23.5 | 3.0 | 10.3 | 21.7 |
| Finland | 14.2 | 21.6 | −34.7 | −0.5 | −19.9 | −16.8 | 27.5 | 40.0 |
| Sweden | 16.6 | 20.4 | −18.0 | −22.8 | −20.3 | −13.3 | 26.4 | 33.6 |
| UK | 18.0 | −13.1 | 3.5 | −38.3 | −3.2 | −40.2 | 25.9 | −6.0 |
| EU-11 | 4.0 | 55.1 | −50.3 | −22.6 | −2.4 | 49.6 | 29.6 | 64.3 |
| Bulgaria | 8.7 | 90.3 | −20.0 | −40.7 | −6.8 | 96.4 | 29.0 | 113.0 |
| Czechia | 11.5 | 137.8 | −28.5 | 52.1 | 6.1 | 133.0 | 16.9 | 144.6 |
| Estonia | 10.6 | 135.9 | −47.8 | 66.0 | −10.2 | 120.7 | 24.5 | 144.5 |
| Croatia | 6.3 | 52.2 | −55.7 | −10.8 | −10.5 | 24.7 | 28.3 | 67.5 |
| Latvia | −2.5 | 35.6 | −51.6 | 13.3 | −18.0 | 9.7 | 12.6 | 43.7 |
| Lithuania | −1.3 | 149.4 | −62.1 | 28.5 | −11.5 | 126.4 | 20.6 | 167.9 |
| Hungary | 13.4 | 13.9 | −33.8 | −17.2 | −12.0 | 6.0 | 29.1 | 19.6 |
| Poland | 13.0 | 62.6 | −46.6 | 12.2 | 12.0 | 67.1 | 35.2 | 63.5 |
| Romania | −19.7 | 0.1 | −59.1 | −59.8 | −19.4 | −9.0 | 33.5 | 16.3 |
| Slovenia | 11.6 | 33.6 | −31.5 | −8.6 | −12.6 | 26.8 | 32.2 | 38.6 |
| Slovakia | 19.5 | 182.2 | −42.7 | 286.2 | 2.7 | 153.1 | 32.6 | 190.7 |
| Countries | Total | Agriculture | Industry | Services | ||||
|---|---|---|---|---|---|---|---|---|
| GVA | % | GVA | % | GVA | % | GVA | % | |
| EU-28 | 60.9 | 3.3 | 23.3 | 33.6 | 68.3 | 9.1 | 61.4 | −1.6 |
| EU-17 | 69.4 | −0.8 | 38.4 | 4.5 | 82.9 | 7.3 | 67.9 | −2.6 |
| Belgium | 85.1 | −2.7 | 39.1 | −33.4 | 117.8 | 0.2 | 81.3 | −0.6 |
| Denmark | 88.2 | −6.4 | 44.1 | −38.8 | 148.8 | 11.2 | 81.9 | −6.6 |
| Germany | 67.2 | 6.8 | 42.3 | 16.8 | 92.1 | 21.4 | 61.8 | 3.1 |
| Ireland | 137.0 | 78.9 | 27.6 | −4.0 | 451.1 | 289.7 | 101.9 | 42.4 |
| Greece | 39.5 | −15.0 | 15.0 | −15.1 | 62.6 | 17.2 | 40.2 | −22.2 |
| Spain | 54.9 | 6.5 | 42.1 | 16.8 | 77.0 | 33.2 | 52.6 | 2.6 |
| France | 74.4 | 13.5 | 50.8 | 21.3 | 97.1 | 14.2 | 72.4 | 14.7 |
| Italy | 62.5 | −2.7 | 37.4 | −6.0 | 72.7 | 7.3 | 61.5 | −5.1 |
| Cyprus | 43.1 | −13.4 | 28.9 | −13.3 | 36.7 | −16.3 | 44.4 | −14.6 |
| Luxembourg | 121.2 | 0.4 | 37.4 | −28.2 | 102.3 | −3.9 | 123.7 | −0.6 |
| Malta | 46.2 | −8.9 | 31.3 | −42.6 | 41.4 | −15.3 | 47.1 | −8.1 |
| Netherlands | 74.0 | 5.2 | 62.8 | −0.9 | 123.1 | 13.6 | 69.2 | 6.3 |
| Austria | 76.8 | 23.1 | 28.1 | 50.7 | 106.7 | 33.8 | 73.0 | 18.5 |
| Portugal | 36.0 | 19.4 | 9.9 | 16.5 | 37.8 | 34.6 | 38.5 | 10.3 |
| Finland | 76.8 | 6.5 | 63.4 | 52.5 | 109.7 | 3.8 | 71.6 | 9.8 |
| Sweden | 91.7 | 3.3 | 64.8 | −5.8 | 134.3 | 8.8 | 86.1 | 5.7 |
| UK | 76.1 | −26.4 | 43.2 | −40.3 | 48.7 | −38.2 | 84.2 | −25.4 |
| EU-11 | 26.1 | 49.2 | 7.6 | 55.6 | 28.3 | 53.3 | 28.3 | 26.8 |
| Bulgaria | 13.8 | 75.0 | 3.0 | −26.0 | 14.7 | 110.9 | 16.6 | 65.1 |
| Czechia | 34.5 | 113.3 | 25.4 | 112.7 | 35.9 | 119.5 | 34.2 | 109.3 |
| Estonia | 35.0 | 113.3 | 32.3 | 218.1 | 34.6 | 145.8 | 35.3 | 96.3 |
| Croatia | 25.1 | 43.1 | 14.4 | 101.3 | 24.9 | 39.4 | 26.1 | 30.6 |
| Latvia | 28.1 | 39.1 | 15.9 | 134.1 | 28.2 | 33.9 | 29.3 | 27.6 |
| Lithuania | 29.5 | 152.7 | 13.3 | 239.3 | 34.6 | 155.8 | 29.8 | 122.2 |
| Hungary | 24.2 | 0.4 | 24.9 | 25.0 | 28.0 | 20.4 | 23.1 | −7.4 |
| Poland | 26.5 | 43.9 | 6.7 | 110.2 | 27.4 | 49.2 | 29.0 | 20.9 |
| Romania | 21.4 | 24.7 | 4.5 | −1.8 | 24.5 | 12.9 | 27.1 | −12.9 |
| Slovenia | 39.0 | 19.7 | 13.2 | 33.4 | 45.5 | 45.0 | 39.5 | 4.8 |
| Slovakia | 33.2 | 136.1 | 29.5 | 573.6 | 33.9 | 146.4 | 33.1 | 119.2 |
| Countries | Total | p < 0.05 | Agriculture | p < 0.05 | Industry | p < 0.05 | Services | p < 0.05 |
|---|---|---|---|---|---|---|---|---|
| EU-28 | 0.20 | − | −0.31 | − | −0.02 | − | 0.27 | − |
| EU-17 | −0.06 | − | −0.21 | − | −0.20 | − | −0.02 | − |
| Belgium | −0.20 | − | 0.54 | + | −0.20 | −0.08 | + | |
| Denmark | −0.17 | − | 0.62 | + | −0.53 | − | −0.40 | + |
| Germany | 0.47 | − | −0.24 | − | 0.01 | − | 0.11 | − |
| Ireland | 0.67 | + | 0.56 | + | −0.45 | + | 0.76 | + |
| Greece | 0.84 | + | 0.64 | + | −0.12 | − | 0.59 | + |
| Spain | 0.39 | − | 0.04 | − | −0.90 | + | 0.11 | − |
| France | 0.79 | −0.39 | + | −0.70 | − | 0.79 | + | |
| Italy | −0.34 | − | 0.38 | − | −0.25 | − | −0.57 | + |
| Cyprus | −0.66 | − | 0.64 | + | 0.09 | − | −0.71 | + |
| Luxembourg | 0.04 | − | 0.06 | − | 0.43 | + | 0.05 | − |
| Malta | −0.21 | − | −0.37 | − | 0.76 | + | −0.31 | − |
| Netherlands | −0.12 | − | 0.03 | − | −0.75 | + | −0.09 | − |
| Austria | 0.73 | -0.85 | + | −0.01 | − | 0.63 | + | |
| Portugal | −0.32 | − | -0.37 | − | −0.70 | + | 0.42 | + |
| Finland | −0.19 | − | -0.85 | + | 0.43 | + | 0.17 | + |
| Sweden | 0.42 | + | 0.21 | − | −0.58 | + | 0.67 | + |
| UK | −0.64 | + | −0.79 | + | −0.19 | + | −0.58 | + |
| EU-11 | −0.22 | − | −0.49 | − | −0.11 | − | −0.06 | − |
| Bulgaria | 0.34 | − | 0.63 | + | −0.63 | + | 0.75 | + |
| Czechia | 0.92 | + | −0.76 | + | 0.25 | − | 0.97 | + |
| Estonia | 0.59 | + | −0.86 | + | −0.75 | + | 0.92 | + |
| Croatia | 0.69 | + | −0.82 | − | −0.58 | + | 0.59 | + |
| Latvia | −0.10 | − | −0.87 | − | −0.90 | + | 0.66 | + |
| Lithuania | −0.23 | − | −0.87 | + | −0.76 | + | 0.89 | + |
| Hungary | −0.07 | − | −0.40 | + | −0.29 | − | −0.52 | + |
| Poland | 0.87 | + | −0.92 | + | 0.67 | + | 0.59 | + |
| Romania | −0.40 | + | 0.37 | − | −0.80 | + | 0.40 | + |
| Slovenia | 0.75 | + | −0.51 | + | −0.76 | + | 0.54 | + |
| Slovakia | 0.92 | + | −0.84 | + | −0.37 | + | 0.98 | + |
| Countries | Employment in Agriculture in Initial State Thousand. People | Surplus of Employment | The Share of Agriculture in the Employment Structure for: | |||||
|---|---|---|---|---|---|---|---|---|
| EERASc | EERAS-EU11 | EERAS- EU17 | Initial State | EERASc | EERAS-EU11 | EERAS- EU17 | ||
| EU-28 | 10,120.6 | 77.1 | 49.3 | 79.6 | 4.2 | 1.6 | 3.5 | 1.4 |
| EU-17 | 5164.8 | 56.6 | −7.8 | 56.6 | 2.7 | 1.5 | 3.6 | 1.5 |
| Belgium | 58.7 | 66.7 | −0.8 | 59.4 | 1.2 | 0.6 | 1.7 | 0.7 |
| Denmark | 70.0 | 61.6 | −21.3 | 51.2 | 2.4 | 1.2 | 3.7 | 1.5 |
| Germany | 608.0 | 50.3 | −18.6 | 52.2 | 1.4 | 0.8 | 2.0 | 0.8 |
| Ireland | 107.6 | 83.6 | 17.3 | 66.7 | 4.9 | 0.9 | 4.8 | 1.9 |
| Greece | 462.6 | 76.4 | 64.5 | 85.7 | 11.2 | 3.9 | 5.9 | 2.4 |
| Spain | 799.1 | 38.4 | −20.7 | 51.4 | 4.0 | 3.1 | 6.0 | 2.4 |
| France | 752.0 | 45.8 | −43.9 | 42.1 | 2.7 | 1.8 | 4.8 | 1.9 |
| Italy | 927.6 | 48.5 | −15.5 | 53.5 | 3.7 | 2.2 | 4.8 | 2.0 |
| Cyprus | 14.8 | 48.0 | 19.8 | 67.7 | 3.5 | 2.3 | 3.6 | 1.4 |
| Luxembourg | 3.7 | 73.8 | −12.9 | 54.5 | 0.8 | 0.2 | 1.1 | 0.4 |
| Malta | 3.4 | 23.7 | −25.4 | 49.5 | 1.5 | 1.0 | 1.6 | 0.7 |
| Netherlands | 201.0 | 27.0 | −91.6 | 22.9 | 2.1 | 1.8 | 4.8 | 1.9 |
| Austria | 157.4 | 75.7 | 32.6 | 72.9 | 3.5 | 1.3 | 3.5 | 1.4 |
| Portugal | 422.8 | 82.8 | 76.7 | 90.6 | 8.6 | 2.2 | 3.0 | 1.2 |
| Finland | 87.8 | 46.4 | −46.4 | 41.1 | 3.3 | 2.7 | 7.5 | 3.0 |
| Sweden | 100.0 | 42.4 | −87.8 | 24.4 | 2.0 | 1.4 | 4.6 | 1.8 |
| UK | 388.3 | 41.7 | −57.8 | 36.5 | 1.2 | 0.7 | 1.8 | 0.7 |
| EU-11 | 4955.8 | 86.6 | 86.6 | 94.6 | 10.6 | 2.9 | 2.9 | 1.1 |
| Bulgaria | 624.4 | 85.0 | 91.4 | 96.6 | 17.7 | 3.3 | 1.9 | 0.8 |
| Czechia | 160.9 | 47.7 | 35.8 | 74.2 | 3.0 | 2.2 | 2.7 | 1.1 |
| Estonia | 21.5 | 52.1 | 40.4 | 76.0 | 3.3 | 3.0 | 3.8 | 1.5 |
| Croatia | 103.2 | 75.3 | 77.4 | 90.9 | 6.2 | 3.5 | 3.2 | 1.3 |
| Latvia | 65.3 | 73.5 | 72.8 | 89.1 | 7.3 | 4.0 | 4.1 | 1.6 |
| Lithuania | 98.6 | 83.5 | 82.1 | 92.8 | 7.1 | 3.1 | 3.4 | 1.4 |
| Hungary | 191.1 | 31.8 | 41.8 | 76.6 | 4.1 | 4.2 | 3.6 | 1.4 |
| Poland | 1567.2 | 87.5 | 87.4 | 94.9 | 9.6 | 2.2 | 2.3 | 0.9 |
| Romania | 1978.4 | 93.0 | 93.5 | 97.4 | 22.9 | 3.9 | 3.6 | 1.5 |
| Slovenia | 73.1 | 78.0 | 68.1 | 87.1 | 7.2 | 2.3 | 3.3 | 1.3 |
| Slovakia | 72.2 | 49.2 | 40.2 | 75.9 | 3.0 | 2.6 | 3.1 | 1.3 |
© 2020 by the author. Licensee MDPI, Basel, Switzerland. This article is an open access article distributed under the terms and conditions of the Creative Commons Attribution (CC BY) license (http://creativecommons.org/licenses/by/4.0/).
Share and Cite
Kołodziejczak, W. Employment and Gross Value Added in Agriculture Versus Other Sectors of the European Union Economy. Sustainability 2020, 12, 5518. https://doi.org/10.3390/su12145518
Kołodziejczak W. Employment and Gross Value Added in Agriculture Versus Other Sectors of the European Union Economy. Sustainability. 2020; 12(14):5518. https://doi.org/10.3390/su12145518
Chicago/Turabian StyleKołodziejczak, Włodzimierz. 2020. "Employment and Gross Value Added in Agriculture Versus Other Sectors of the European Union Economy" Sustainability 12, no. 14: 5518. https://doi.org/10.3390/su12145518
APA StyleKołodziejczak, W. (2020). Employment and Gross Value Added in Agriculture Versus Other Sectors of the European Union Economy. Sustainability, 12(14), 5518. https://doi.org/10.3390/su12145518