Reduction of Nitrogen Fertilizer Requirements and Nitrous Oxide Emissions Using Legume Cover Crops in a No-Tillage Sorghum Production System


Abstract
1. Introduction
2. Materials and Methods
2.1. Study Site and Experimental Design
2.2. Management of Winter Wheat, Cover Crops, and Grain Sorghum
2.3. Soil Gas Sampling and Analyses
2.4. Surface Flux Calculations
- f = the flux rate of soil gas (μgm−2 min−1)
- ΔC/Δt = change in N2O concentration inside the chamber during the measuring time Δt
- V = the head–space volume of the measuring chamber (0.0109 m3)
- A = the surface area of the measuring chamber (0.0706 m2)
- m = the molecular weight of N2O (44 gmol−1)
- Vm = the molar volume of gas (m3 mol−1)
2.5. Cumulative Nitrous Oxide Calculations
2.6. Soil Properties, Analyses and Ancillary Measurements
2.7. Statistical Analyses
3. Results
3.1. Climatic Conditions
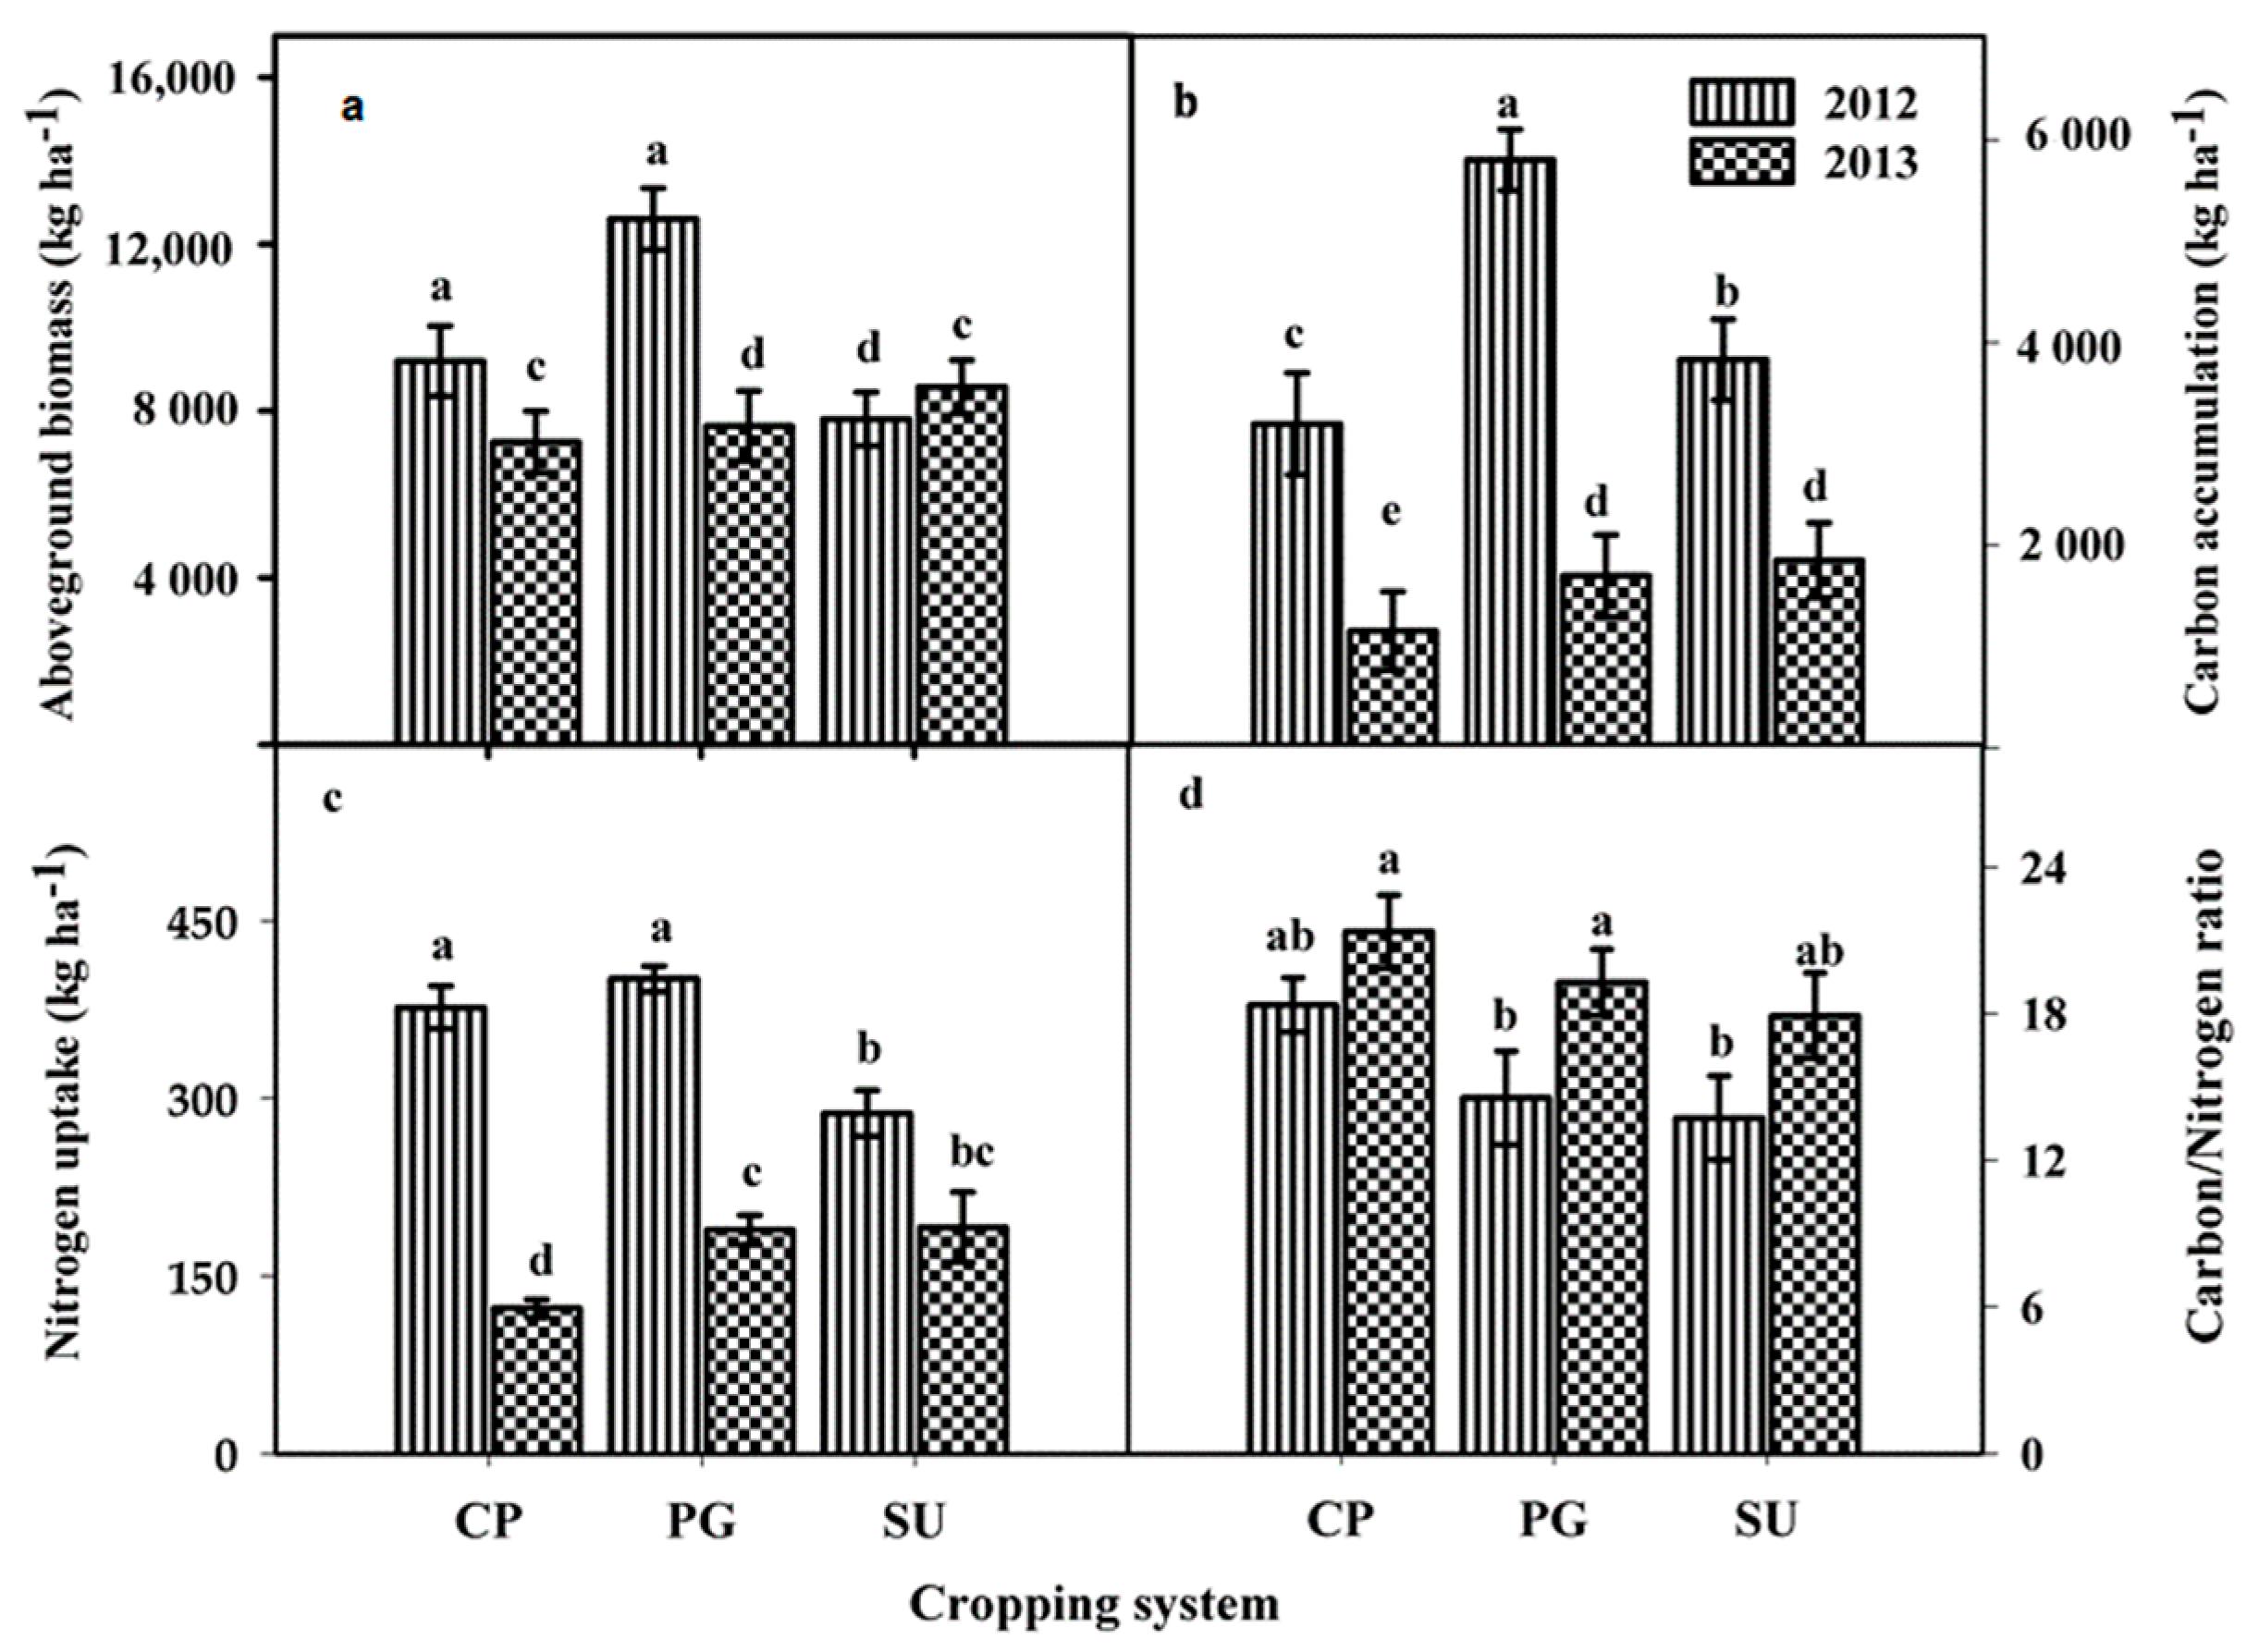
3.2. Aboveground Biomass, Carbon, and Nitrogen Uptake by Cover Crops
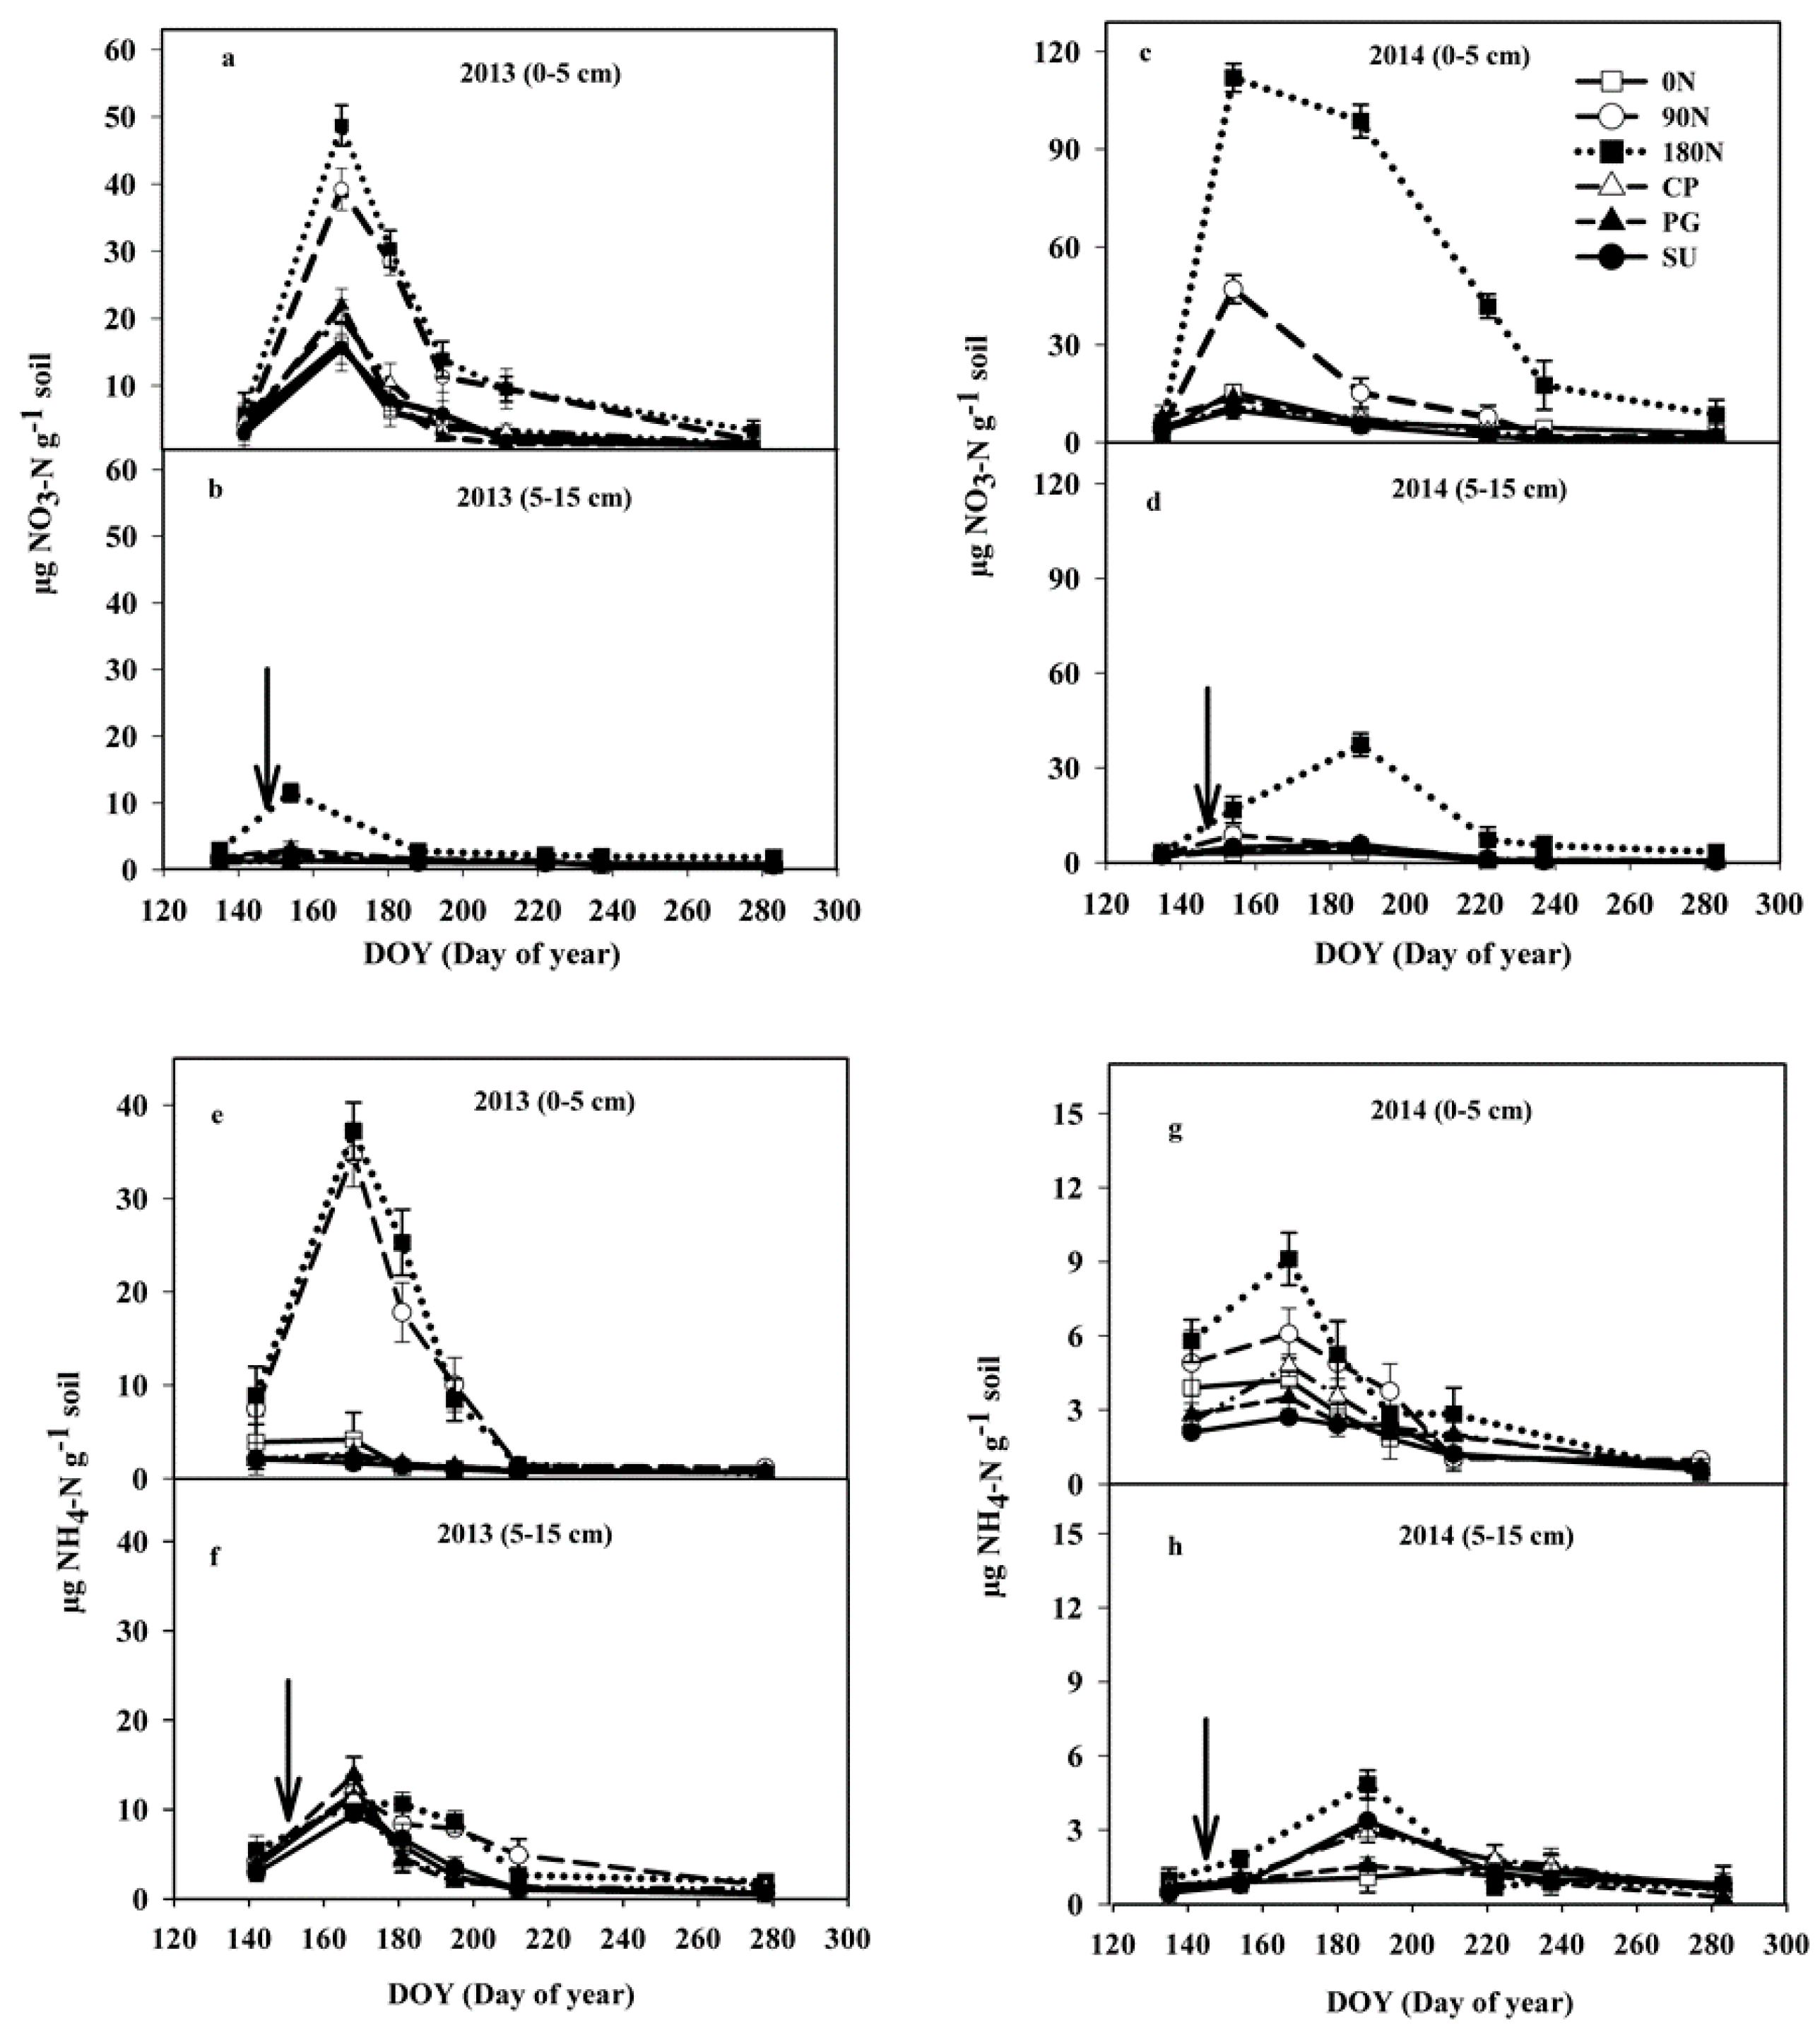
3.3. Soil Inorganic Nitrogen
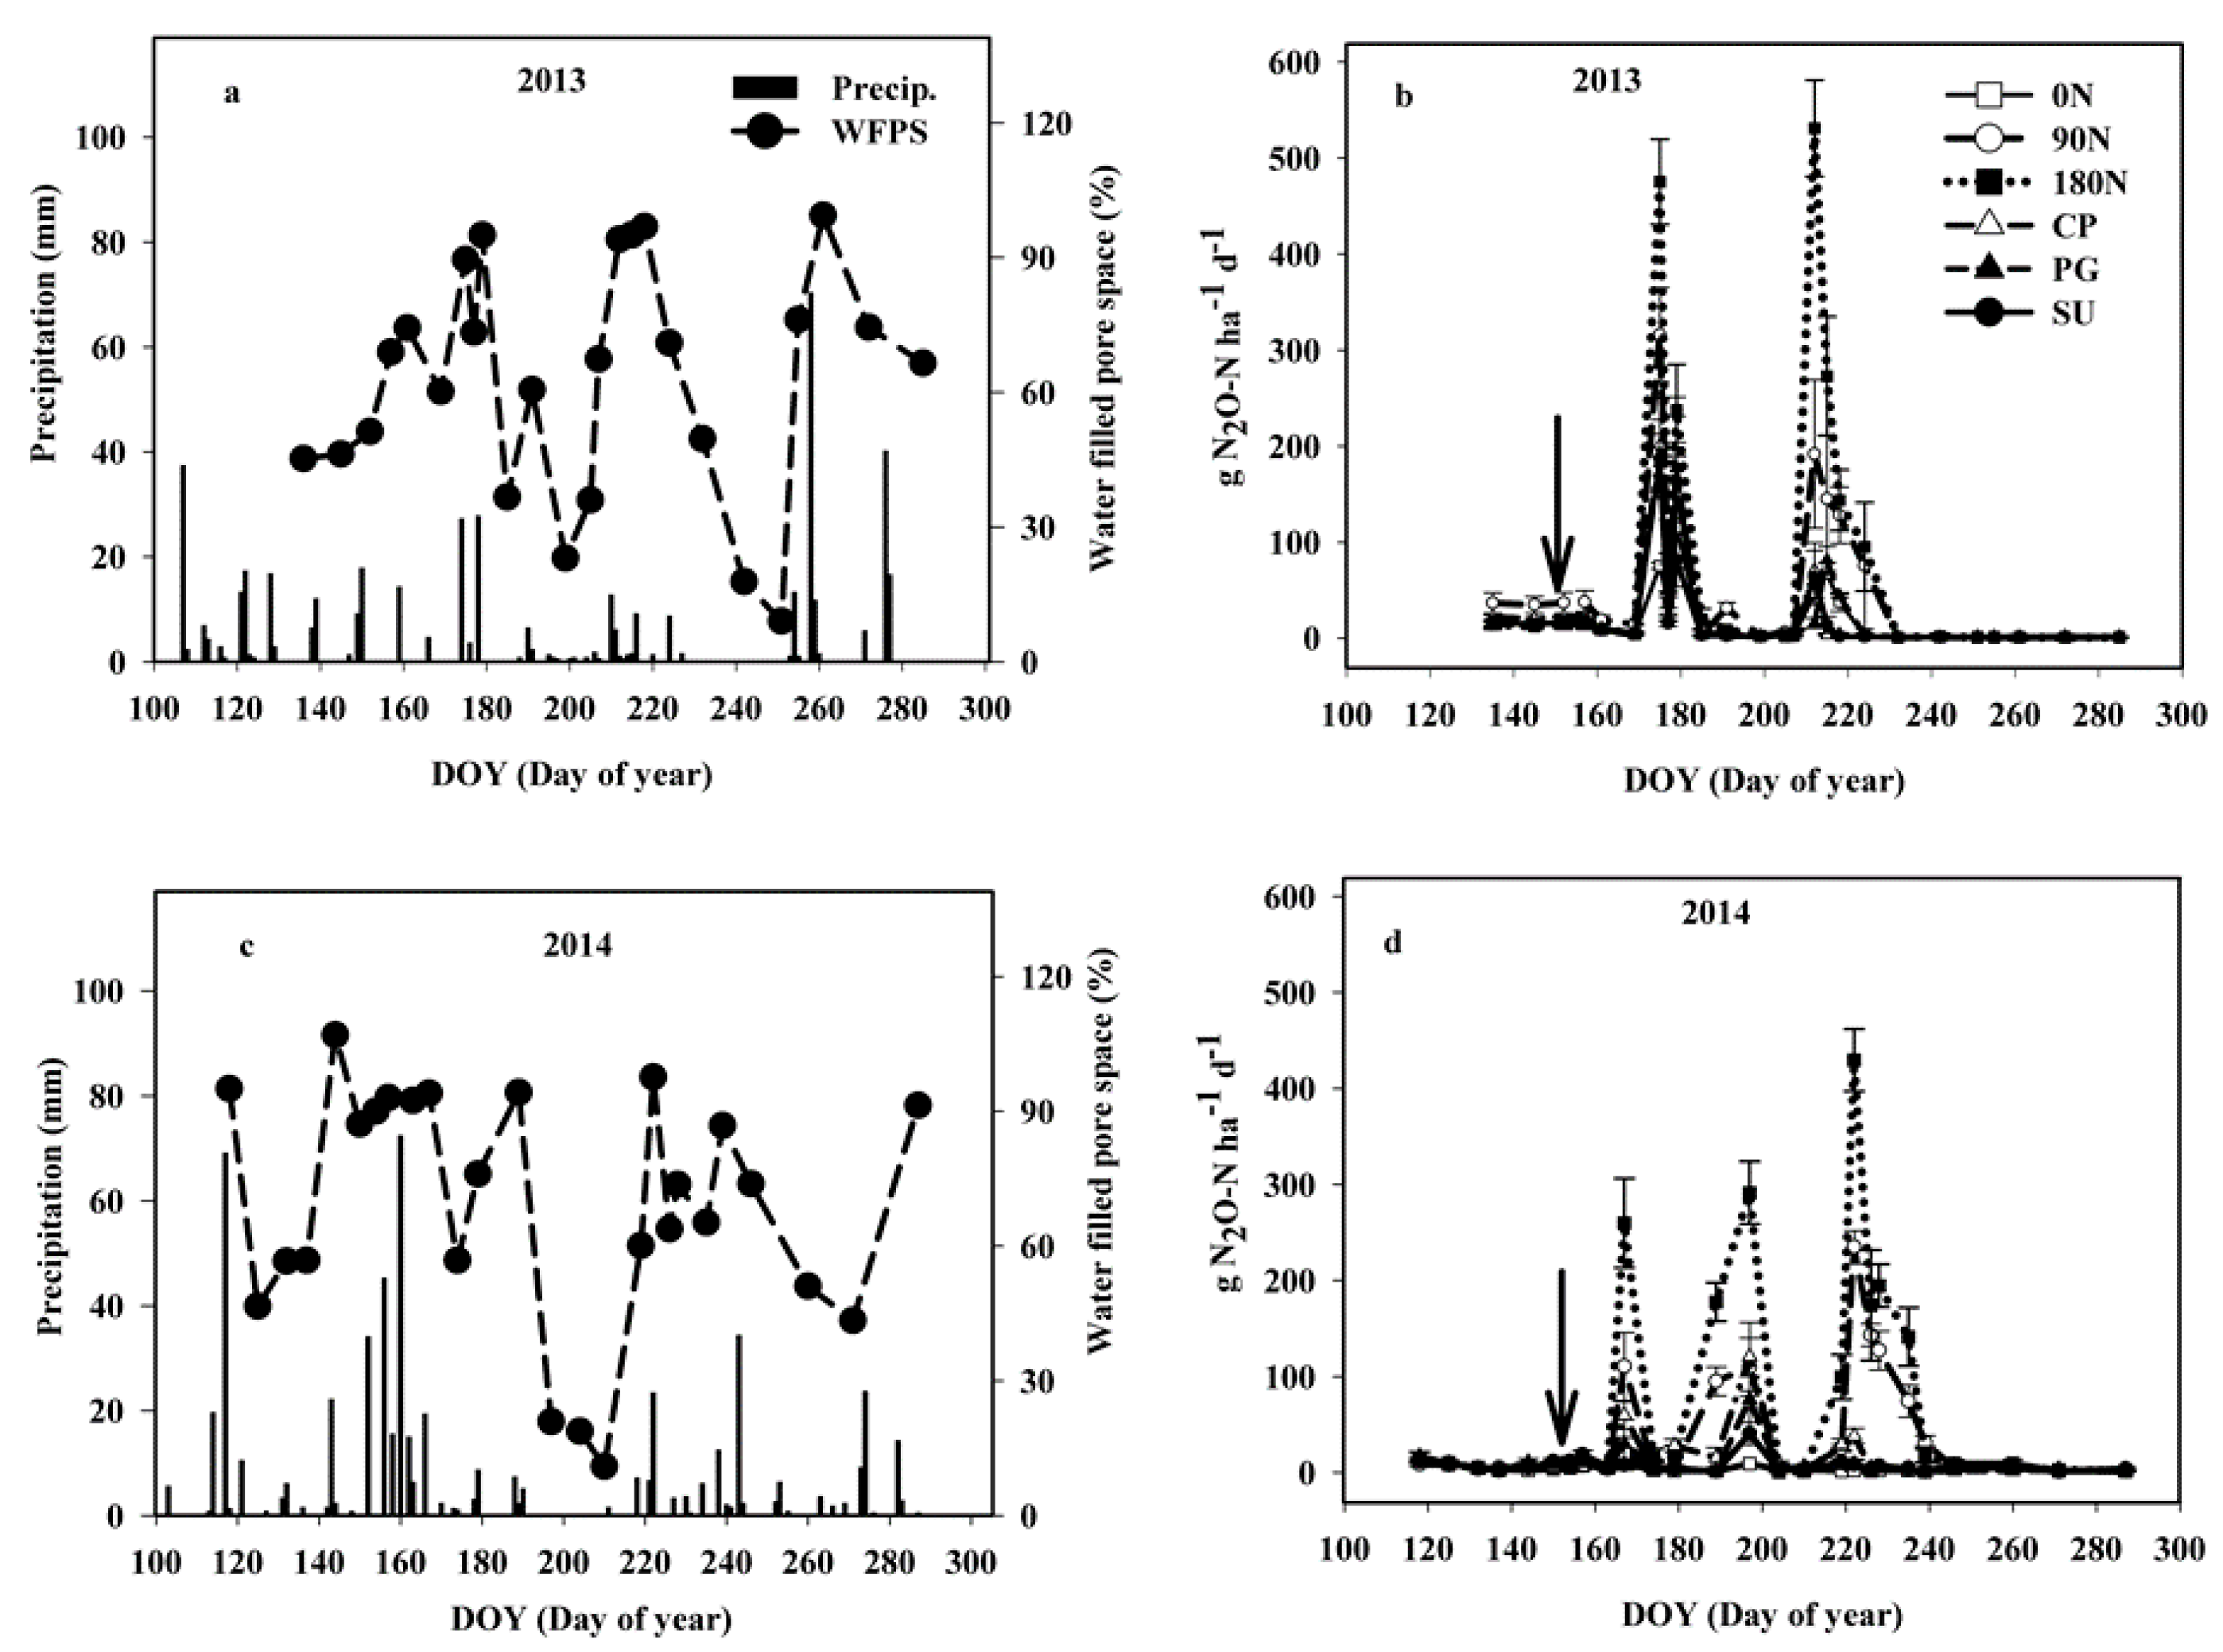
3.4. Precipitation, Water-Filled Pore Space, and Daily Nitrous Oxide Emissions
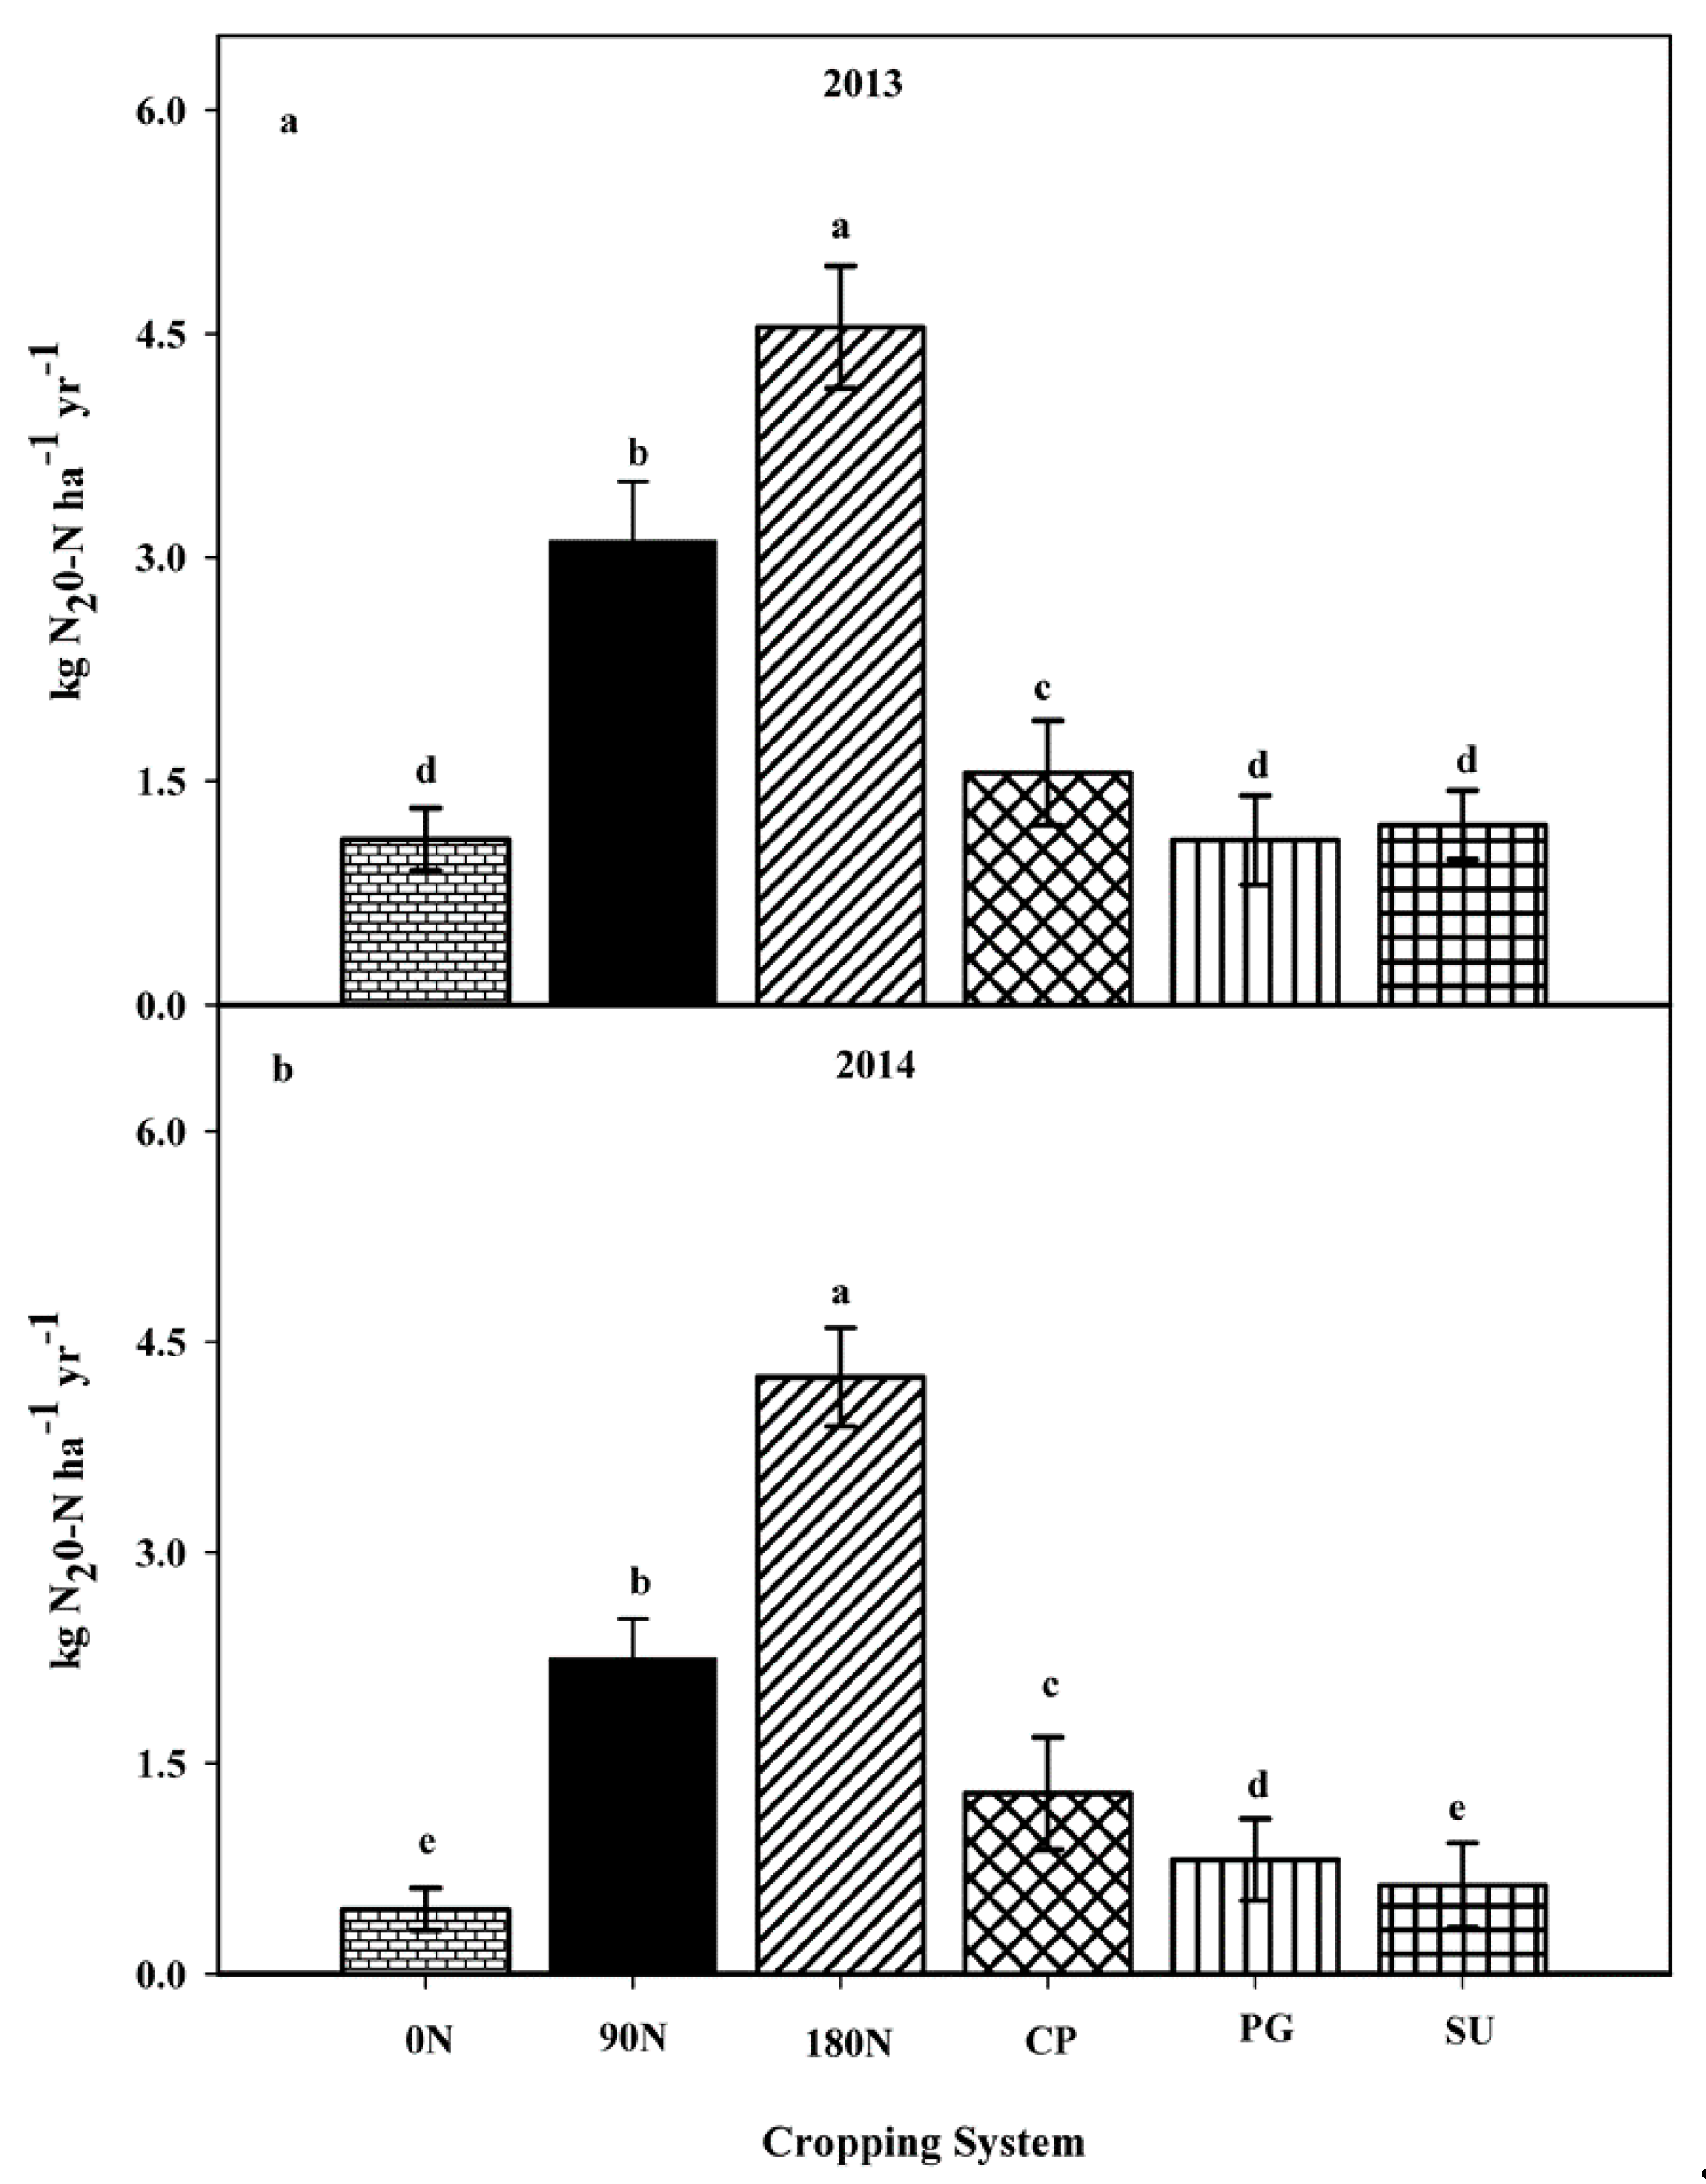
3.5. Growing Season Cumulative Nitrous Oxide Emissions
3.6. Sorghum Grain Yield Following Cover Crops and Specific Nitrous Oxide Emissions
4. Discussion
5. Conclusions
Author Contributions
Funding
Acknowledgments
Conflicts of Interest
References
- Robertson, G.P.; Vitousek, P.M. Nitrogen in agriculture: Balancing the cost of an essential resource. Annu. Rev. Environ. Res. 2009, 34, 97–125. [Google Scholar] [CrossRef]
- Isermann, K. Agricultures share in the emission of trace gases affecting them climate and some cause–oriented proposals for sufficiently reducing this share. Environ. Pollut. 1994, 83, 95–111. [Google Scholar] [CrossRef]
- Myhre, G.; Shindell, D.; Breon, R.; Collins, W.; Fuglestvedt, J.; Huang, J.; Koch, D.; Lamarque, J.; Lee, D.; Mendoza, B.; et al. Anthropogenic and natural radiative forcing. In The Physical Science Basis; Stocker, T.F., Qin, D., Plattner, G., Tignor, M., Allen, S.K., Boschung, J., Nauels, A., Xia, Y., Bex, V., Midgley, P.M., Eds.; Contribution of Working Group I to the Fifth Assessment Report of the Intergovernmental Panel on Climate Change; Cambridge University: Cambridge, UK, 2013; p. 659. [Google Scholar]
- Portmann, R.W.; Daniel, J.S.; Ravishankara, A.R. Stratospheric ozone depletion due to nitrous oxide: Influences of other gases. Philos. Trans. R. Soc. B 2012, 367, 1256–1264. [Google Scholar] [CrossRef]
- Reay, D.S.; Davidson, E.A.; Smith, K.E.; Smith, P.; Melillo, J.M.; Dentener, R.; Crutzen, P.J. Global agriculture and nitrous oxide emissions. Nat. Clim. Chang. 2012, 2, 410–416. [Google Scholar] [CrossRef]
- Drury, C.F.; Reynolds, W.D.; Tan, C.S.; McLaughlin, N.B.; Yang, X.M.; Calder, W.; Oloya, T.O.; Yang, J.Y. Impacts of 49–51 years of fertilization and crop rotation on growing season nitrous oxide emissions, nitrogen uptake and corn yields. Can. J. Soil Sci. 2014, 94, 421–433. [Google Scholar] [CrossRef]
- Fageria, N.K.; Baligar, V.C.; Bailey, B.A. Role of cover crops in improving soil and row crop productivity. Commun. Soil Sci. Plant Anal. 2005, 36, 2733–2757. [Google Scholar] [CrossRef]
- Jensen, E.S.; Hauggaard–Nielsen, H. How can increased use of biological N2 fixation in agriculture benefit the environment? Plant Soil 2003, 252, 177–186. [Google Scholar] [CrossRef]
- Cavigelli, M.A.; Del Grosso, S.J.; Liebig, M.A.; Snyder, C.S.; Fixen, P.E.; Venterea, R. US agricultural nitrous oxide emissions: Context, status, and trends. Front. Ecol. Environ. 2012, 10, 537–546. [Google Scholar] [CrossRef]
- Teasdale, J.R. Interaction of light, soil moisture, and temperature with weed suppression by hairy vetch residue. Weed Sci. 1993, 41, 46–51. [Google Scholar] [CrossRef]
- Kuo, S.; Sainju, U.M.; Jellum, E.J. Winter cover crop effects on soil organic carbon and carbohydrate in soil. Soil Sci. Soc. Am. J. 1997, 61, 145–152. [Google Scholar] [CrossRef]
- Millar, N.; Baggs, E.M. Chemical composition, or quality, of agroforestry residues influences N2O emissions after their addition to soil. Soil Biol. Biochem. 2004, 36, 935–943. [Google Scholar] [CrossRef]
- Garcia–Ruiz, R.; Baggs, E.M. Nitrous oxide emissions from soil following combined application of fertiliser–N and ground weed residues. Plant Soil. 2007, 299, 263–274. [Google Scholar] [CrossRef]
- Rochette, P.; Angers, D.A.; Belanger, G.; Chantigny, M.H.; Prevost, D.; Levesque, G. Emissions of N2O from alfalfa and soybean crops in eastern Canada. Soil Sci. Soc. Am. J. 2004, 68, 93–506. [Google Scholar] [CrossRef]
- CTIC. Report of the 2016–2017 National Cover Crop Survey; Joint Publication of the Conservation Technology Information Center, the North Central Region Sustainable Agriculture Research and Education Program, and the American Seed Trade Association: West Lafayette, IN, USA, 2017. [Google Scholar]
- Baranski, M.; Caswell, H.; Claassen, R.; Cherry, C.; Jaglo, K.; Lataille, A. Agricultural Conservation on Working Lands: Trends from 2004 to Present; Technical Bulletin Number 1950; Office of the Chief Economist, United States Department of Agriculture: Washington, DC, USA, 2018.
- Hamilton, A.V.; Mortensen, D.A.; Allen, M.K. The state of the cover crop nation and how to set realistic future goals for the popular conservation practice. J. Soil Water Conserv. 2017, 72, 111A–115A. [Google Scholar] [CrossRef]
- Eagle, A.J.; Olander, L.P. Greenhouse gas mitigation with agricultural land management activities in the United States: A side–by–side comparison of biophysical potential. Adv. Agron. 2012, 115, 79–179. [Google Scholar]
- Mahama, G.Y.; Prasad, P.V.V.; Roozeboom, K.L.; Nippert, J.B.; Rice, C.W. Cover crops, fertilizer nitrogen rates, and economic return of grain sorghum. Agron. J. 2016, 108, 1–16. [Google Scholar] [CrossRef]
- Parkin, T.B.; Venterea, R.T. Chamber-Based Trace Gas Flux Measurements. In Sampling Protocols; Follett, R.F., Ed.; United States Department of Agriculture: Washington DC, USA, 2010; pp. 3–39. [Google Scholar]
- Jantalia, C.P.; Santos, H.P.; Urquiaga, S.; Boddey, R.M.; Alves, B.J.R. Fluxes of nitrous oxide from soil under different crop rotations and tillage systems in the South of Brazil. Nutr. Cycl. Agroecosyst. 2008, 82, 161–173. [Google Scholar] [CrossRef]
- Hanlon, E.A.; Johnson, G.V. Mehlich 3 soil test extractant: A modification of Mehlich 2 extractant. Commun. Soil Sci. Plant Anal. 1984, 15, 277–294. [Google Scholar] [CrossRef]
- Bouyoucos, G.J. Hydrometer method improved for making particle size analysis of soils. Agron. J. 1962, 54, 464–465. [Google Scholar] [CrossRef]
- Combs, S.M.; Nathan, M.V. Soil organic matter. In Recommended Chemical Soil Test Procedure for the North Central Region, N0. 221 ed.; Brown, J.R., Ed.; NCR Publ.: Columbia, MO, USA, 1998; pp. 57–58. [Google Scholar]
- Gelderman, R.H.; Denning, J.L.; Goos, R.J. Chlorides. In Recommended Chemical Soil Test Procedures for the North Central Region, N0. 221 ed.; Brown, J.R., Ed.; NCR Publ.: Columbia, MO, USA, 1998; pp. 53–56. [Google Scholar]
- Stehfest, E.; Bouwman, L. Nitrous oxide and NO emission from agricultural fields and soils under natural vegetation: Summarizing available measurement data and modeling of global annual emissions. Nutr. Cycl. Agroecosyst. 2006, 74, 207–228. [Google Scholar] [CrossRef]
- Kim, D.G.; Hernandez-Ramirez, G.; Giltrap, G. Linear and nonlinear dependency of direct nitrous oxide emissions on fertilizer nitrogen input: A meta–analysis. Agric. Ecosyst. Environ. 2012, 168, 53–65. [Google Scholar] [CrossRef]
- Van Groenigen, J.W.; Kasper, G.J.; Veltho, G.L.; van den Pol–van Dasselaar, A.; Kuikman, P.J. Nitrous oxide emissions from silage maize fields under different mineral nitrogen fertilizer and slurry applications. Plant Soil. 2004, 263, 101–111. [Google Scholar] [CrossRef]
- Adviento–Borbe, M.A.A.; Haddix, M.L.; Binder, D.L.; Walters, D.T.; Dobermann, A. Soil greenhouse gas fluxes and global warming potential in four high yielding maize systems. Glob. Chang. Biol. 2007, 13, 1972–1988. [Google Scholar] [CrossRef]
- McSwiney, C.P.; Snapp, S.S.; Gentry, L.E. Use of N immobilization to tighten the N cycle in conventional agro ecosystems. Ecol. Appl. 2010, 20, 648–662. [Google Scholar] [CrossRef] [PubMed]
- Calderia, K.; Morgan, M.G.; Baldocchi, D.; Brewer, P.G.; Chen, C.T.A.; Nabuurs, G.T.; Nakicenovic, N.; Robertson, G.P. A portfolio of carbon management options. In The Global Carbon Cycle; Field, B., Raupach, M.R., Eds.; Island Press: Washington, DC, USA, 2004; pp. 103–130. [Google Scholar]
- Cheruiyot, E.K.; Mumera, L.M.; Nakhone, L.N.; Mwonga, S.M. Rotational effects of legumes on maize performance in the rift valley highlands of Kenya. J. Afr. Crop. Sci. 2001, 9, 667–676. [Google Scholar] [CrossRef][Green Version]
- Van Groenigen, J.W.; Velthof, G.L.; Oenema, O.; van Groenigen, K.J.; van Kessel, C. Towards an agronomic assessment of N2O emissions: A case study for arable crops. Eur. J. Soil Sci. 2010, 61, 903–913. [Google Scholar] [CrossRef]
- Omonode, R.A.; Smith, D.R.; Gál, A.; Vyn, T.J. Soil nitrous oxide emissions in corn following three decades of tillage and rotation treatments. Soil Sci. Soc. Am. J. 2010, 75, 152–163. [Google Scholar] [CrossRef]
- Mosier, A.R.; Doran, J.W.; Freney, J.R. managing soil denitrification. J. Soil Water Conserv. 2002, 57, 505–512. [Google Scholar]
- Almaraz, J.J.; Mabood, F.; Zhou, X.M.; Madramootoo, C.; Rochette, P.; Ma, B.L.; Smith, B.L. Carbon dioxide and nitrous oxide fluxes in corn grown under two tillage systems in southwestern Quebec. Soil Sci. Soc. Am. J. 2009, 73, 113–119. [Google Scholar] [CrossRef]
- Hellebrand, H.J.; Scholz, V.; Kern, J. Fertilizer induced nitrous oxide emissions during energy crop cultivation on loamy sand soils. Atmos. Environ. 2008, 42, 8403–8411. [Google Scholar] [CrossRef]
- Davidson, E.A. Fluxes of nitrous oxide and nitric acid from terrestrial ecosystem. In Microbial Production and Consumption of Greenhouse Gases: Methane, Nitrous Oxide and Halomethane; Rogers, J.E., Whitman, W.B., Eds.; American Society of Microbiology: Washington, DC, USA, 1991; pp. 219–236. [Google Scholar]
- García-Marco, S.; Ravella, S.R.; Chadwick, D.; Vallejo, A.; Gregory, A.S.; Cárdenas, L.M. Ranking factors affecting emissions of GHG from incubated agricultural soils. Eur. J. Soil Sci. 2014, 65, 573–583. [Google Scholar]


| Treatment Code | Cover Crop Planted after Winter Wheat Harvest (CC) | Nitrogen Fertilizer Applied to Sorghum at Planting (kg·ha−1) |
|---|---|---|
| 0N | None | 0 |
| 90N | None | 90 |
| 180N | None | 180 |
| CP | Cowpea Vigna unguiculata L. Walp. | 0 |
| PG | Pigeon pea Cajanus cajan L. Millsp. | 0 |
| SU | Sunn hemp Crotalaria juncea L. | 0 |
| 101, 180N | 106, 0N | 201, CP | 206, 0N |
| 102, SU | 105, CP | 202, 180N | 205, 90N |
| 103, 90N | 104, PG | 203, SU | 204, PG |
| 301, 0N | 306, CP | 401, PG | 406, SU |
| 302, 90N | 305, PG | 402, CP | 405, 180N |
| 303, 180N | 304, SU | 403, 0N | 404, 90N |
| Parameters | Units | 2012–2013 | 2013–2014 |
|---|---|---|---|
| Sand | % | 15.0 | 17.0 |
| Silt | % | 53.0 | 50.0 |
| Clay | % | 32.0 | 33.0 |
| pH | 7.79 | 6.90 | |
| Mehlich-3 P | mg·kg−1 | 11.2 | 12.5 |
| K | mg·kg−1 | 225 | 218 |
| Na | mg·kg−1 | 18.1 | 17.9 |
| Cl− | mg·kg−1 | 8.80 | 8.10 |
| SO4-S | mg·kg−1 | 2.70 | 2.90 |
| Organic Matter | % | 3.14 | 2.99 |
| 2012 | 2013 | 2014 | ||||||||||
|---|---|---|---|---|---|---|---|---|---|---|---|---|
| Month | Max Air Temp | Max. Soil Temp | Rainfall | Solar Radiation | Max Air Temp | Max. Soil Temp | Rainfall | Solar Radiation | Max Air Temp | Max. Soil Temp | Rainfall | Solar Radiation |
| °C | °C | mm | Total MJ/m2 | °C | °C | mm | Total MJ/m2 | °C | °C | mm | Total MJ/m2 | |
| April | 22.3 | 14.6 | 49.7 | 19.2 | 16.3 | 12 | 87.6 | 16.1 | 19.7 | 13.4 | 105.4 | 16.4 |
| May | 28.6 | 20.1 | 27.2 | 24.3 | 23.8 | 17.9 | 99 | 18.8 | 26 | 20.9 | 49 | 21.6 |
| June | 32.9 | 23.4 | 83.8 | 26.1 | 30.0 | 24.5 | 88.4 | 23.0 | 29.3 | 25.1 | 224.3 | 21.3 |
| July | 37.4 | 27.6 | 14.7 | 24.9 | 31.1 | 26.0 | 36.8 | 20.2 | 31.5 | 28.1 | 17.1 | 24.0 |
| August | 32.3 | 23.5 | 106.9 | 20.8 | 30.6 | 25.5 | 23.8 | 19.5 | 33.0 | 29.3 | 101.3 | 20.2 |
| September | 27.0 | 19.6 | 41.6 | 16.9 | 29.7 | 24.8 | 104.7 | 18.5 | 26.8 | 24.0 | 29.2 | 15.7 |
| October | 20.0 | 14.1 | 14.2 | 12.7 | 20.1 | 16.7 | 109.9 | 12.5 | 21.8 | 17.6 | 62.5 | 13.1 |
| Parameter | Year (Y) | Cropping System | Interaction |
|---|---|---|---|
| Cover crop aboveground biomass | ** | ** | * |
| Cover crop aboveground C accumulation | * | ** | * |
| Cover crop aboveground N uptake | * | ** | ** |
| Carbon-to-nitrogen ratio | * | * | ** |
| 2013 | 2014 | |||||
|---|---|---|---|---|---|---|
| Parameter↓/Treatments→ | CS | DOS | CS × DOS | CS | DOS | CS × DOS |
| Daily N2O emissions | *** | ** | ** | ** | *** | ** |
| Cumulative N2O emissions | *** | *** | *** | *** | *** | *** |
| Nitrate-N (0–5 cm) | *** | ** | *** | ** | ** | * |
| Nitrate-N (5–15 cm) | ** | *** | *** | ** | *** | ** |
| Ammonium-N (0–5 cm) | *** | * | ** | *** | * | ** |
| Ammonium-N (5–15 cm) | * | *** | * | * | *** | ** |
| N2O-N Emissions | ||||||||
|---|---|---|---|---|---|---|---|---|
| Cropping System † | Grain Yield | N Uptake | Grain N Uptake | Total N Uptake | Per Unit of Grain Yield | Per Unit Grain N Uptake | Per Unit Total N Uptake | Emission Factor ‡ |
| kg·ha−1 | g·N·Mg−1 | g·N·kg−1 | % | |||||
| 0N | 4540d | 36.3b | 34.6c | 70.9c | 246.3c | 32.2c | 15.6c | |
| 90N | 7134ab | 56.1ab | 55.8ab | 111.9ab | 438b | 50.1b | 25.2b | 1.91 |
| 180N | 7581a | 61.1a | 62.0a | 123.2a | 598a | 81.4a | 40.6a | 2.22 |
| CP | 6439abc | 44.3ab | 46.0bc | 90.3abc | 243.0c | 30.2c | 16.8bc | |
| PG | 6228bc | 43.9ab | 55.9ab | 99.8abc | 178.1c | 19.8d | 11.1c | |
| SU | 5181cd | 38.6ab | 42.2bc | 80.8bc | 231.7c | 28.6c | 14.9c | |
| N2O-N emissions | ||||||||
|---|---|---|---|---|---|---|---|---|
| Cropping System † | Grain Yield | N Uptake | Grain N Uptake | Total N Uptake | Per Unit of Grain Yield | Per Unit Grain N Uptake | Per Unit Total N Uptake | Emission Factor ‡ |
| kg·ha−1 | g·N·Mg−1 | g·N·kg−1 | % | |||||
| 0N | 4197b | 21.8c | 31.5c | 53.3c | 109.3d | 20.1b | 11.9cd | - |
| 90N | 6853a | 46.6c | 64.4ab | 110.9a | 325.8b | 69.2a | 40.2a | 1.98 |
| 180N | 7754a | 38.6ab | 84.1a | 122.7a | 571.3a | 54.2ab | 37.1a | 2.11 |
| CP | 6176a | 24.5c | 50.7bc | 75.2b | 207.3c | 44.3ab | 29.9b | - |
| PG | 6238a | 29.1b | 41.9c | 71.0bc | 131.1cd | 30.7b | 18.1c | - |
| SU | 6049a | 30.1bc | 47.8bc | 77.9b | 105.5d | 17.0b | 10.4d | - |
© 2020 by the authors. Licensee MDPI, Basel, Switzerland. This article is an open access article distributed under the terms and conditions of the Creative Commons Attribution (CC BY) license (http://creativecommons.org/licenses/by/4.0/).
Share and Cite
Mahama, G.Y.; Prasad, P.V.V.; Roozeboom, K.L.; Nippert, J.B.; Rice, C.W. Reduction of Nitrogen Fertilizer Requirements and Nitrous Oxide Emissions Using Legume Cover Crops in a No-Tillage Sorghum Production System. Sustainability 2020, 12, 4403. https://doi.org/10.3390/su12114403
Mahama GY, Prasad PVV, Roozeboom KL, Nippert JB, Rice CW. Reduction of Nitrogen Fertilizer Requirements and Nitrous Oxide Emissions Using Legume Cover Crops in a No-Tillage Sorghum Production System. Sustainability. 2020; 12(11):4403. https://doi.org/10.3390/su12114403
Chicago/Turabian StyleMahama, G. Y., P. V. V. Prasad, K. L. Roozeboom, J. B. Nippert, and C. W. Rice. 2020. "Reduction of Nitrogen Fertilizer Requirements and Nitrous Oxide Emissions Using Legume Cover Crops in a No-Tillage Sorghum Production System" Sustainability 12, no. 11: 4403. https://doi.org/10.3390/su12114403
APA StyleMahama, G. Y., Prasad, P. V. V., Roozeboom, K. L., Nippert, J. B., & Rice, C. W. (2020). Reduction of Nitrogen Fertilizer Requirements and Nitrous Oxide Emissions Using Legume Cover Crops in a No-Tillage Sorghum Production System. Sustainability, 12(11), 4403. https://doi.org/10.3390/su12114403