1. Introduction
The ratification of the Paris Agreement in 2015 led to the strengthening of global efforts to reduce greenhouse gases. Particularly, it has created demand that reduces fossil-fuel generation in the power sector, which is responsible for one-third of the global carbon emissions. Renewable generation is central to the global transfer to a low-carbon generation mix, with solar and wind generation at its core. While nuclear power contributes to reducing greenhouse gases, its expansion has been slow compared to renewable energies. Nuclear power has some problems related to hidden costs such as social conflicts, waste treatment, plant shutdowns, and the potential risks revealed by the Fukushima incident. As such, during 2000–2015, nuclear power generation facilities only increased by 20 GW, while during the same period, wind and solar power increased by 355 GW and 179 GW, respectively; their expansion has since picked up the pace [
1].
Renewable generation has several advantages, such as a reduction in greenhouse gases, wholesale electricity prices, and the required investment in transmission capacity. However, there are also disadvantages that must be considered to build an efficient power system. Along with non-dispatchable characteristics, the variability and uncertainty of wind and solar generation undermine the reliability of the electricity supply, and the resulting costs can be examined from two perspectives. From the perspective of short-term security of system operations, power systems need more short-term operating reserves for protection against inter-hour variability and within-hour uncertainty caused by renewable generation. Hence, when we have more variability and uncertainty from increasing renewable generation, more operating reserves are required for the power system, incurring costs. From the perspective of long-term system adequacy, renewable capacities are not reliable power sources for peak demand, as they are non-dispatchable; that is, they do not contribute to total generation capacity for meeting peak demand. Therefore, the system is required to have additional peak capacity to meet system adequacy, which creates additional capacity costs. By 2040, solar and wind generation in the U.S. will create approximately 35% of the total electricity supply, followed by the generation loss of variable renewable energy (VRE) due to excessive generation, variability, and uncertainty of approximately 120 TWh per year, which represents approximately 7% of total annual generation using solar and wind power [
2].
One important cause of VRE curtailment is represented by its high variability and uncertainty, which makes it difficult for the system operator to maintain the power system’s reliability. Therefore, the number of operating reserves can be a good measure for VRE variability and uncertainty, and costs caused by these operating reserves can be considered as costs caused by VRE uncertainty and variability. In managing VRE variability, an energy storage system (ESS) is considered an effective solution [
2].
Therefore, the purpose of this study is to analyze how much stability degradation is created in the electric power system as solar Photovoltaics (PV) supply spreads and to estimate the cost of addressing the instability. We also analyze the economic feasibility of addressing the variability of solar PVs using ESS. Existing models, such as the Wien Automatic System Planning Package, have focused on the analysis of power systems by processing renewable generation as deterministic information from the perspective of long-term capacity planning. However, to study the impact of renewable generation on system stability and to determine the amount of reserve needed, it is important to present renewable generation as stochastic information, because this is reflective of the information processed by the system operator and it enables reserve optimization in day-ahead planning. For this reason, this study utilizes the stochastic form of the multi-period security-constraint optimal power flow (MPSOPF) model, which allows analysis of the impact of stochastic renewable generation and provides two types of operating reserves as optimum solutions—contingency and load-following reserves.
There are three main contributions of this study. First, we try to generalize the methodology by applying the MPSOPF methodology used in the United States and a forecasting model using the autoregressive-moving average with an exogenous term (ARMAX) and Monte Carlo simulation of the Korean electric power market. These methodologies can serve as a reference for application to other countries. Second, this study estimates the amount and cost of reserves required to maintain the reliability of the power system, considering various renewable energy sources. As the variable renewable energy increases, a stochastic methodology should develop more than a deterministic methodology. Third, ESS is an increasingly important supplemental for variable renewable energy. This study examines the impact of collocated lithium-ion battery (LIB) ESS at solar farms on reducing the variability of solar generation and compares the operating cost savings achieved by ESS with its capital cost. These topics can be generalized to other countries.
The paper has the following structure.
Section 2 summarizes the literature on the impact of variable renewable energies in the power system.
Section 3 presents a general description of the stochastic MPSOPF, followed by the description of the Korean power system and stochastic solar generation inputs based on the solar generation forecasting model.
Section 4 discusses the impact of high solar generation on operating reserves and related costs and the effectiveness of LIB ESS in mitigating these costs.
Section 5 concludes the paper and suggests recommendations for policy changes required to offer incentives to make both solar power and LIB ESS viable options in Korea.
2. Literature Review
There are a number of studies that apply optimization models to power systems in various countries. First, as renewable energy has sharply expanded, several studies have been conducted regarding the optimization of renewable energy systems. Tozzi and Jo [
3] reviewed many different modeling tools that are used for simulating and optimizing a renewable energy project. The study helps developers pick the right renewable energy modeling tool for their specific renewable project. Gami et al. [
4] analyzed data issues in the calculation of the capacity of solar photovoltaics, which are important from the perspective of the system operator. Siddaiah and Saini [
5] proposed a model to optimize the size of renewable energy systems at an off-grid site with minimal cost. However, this research was limited to focusing on individual renewable energy projects rather than the entire power system. Therefore, much literature utilizes power system optimization models to analyze the impact of renewable generation on the reliability and efficiency of a power system. Aien et al. [
6] suggested uncertainty modeling approaches for power systems, considering the volatility of renewable energy. They emphasize the use of probabilistic or possibilistic methodologies, depending on the situation. Collins et al. [
7] reviewed methodologies that capture the impacts of power system variability within an integrated energy system. They concluded that the models are challenging due to the temporal and technical simplifying assumptions needed to make such models computationally manageable.
Pereira et al. [
8] proposed a mixed integer optimization model for electricity generation planning that considers the integration of renewable energy. In addition, the expected impacts in terms of costs and CO2 emissions were evaluated for a 10-year planning period. Aliari and Haghani [
9] proposed a probabilistic optimization model using a combination of recourse and chance-constrained approaches to assign optimal capacities to several sources of power generation including wind. Pezzini et al. [
10] reviewed applications of heuristic methods that were then applied to the power system with the aim of improving energy efficiency. They emphasize that the dimensions and complexity of the power system discourage the use of exact optimization techniques, and heuristic methods are an effective option for finding a rapid, robust, and good solution.
Papavasiliou et al. [
11] utilized the two-stage prospect method to calculate the reserve necessary to maintain the reliability levels required if a large volume of wind power was introduced to the power generation system. This study utilized the mixed integer programming method, concluding that power system operation with a probabilistic optimization method is superior to the reserve calculations using the standard deterministic method.
Sioshansi and Denholm [
12] analyzed the benefits of merging concentrated solar power (CSP) and wind power, based on the power system model in western Texas. This study presented two major benefits to merging CSP and wind power. First, the negative correlation between CSP and wind power improves the stability of the power system compared to a wind power-only scenario, and increases the usage rate of the transmission lines, raising the validity of investments in new transmission lines. Second, the thermal energy storage that could be used jointly with CSP lowers the uncertainty of wind power, allowing for a more stable supply of the stochastic generation source for the power system.
Denholm and Margolis [
13] utilized a deterministic solar power generation pattern based on the power system in Texas, estimating the acceptable limits of solar power generation for the power system using scenario analysis. This study determined that a significant volume of solar power was being wasted due to the limited flexibility of the base load in a scenario where solar power provides 10%–20% of power. This study utilized a power system optimization model based on the stochastic form of the MPSOPF method to analyze the impact of stochastic solar photovoltaic power on the reliability of the Korean power system from the perspective of day-ahead planning. There are, of course, many studies using the security-constraint optimal power flow (SCOPF) methodology. Bouffard and Galiana [
14] utilized the SCOPF methodology to apply the concept of a security constraint, analyzing system operation plans that satisfy the security constraint in probabilistic wind generation scenarios with uncertainty, while assuming the introduction of wind power generation. Normally, wind power exceeding 10%–20% of power demand is thought to negatively affect the security of the power generation system. This study assumed a scenario where wind power was introduced to this supply level and analyzed the influence of probabilistic wind power value on the power generation system. It concluded that compared to a power system operational plan utilizing deterministic wind power values and assuming the worst-case scenario, a power system operations methodology that assumes probabilistic wind power could include more wind power in the power generation system without sacrificing power system security.
Jeon et al. [
15] applied the SCOPF methodology to the power system of the Northeastern Power Coordinating Council in the United States, analyzing the influence of changing wind uncertainty on power system operating cost. Normally, the day-ahead planning takes place at 18:00. However, the forecasting errors of wind power for the next 24 h as measured at 18:00 and 23:00 differ significantly. Jeon et al. [
15] examined the changes in volume and operating costs for the required reserve when engaging in planning for power system operations, using high-error estimates taking place six hours ahead, and low-error estimates one hour ahead. In addition, there are a lot of optimal model studies considering the uncertainty of renewable energy such as Nguyen et al. [
16] and Duong et al. [
17].
This study analyzes the impact of solar photovoltaic generation by applying the MPSOPF methodology, which has been used in recent research, to the Korean power system. As an option for reducing the variability and uncertainty of solar generation, the effectiveness of LIB ESS is analyzed. To determine the input of stochastic solar generation, an ARMAX model and Monte Carlo method are applied for representative solar farms. The results will provide important implications not only for Korea but also for other countries where renewable energy is expanding. In addition, this study contributes to the widespread use of the proposed methodology in power system analysis in various countries.
3. The Model
3.1. Specifications of the Optimization Model
The power system optimization model used in this study is a stochastic form of multi-period security constraint optimal power flow (MPSOPF) which is basically a SCOPF model that is improved to study the impact of the stochastic generation sources and energy storage.
The characteristics of MPSOPF that differentiate it from general SCOPF models can be summarized as follows. First, only snapshots of power systems were possible at specific times under SCOPF. However, MPSOPF allows for continuous power system analysis over a specific time horizon. This makes the analysis of day-ahead planning for 24-h continuous system operation possible from the perspective of system operators. Moreover, the ability to continuously analyze the power system over a specified period is important in reflecting the 24-h uncertainty of renewable generation and determining the optimal charging and discharging plan of ESS operations, considering the state of charge. Second, MPSOPF allows the processing of deterministic information as input, as well as stochastic information that follows a probability distribution. Therefore, it can analyze variable renewable generation, which has a stochastic nature due to inherent variability and uncertainty and allows for the analysis of optimal ESS operational planning and its impact on the power system. Finally, MPSOPF calculates internally the reserves required to maintain the security of the power system. The calculation and acquisition of this appropriate level of reserves is a key component for the reliable operation of the power system. Hence, the capability of determining the amount of the different types of reserves to meet the variability of renewable generation is the main advantage for MPSOPF to compute the cost of solar generation uncertainty.
Equation (1) shows a reduced form of the objective function of MPSOPF, which is structured to minimize expected operating costs, including energy and reserve costs, by considering the stochastic generation resources. The objective function is composed of the following six costs: (1) The cost for active power dispatch and re-dispatch are related to the amount of generation dispatched and the dispatch deviation caused by the difference between contracted dispatch in day-ahead market and actual dispatch in real time market; (2) contingency reserve cost is related to balancing the uncertainty of net load within an hour; (3) load-following ramp reserve cost occurs to meet hour-to-hour variability of net load; (4) load-following ramping cost (wear-and-tear cost) is related to lifespan reduction due to the physical stress on conventional generators, mostly caused by high variability of renewable generation; (5) the cost of stored energy occurs due to storage capacities; and (6) the cost of startup and shutdown of conventional generators affects unit commitment decisions. The descriptions of terms and variables in Equation (1) is explained in
Table A1 in the
Appendix.
The constraint equations are composed of four constraints: (1) standard optimal power flow (OPF), (2) contingency, (3) intertemporal, and (4) unit commitment. The basic structure of the MPSOPF model is detailed in Jeon et al. [
18], Zimmerman et al. [
19], and Zimmerman et al. [
20]. The methodology for setting up the power system network is based on Ilic et al. [
21]. Detailed information about the Korean power system is from the Electric Power Statistics Information System of Korea Power Exchange (KPX), KPX [
22]. Solar generation profiles are derived based on the data from the Meteorological Data Open Portal of Korea Meteorological Administration (KMA), KMA [
23].
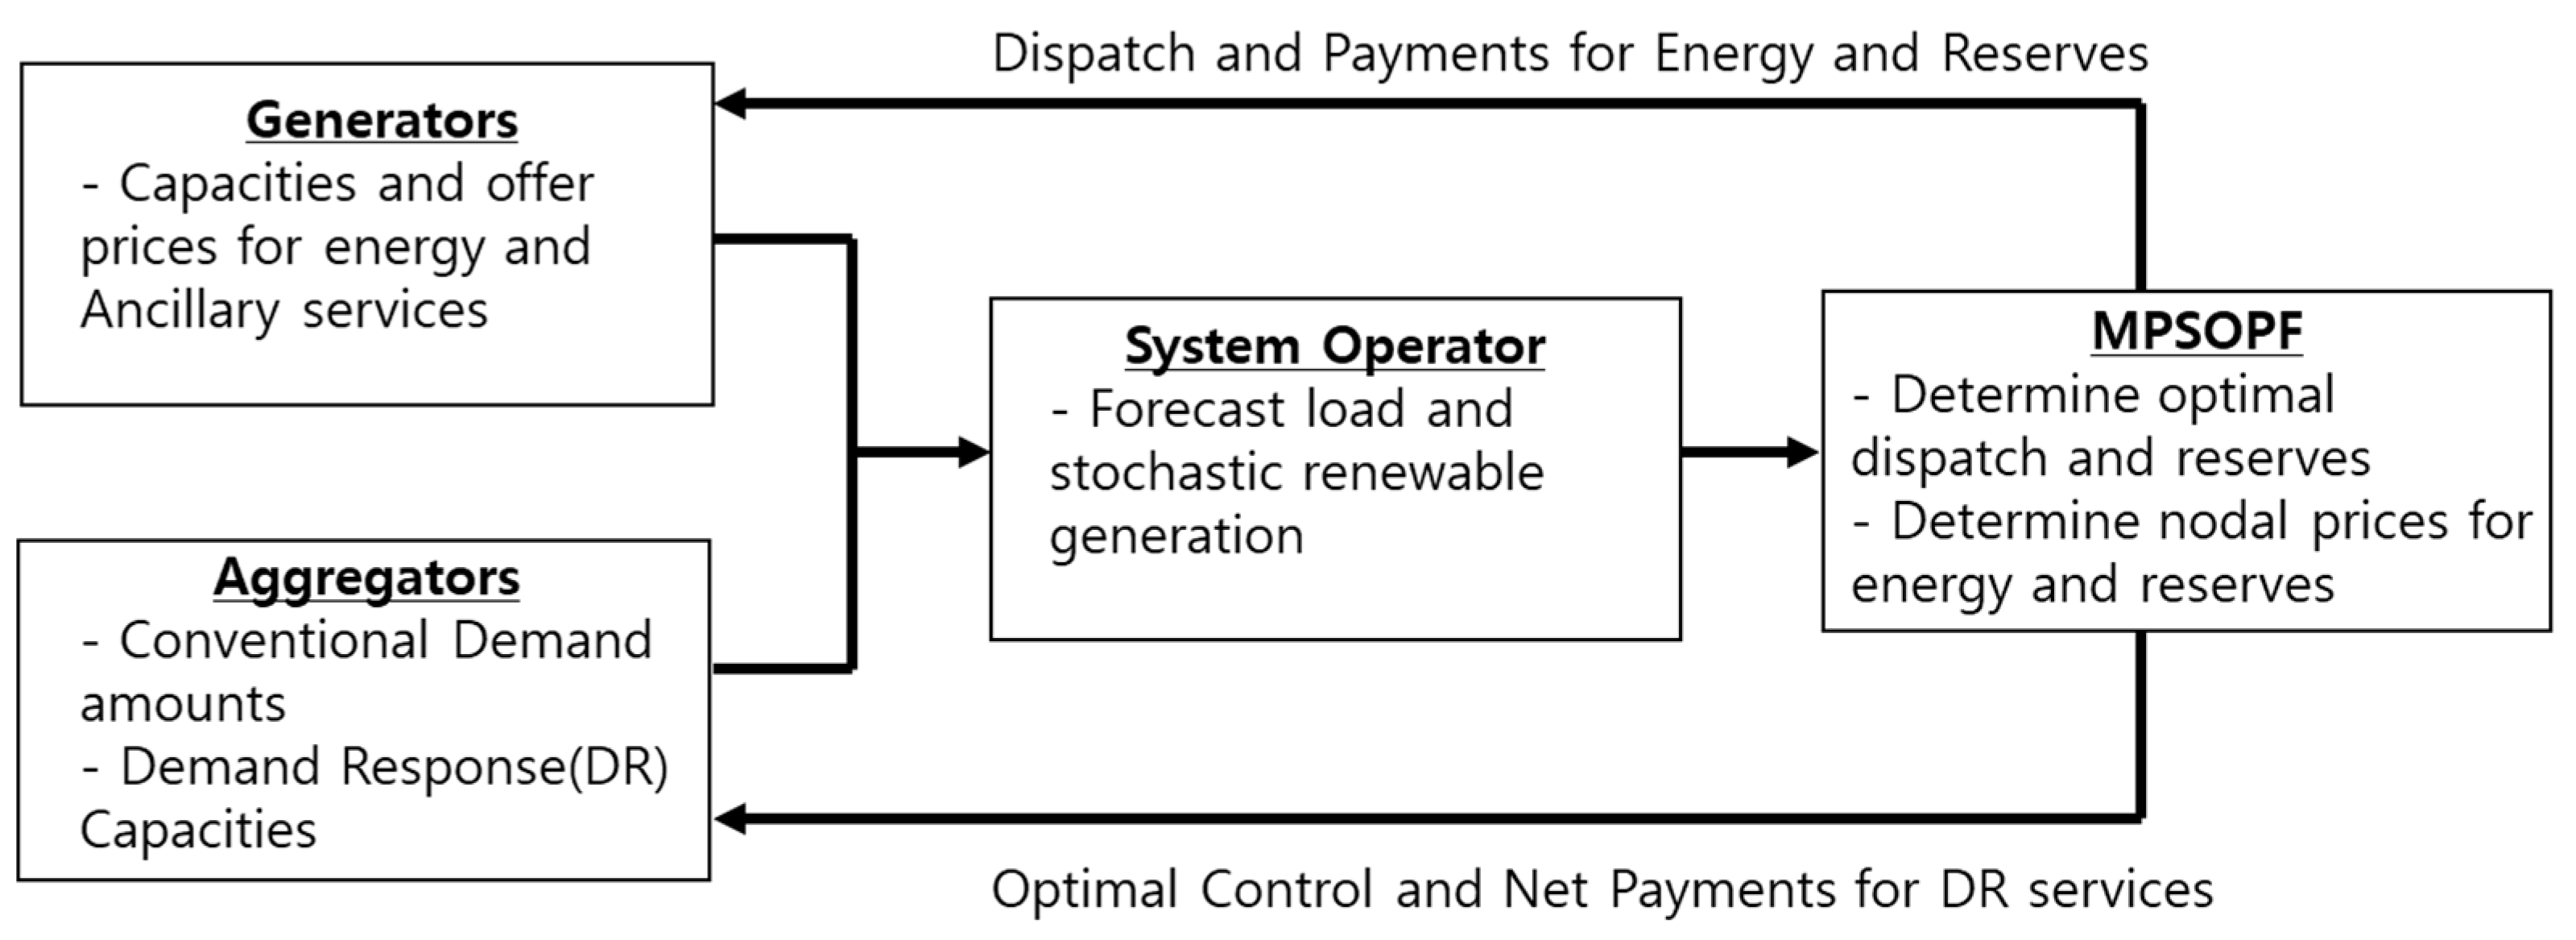
Figure 1 illustrates the flow of information and dispatch decisions and payments between generators, aggregators, and the system operator that are determined by MPSOPF. Generators provide information regarding capacity availability and their offer prices for energy and ancillary services. Aggregators provide their predicted demand level and capacity availability for demand response (DR) services for the next 24 h to the system operator. System operator forecasts load and renewable generation for the next 24 h. Combining all information presented, MPSOPF solves the cost minimization problem of day-ahead system operation and then determines optimal energy dispatch and reserves for each conventional generator and demand response capacities. It also determines nodal prices for energy and reserves. Once MPSOPF solves for the day-ahead scheduling problem, the optimal dispatch and payments that can be computed based on nodal prices are transferred back to generators and aggregators. It is important to note that DR capacities can work in the same way that dispatchable conventional generation units work in the power system when aggregators can connect and control distributed demand resources by internet networks like virtual power plant (VPP).
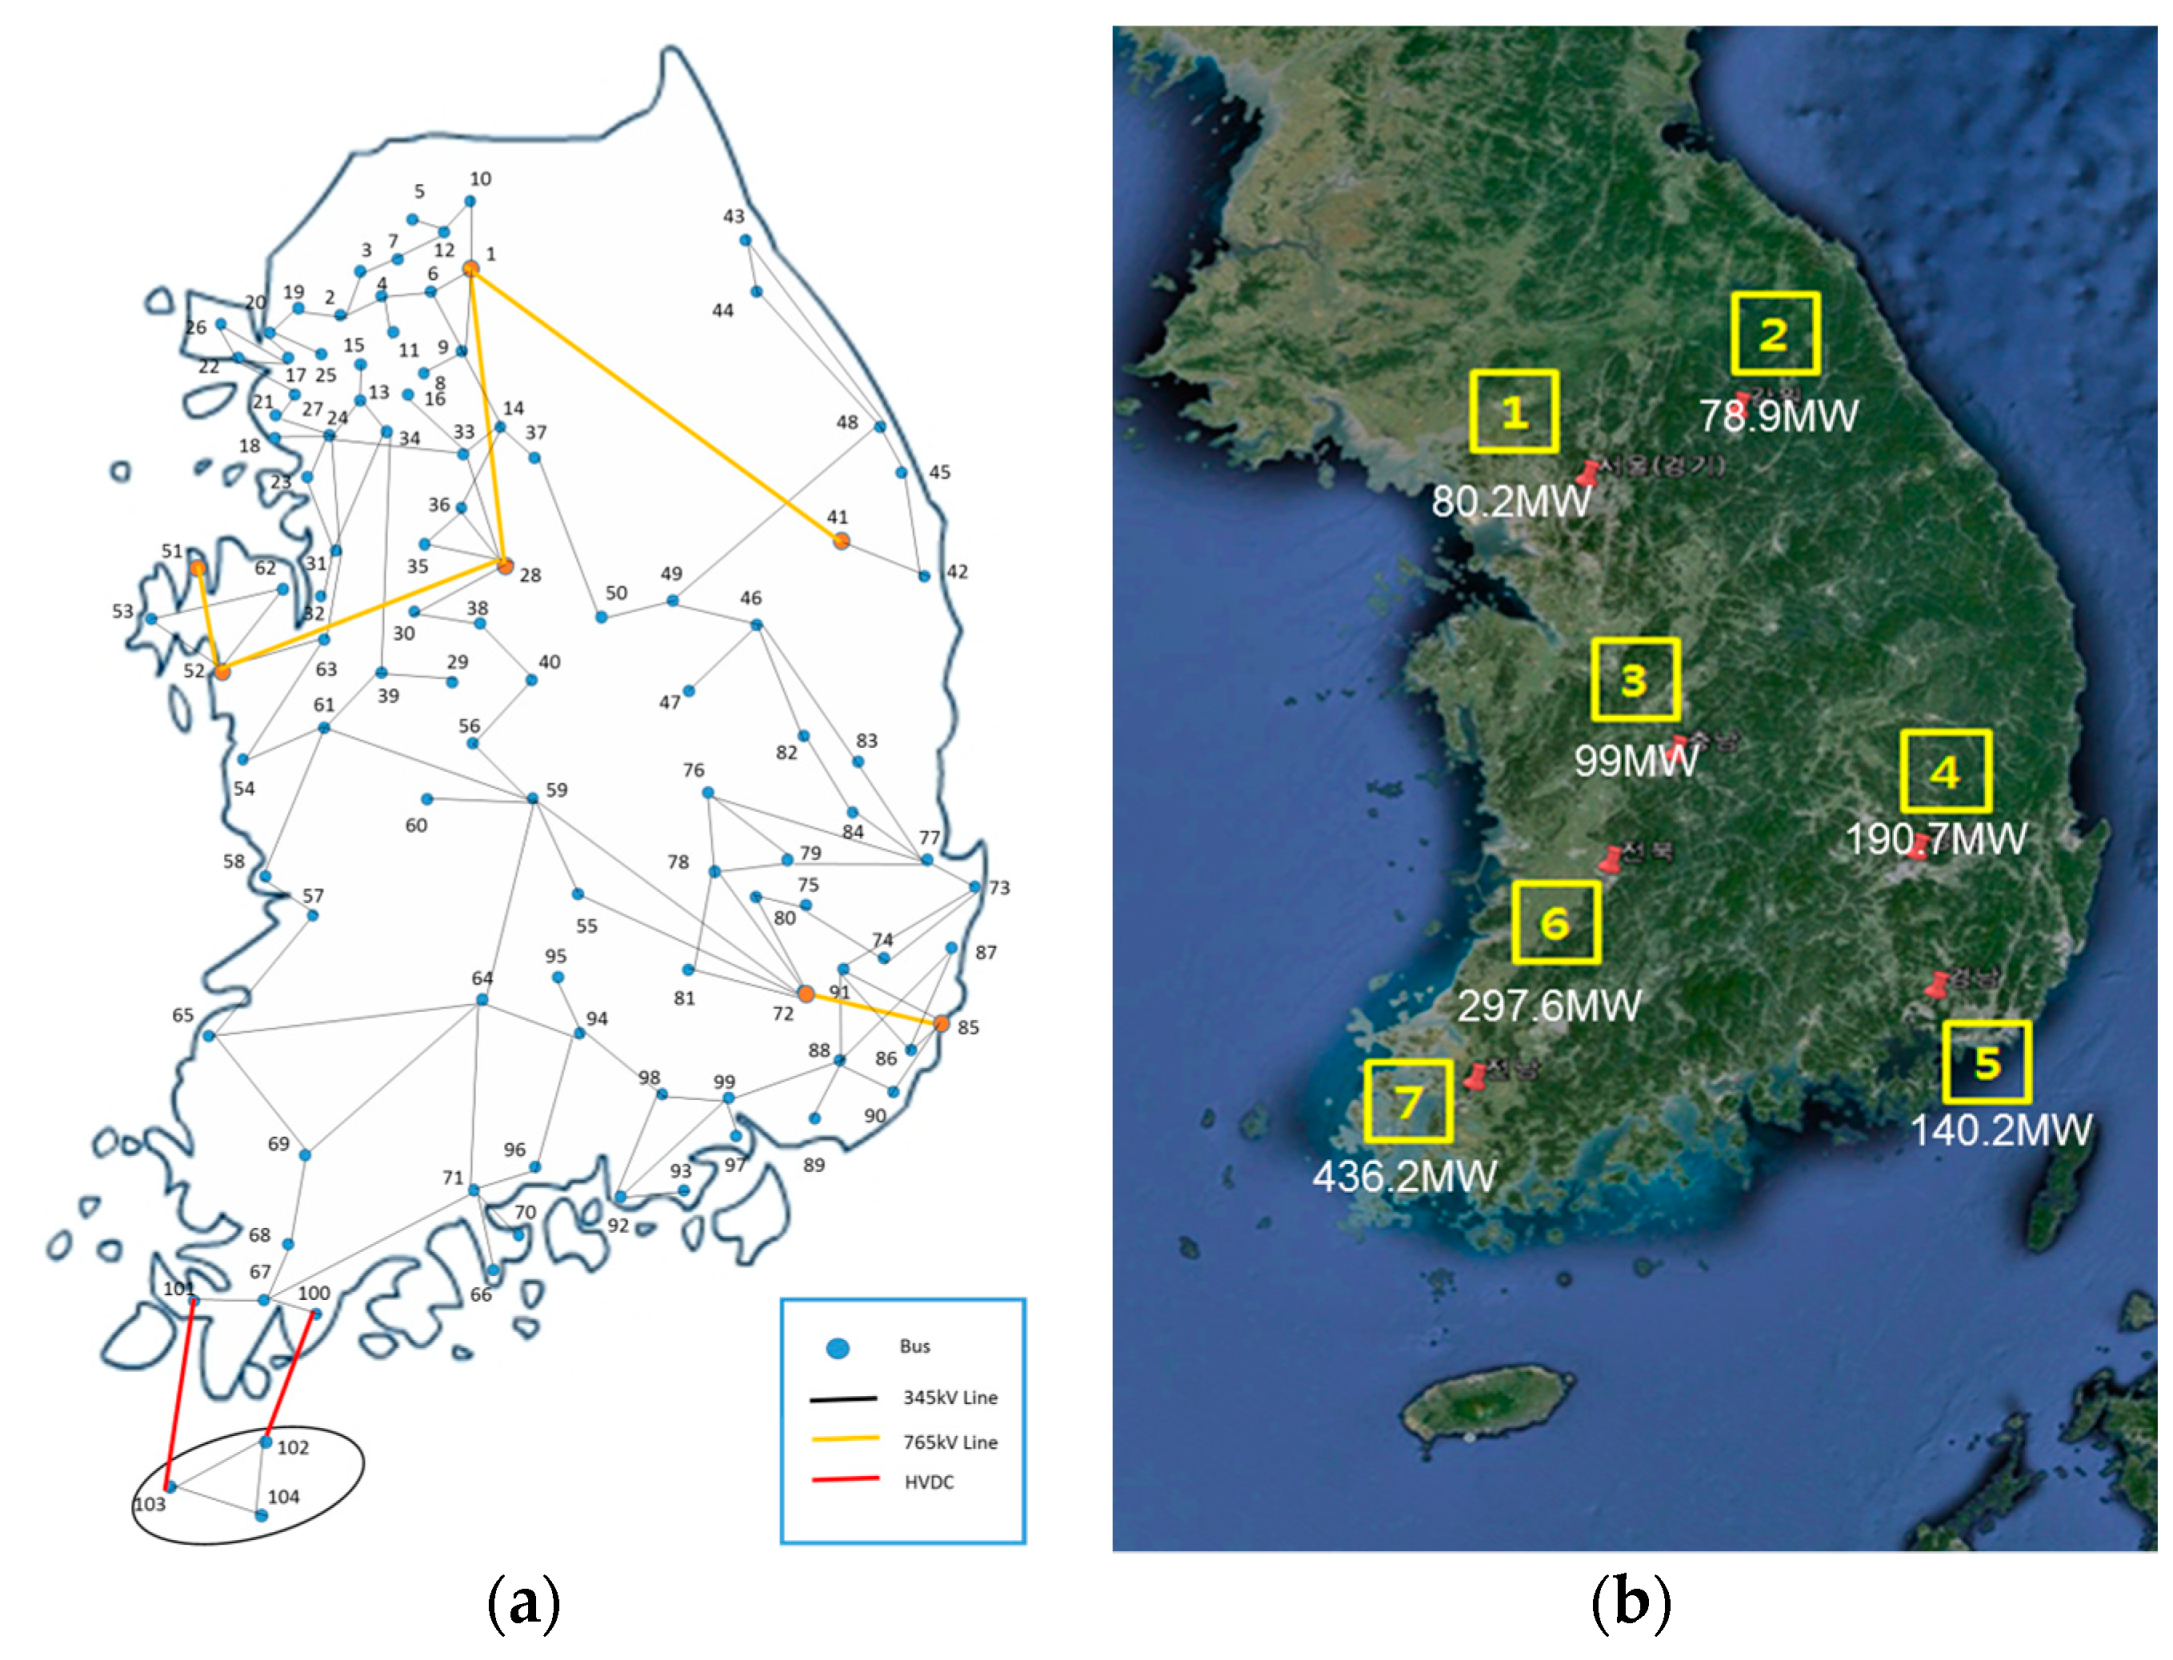
Figure 2a shows the map of the Korean power system, constructed based on the MPSOPF model. This map shows the Korean power system with 765 kV and 345 kV transmission networks in the 104-bus form.
Figure 2b shows the locations of seven major solar generation farms. The selected solar generation farms were based on installed capacities of over 5% of total national capacity among all municipalities and provinces. As the total capacity of the selected solar power regions sums to 88% of the total national capacity, the seven selected regions can reflect the present characteristics of the Korean solar power generation.
3.2. Solar Generation Forecasting Model
The core objective of this study is to estimate the impact and cost of solar generation uncertainty on power system operations. As such, solar generation forecasting data that can reflect the uncertainty of solar generation is important. The overall solar generation forecasting model is composed of the following three steps. The first step utilizes the two-stage ARMAX model shown in Equation (2), developing the solar generation estimation model for the seven solar farms. In the two-stage ARMAX model, stage 1 explains radiation using seasonal cycles (1 year, half-year, 24 h, 12 h) and temperature as explanatory variables, while stage 2 utilizes stage-1 residuals to extract additional information using an Autoregressive-moving average (ARMA) time-series analysis. This methodology is based on Jeon et al. [
24] and Lamadrid et al. [
25]. Radiation and temperature data are acquired from the Korea Meteorological Administration.
Stage 1: Deterministic part
where
Deterministic Cyclest,i is a one-year, half-year, 24-h, and 12-h sine and cosine curve, and
is the residual of the stage 1 ordinary least squares estimation function for time t and solar generation site i.
Stage 2: ARMA part
where
is the white noise residual of the stage 2 ARMA estimation function,
is the coefficient for autoregressive (AR) terms, and
is the coefficient for moving average (MA) terms.
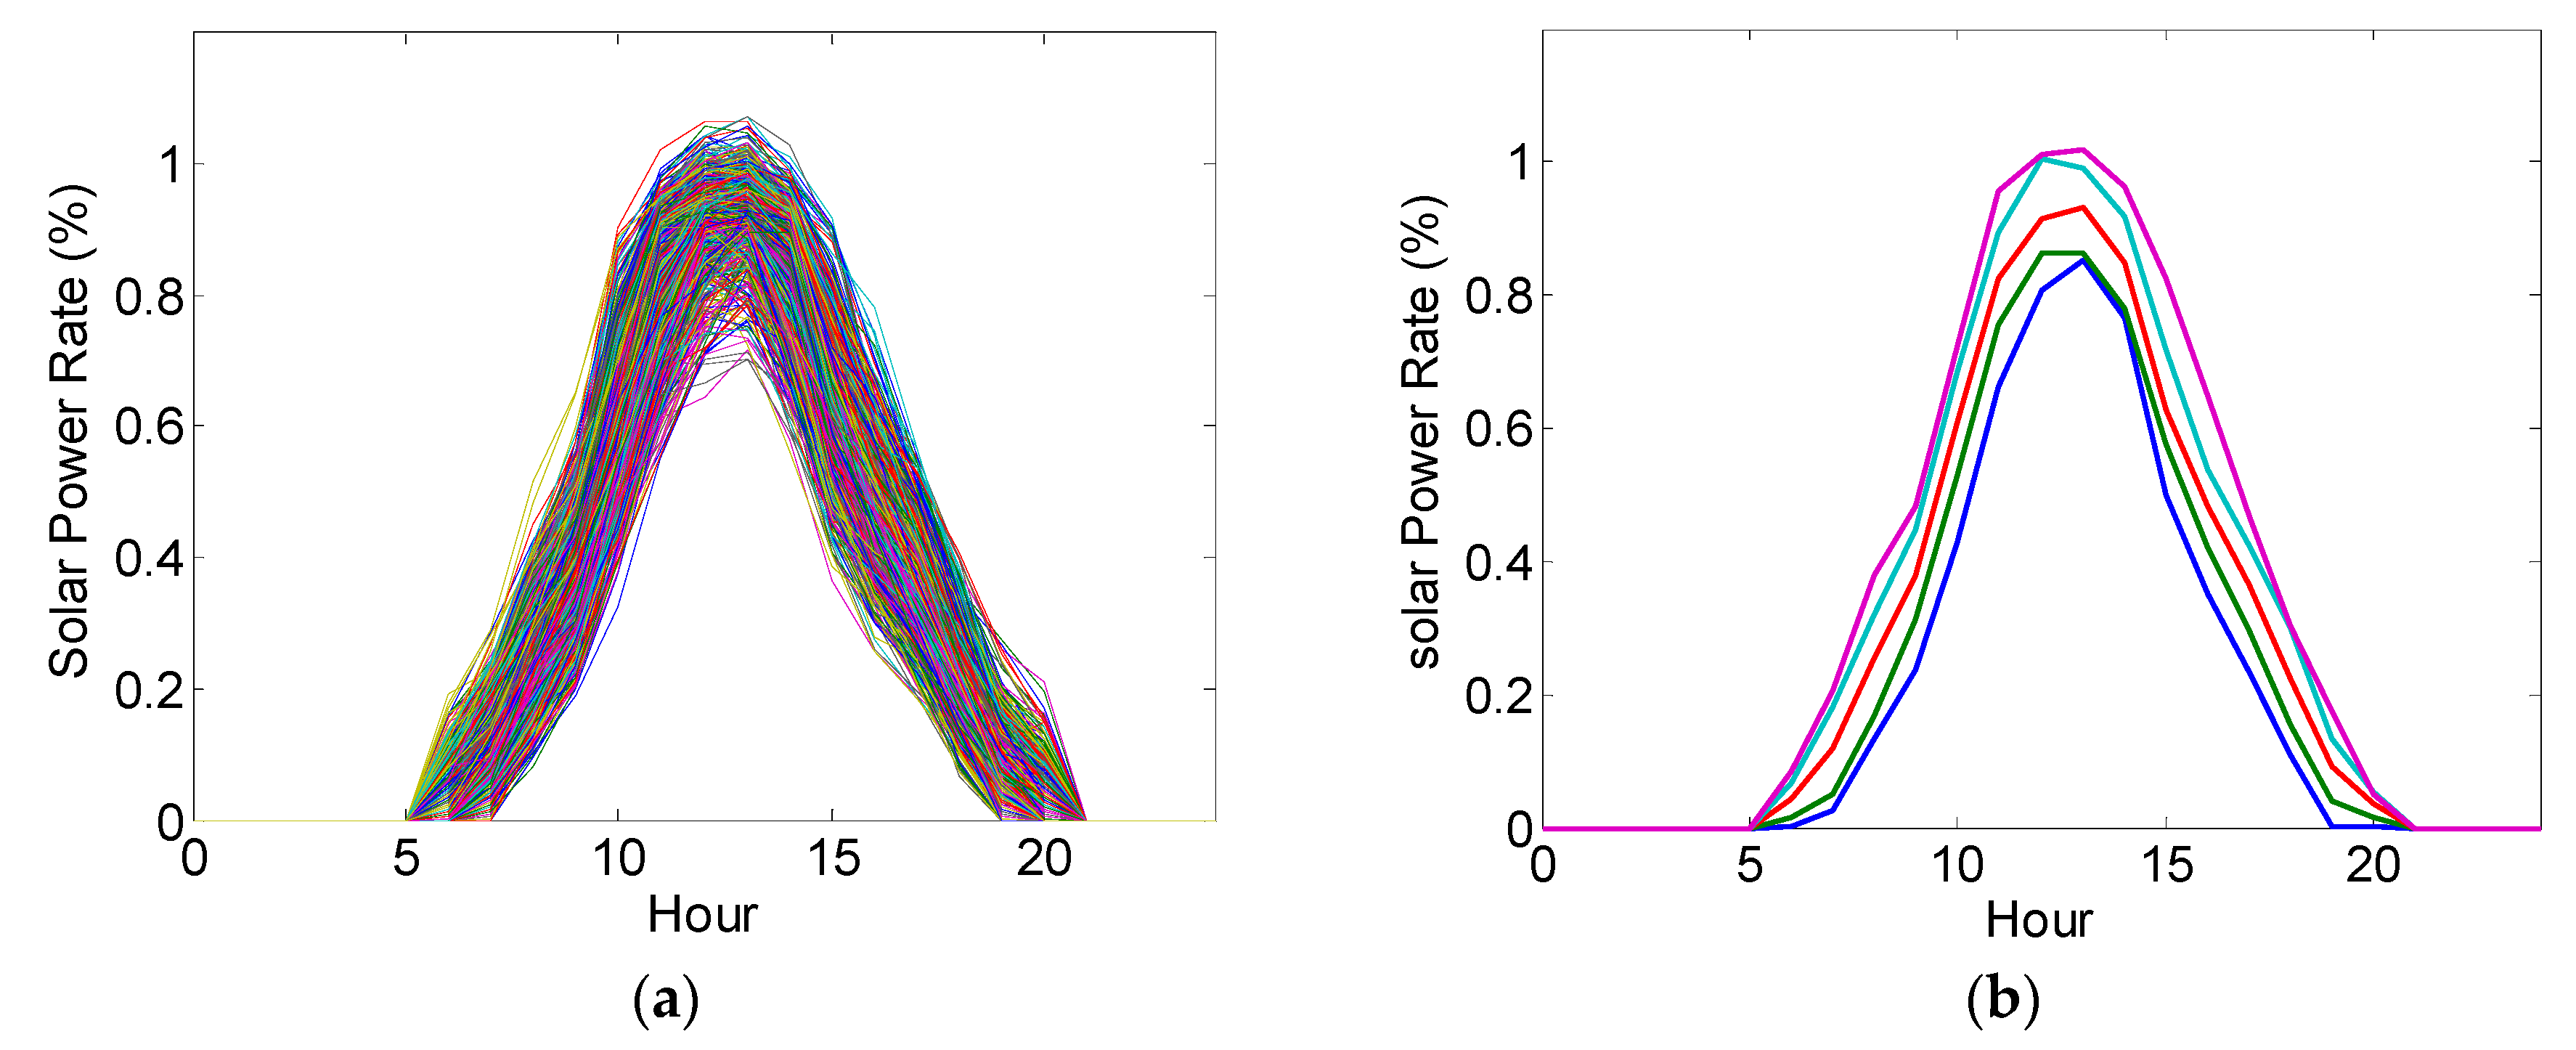
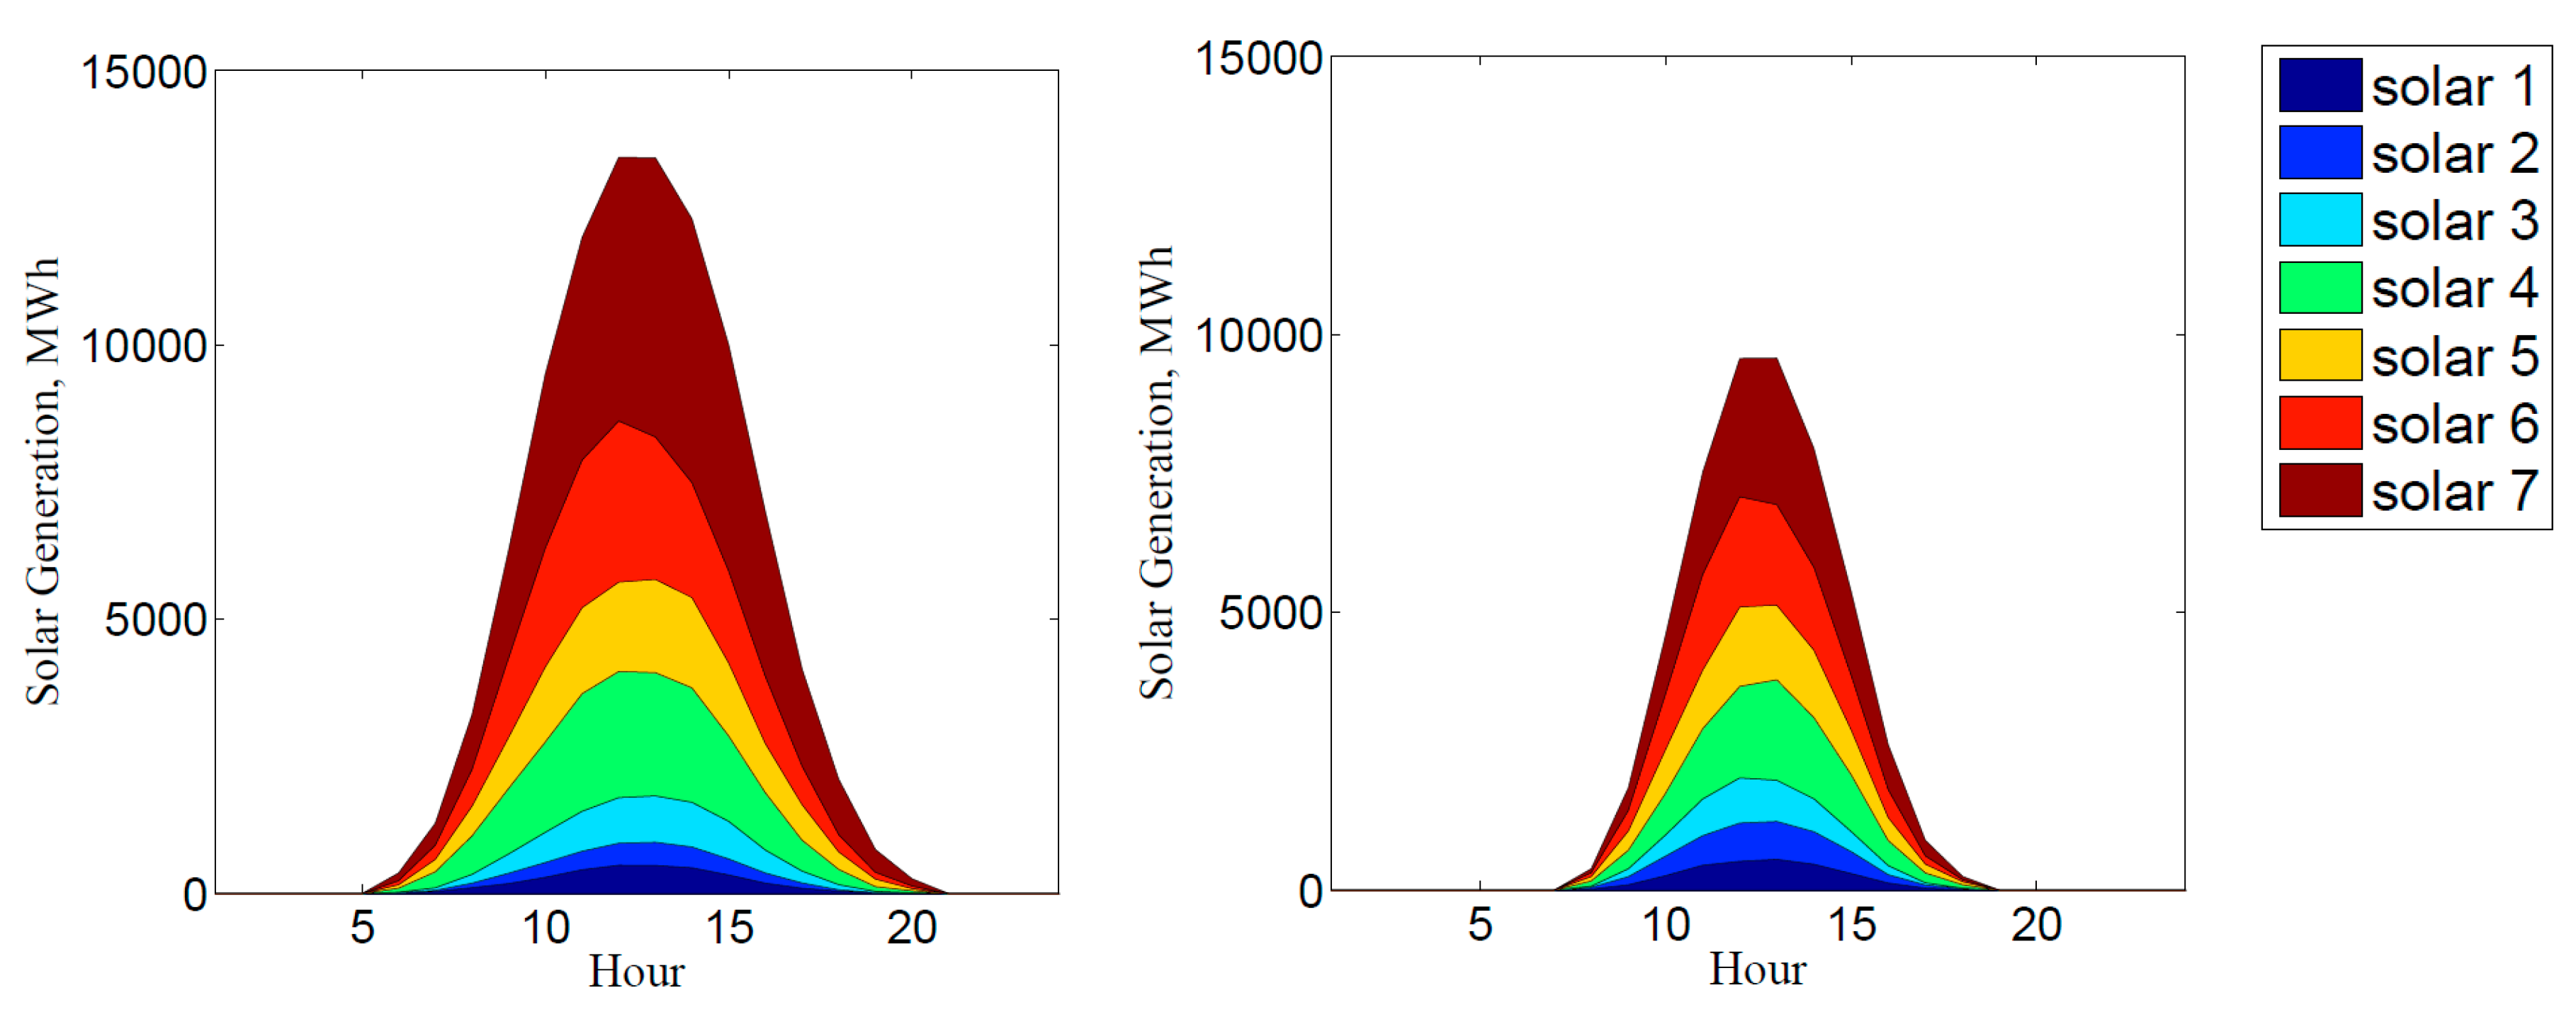
The second step involves the utilization of the Monte Carlo simulation method using the white noise residuals of the estimated solar radiation model, resulting in 1000 solar radiation profiles as shown in
Figure 3a. The third step involves the transfer of 1000 radiation profiles into solar generation profiles for each site, as shown in
Figure 3b, followed by the extraction of five profiles that could represent the total 1000 profiles. The method of extracting five representative scenarios involved the selection of five scenario profiles in the [2.5%, 16%, 50%, 84%, 97.5%] relative standings of all profiles, which corresponds to +1 and −1 standard deviation from the median and +2 and −2 standard deviation from the median.
4. Results and Discussion
4.1. Case Setup
To understand the impact of solar generation uncertainty and the contribution of ESS in reducing this uncertainty cost, five case scenarios were constructed, as shown in
Table 1. Case 1 assumed the 2015 basic Korean power system, which did not include stochastic generation sources. Case 2 shows the inclusion of solar power in Case 1, Case 2_2015 includes 1507 MW of solar power in 2015, and Case 2_2029 includes 16,565 MW of target solar power in 2029. Case 3 assumes the installation of 10 GWh of LIB ESS in Case 2, commensurate to the capacity of each solar farm. LIB were assumed to have a power rate that takes three hours to fully recharge. Therefore, Case 3_2015 shows the inclusion of ESS at the low solar power levels of 2015, and Case 3_2029 includes ESS at high solar powers of 2029. Through these five case scenarios, this study analyzes the costs of solar generation uncertainty for the operations of a power system and the extent to which this uncertainty is controlled when ESS is combined, given low and high levels of solar generation.
4.2. Analysis of Daily Results for Conventional Generation, Solar Generation, and Reserves
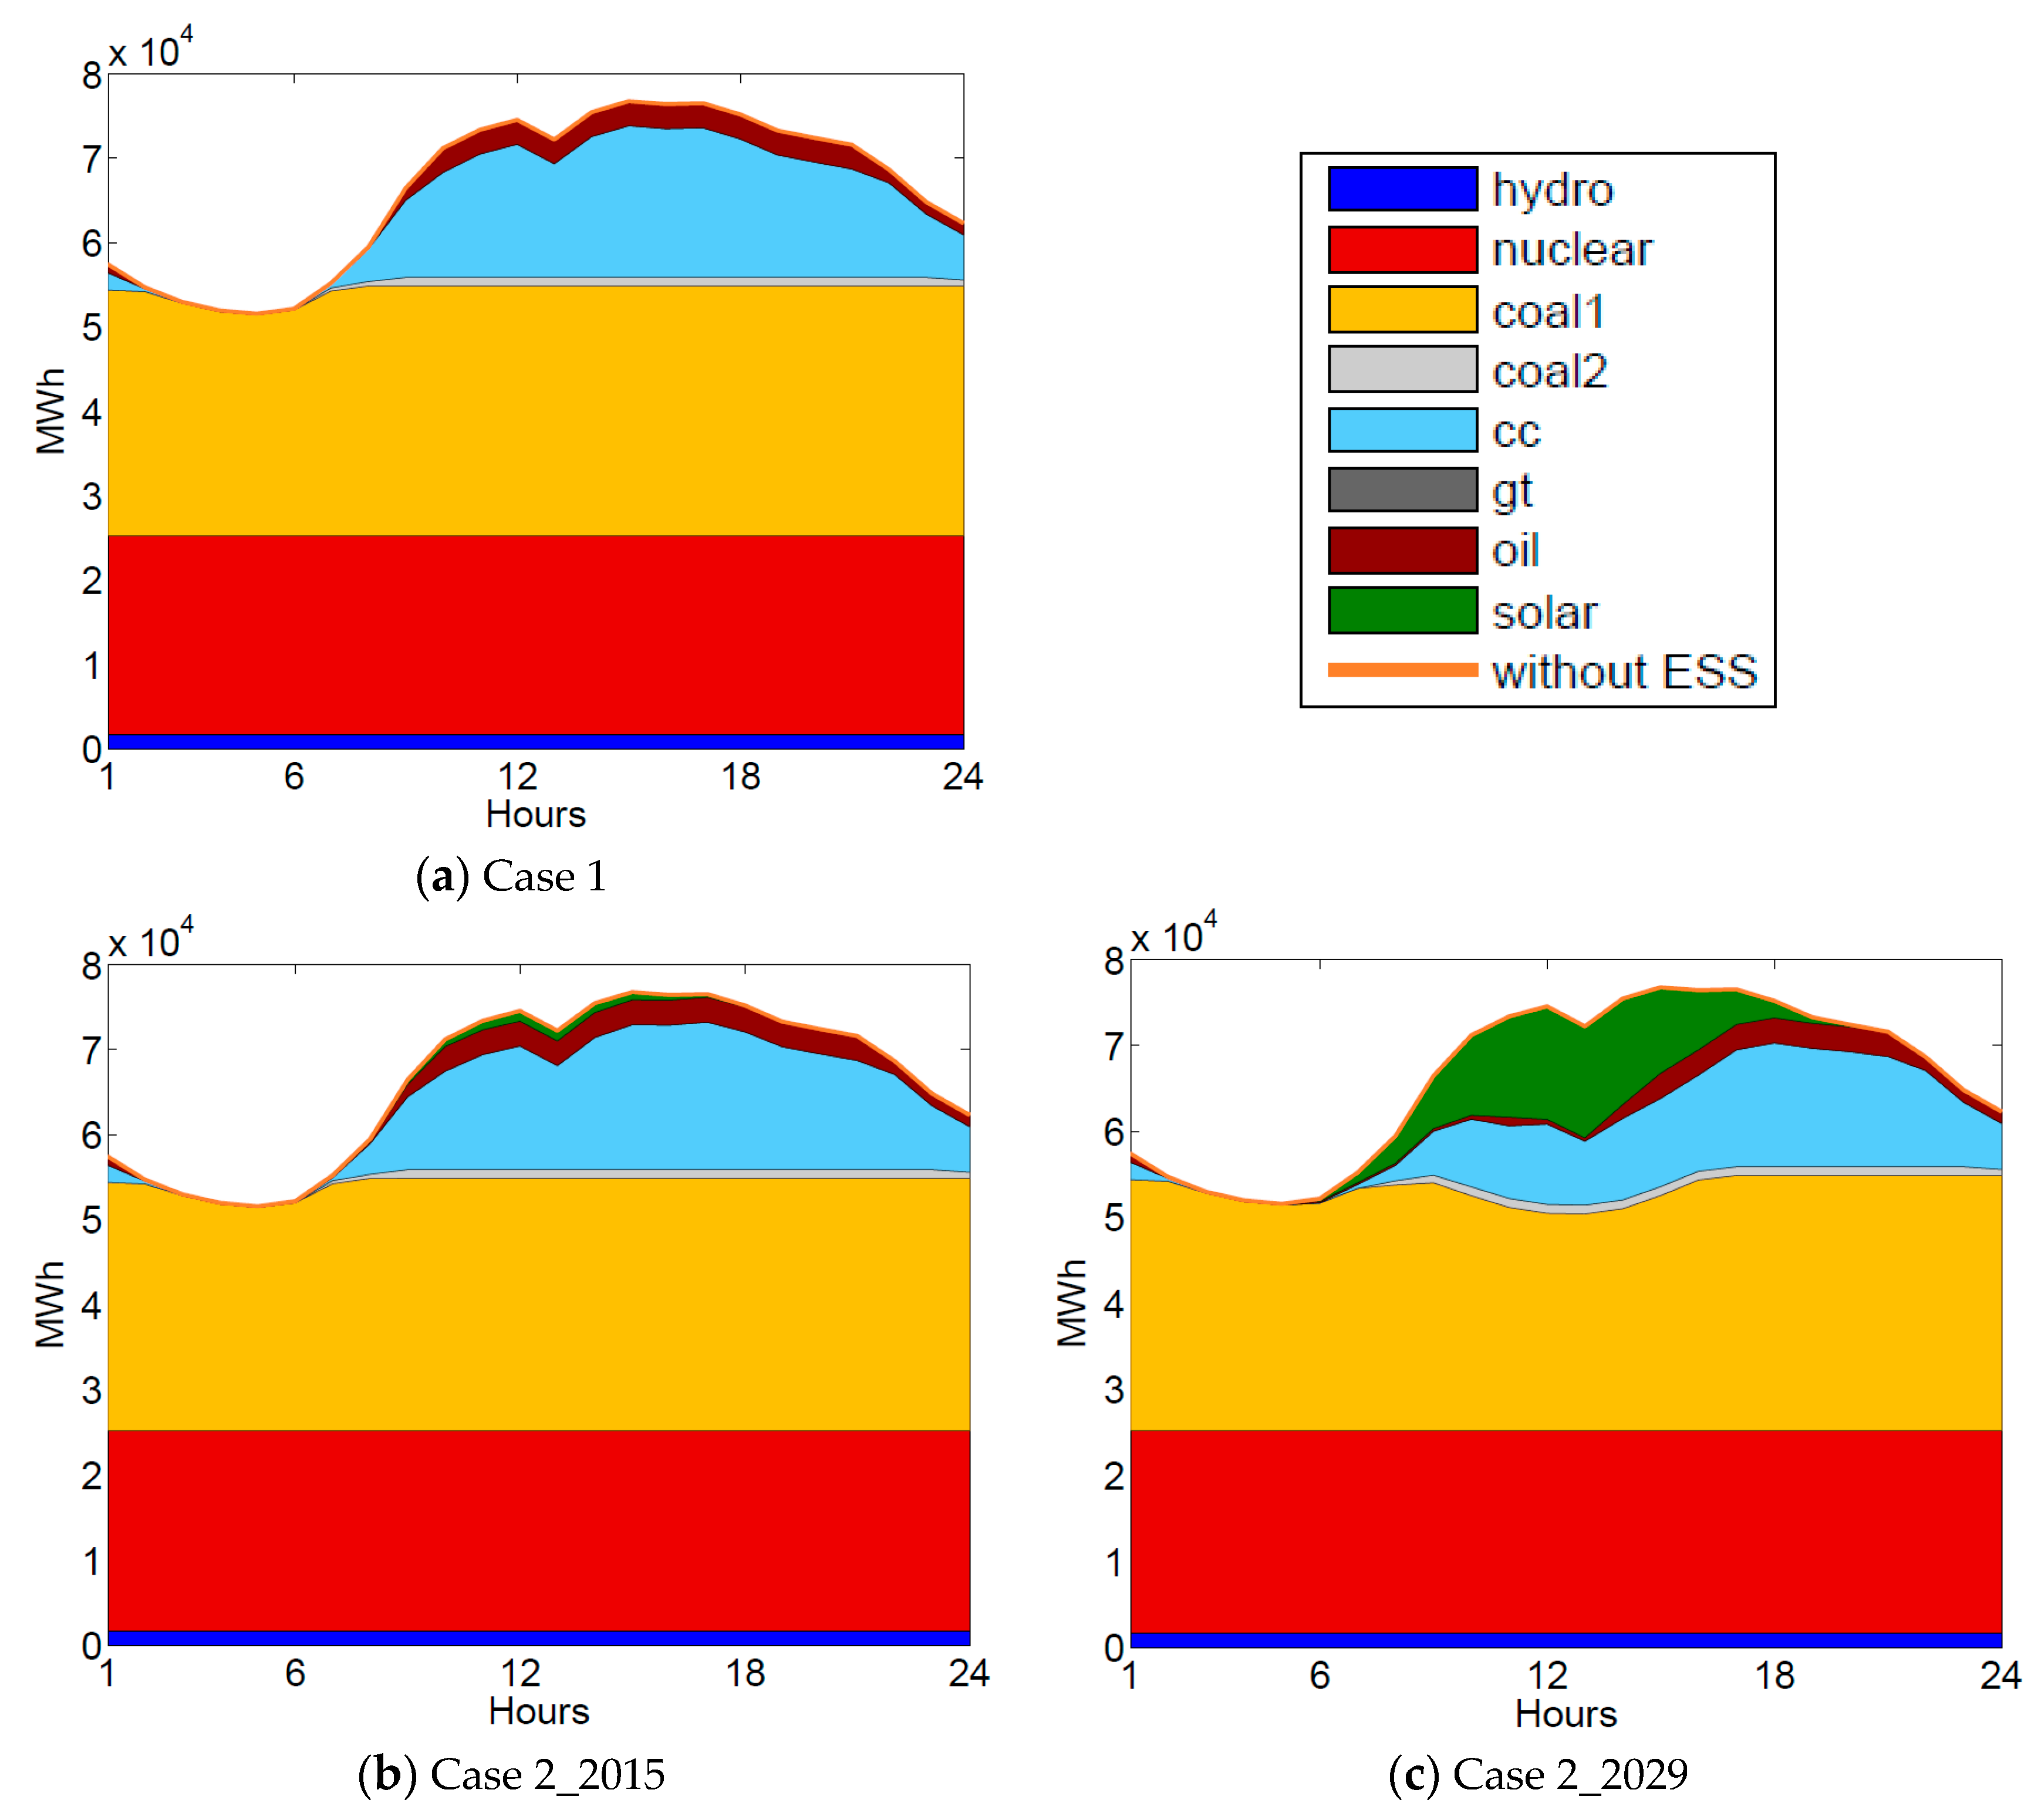
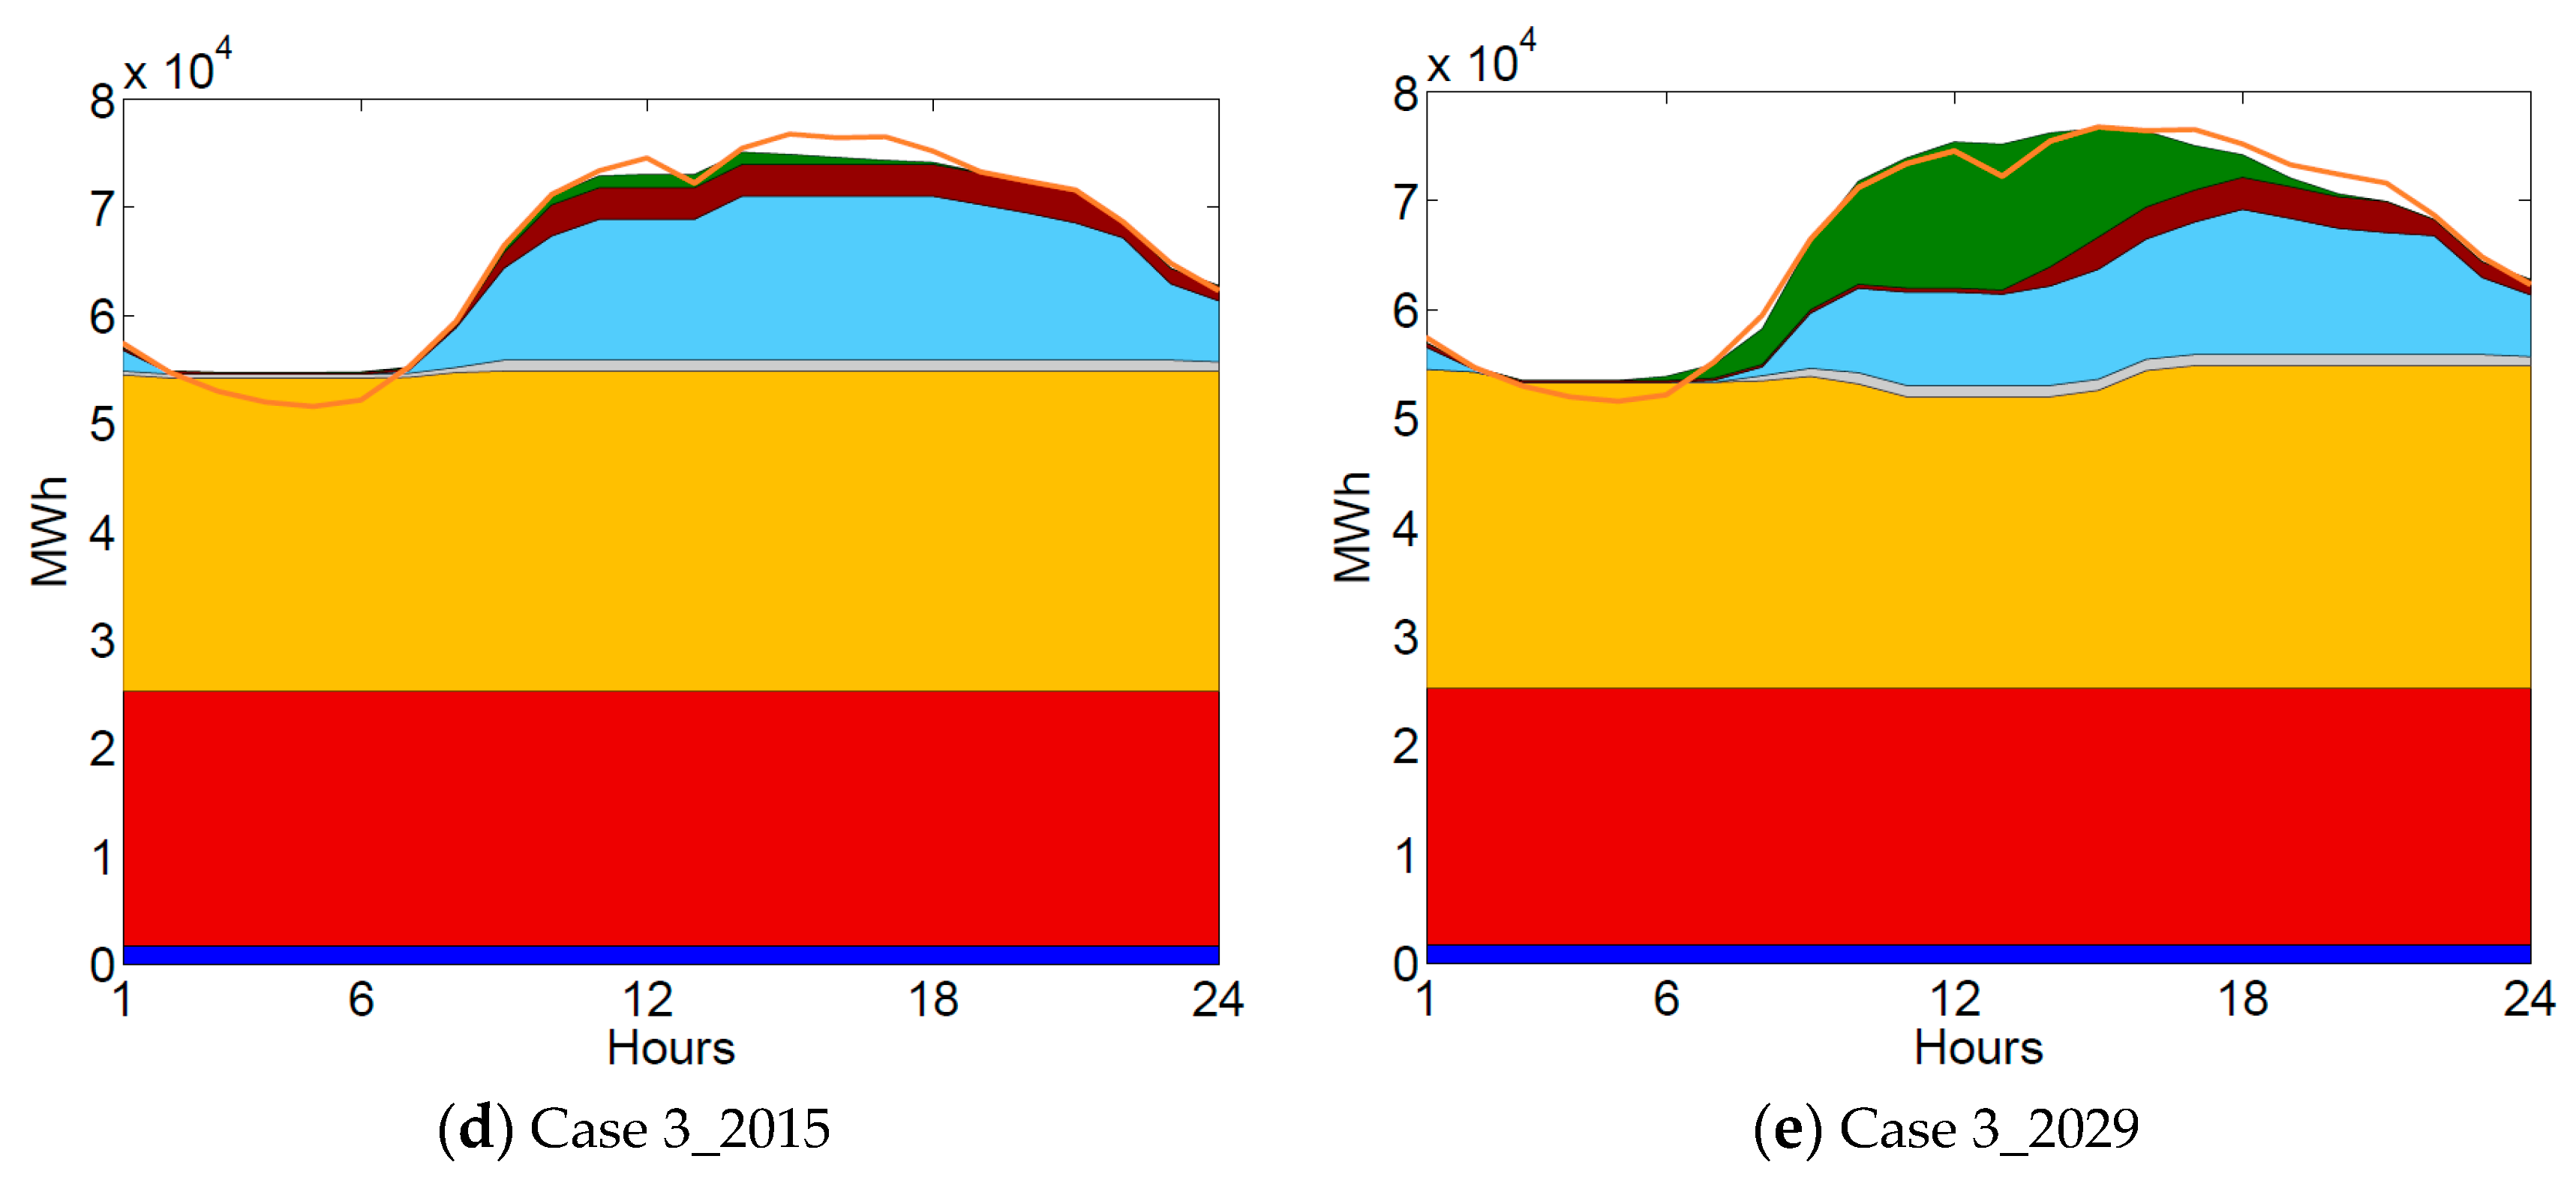
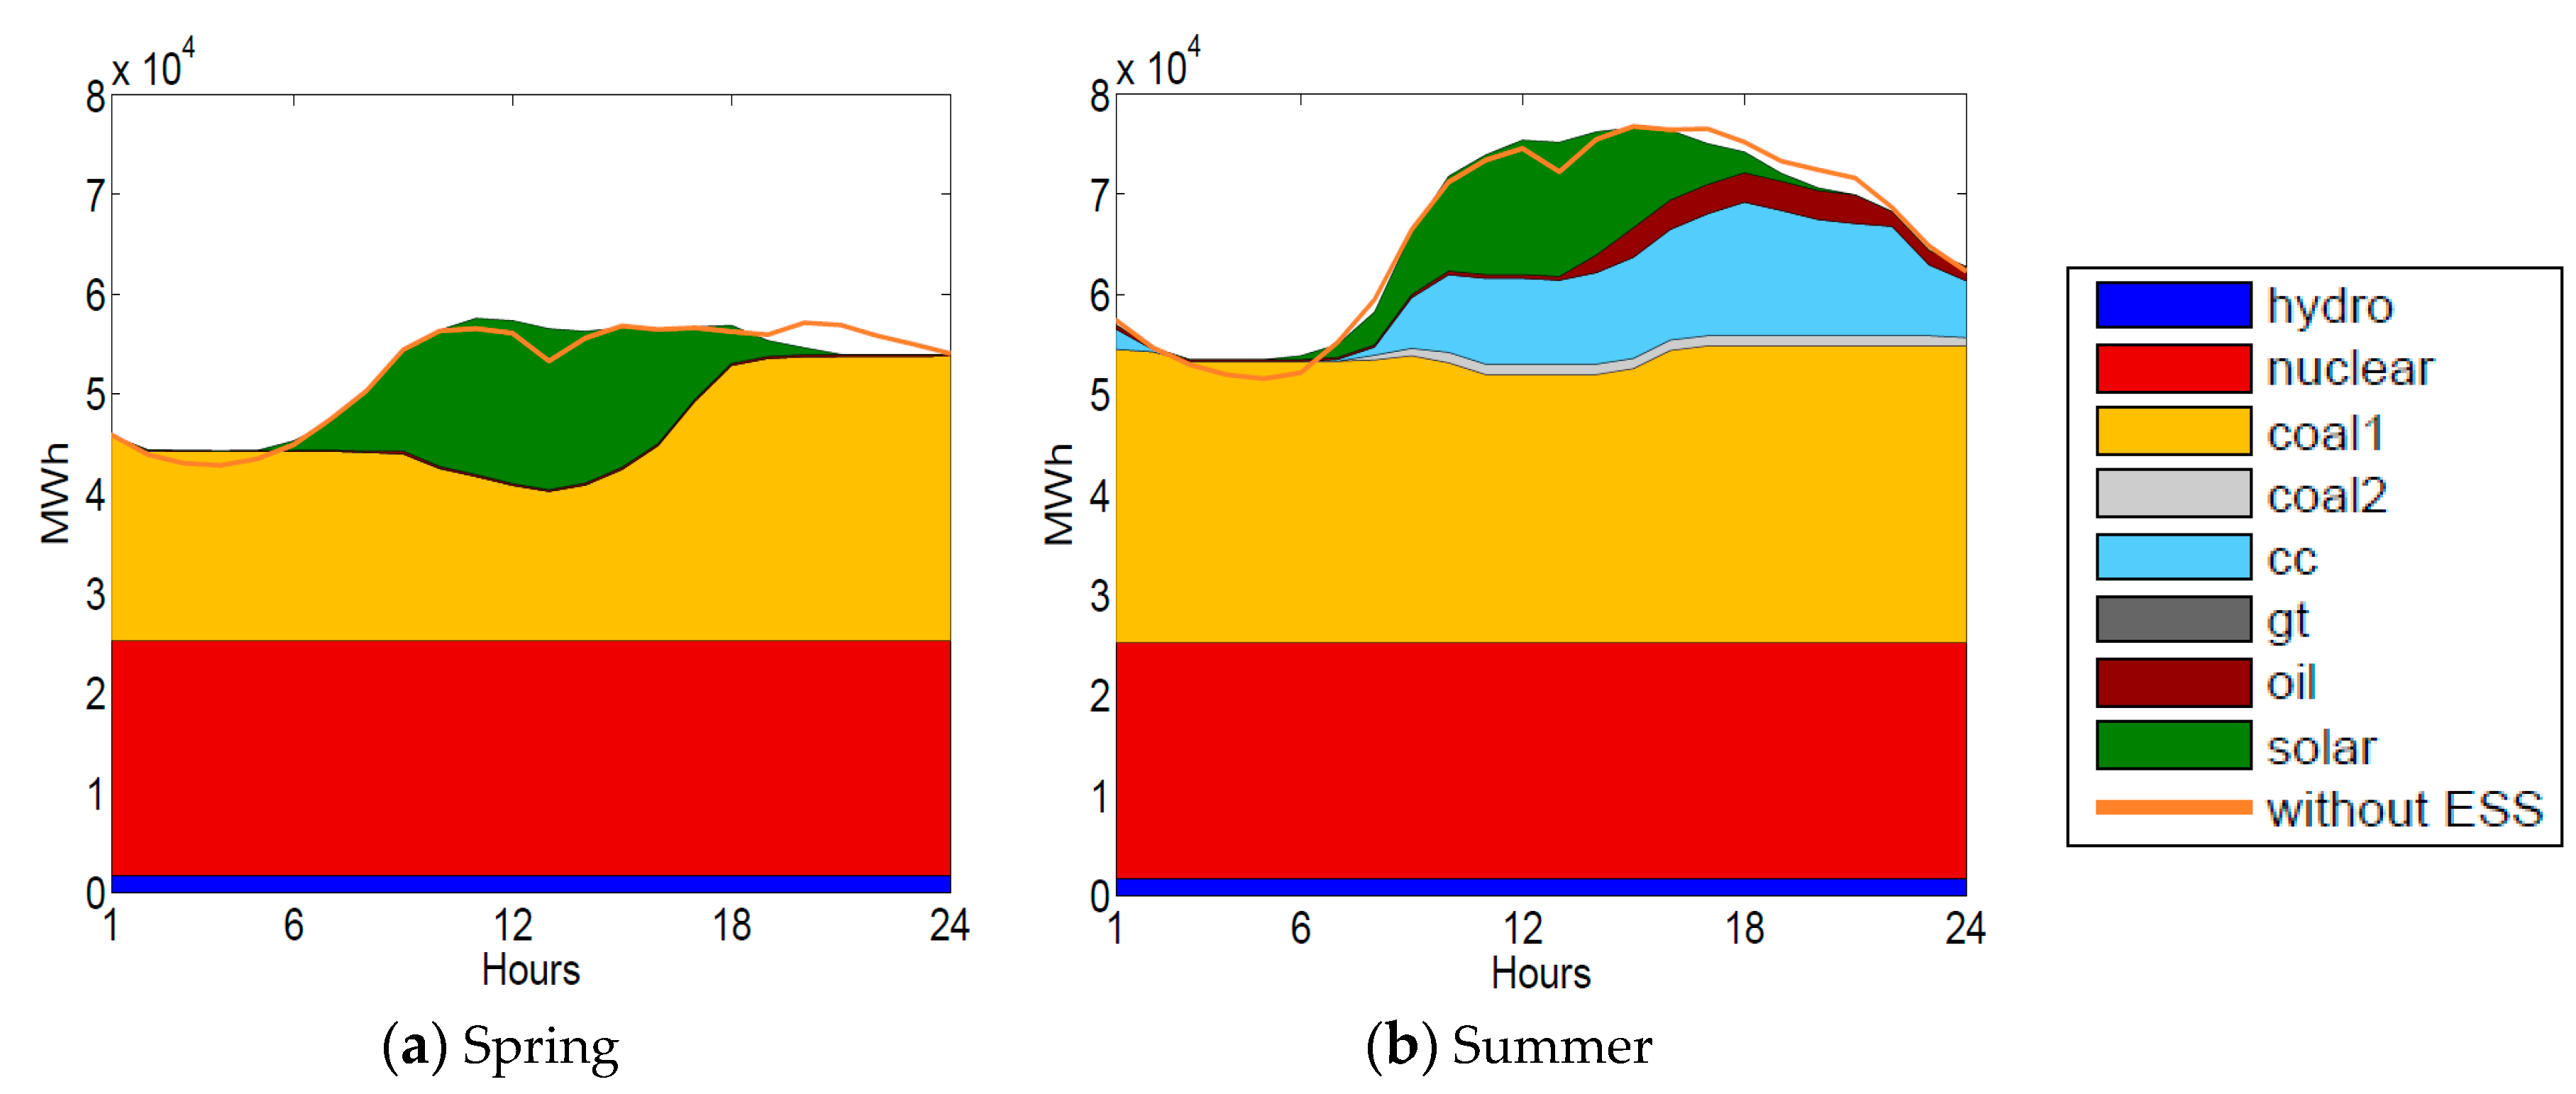
Figure 4 shows the 24-h expected dispatch pattern of given solar power generation during summer peak days by scenarios. The generation sources are in the order of increasing marginal cost, that is, hydro, nuclear, coal1 (bituminous coal), coal2 (anthracite), combined cycle gas turbine (CC), gas turbine (gt), and oil; solar generation is at the top. Case 1 indicates that base load in the Korean power system is provided by nuclear and coal; CC is responsible for the majority of the peak load. In Case 2_2029, 16,566 MW of solar power capacity is focused during the daytime peak, replacing CC and oil, peak generation, as well as coal. The orange line in Case 3 shows the profile of original demand when there are no storage capacities, so it can be interpreted that storage units are charging (purchasing energy from the grid) if the colored generation area is above the orange line, and storage units are discharging (selling energy back to the grid) if the colored generation area is below the orange line. Hence, by comparing the orange line and the top line of the colored generation area, the charging and discharging decisions of storage can be inferred. Case 3_2015 indicates that the presence of ESS and low solar power results for charging during the early morning hours increases cheap coal1 generation, and discharging is done at daytime peak (13:00–16:00), effectively reducing peak generation. Case 3_2029, with high solar power and ESS combined, shows the replacement of oil and CC by high solar power, leading to the movement of the peak to 17:00–20:00, during which time discharging is active. Hence, from the perspective of expected storage action, storage capacities try to reduce the use of the most expensive peak units by moving load at peak net load hours to off-peak hours.
Figure 5 shows the generation profiles of summer and winter representative days at the seven selected solar generation sites. As solar power is present throughout the daytime hours with high power demand, it replaces expensive peak generation and provides valuable energy to the power system. However, the generation volume and uncertainty by season and day are stochastic in nature, as modeled in
Figure 3. Therefore, the reserve required to meet these uncertainties differs depending on season, day, or hour, but the current system in Korea is to maintain the 4000 MW fixed amount of reserve no matter how high the uncertainty is. Therefore, given the situation that the amount of reserve needed will rise as the penetration of stochastic renewable generation increases, it is important to develop a system that manages the reserves more reasonably and efficiently through the co-optimization of energy and reserve.
Table 2 shows the resulting values for conventional generation, solar generation, and reserves (load-following and contingency reserves) for a representative summer day. In this case, the reserve is composed of a load-following reserve, which supplements inter-hour variability, and a contingency reserve, which supplements intra-hour uncertainty.
The high level of solar generation in Case 2_2029 effectively replaces conventional generation. However, the uncertainty and variability of solar generation also lead to a 57% increase in reserves. Case 2_2029 shows that, on this day, the generation of solar generation is 94,518 MWh, representing 6% of total generated volume. However, the reserve increased by 57%, indicating that solar generation uncertainty weakened system reliability to a large extent.
Case 3_2029 shows the effective reduction of solar generation uncertainty by ESS, reducing the reserve by 61% compared to Case 2_2029. Moreover, it contributed to absorbing the spilled solar power within the system, given the uncertainty, resulting in increased solar power generation.
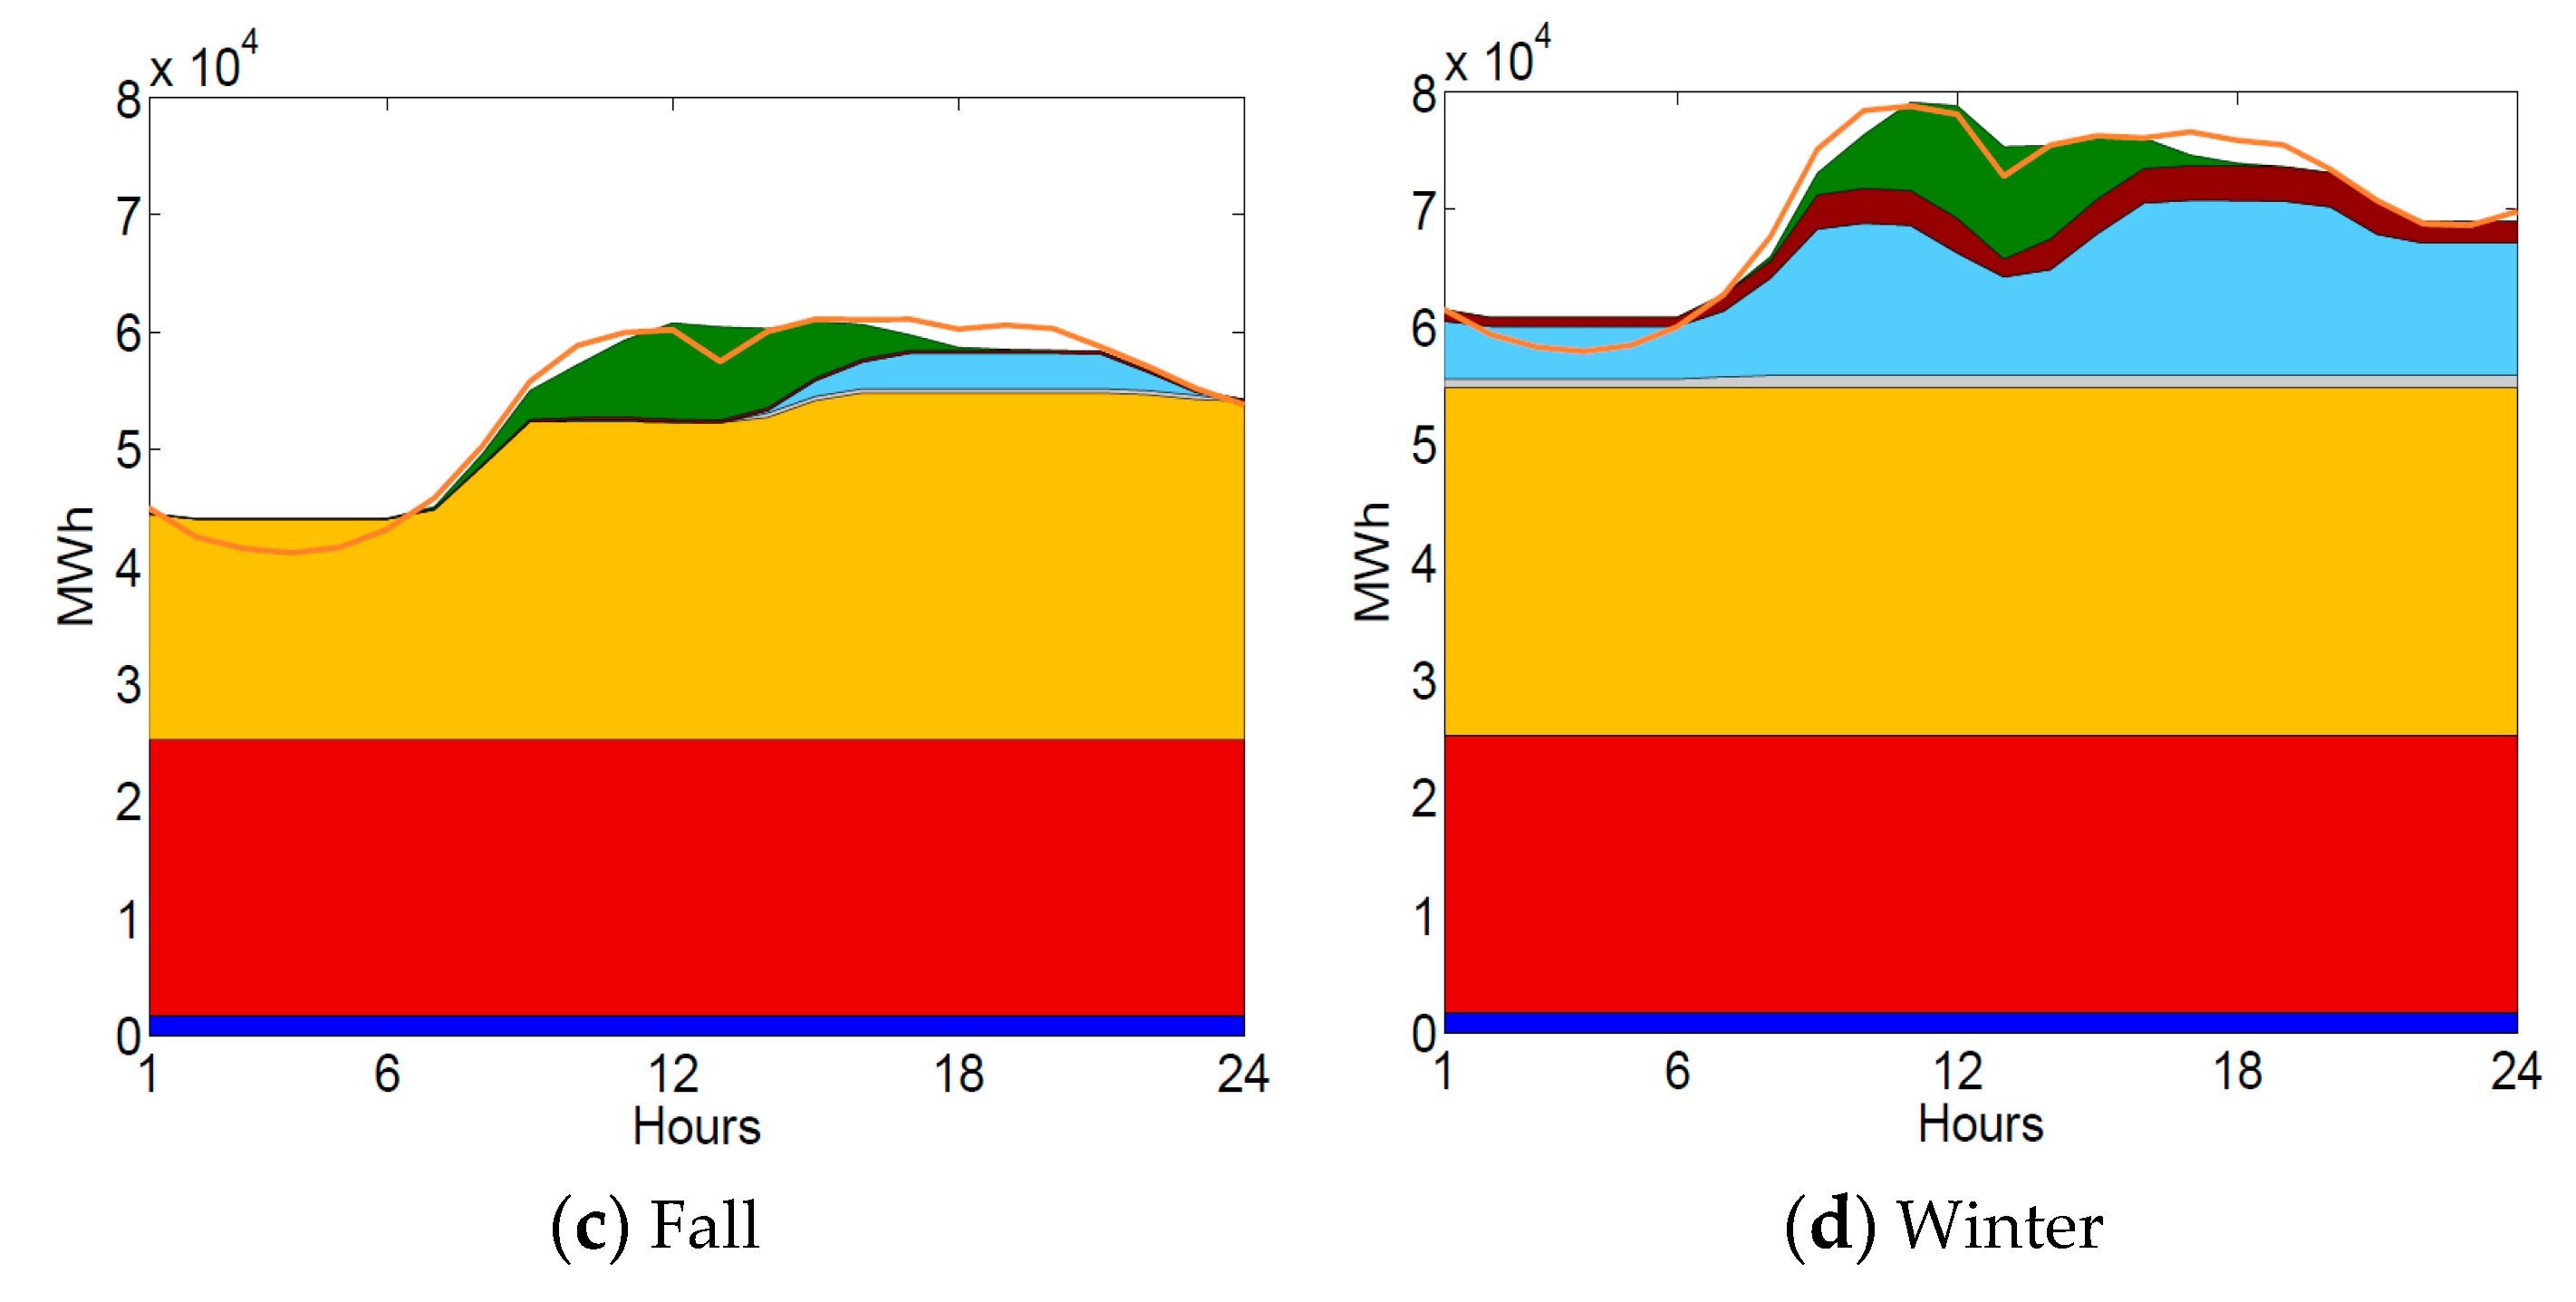
Figure 6 shows the expected dispatch plots of Case 3_2029 for days in different seasons. To analyze the impact of different seasonal characteristics on system operation, we selected days with the highest load for summer and winter and weekdays with the lowest load for spring and fall. We selected four representative days for each season in this way because these days are extreme cases that the system operator needs to find a solution to, to reliably and efficiently operate the power system.
Compared to the summer peak day, the demand level in the chosen spring day is low but solar generation is relatively abundant, so the net load is maintained low and mostly provided by base coal units. Whereas, the representative fall day shows relatively low solar generation, so CC units are used from 18:00 to 22:00 when solar generation is no longer available, but the demand is still relatively high. Due to active electrification of heating in Korea, peak load occurs in the winter season, and net load is maintained high because solar generation is lower than the summer season, so both CC and oil units are actively used. For all representative days, ESS commits a part of its capacity resource to shift load by charging in the early morning when net load is lowest and discharging when net load is at its peak.
Table 3,
Table 4 and
Table 5 show the daily results of conventional generation, solar generation, and reserves on the chosen days of spring, fall, and winter, respectively. In Case 2_2029 of all representative days, contingency reserve is at a similar level which is in the range between 20,000 MWh and 27,000 MWh approximately. One that is significantly different is the load-following reserve, which is approximately 57,000 MWh in spring and fall but 72,810 MWh in winter. This is because, for solar generation, forecasting error is not very significant as the hourly level uncertainty is limited, but high ramping up and ramping down due to sunrise and sunset requires very high load-following ramping reserves.
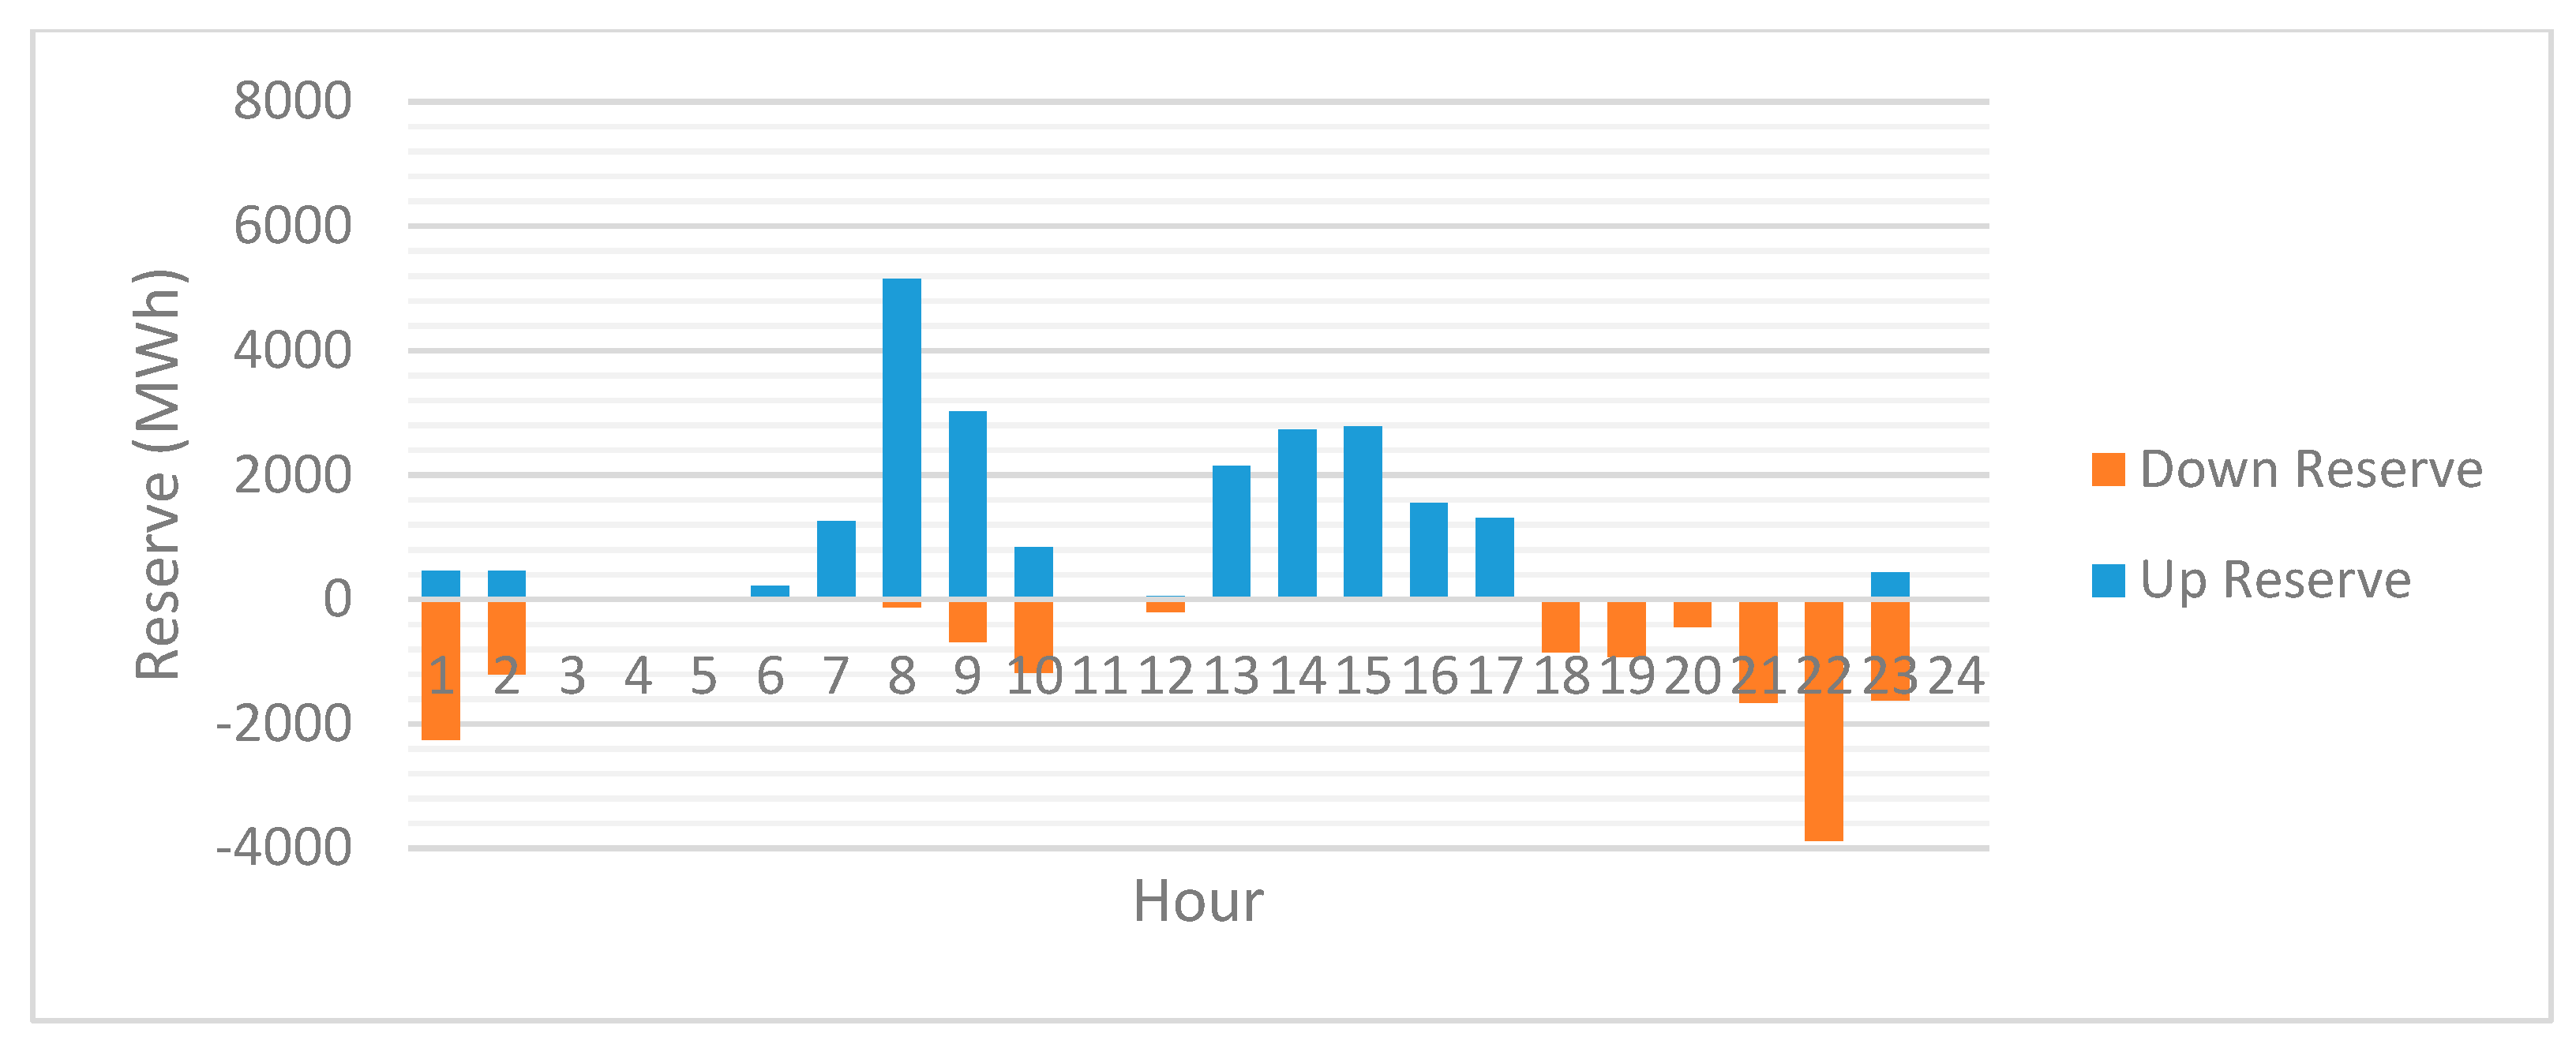
In Case 3_2029 results from all seasons show that ESS is very effective in reducing both load-following reserve and contingency reserve, and it helps in adopting more solar generation to the system.
4.3. Analysis of Reserves Needed for Solar Uncertainty
Figure 7,
Figure 8 and
Figure 9 show the pattern of the estimated hourly reserve needed for system security as per the optimization model. This reserve is calculated as the sum of the load-following and contingency reserves; depending on the direction of the required reserve by hour, they were divided into up or down reserves. Given the uncertainty of solar generation and the contingency cases of the generators, the system operator sets the generation plan by considering the probability of each state of events and minimizing expected operating costs. The deviating values from the expected generation level covering the upward uncertainty constitute up reserves, and the deviating values downward, down reserves. Therefore, depending on the direction of the load-following and contingency reserves, up and down reserves may occur simultaneously.
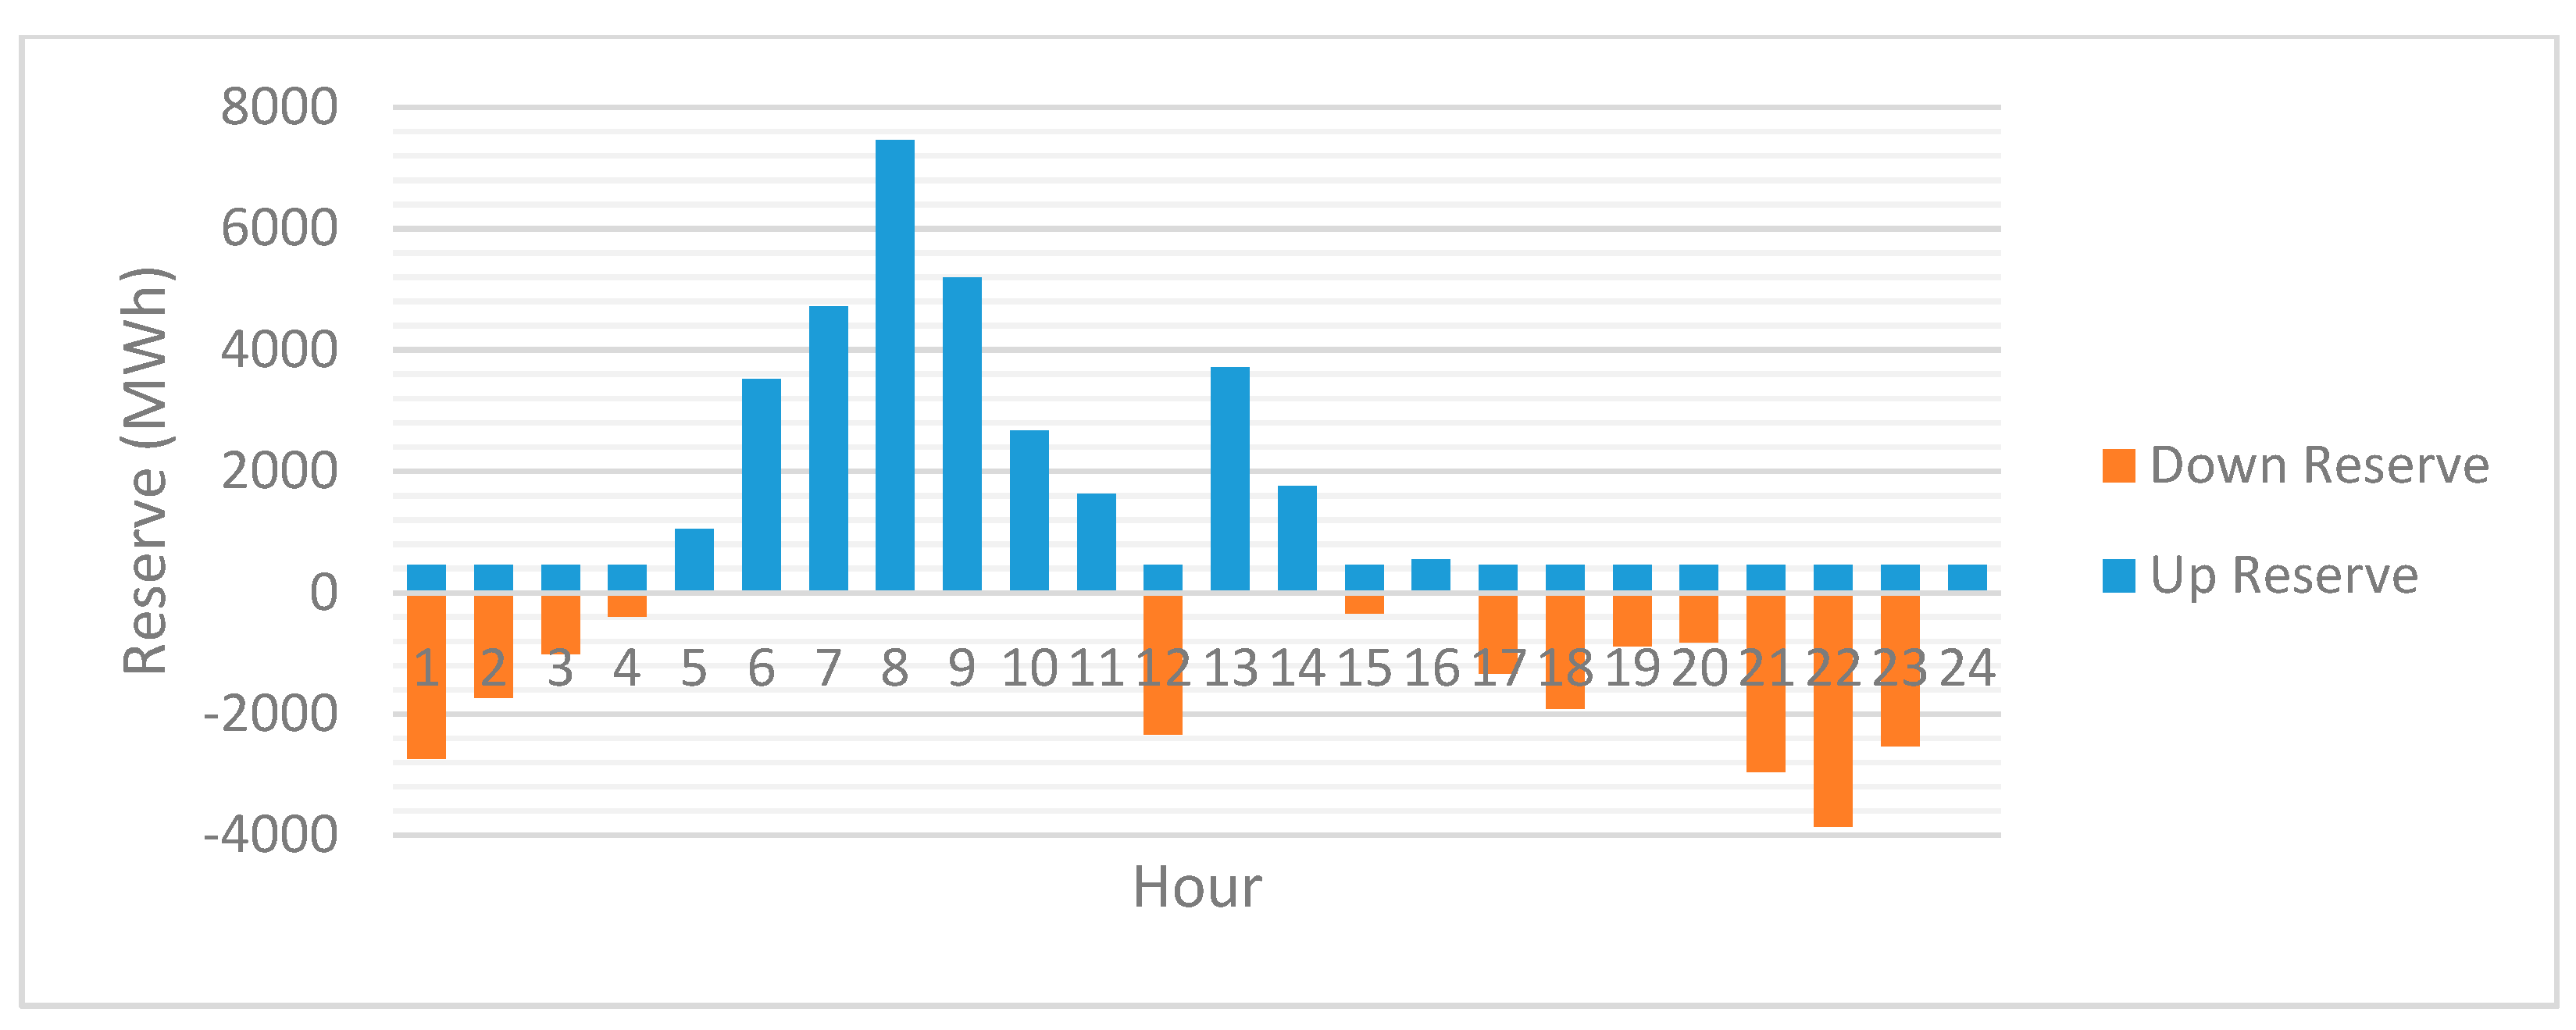
The reserve patterns of Case 1 in
Figure 7 show an increasing load-following up reserve to satisfy the generation variance that increases during the morning (06:00–11:00) with the increased electricity demand, showing high up reserves. However, the generation variance with reduced power demand at night (22:00–03:00) increases the load-following down reserve, showing high down reserve. In other periods, there is a low uncertainty within the power system, given the lack of solar power generation, indicating a comparatively low and stable reserve. Total required reserve is 61,433 MWh/day, and the average hourly required reserve is 2566.7 MW/h. Among the 4000 MW reserve maintained by the Korean power system, the part that meets the characteristics of the hourly reserve is 2500 MW, excluding the 1500 MW for frequency regulation; the average reserve computed is consistent with this reserve amount.
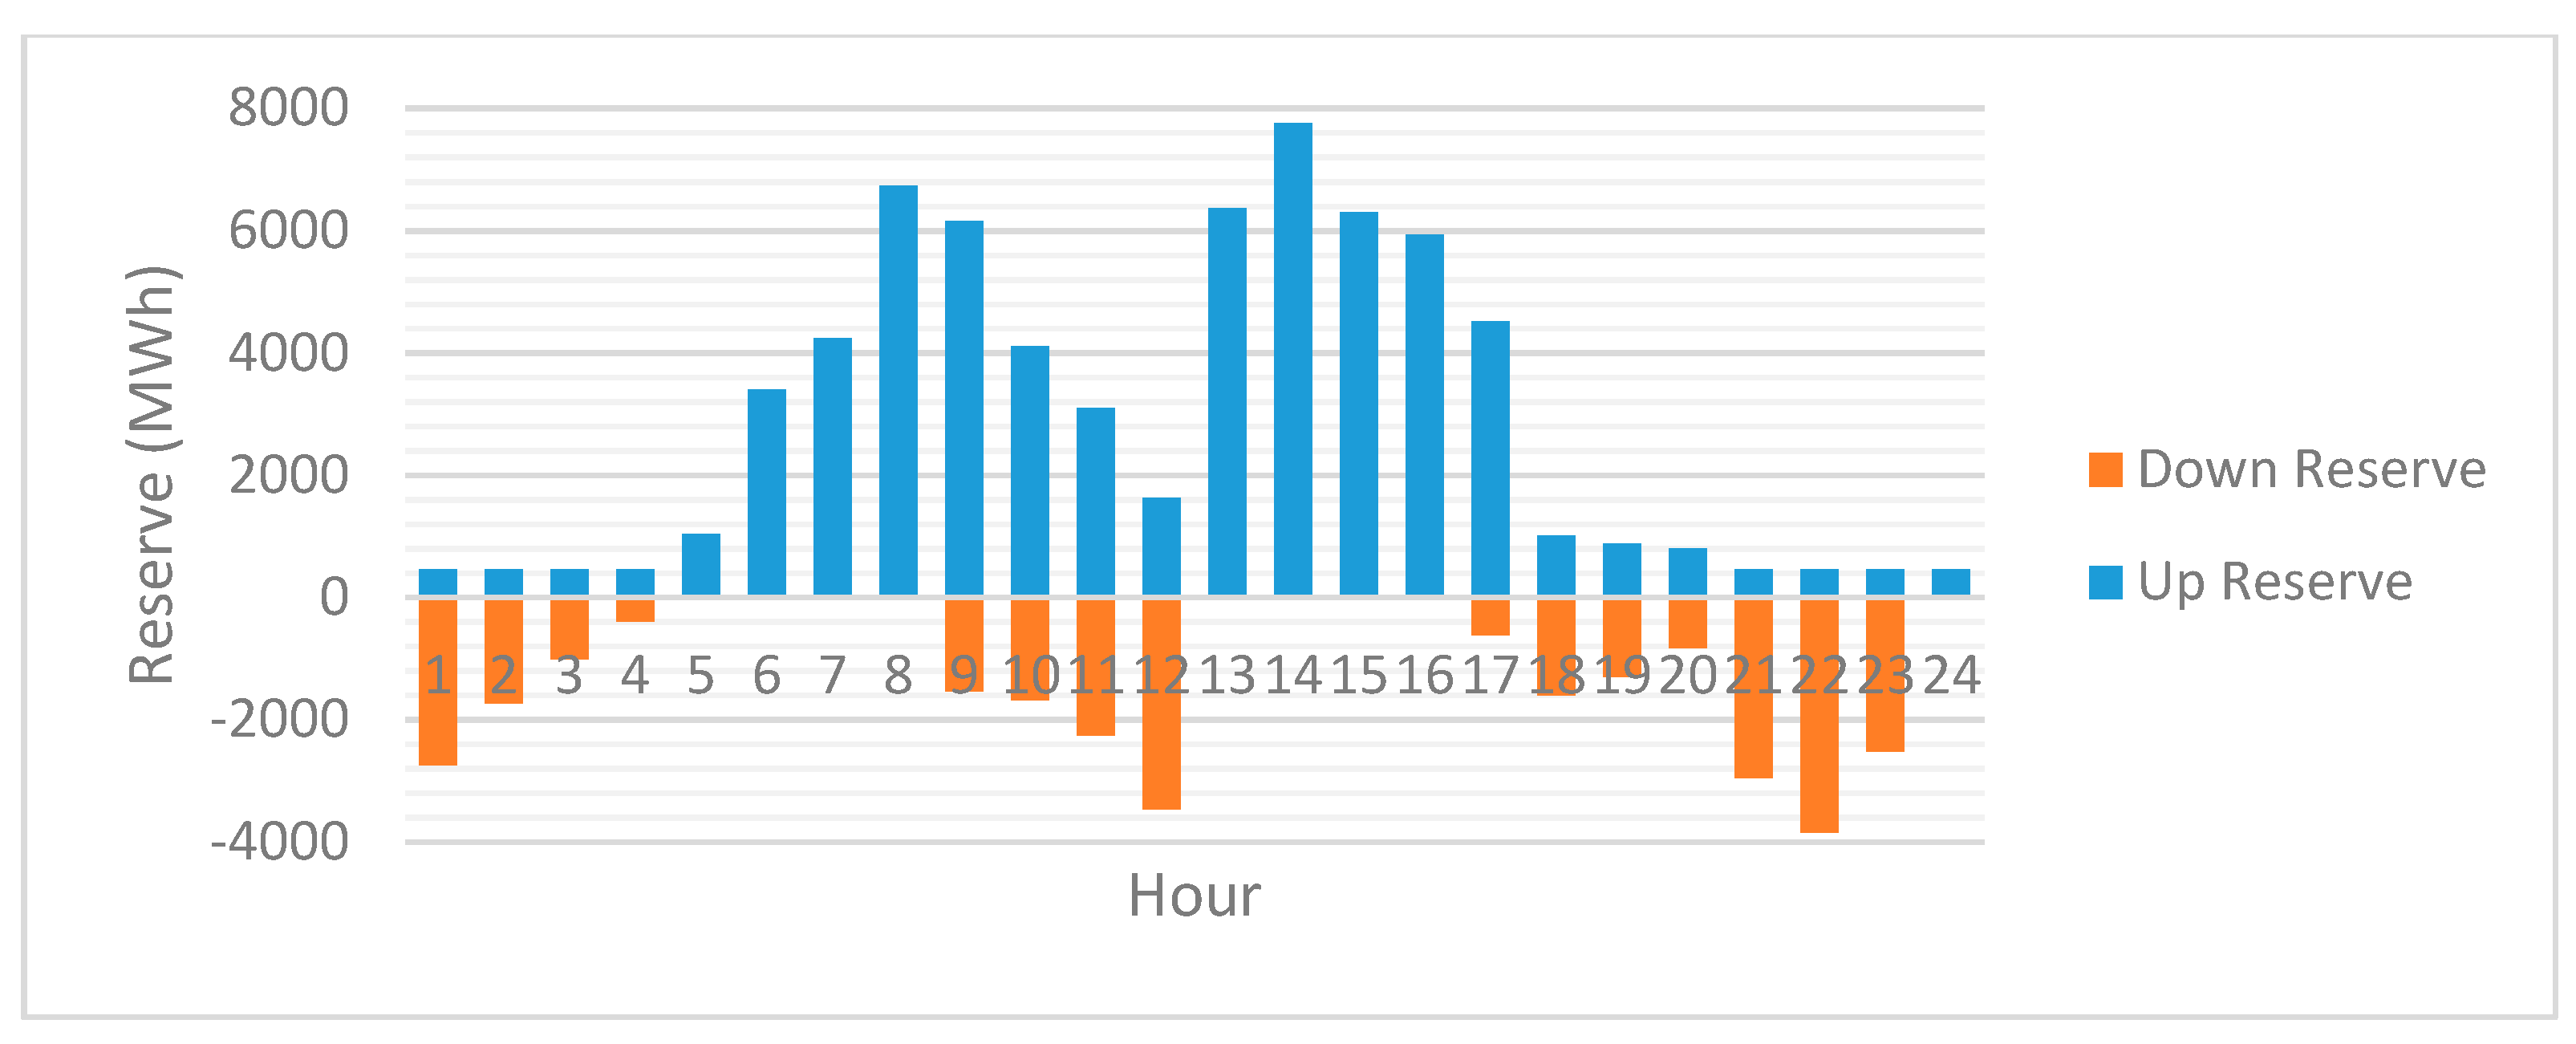
Case 2_2029 in
Figure 8 shows a high reserve to supplement for the uncertainty of solar power generation during late afternoon with concentrated solar power (13:00–17:00). The introduction of solar power led to a 56.2% increase in the required reserve compared to Case 1, with the total required reserve at 96,113 MWh/day, and the average required reserve at 4009.5 MW/h, which is much higher than the provided 2500 MW. Moreover, the minimum reserve required with solar power is 466.2 MW, and the maximum reserve required 7756.4 MW, demonstrating a large difference in required reserve by time.
This indicates that changes in the present reserve system are inevitable, given the large supply of variable renewable energy. Along with increasing the amount of the reserve required to maintain reliability in the power system, there are significant differences in the hourly required reserve. As such, the co-optimization of energy and reserve and calculation of required reserve in hourly levels are required for efficient and flexible operations. This would also require accurate solar or wind generation forecasting because large forecasting error caused by poor forecasting requires more reserve to cover the larger band of uncertainty.
4.4. Analysis of Cost Saving by Solar Generation and Energy Storage
Table 6 shows the operating cost and wholesale cost for customers on a representative summer day. Similar to
Table 3, Case 2_2029 shows that solar generation effectively replaces the expensive peak generation, reducing a large portion of generation cost. However, the uncertainty of solar generation increased the reserve cost by 60%. Introduction of ESS in Case 3_2029 caused arbitrage of expensive peak-time generation with cheap, early morning generation, as well as the adoption of additional solar generation due to reduced uncertainty, which led to even lower generation costs. Moreover, the reduction of solar generation uncertainty by ESS led to a 56% decrease in reserve cost. From the perspective of total operating cost, the introduction of solar generation at 2029 levels led to savings of 5,429,000 USD/day, and the introduction of ESS led to additional savings of 691,000 USD/day.
To estimate the total wholesale cost for customers, it is necessary to calculate the revenue of conventional and solar generation based on locational marginal pricing (LMP), and the system operator (SO) revenue from transmission line congestion. In the “additional revenue for conventional generation” of Case 2_2029, solar generation replaced peak generation, reducing LMP by 10%. On the other hand, Case 3_2029 showed increases in load and LMP because charging volume is higher compared to discharging volume due to ESS inefficiency. Moreover, “net revenue for SO” was found to significantly increase in Case 2_2029 because large solar generation made transmission line congestion more severe. The results indicated that “total wholesale cost” decreased, but by a smaller amount than the reduction range of operating cost, in Case 2_2029 and Case 3_2029, versus Case 1.
Table 7 shows the annual operating cost of the power system. Case 2_2029 shows a reduction of 1417 million USD/year in generation costs, but an 88 million USD/year increase in reserve costs due to the uncertainty of solar generation. Therefore, the total operating cost had a net decrease of 1329 million USD/year from 16,565 MW of solar power.
Case 3_2029 showed additional decreases of 106 million USD/year and 129 million USD/year in generation and reserve costs, respectively, due to arbitrage benefit and uncertainty reduction by ESS. This resulted in total operating cost reductions from ESS of approximately 235 million USD/year.
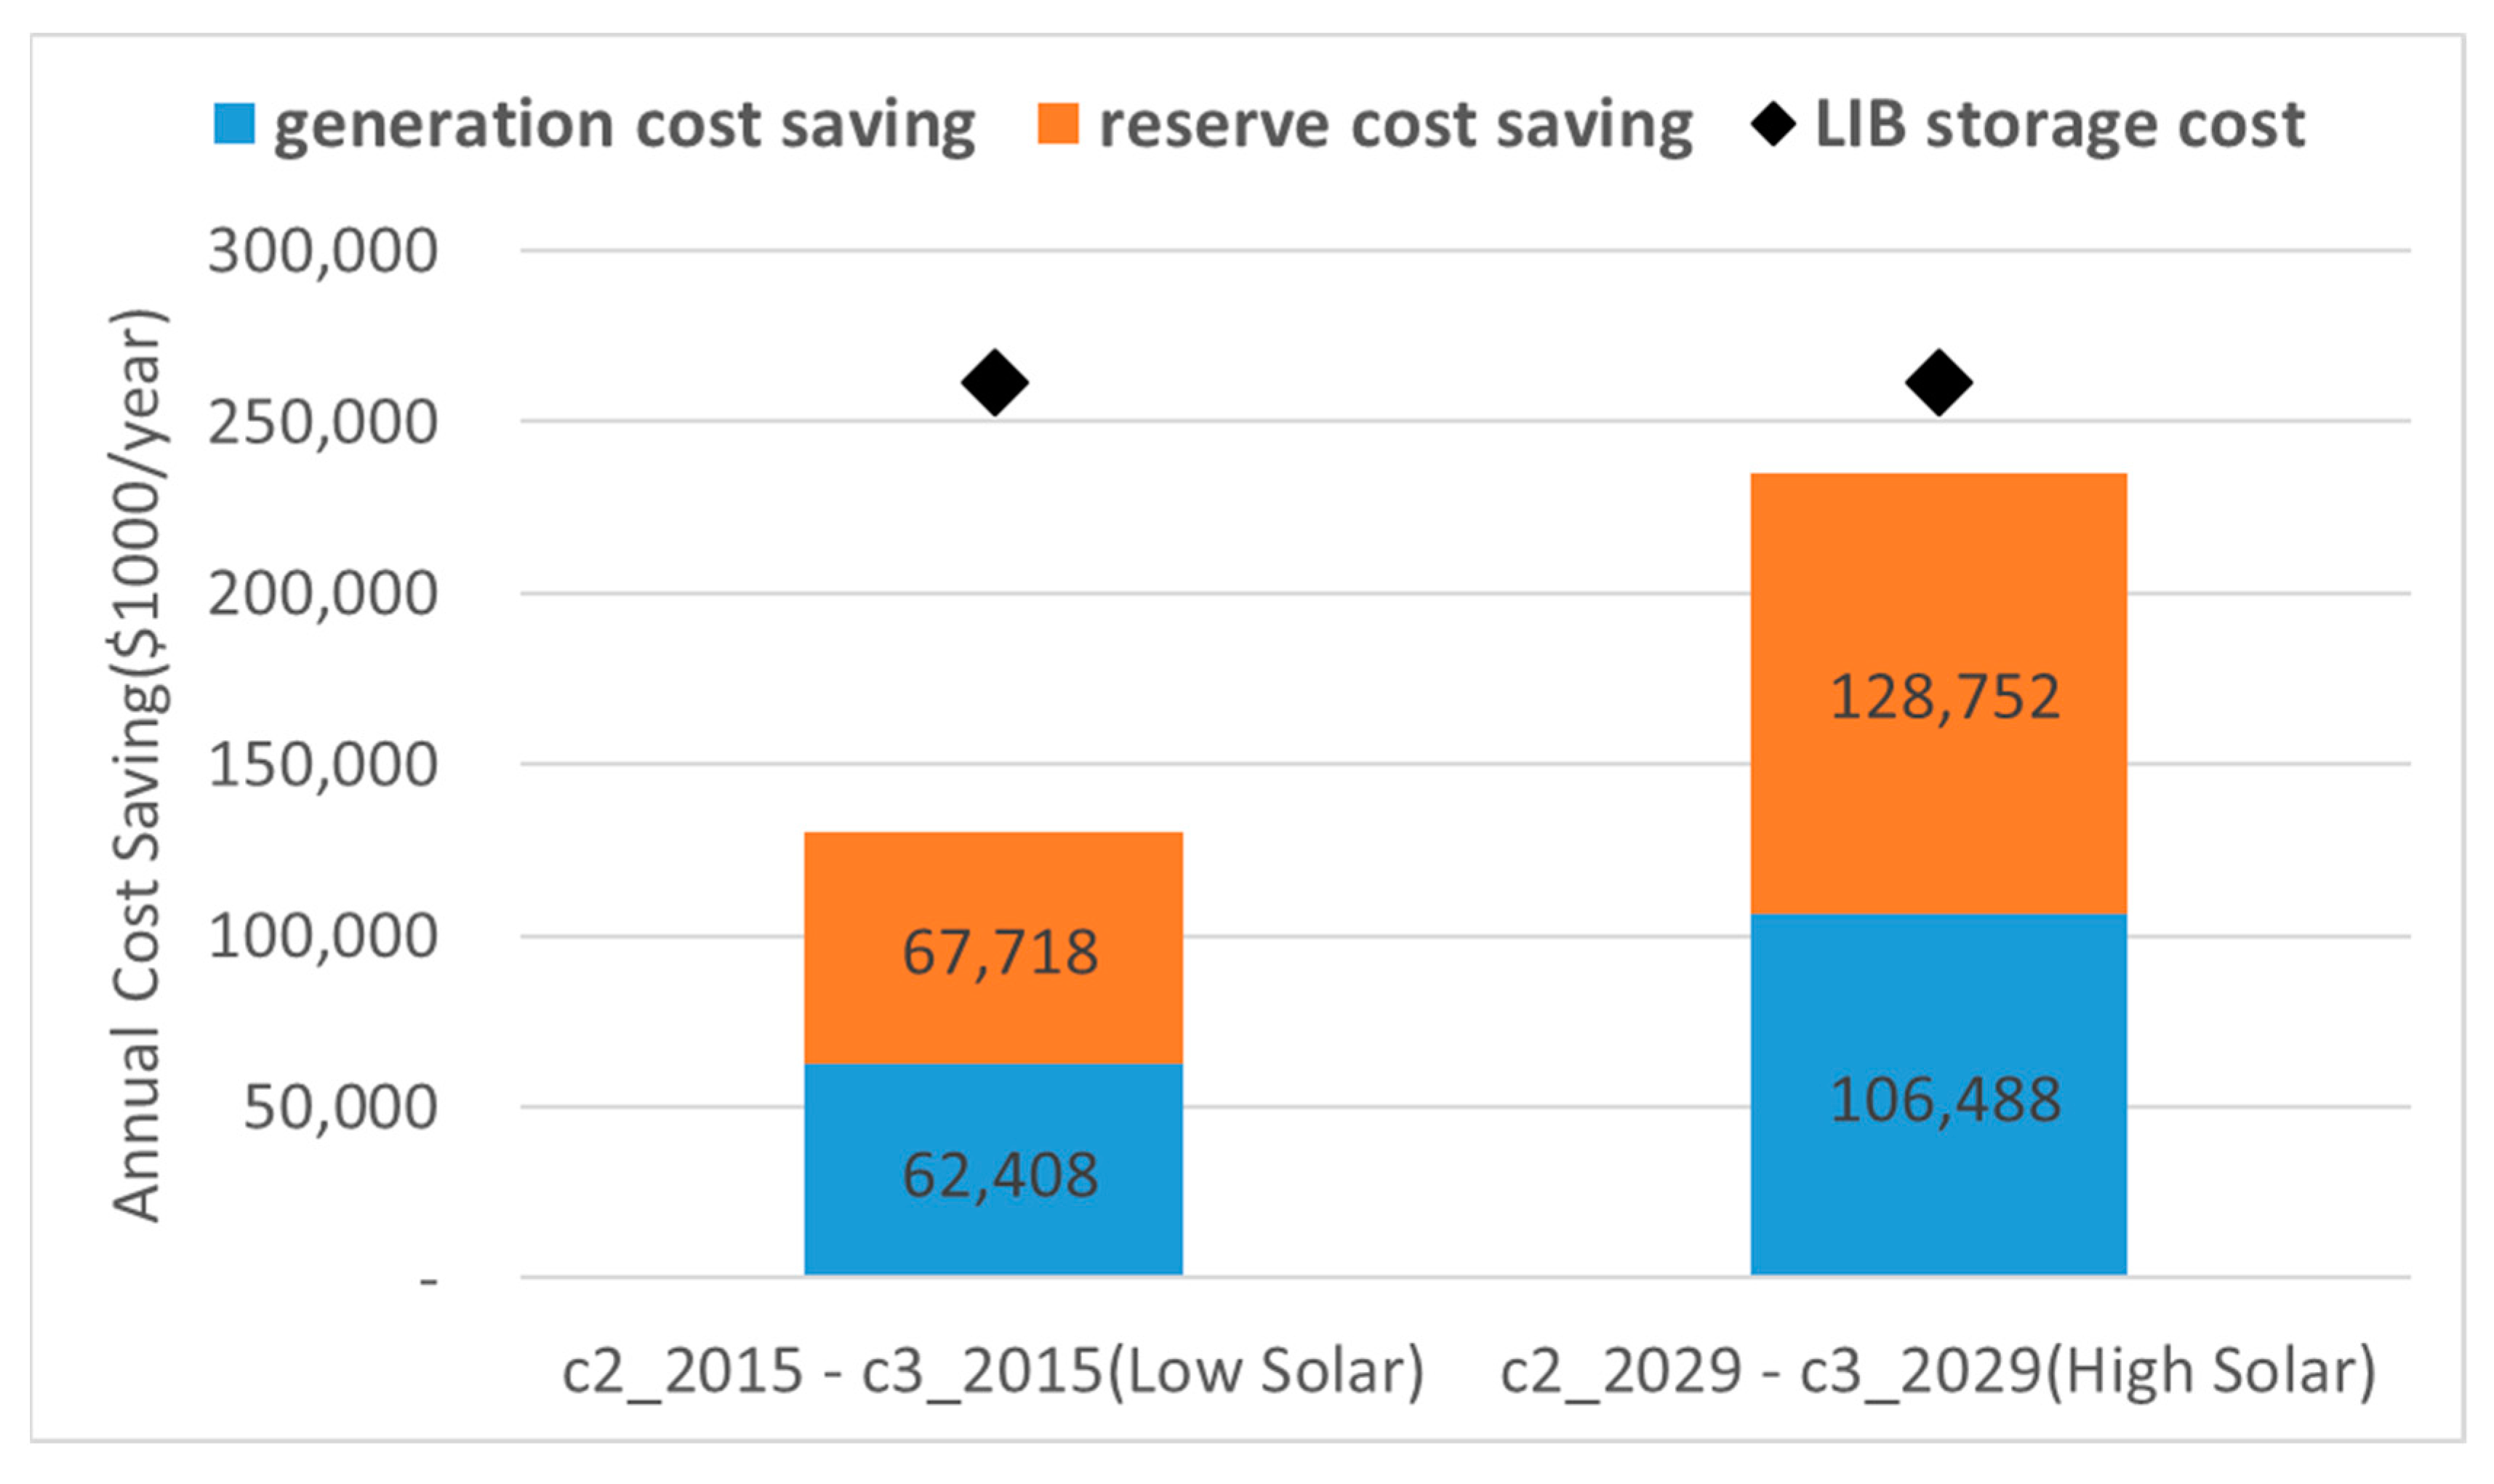
Figure 10 shows the level of ESS contribution to the annual system operating cost reduction in each of the low- and high-solar scenarios. In the case of low solar power scenario, the generation cost and reserve cost savings were 62 million USD/year and 68 million USD/year, respectively, resulting in a total yearly system operating cost reduction of 130 million USD/year from 10 GWh storage. On the other hand, in the case of high solar generation, 106 million USD/year were saved from generation costs and 129 million USD/year were saved from reserve costs, resulting in a total economic benefit of 235 million USD/year.
The reasons why ESS coupled with high solar power brings more economic benefits are (1) the adoption of additional solar generation by reducing uncertainty, resulting in additional energy cost savings, and (2) high uncertainty of high solar generation results in high reserve costs. ESS effectively mitigated this uncertainty, leading to effective reserve cost savings. In other words, the economic value of ESS increases as the capacity of variable renewable sources with uncertainty increases because ESS is very effective in solving problems caused by them.
The black diamond in
Figure 10 shows an annualized capital cost of 261.7 million USD/year for a 10 GWh LIB energy storage system as of December 2016 [
26,
27,
28] which is computed based on the assumption of 338.25 USD/kWh LIB cell price, 56 USD/kW power control system (PCS) cost, 10% site construction cost of total capital cost, and 15 years life cycle. The analysis results indicate that the present low-solar environment results in storage benefit at 49.7% of the cost. However, in high-solar environments, the storage benefit increases to 89.9% of the costs, closely approaching economic validity. This study limited the scenarios to coupling solar generation and energy storage. The simultaneous supply of wind generation, with higher variability than solar generation, exposes the power system to higher uncertainty. As such, the cost-saving effects of the energy storage could be larger, as it is effective in reducing variability.
Moreover, this study set the offer price of the operating reserve based on the low compensation level in Korea, at 3 USD/MW. However, given cases where the U.S. New York Independent System Operator market reserve offer price reaches levels beyond 10 USD/MW, the reserve offer price in Korea does not properly reflect the opportunity costs of providing reserve capacity, so it is under-evaluated. Applying the correct reserve price to the model would lead to higher reserve cost-saving effects of the energy storage that provides reserve service, which would raise the benefits of the storage.
Moreover, the Korean electricity markets have a renewable portfolio standard (RPS) that promotes the use of renewable energy, where discharging during peak hours using storage coupled with renewable energy is paid 5.5 REC (renewable energy certificate) per MWh. The market price of 1 REC is 156.7 USD/REC as of December 2017. As such, storages can obtain significant levels of additional benefits under the current RPS regime. Considering these factors, it could be concluded that the cost validity for LIB energy storage is in place under a power system with high penetration of renewable generation.
5. Conclusions
To achieve the agreed levels of 37% reduction in greenhouse gases compared to business as usual (BAU) by 2030 under the Paris Agreement, Korea must embark on major changes to its generation mix. For Korea, the change to a low-carbon generation mix will be spearheaded by renewable generation. As another alternative to reducing greenhouse gases, the acceptance of nuclear power generation is fragile due to its potential risks since the Fukushima incident. The core contribution of this study is the construction of the Korean power system model using the MPSOPF methodology, which allows for stochastic renewable generation processing using expansive Korean power system data, thus reflecting the high variability and uncertainty of variable renewable generation to comprehensively analyze the impact of solar generation on the Korean power system. Moreover, this study also analyzed the level of the ESS contribution when coupled with solar power generation by analyzing the cost savings that ESS can achieve in the power system. To enable this analysis, the study constructed the solar radiation estimation model for each major solar farm in Korea and analyzed the forecasting errors for the upcoming 24 h in forecasting the use of solar power from the perspective of the system operator.
The introduction of 2029-level solar power leads to a 56.2% increase in required reserve versus the scenario of no solar generation. The average required hourly reserve is 4009.5 MW/hour, and the maximum hourly required reserve is 7756.3 MW, and the minimum is 466.2 MW. On the other hand, the introduction of 10 GWh of LIB energy storage would decrease the required reserve by 61%, with the average hourly required reserve at 1561.9 MW/hour, and the maximum and minimum hourly reserves at 5278.2 MW and 0.3 MW, respectively. This indicates that storage is effective in reducing the variability of solar generation and, thus, reduces the required reserve. Moreover, the present operating reserve of 2500 MW maintained by the Korean power system requires a large-scale increase if solar energy at 2029 levels were to be implemented. Moreover, given the large differences in hourly reserves, it is important to flexibly calculate the number of reserves needed in each time step instead of a fixed amount.
Analysis of the annual operating cost indicates that solar power at 2029 levels led to a generation cost reduction of 1417 million USD/year, replacing expensive peak generation plants during the day. However, the uncertainty of solar power was harmful to the stability of the power system, resulting in a reserve cost increase of 88 million USD/year. Coupling LIB energy storage with solar generation led to generation cost reductions of 106 million USD/year, and 129 million USD/year in reserve costs. Not only does ESS significantly reduce the reserve costs by effectively reducing solar power instability, but also allows for the additional absorption of spilled solar power, which was previously discarded given the high variability, which leads to reductions in generation costs. Moreover, the benefit from energy storage was 80.8% higher for the 2029-level versus the 2015-level solar power. This is because the issue of stability intensifies as the renewable energy mix becomes larger, and the cost-saving effects of ESS become more pronounced.
In the high-solar scenario, the ESS benefit was found to be 89.9% of its capital costs. While ESS coupled with solar generation does not have solid economic validity, it is expected ESS will secure economic validity and become a key player in the power system, given that (1) continuous increases in solar and wind power increase the benefits associated with ESS; (2) the Korean reserve offer price is under-evaluated because it does not reflect true opportunity costs in providing the service—when this price is corrected, it would increase the reserve cost-saving effects of ESS; and (3) additional monetary incentives are present by providing high RECs under the Renewable Portfolio Standard of Korea.
With an increasing supply of renewable energy, discussions on how to effectively manage the reliability of a power system with high variable renewable energies that will continue to increase is a must. There are two key discussion points: (1) Establishing a system that computes the number of reserves needed at each hour based on levels of uncertainty and variability and (2) correcting the current reserve offer price to a realistic level from an economic perspective by comprehensively considering the opportunity costs of reserves. For efficient operation of power systems with high levels of renewable sources, a flexible and effective reserve management system is required, followed by a recalculation of reserve offer prices based on its opportunity costs and aligned with market logic. When logical standards are set for the amount and offer price of the reserve that is a key component of power system reliability, a proper cost–benefit analysis on the advantages (reducing generation costs, replacing fossil fuels, reducing greenhouse gases) and disadvantages (harming the reliability of the power system, rising reserve cost) of variable renewable energy will be possible.
However, this study has only considered ESS as a method to secure reliability, while other such methods (e.g., small-scale gas-fired generation or demand response) also exist. Therefore, for a more comprehensive analysis of Korean generation systems, it would be important to expand this study by considering methods other than ESS and comparing advantages between methods.


