Are Renewables as Friendly to Humans as to the Environment?: A Social Life Cycle Assessment of Renewable Electricity

 ,
,
Abstract
:
1. Introduction
2. Methods
2.1. Goal and Scope
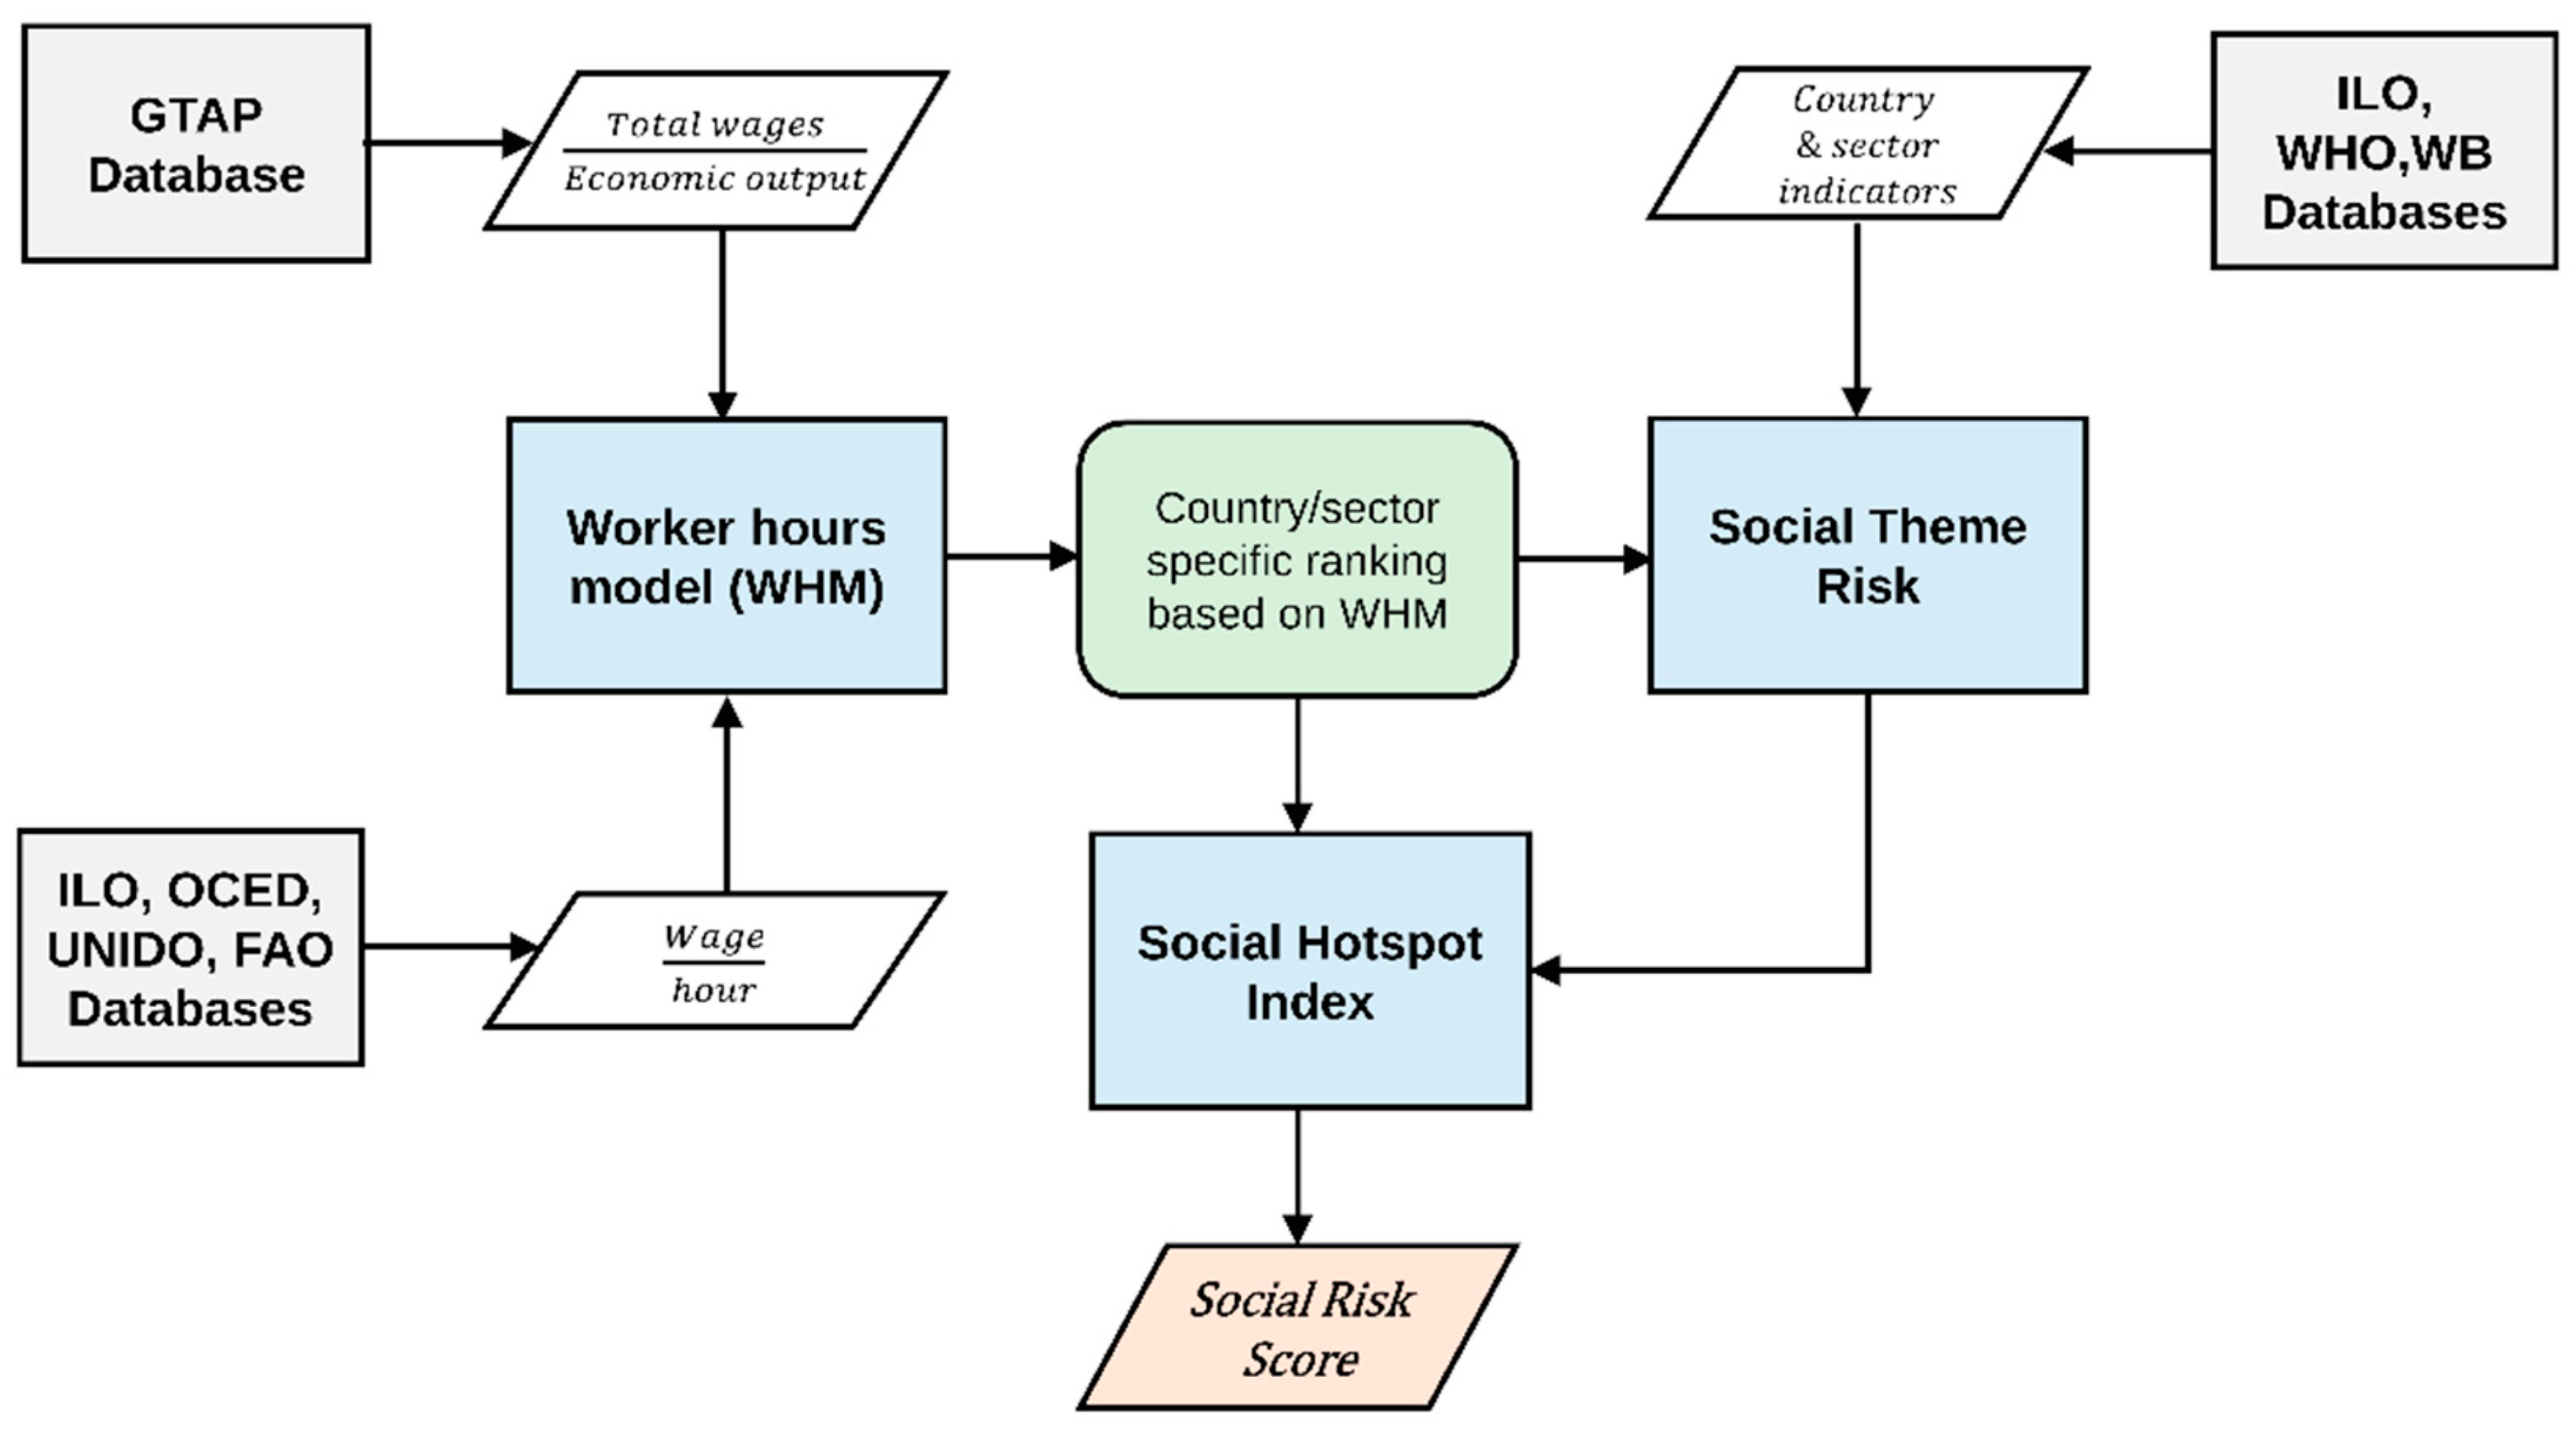
2.2. Social Life Cycle Assessment
2.3. Social Hotspots Database
2.4. Impact Assessment Method
2.5. Data Collection
2.6. Product Modeling
3. Results
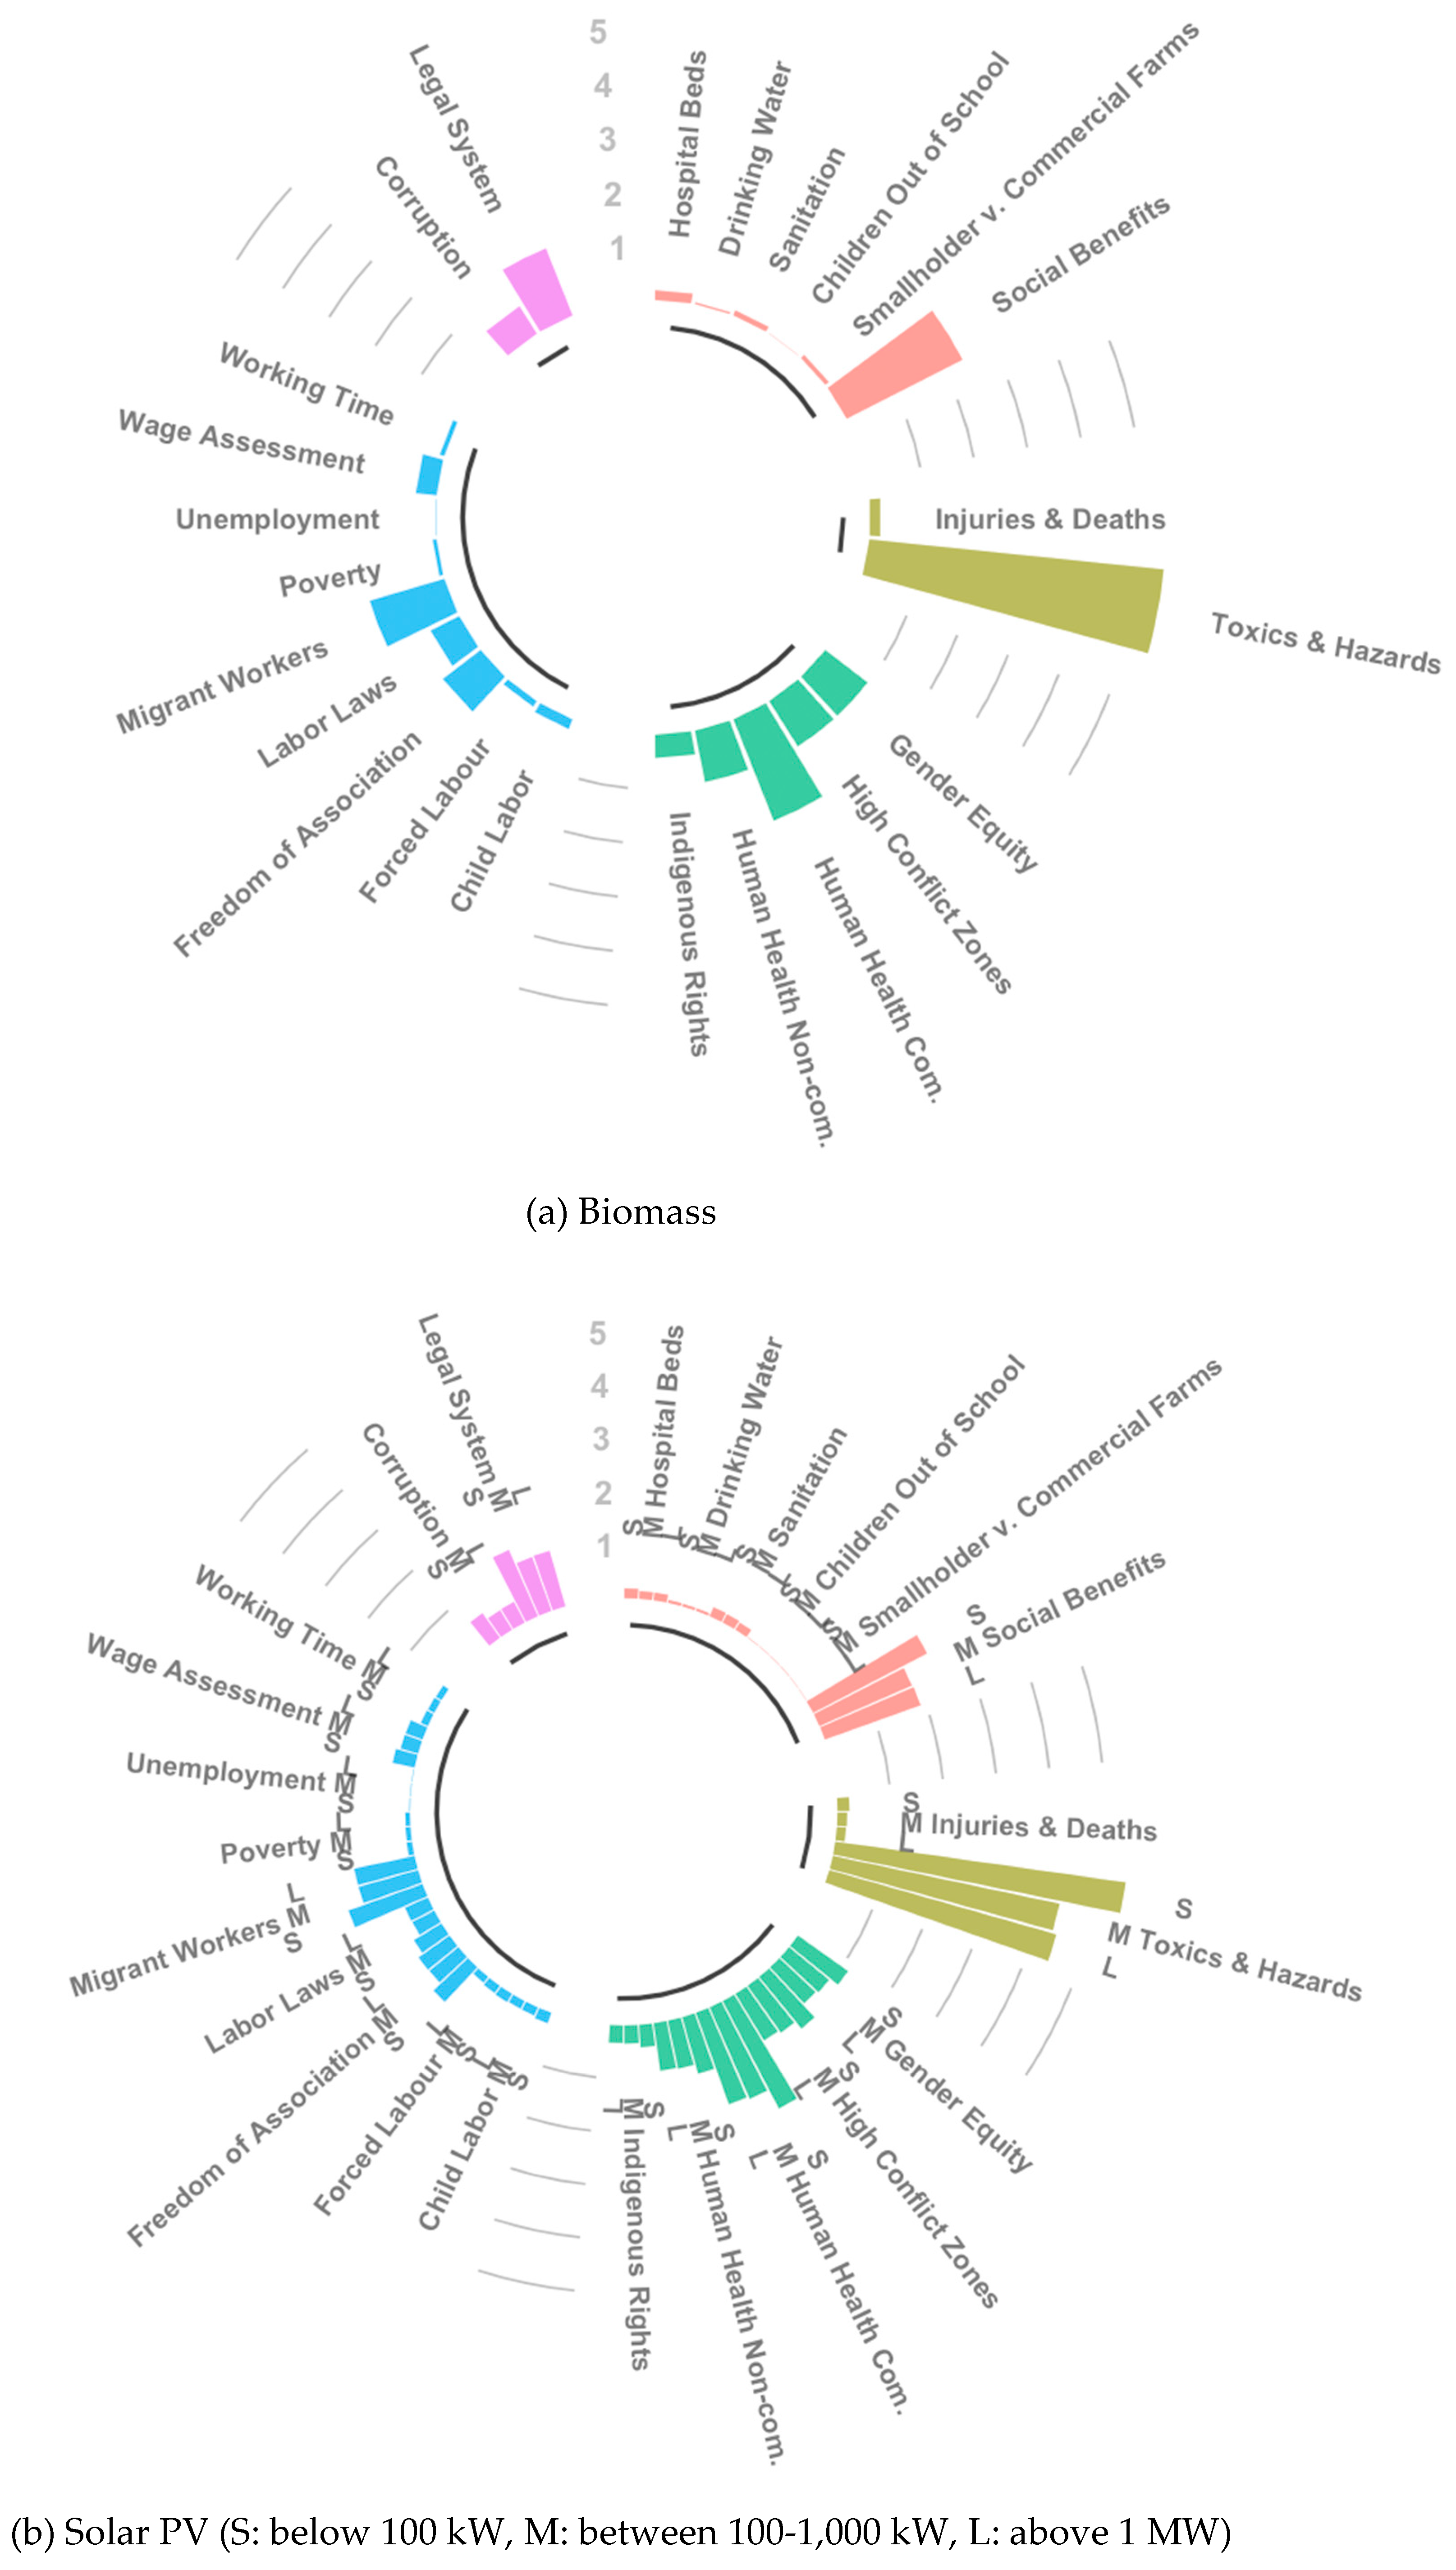
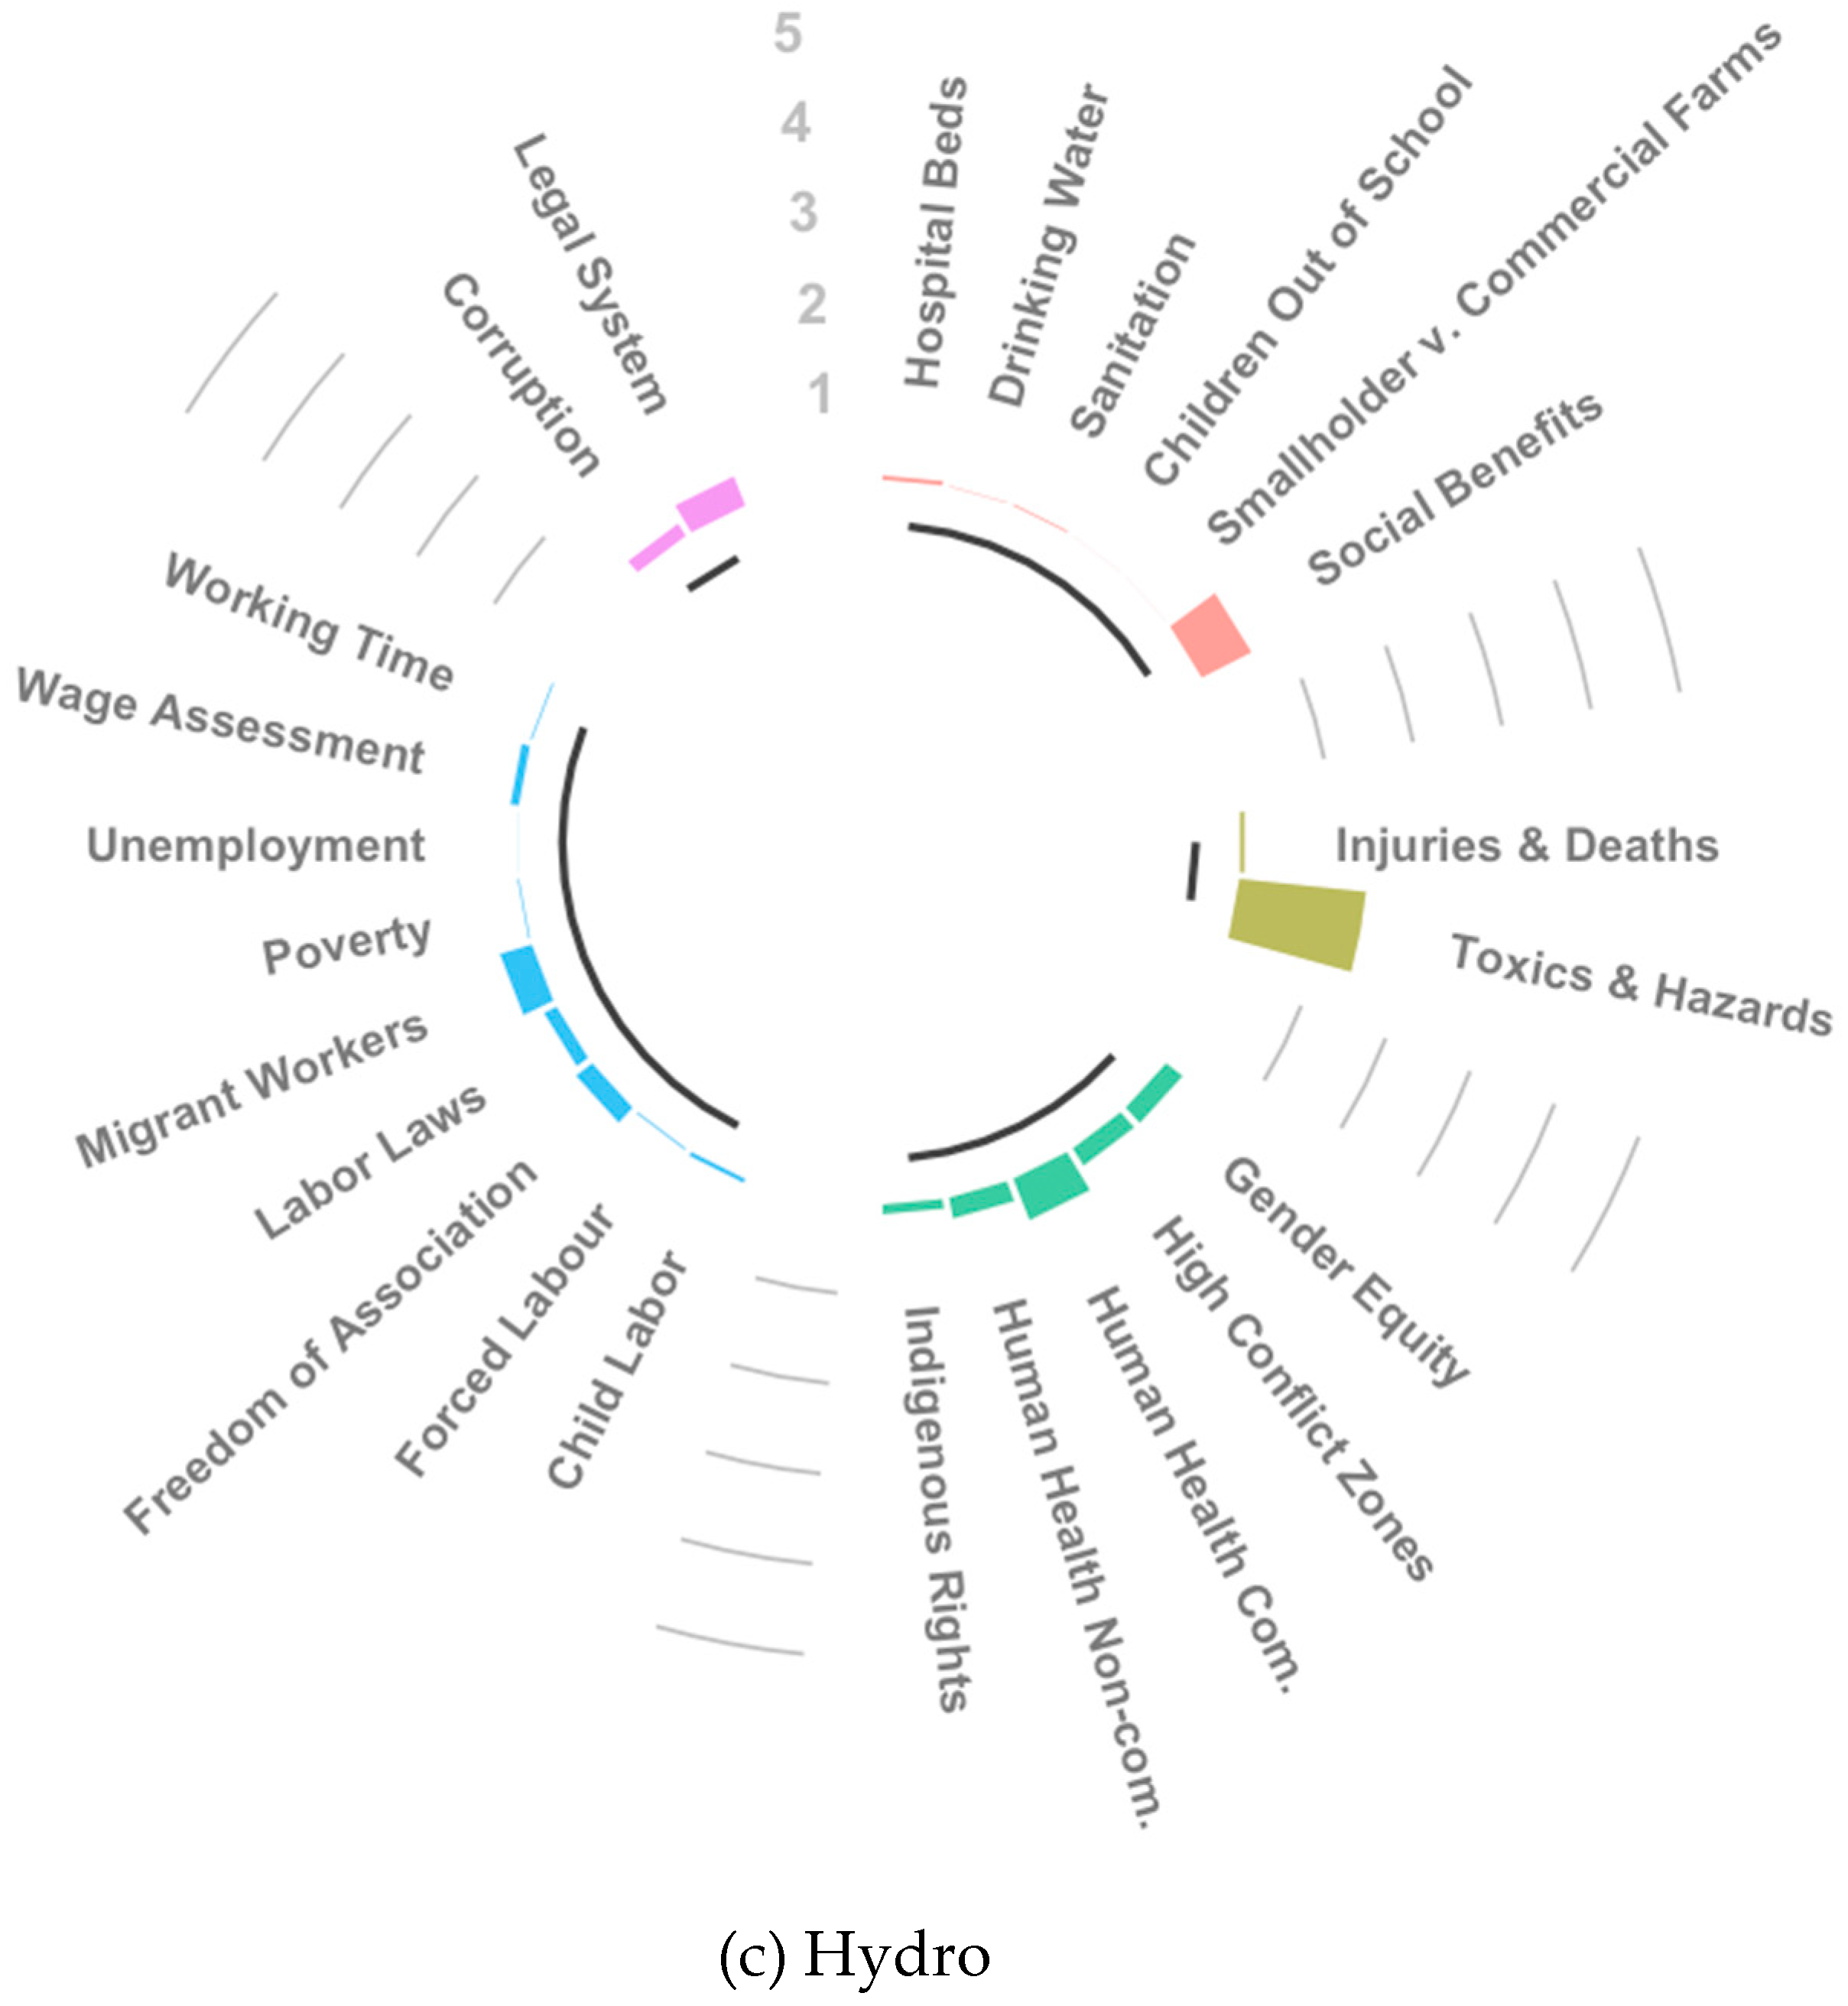
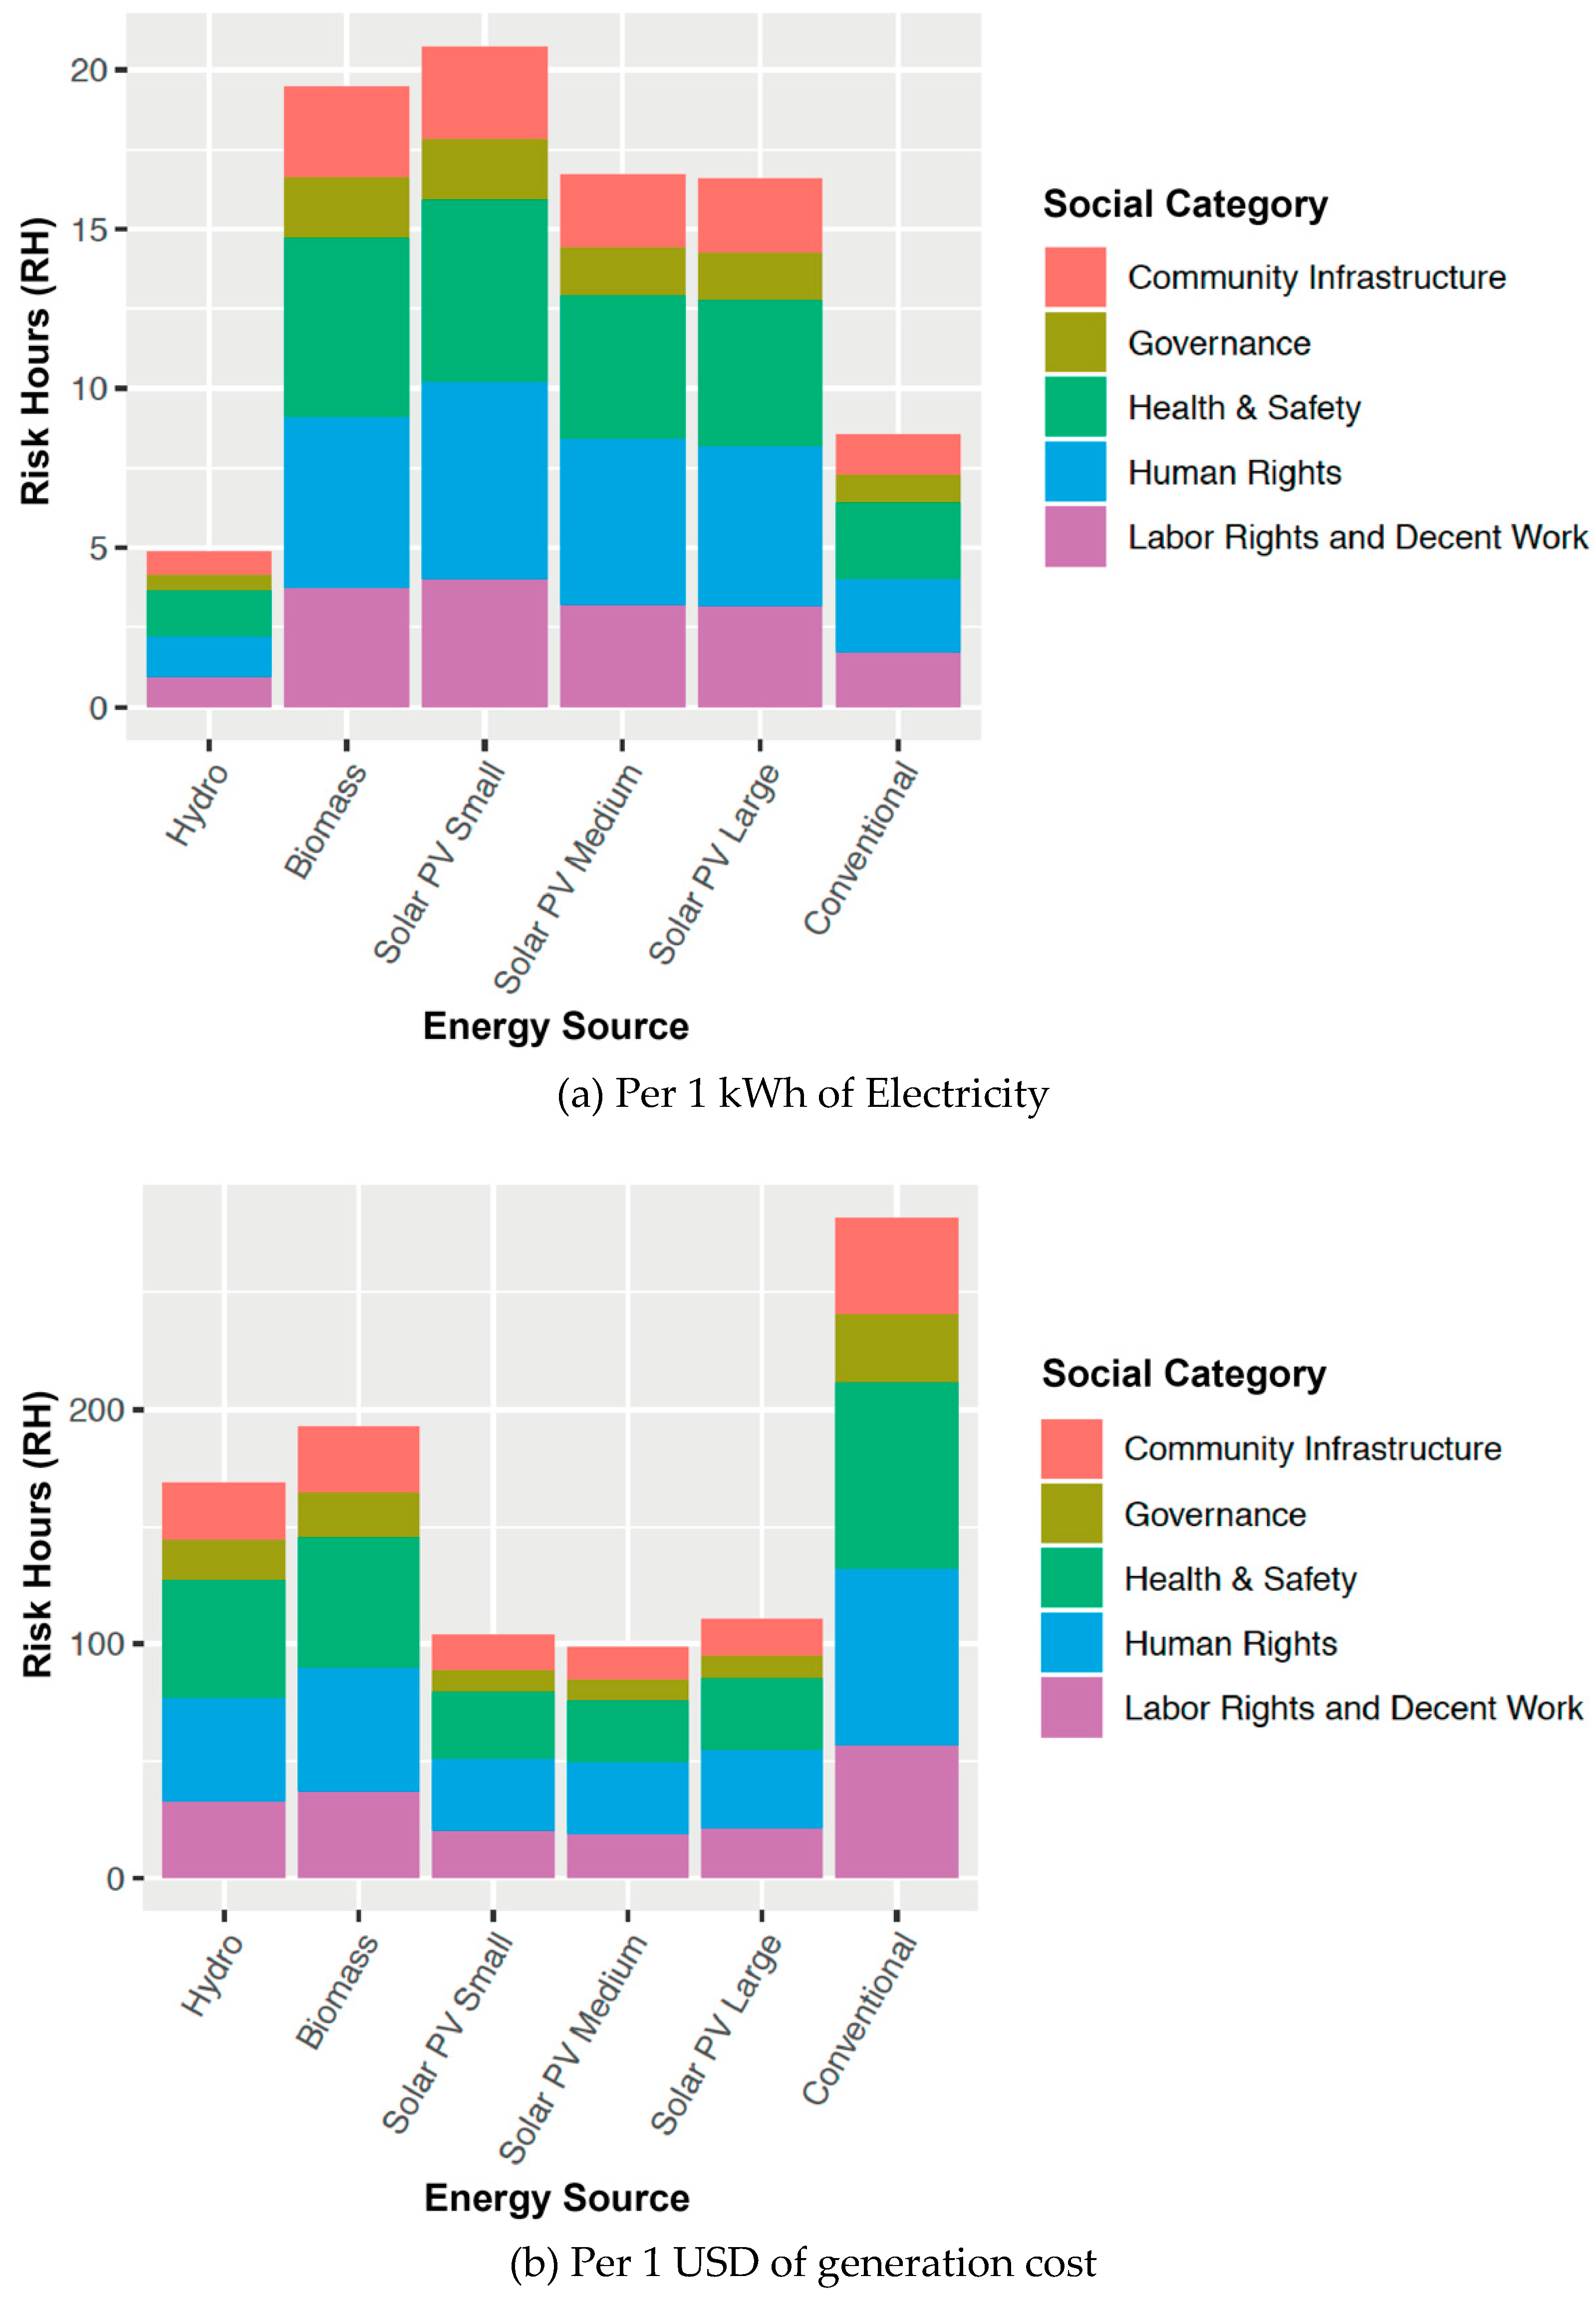
3.1. Social Life Cycle Impact Assessment
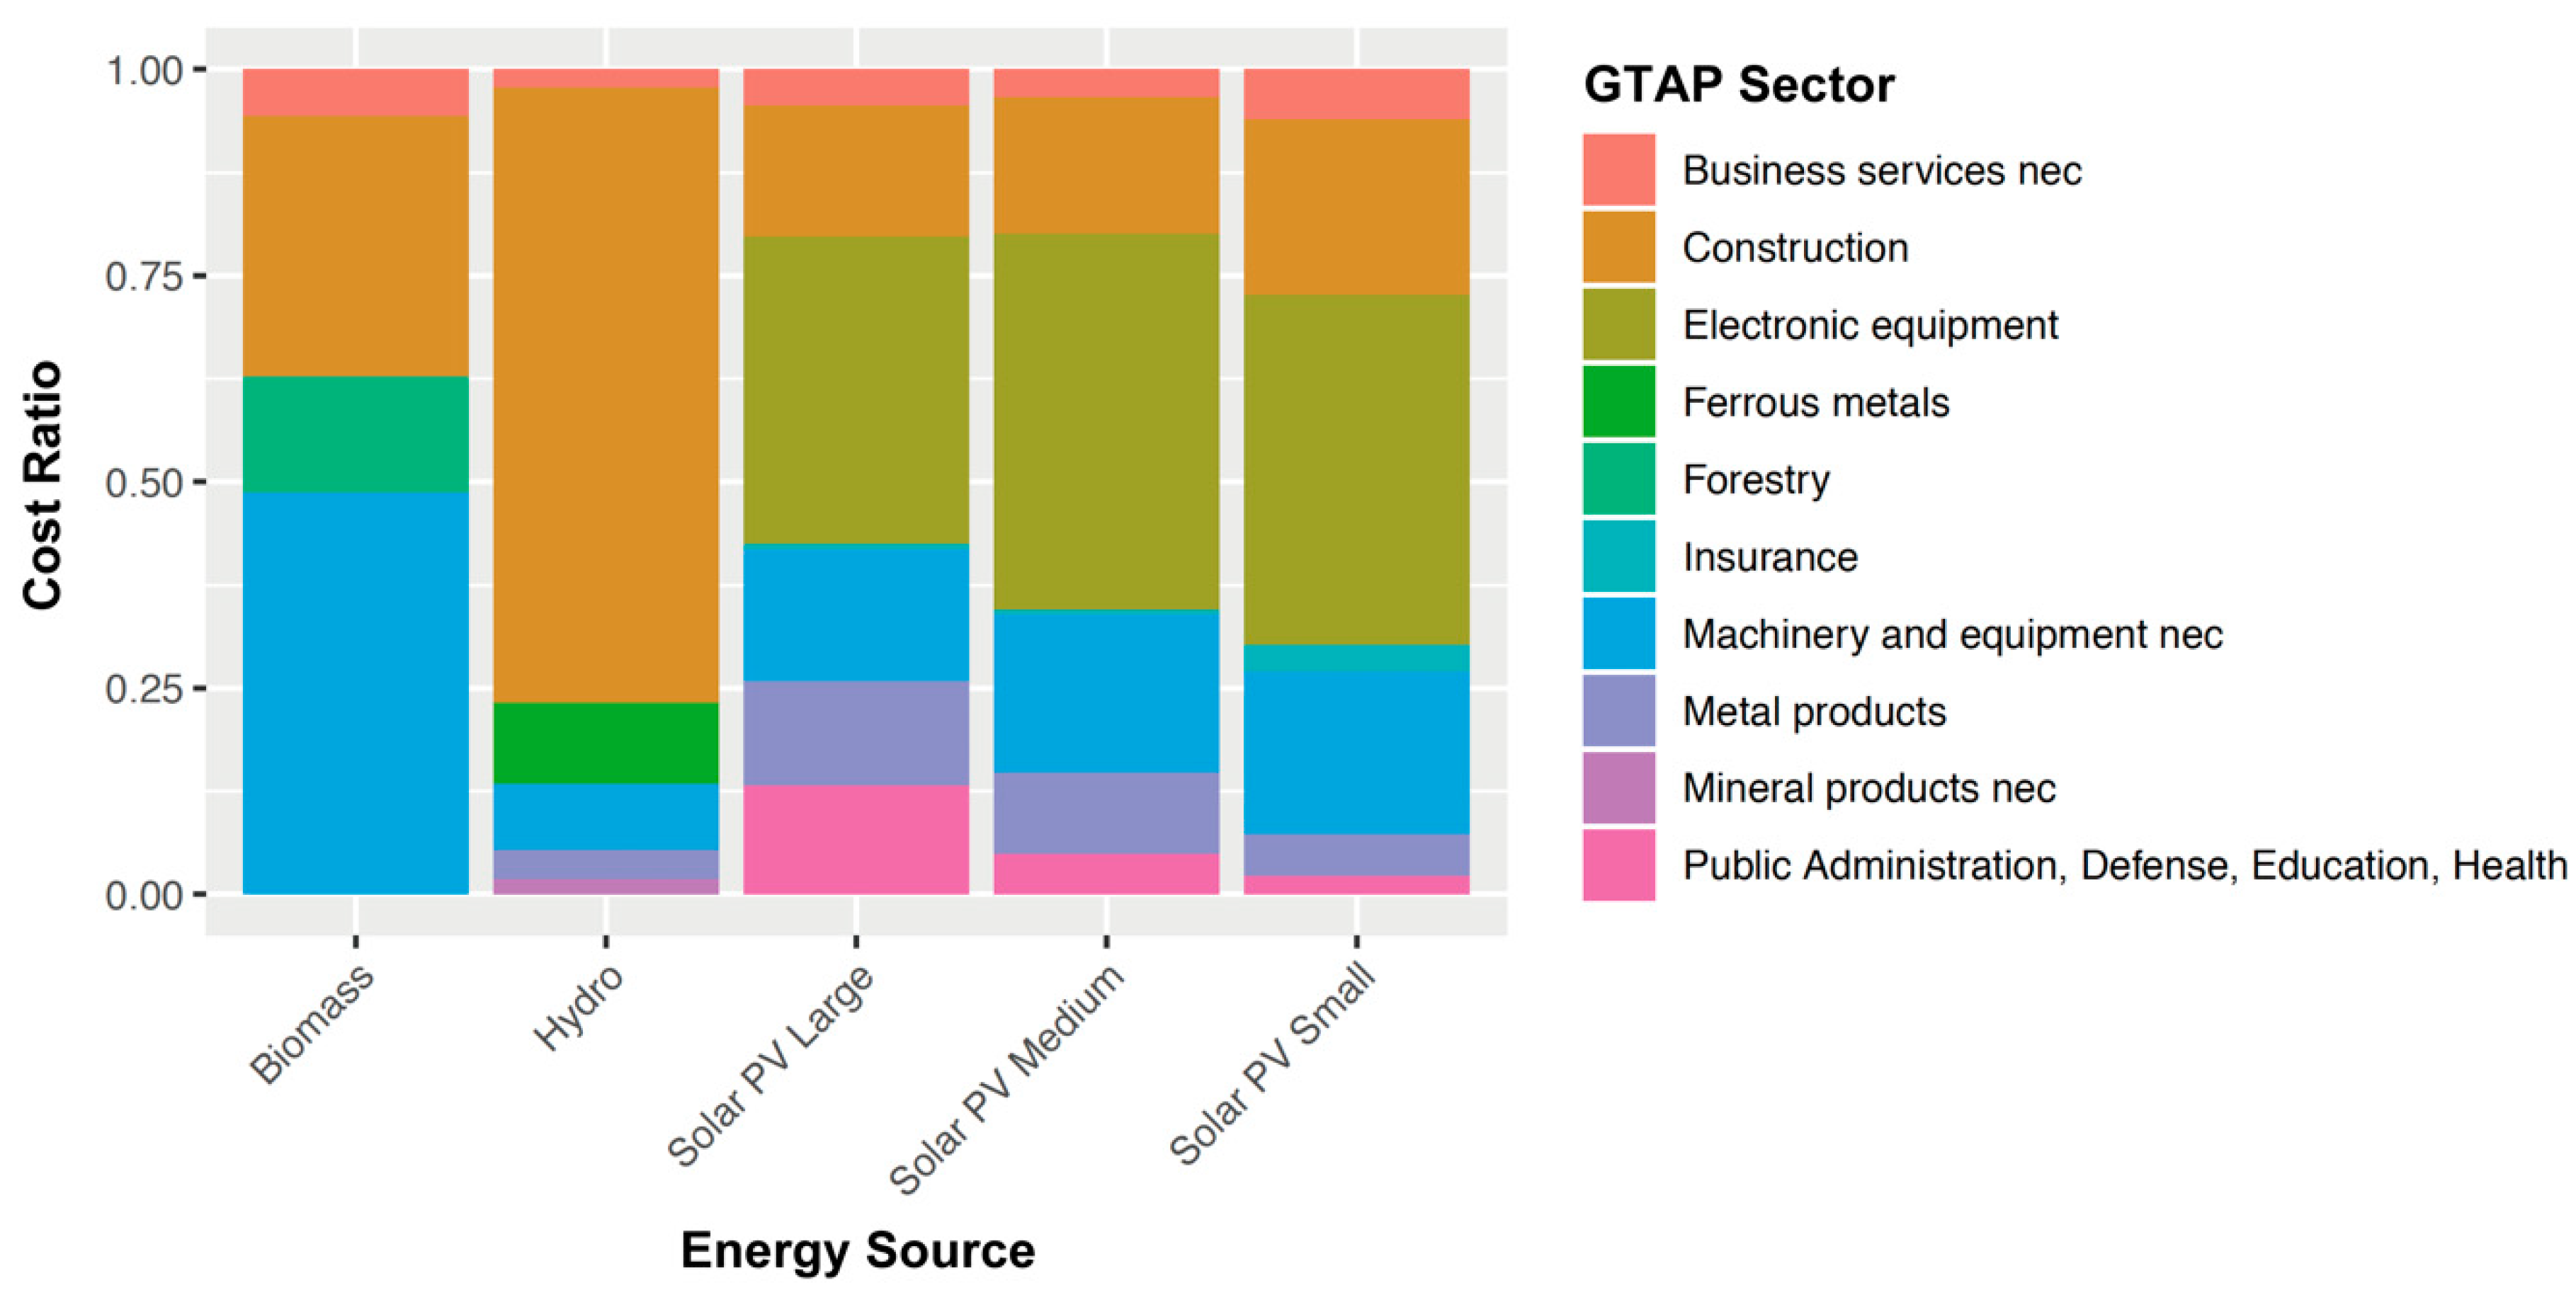
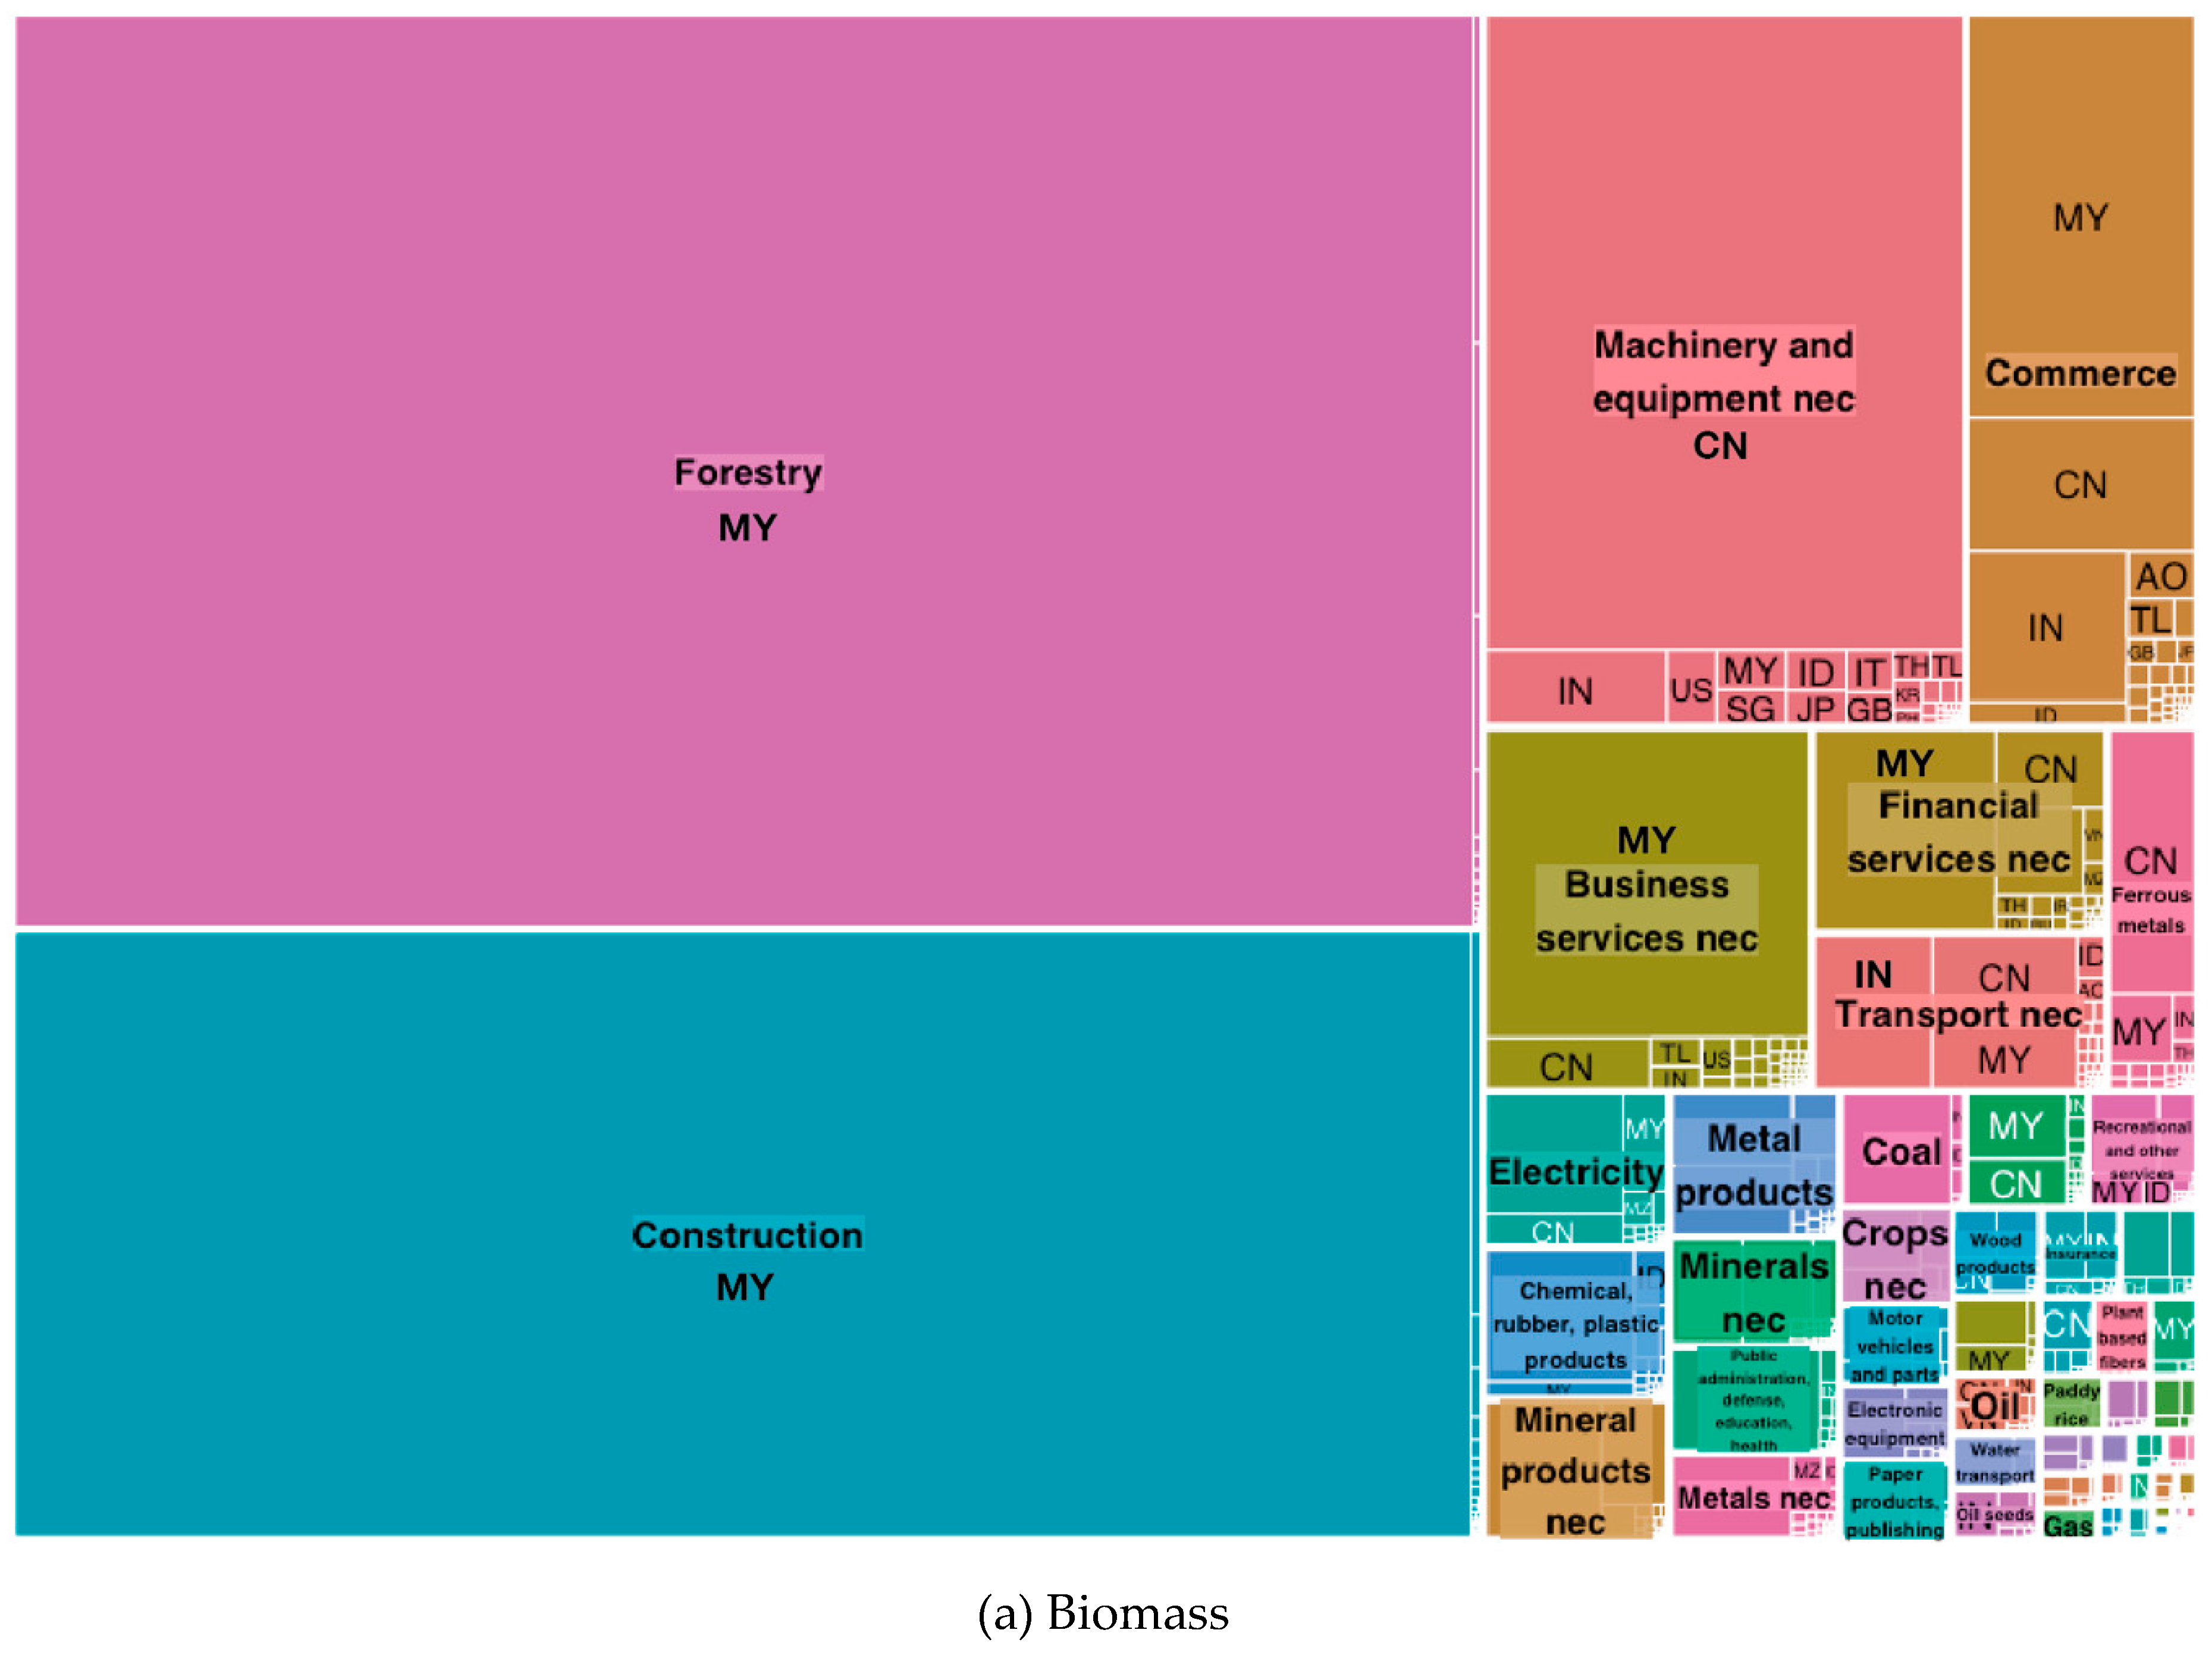
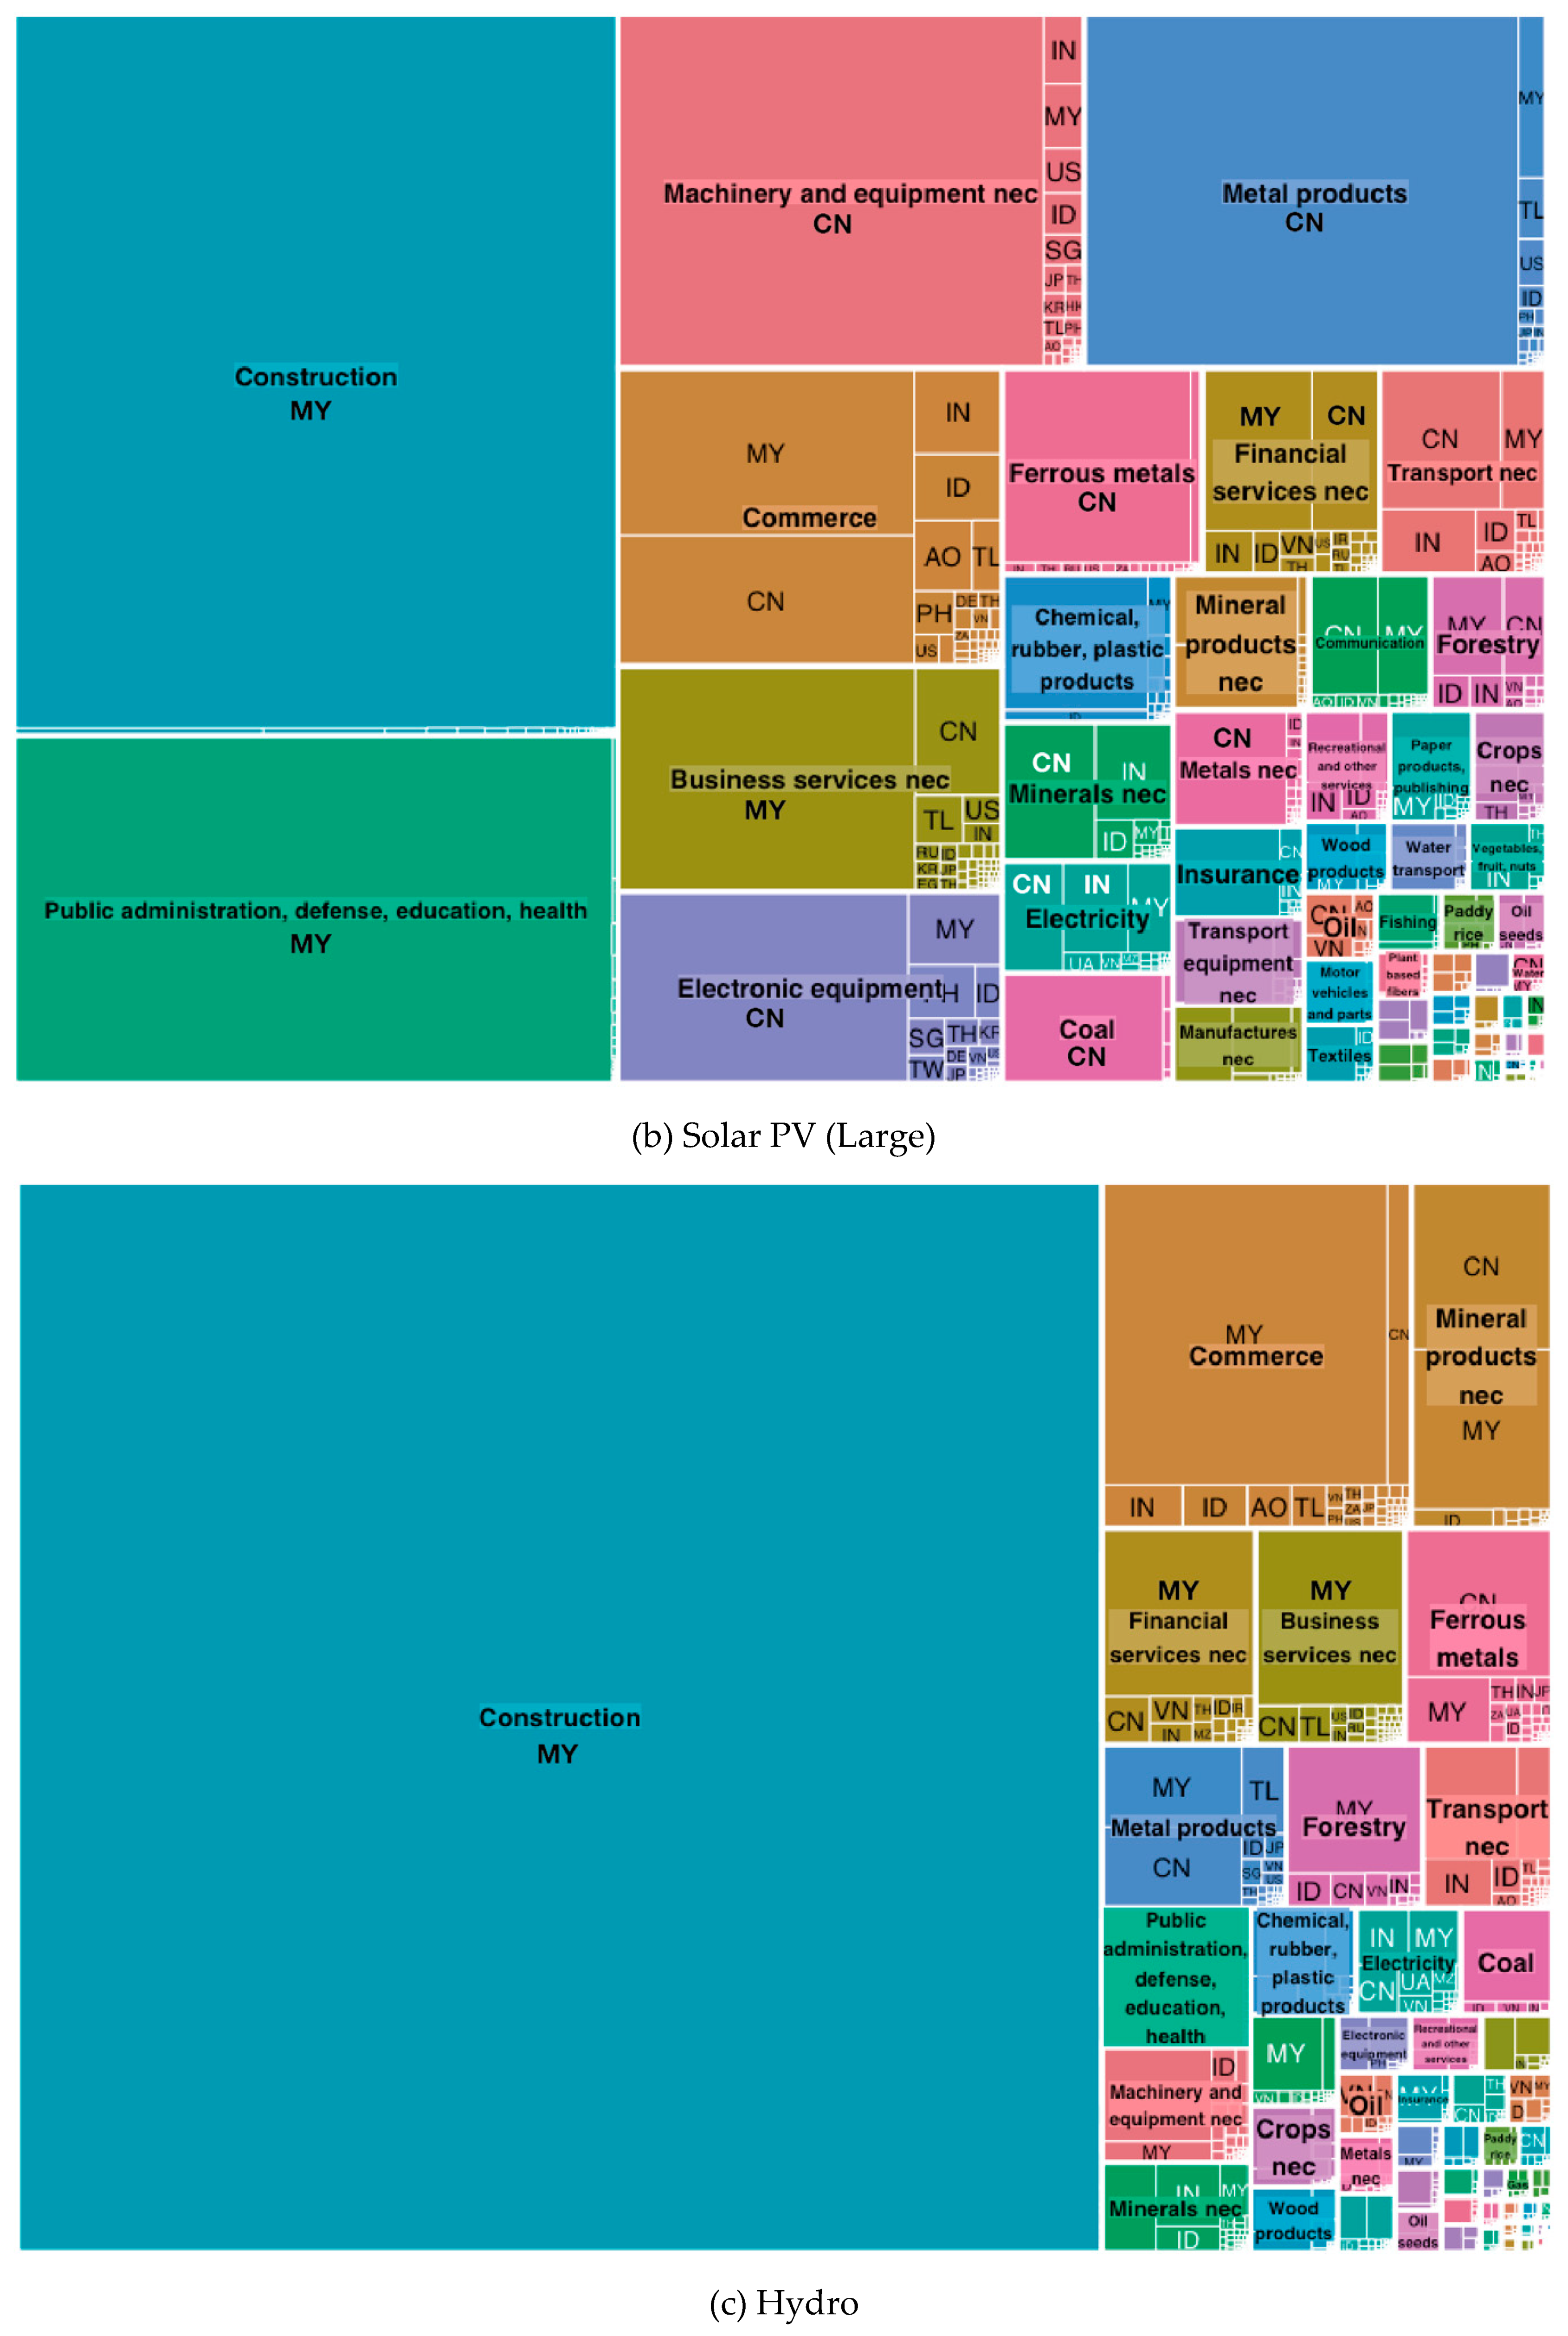
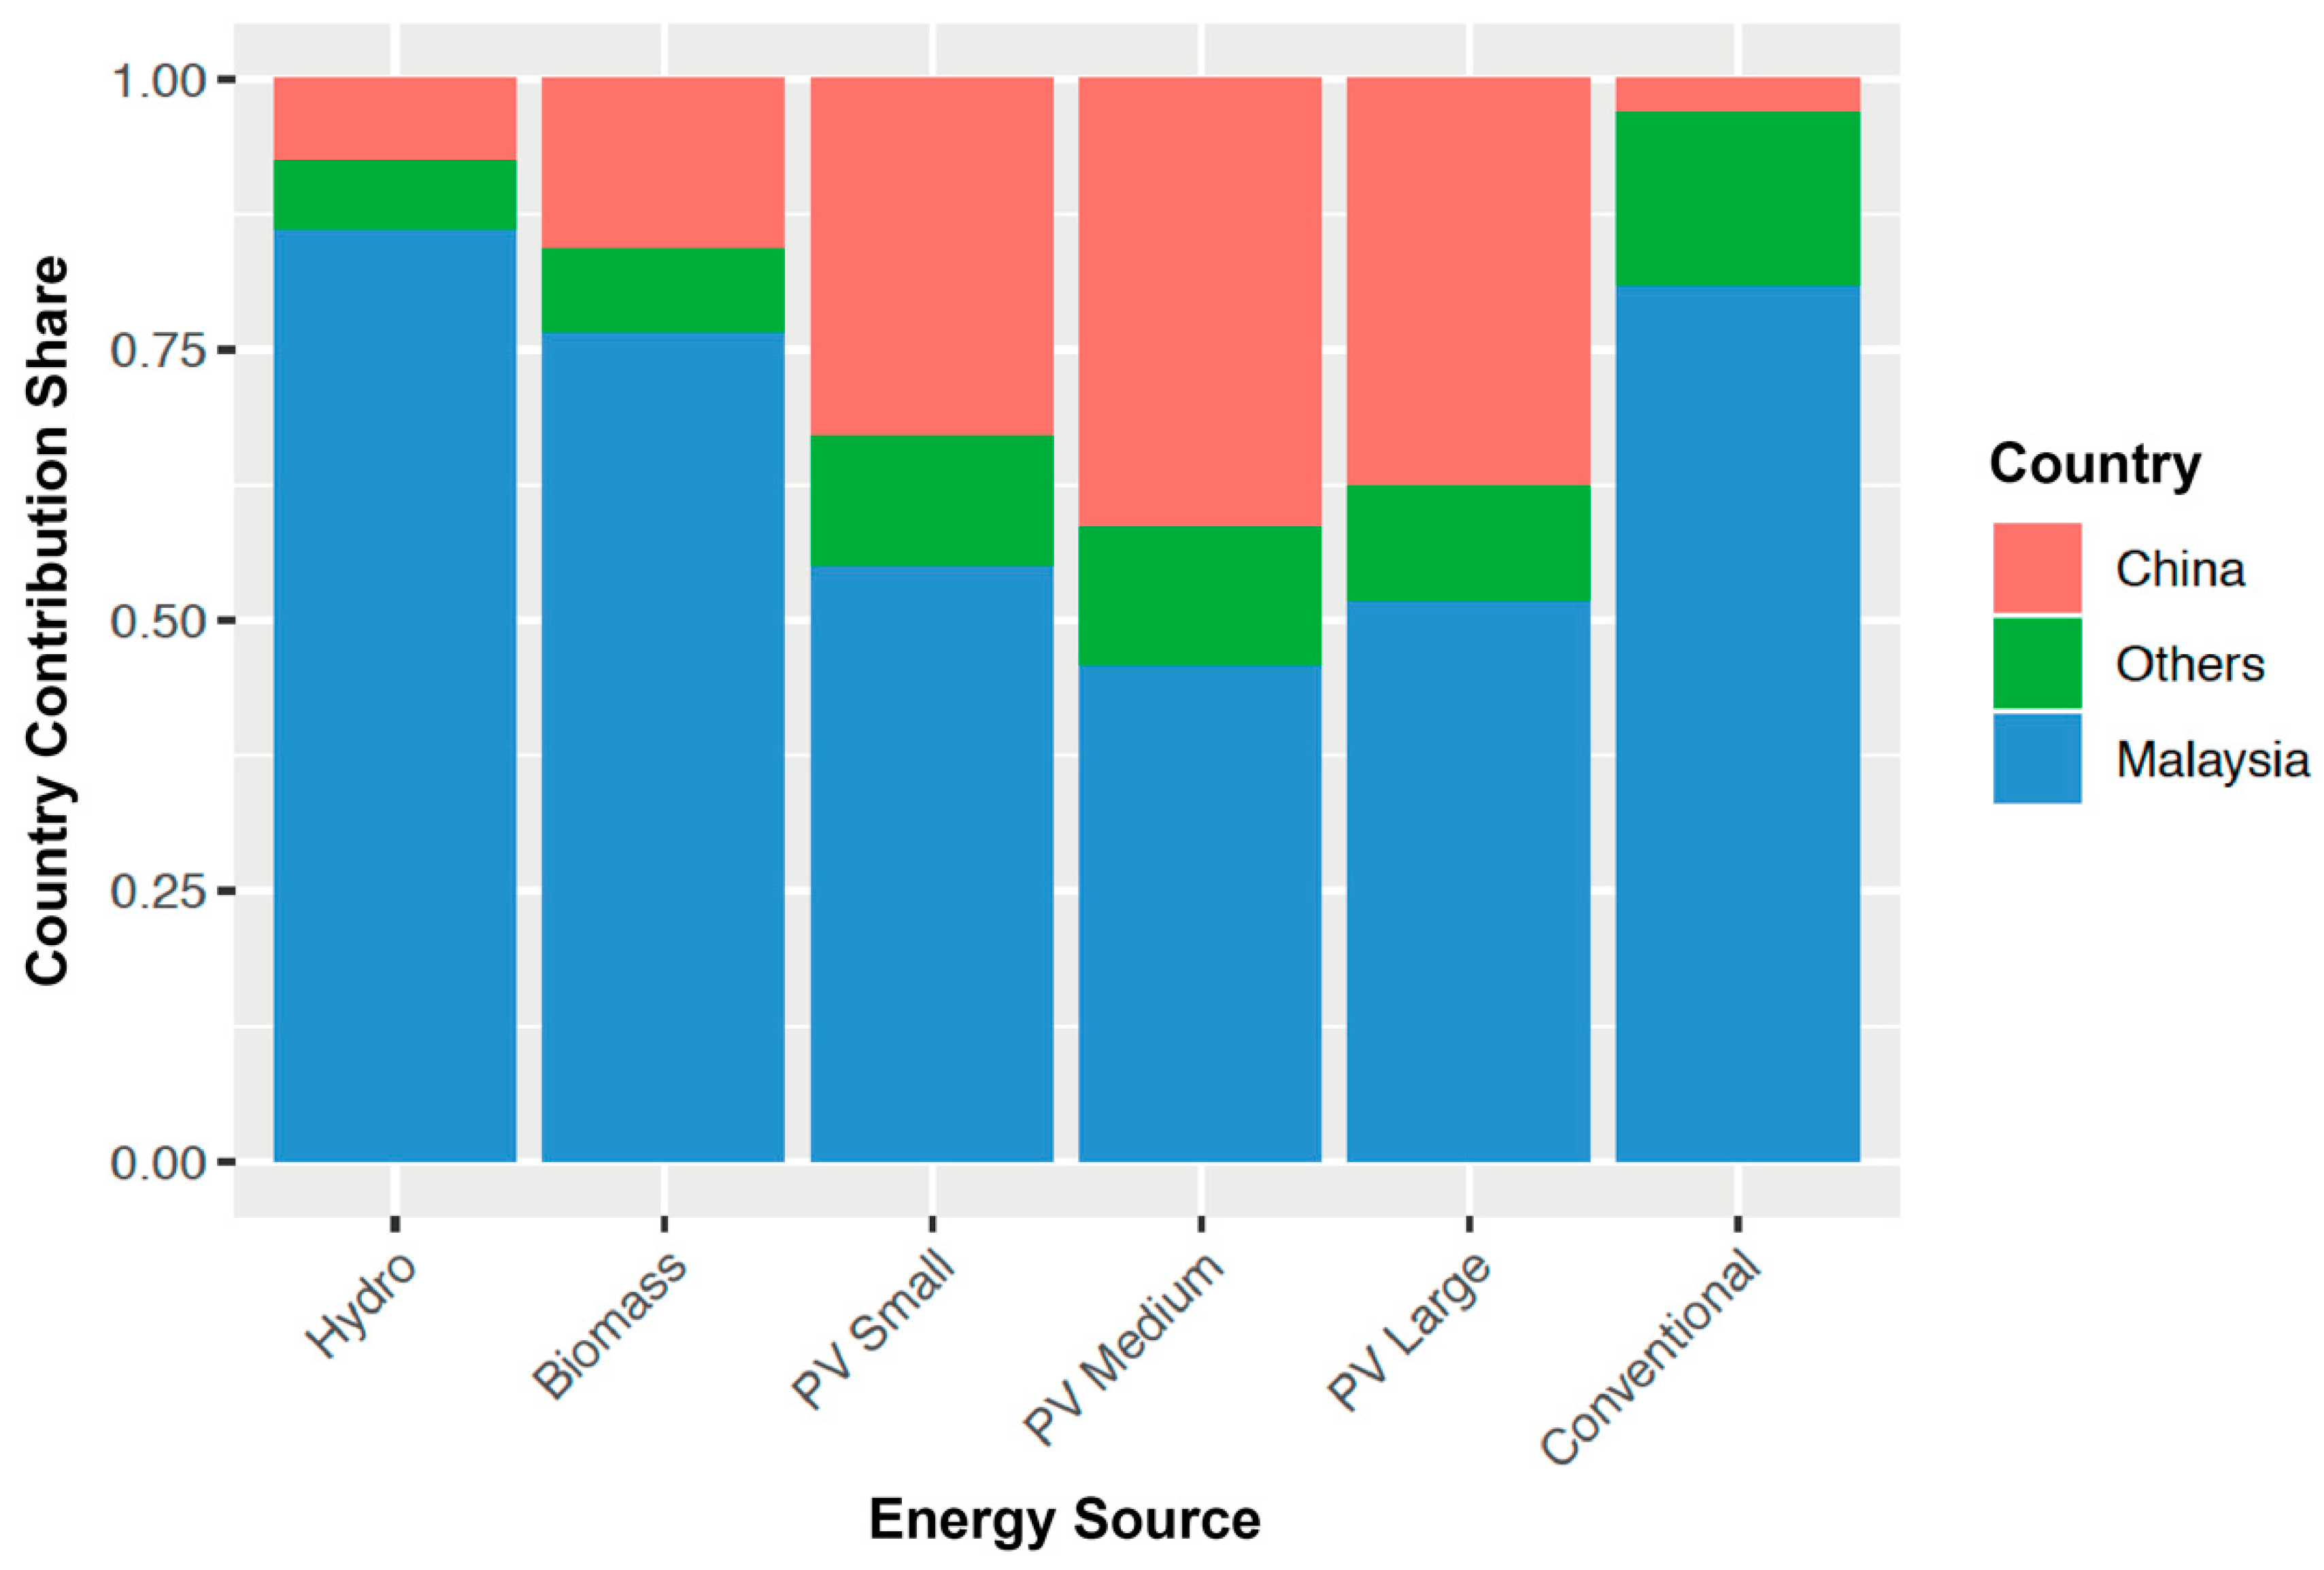
3.2. Process and Country Contributions
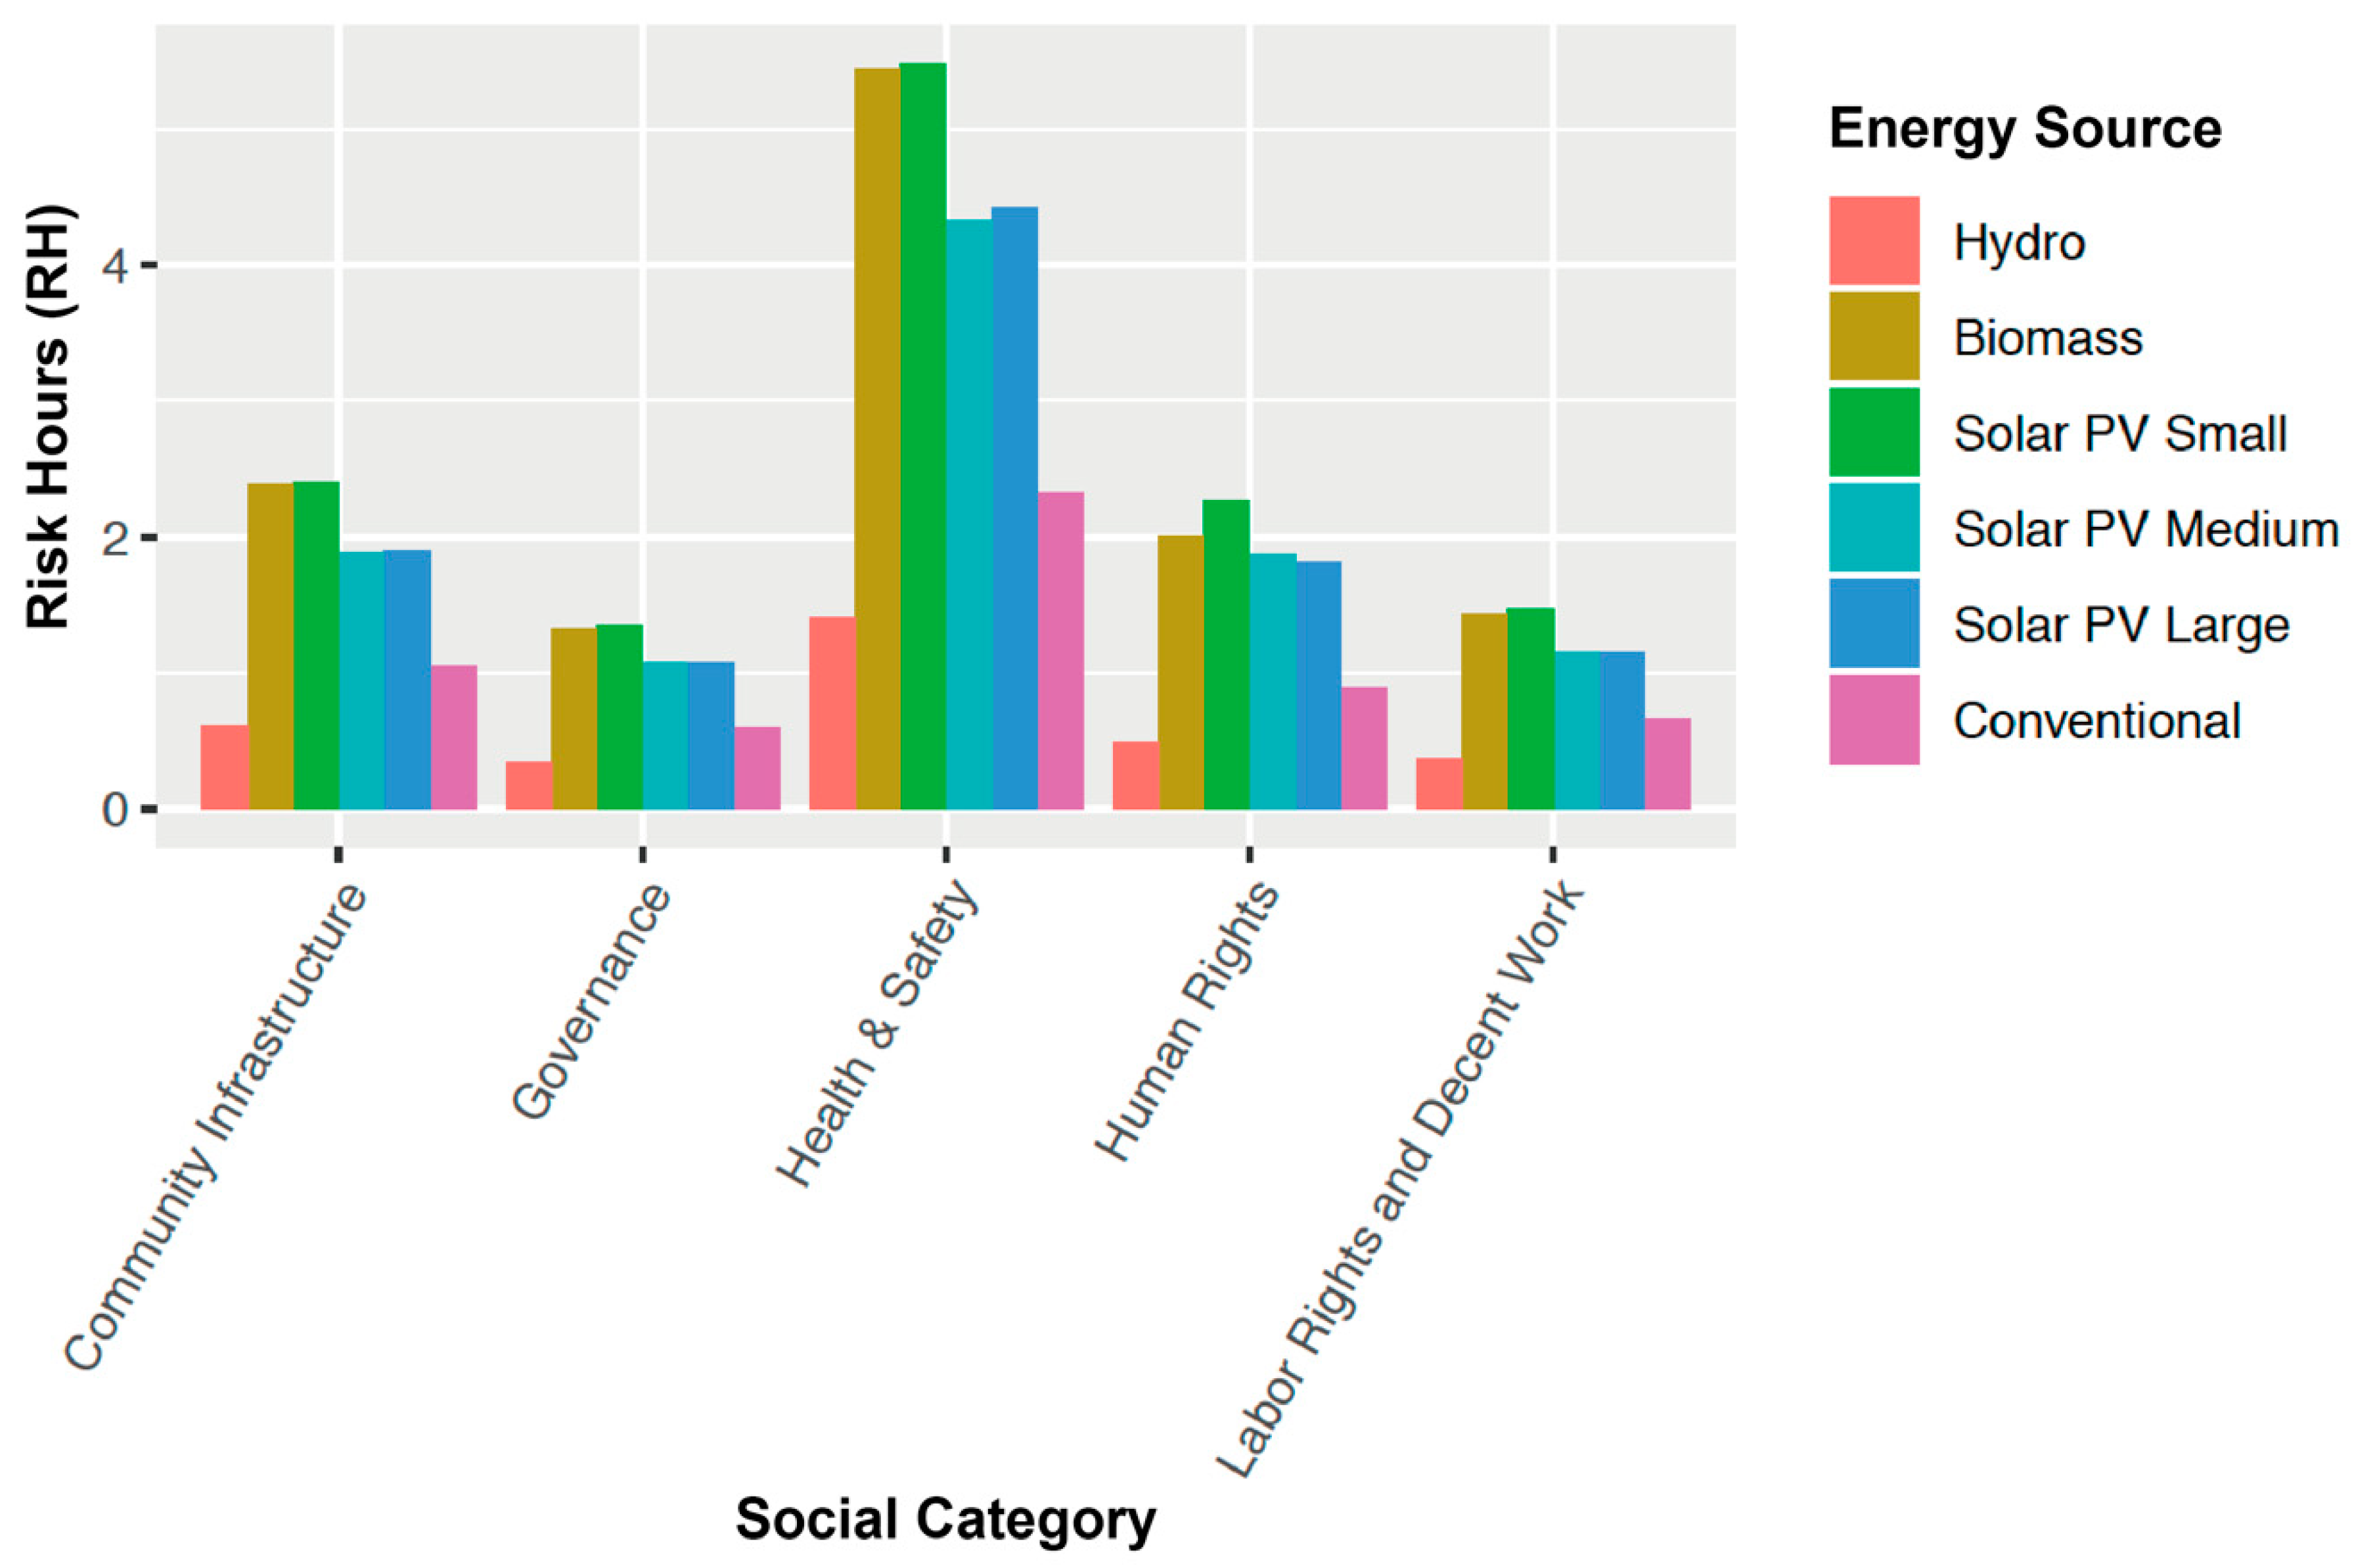
4. Discussion
4.1. Normalized Social Footprint per Unit-Electricity vs. Unit-Cost
solar PV small ($0.20/kWh) > solar PV medium ($0.17/kWh) > solar PV large ($0.15/kWh) >> biomass ($0.10/kWh) >> conventional ($0.03/kWh) ~ hydro ($0.03/kWh)
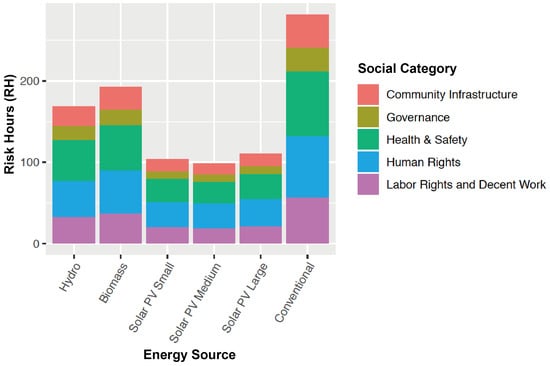
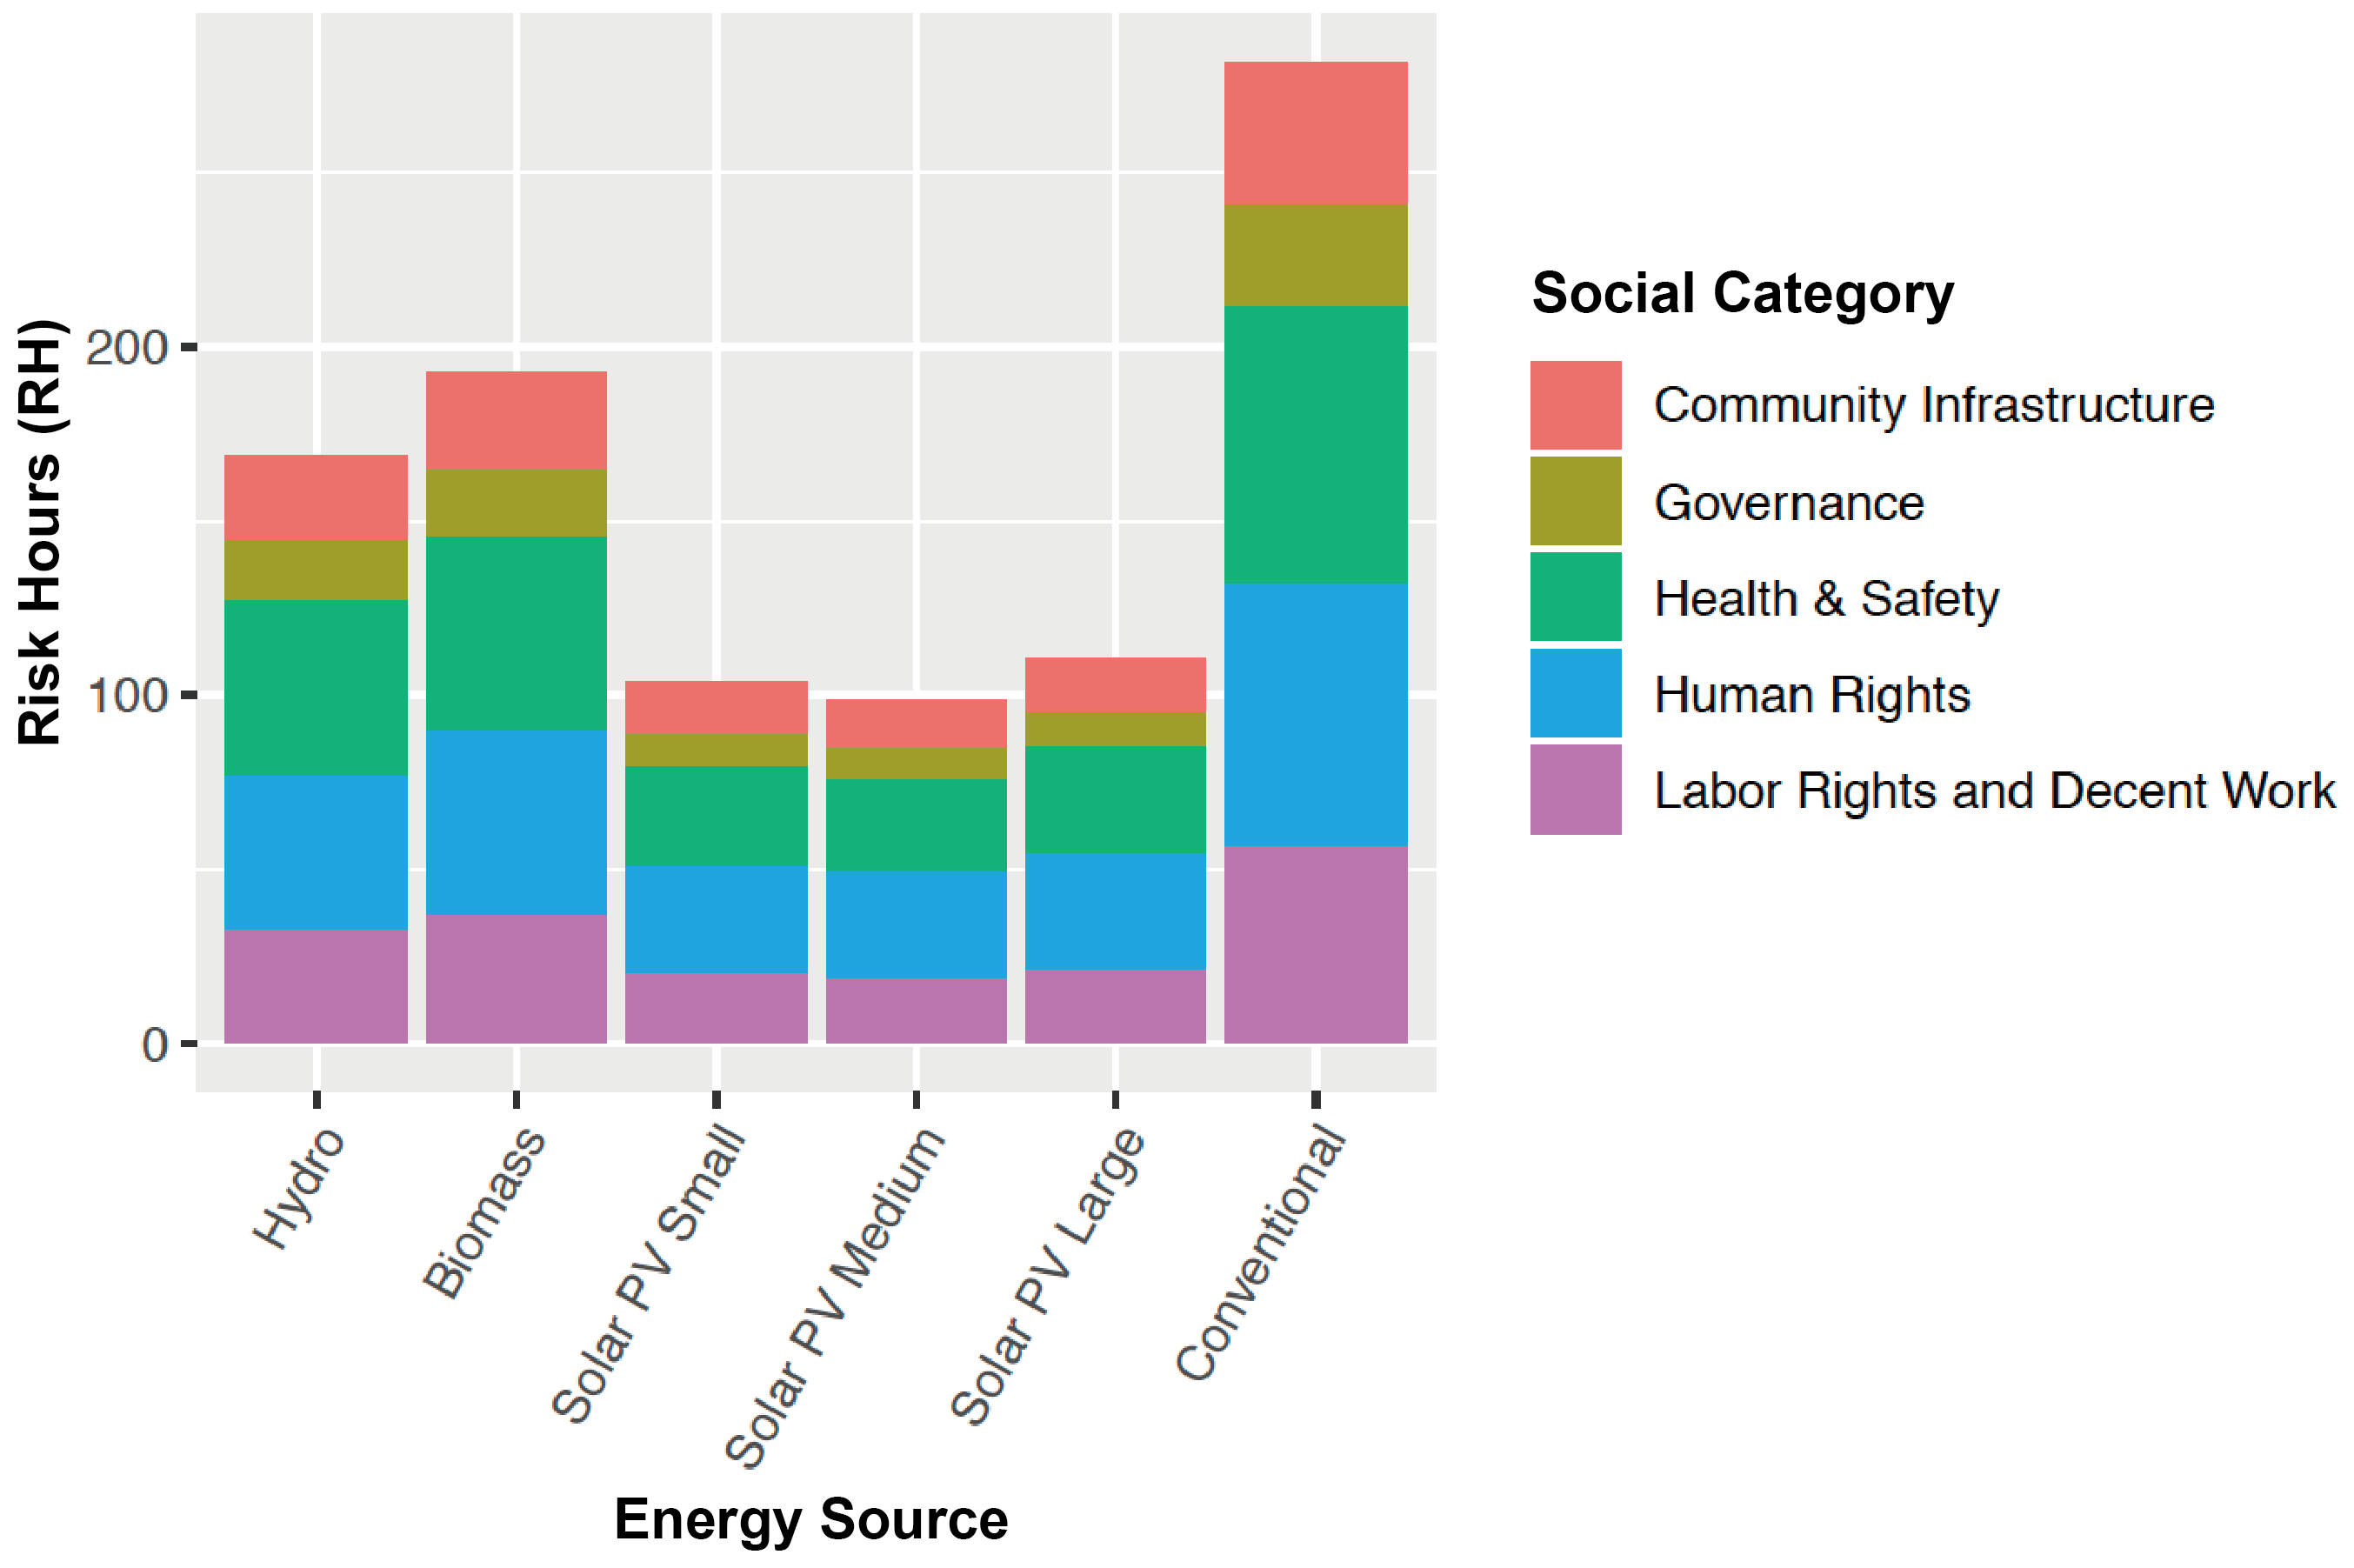
conventional (281.5 RH) >> biomass (192.6 RH) > hydro (168.6 RH) >> solar PV large (110.5 RH) > solar PV small (103.5 RH) > solar PV medium (98.2 RH)
4.2. Geographical Social Hotspots of Renewable Electricity
5. Conclusions
Supplementary Materials
Author Contributions
Funding
Acknowledgments
Conflicts of Interest
References
- Chatri, F.; Yahoo, M.; Othman, J. The economic effects of renewable energy expansion in the electricity sector: A CGE analysis for Malaysia. Renew. Sustain. Energy Rev. 2018, 95, 203–216. [Google Scholar] [CrossRef]
- Dong, K.; Hochman, G.; Zhang, Y.; Sun, R.; Li, H.; Liao, H. CO2 emissions, economic and population growth, and renewable energy: Empirical evidence across regions. Energy Econ. 2018, 75, 180–192. [Google Scholar] [CrossRef]
- Isik, C.; Dogru, T.; Turk, E.S. A nexus of linear and non-linear relationships between tourism demand, renewable energy consumption, and economic growth: Theory and evidence. Int. J. Tour. Res. 2018, 20, 38–49. [Google Scholar] [CrossRef]
- Ludin, N.A.; Mustafa, N.I.; Hanafiah, M.M.; Ibrahim, M.A.; Asri Mat Teridi, M.; Sepeai, S.; Zaharim, A.; Sopian, K. Prospects of life cycle assessment of renewable energy from solar photovoltaic technologies: A review. Renew. Sustain. Energy Rev. 2018, 96, 11–28. [Google Scholar] [CrossRef]
- Oh, T.H.; Hasanuzzaman, M.; Selvaraj, J.; Teo, S.C.; Chua, S.C. Energy policy and alternative energy in Malaysia: Issues and challenges for sustainable growth—An update. Renew. Sustain. Energy Rev. 2018, 81, 3021–3031. [Google Scholar] [CrossRef]
- United Nations Environmental Programme and Society of Environmental Toxicology and Chemistry. Guidelines for Social Life Cycle Assessment of Products; UNEP: Nairobi, Kenya, 2011. [Google Scholar]
- Aparcana, S.; Salhofer, S. Development of a social impact assessment methodology for recycling systems in low-income countries. Int. J. Life Cycle Assess. 2013, 18, 1106–1115. [Google Scholar] [CrossRef]
- Arcese, G.; Lucchetti, M.C.; Merli, R. Social life cycle assessment as a management tool: Methodology for application in tourism. Sustainability 2013, 5, 3275–3287. [Google Scholar] [CrossRef]
- De Luca, A.I.; Iofrida, N.; Strano, A.; Falcone, G.; Gulisano, G. Social life cycle assessment and participatory approaches: A methodological proposal applied to citrus farming in Southern Italy. Integr. Environ. Assess. Manag. 2015, 11, 383–396. [Google Scholar] [CrossRef] [PubMed]
- Macombe, C.; Leskinen, P.; Feschet, P.; Antikainen, R. Social life cycle assessment of biodiesel production at three levels: A literature review and development needs. J. Clean. Prod. 2013, 52, 205–216. [Google Scholar] [CrossRef]
- Benoît-Norris, C.; Vickery-Niederman, G.; Valdivia, S.; Franze, J.; Traverso, M.; Ciroth, A.; Mazijn, B. Introducing the UNEP/SETAC methodological sheets for subcategories of social LCA. Int. J. Life Cycle Assess. 2011, 16, 682–690. [Google Scholar] [CrossRef]
- Mattila, T.J.; Judl, J.; Macombe, C.; Leskinen, P. Evaluating social sustainability of bioeconomy value chains through integrated use of local and global methods. Biomass Bioenergy 2018, 109, 276–283. [Google Scholar] [CrossRef]
- Benoît-Norris, C.; Cavan, D.A.; Norris, G. Identifying social impacts in product supply chains: Overview and application of the social hotspot database. Sustainability 2012, 4, 1946–1965. [Google Scholar] [CrossRef]
- New Earth. Introductory User Tutorial for Social Hotspots Database; New Earth Maine: York Beach, ME, USA, 2014. [Google Scholar]
- Hashim, H.; Ho, W.S. Renewable energy policies and initiatives for a sustainable energy future in Malaysia. Renew. Sustain. Energy Rev. 2011, 15, 4780–4787. [Google Scholar] [CrossRef]
- Murray, J.; McBain, D.; Wiedmass, T. (Eds.) The Sustainability Practitioner’s Guide to Social Analysis and Assessment; Common Ground Publishing: Champaign, IL, USA, 2015. [Google Scholar]
- Shemfe, M.; Gadkari, S.; Sadhukhan, J. Social Hotspot Analysis and Trade Policy Implications of the Use of Bioelectrochemical Systems for Resource Recovery from Wastewater. Sustainability 2018, 10, 3193. [Google Scholar] [CrossRef]
- Holger, S.; Jan, K.; Petra, Z.; Andrea, S.; Jürgen-Friedrich, H. The Social Footprint of Hydrogen Production-A Social Life Cycle Assessment (S-LCA) of Alkaline Water Electrolysis. Energy Procedia 2017, 105, 3038–3044. [Google Scholar] [CrossRef]
- Muthu, S.S. (Ed.) Social Life Cycle Assessment: An Insight; Springer: Berlin, Germany, 2014. [Google Scholar]
- ASEAN Centre for Energy. Levelised Cost of Electricity of Selected Renewable Technologies in the ASEAN Member States; ASEAN Centre for Energy: Jakarta, Indonesia, 2016. [Google Scholar]
- Hausmann, R.; Hidalgo, C.A.; Bustos, S.; Coscia, M.; Chung, S.; Jimenez, J.; Simoes, A.; Yildirim, M. The Atlas of Economic Complexity; Puritan Press: Cambridge, UK, 2011. [Google Scholar]


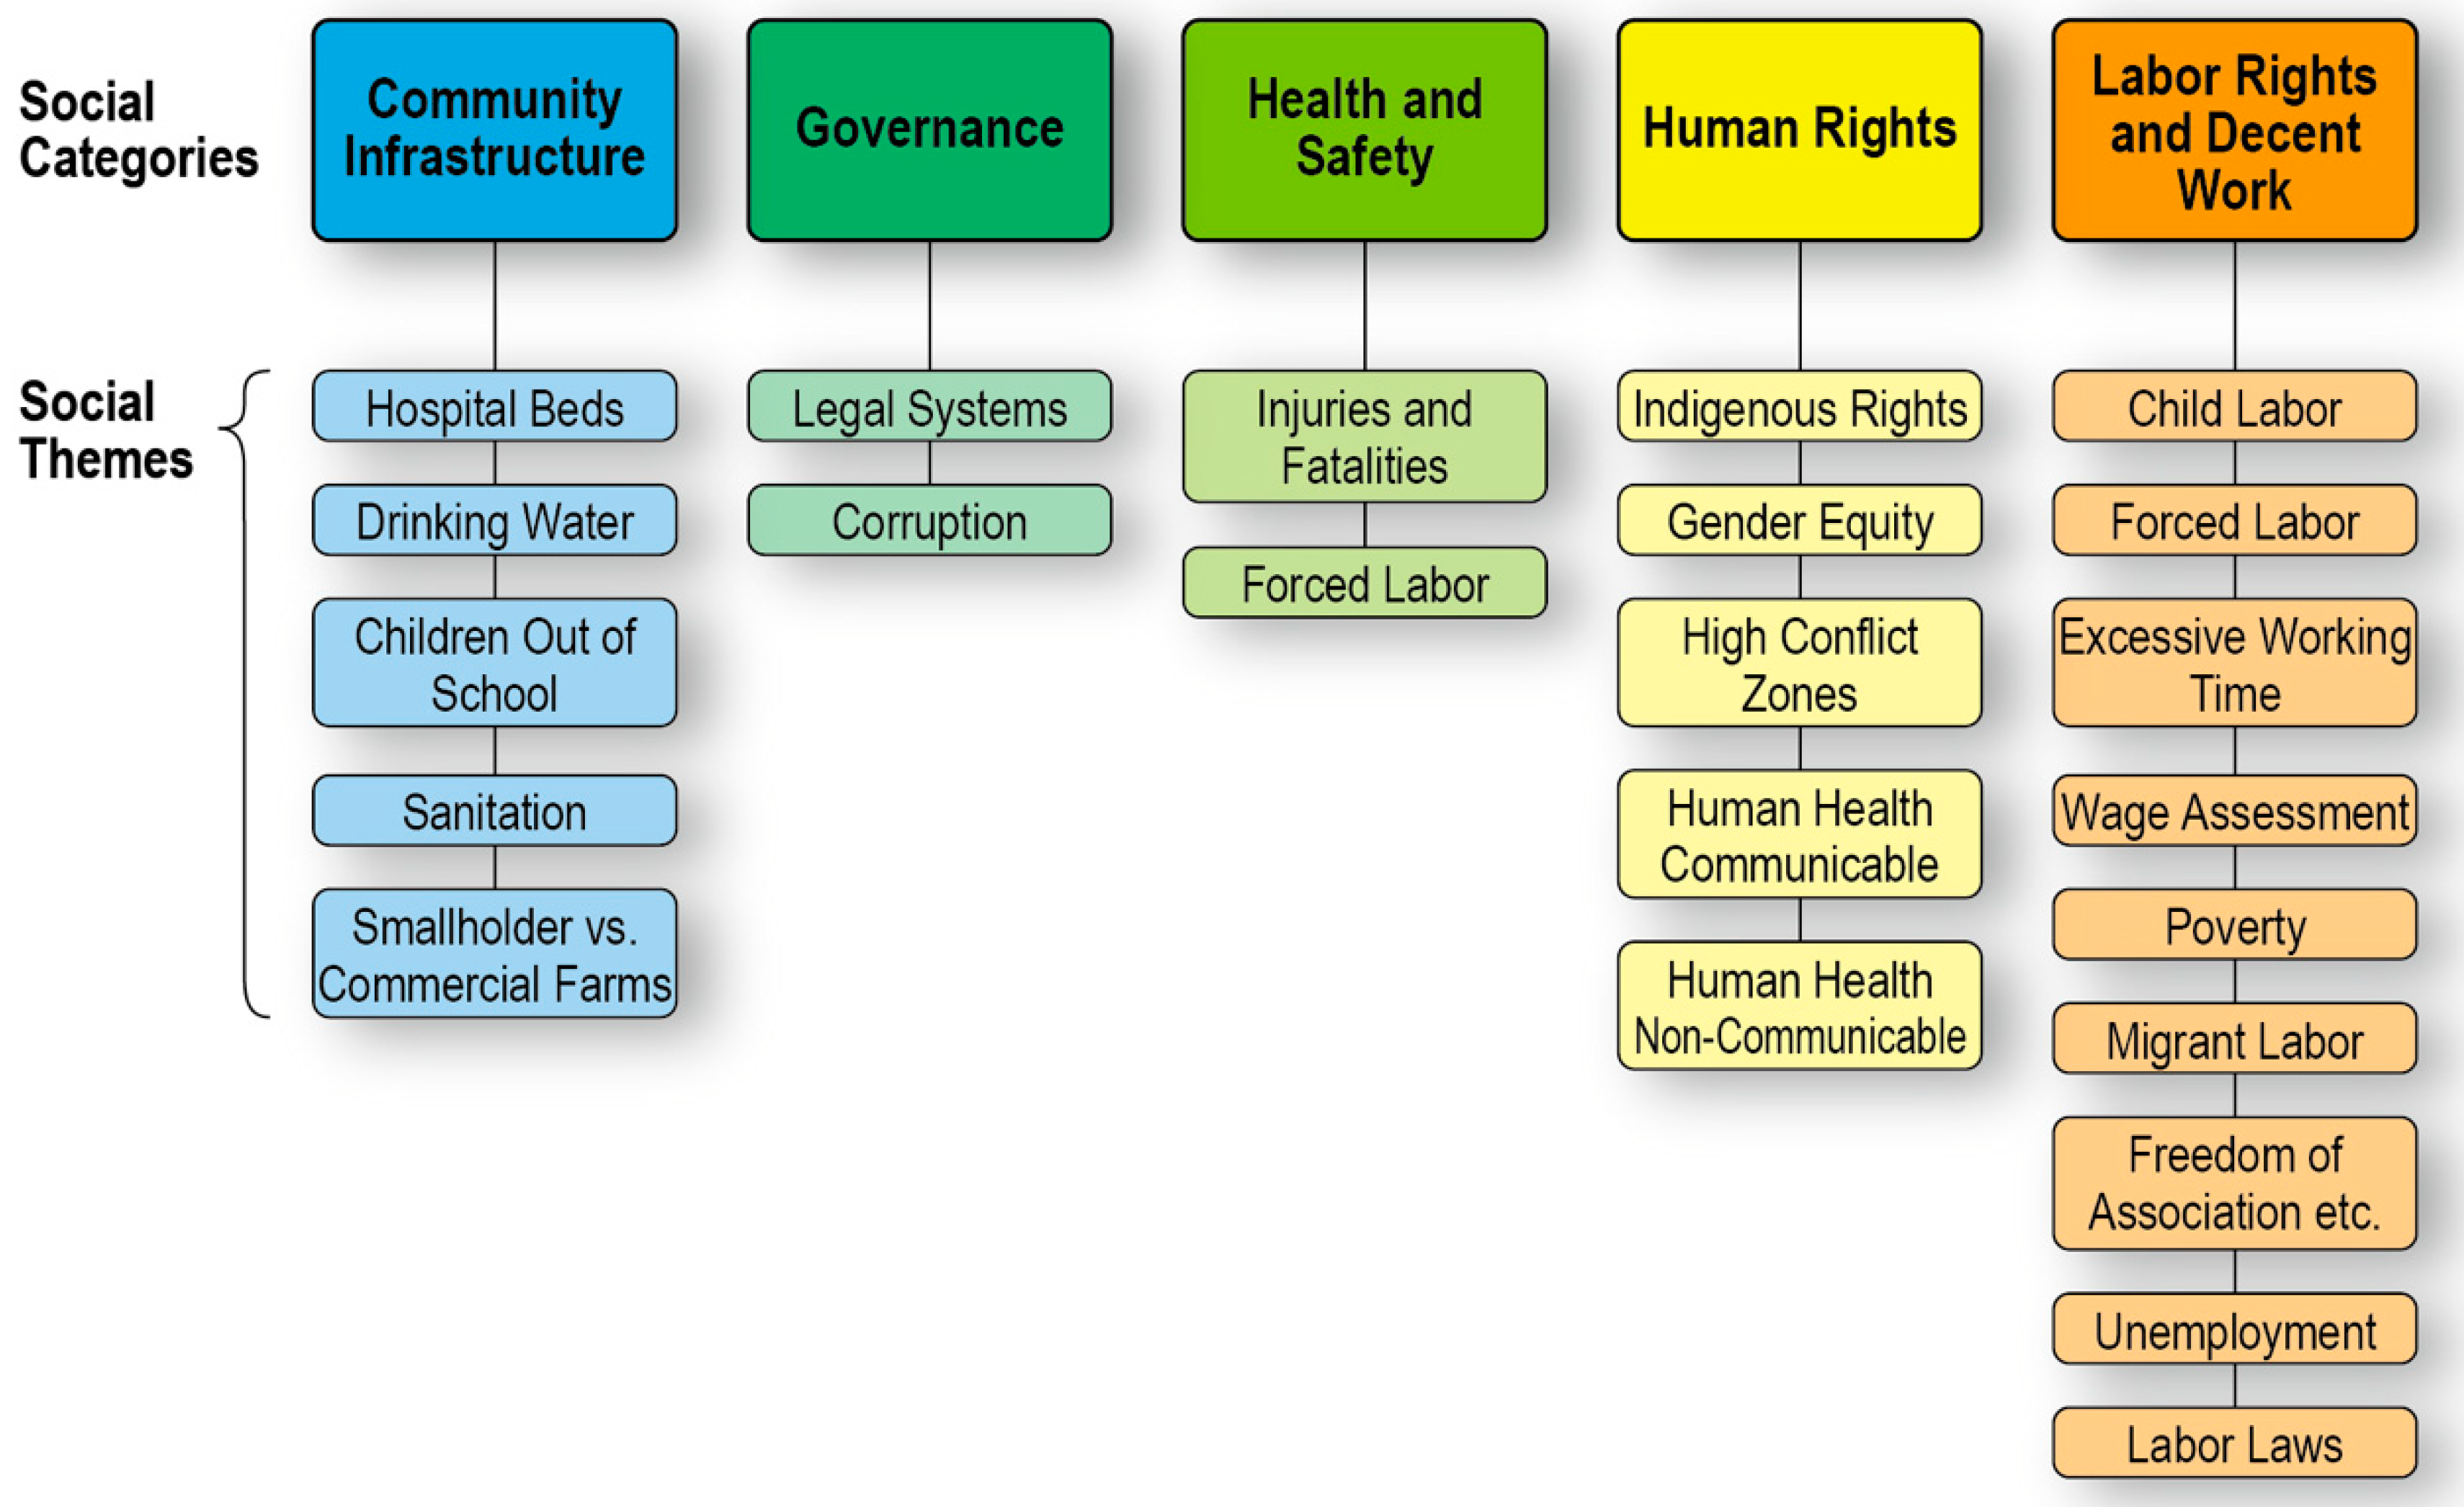
| Social Theme (Name of Table) | Data Indicator | Characterized Issue |
|---|---|---|
| Labor Laws/Conventions | Number of Labor Laws | Risk of Country not passing Labor Laws |
| Number of Labor Laws by sector | Risk of Country not passing Labor Laws by Sector | |
| Number of Labor Conventions ratified (out of 81 possible) | Risk of Country not adopting Labor Conventions | |
| Number of Labor Conventions ratified by sector | Risk of Country not adopting Labor Conventions by Sector | |
| Year of last Minimum Wage Update | Risk of Minimum Wage not being updated | |
| Wage Assessment | Minimum Wages (USD) | Risk of Country Average Wage being < Minimum Wage |
| Average Unskilled Wages (USD) in country | ||
| Non-Poverty Guideline (USD) | Risk of Country Average Wage being < Non-Poverty Guideline | |
| Average Unskilled Wages (USD) in country | ||
| Minimum Wages (USD) | Risk of Sector Average Wage being < Minimum Wage | |
| Average Unskilled Wages (USD) by sector | ||
| Non-Poverty Guideline (USD) | Risk of Sector Average Wage being < Non-Poverty Guideline | |
| Average Unskilled Wages (USD) by sector | ||
| Population living in Poverty | Percent of Population living on <$2/day | Risk of Population living on <$2/day |
| Child Labor | Child Labor % in country | Risk of Child Labor in country |
| Child Labor % by sector | Risk of Child Labor by sector | |
| Forced Labor | Qualitative | Risk of Forced Labor in country |
| Qualitative | Risk of Forced Labor by sector | |
| Excessive Working Time | Percent working >48 h/week in country | Risk of Population working >48 h/week in country |
| Qualitative | Risk of Population working >48 h/week by Sector | |
| Freedom of Association, Collective Bargaining, Right to Strike | Qualitative | Risk of not having Freedom of Association Rights |
| Qualitative | Risk of not having Collective Bargaining Rights | |
| Qualitative | Risk of not having the Right to Strike | |
| Unemployment | Unemployment Average % from 2000–2009 | Risk of High Unemployment in country |
| Unemployment % by sector | Risk for High Unemployment by sector | |
| Legal System | World Bank Worldwide Governance Indicator—Rule of Law | Risk of Fragility in Legal System |
| Bertelsmann Transformational Index - Rule of Law, Independent Judiciary | ||
| CIRI Human Rights Index—Independent Judiciary | ||
| Global Integrity Index—Judicial Accountability | ||
| Global Integrity Index—Rule of Law | ||
| Global Integrity Index—Law Enforcement | ||
| World Justice Project—Average | ||
| Indigenous Rights | Presence of indigenous population, X | Not characterized |
| Indigenous Population, % | Amount of Indigenous Population | |
| ILO Convention adopted for Indigenous Population, Y or N | Risk of country not adopting Indigenous ILO convention and UN Declaration | |
| UN Declaration for Indigenous Population, endorsed (Y), abstained (A), against (N) | ||
| Number of Laws enacted to protect Indigenous Population | Risk of country not passing Laws to protect Indigenous Population | |
| Qualitative | Risk for Indigenous Rights Infringements by Sector | |
| Gender Equity | Social Institutions and Gender Index | Risk of Gender Inequity |
| Global Gender Gap | ||
| World Bank Gender Development Indicator | ||
| World Bank Gender Empowerment Index | ||
| CIRI Human Rights Index—Economic | ||
| CIRI Human Rights Index—Political | ||
| CIRI Human Rights Index—Social | ||
| Adolescent fertility rate (births per 1000 women ages 15–19) | Not characterized | |
| Fertility rate, total (births per woman) | Not characterized | |
| Share of women employed in the nonagricultural sector (% of total nonagricultural employment) | Not characterized | |
| % Unemployment, (% of female labor force unemployed/% of male labor force unemployed) | Not characterized | |
| % of women workers vs. men by sector | Risk of Gender Inequity by sector | |
| High Conflict Zones | Heidelberg Conflict Barometer—# of conflicts | Risk for High Conflict |
| Heidelberg Conflict Barometer—maximum intensity of conflicts (1–5) | ||
| Heidelberg Conflict Barometer—change in conflicts (positive = worsening) | ||
| Number of Refugees—UN Refugee Agency | ||
| Center for Systemic Peace Indicator | ||
| Minority Rights Group Indicator | ||
| Top Risers from last year in Minority Rights Group Indicator, X | ||
| Qualitative | Risk for High Conflict specific to sectors | |
| Human Health—Communicable Diseases and Other Health Risks besides Disease | Life expectancy at birth (years) 2008 | Risk of low life expectancy |
| Mortality rates for injuries (per 100,000 population) 2004 | Risk of high mortality rates due to injury | |
| Proportion of undernourished % of total population, (−) = <5% 2005–2007 | Risk of high undernourishment | |
| Deaths due to indoor and outdoor air and water pollution (per one million population) 2004 | Risk of death due to air and water pollution | |
| Population affected by natural disasters, average per year per million 2000–2009 | Risk of death due to natural disasters | |
| Cases of HIV (per 1000 adults 15–49 years) 2010 | Risk of HIV 2010 | |
| Cases of Tuberculosis (per 100,000 population) 2008 | Risk of Tuberculosis 2008 | |
| Cases of Malaria (per 100,000 population) 2008 | Risk of Malaria 2008 | |
| Cases of Dengue Fever (per 100,000 population) 2005 | Risk of Dengue Fever, 2005 | |
| Cases of Cholera 2008 | Risk of Cholera 2008 | |
| Mortality rates from communicable diseases (per 100,000 population) 2004 | Risk of mortality from communicable diseases | |
| Children Out of School | Children out of School—male | Risk of Children not attending School–male |
| Children out of School—female | Risk of Children not attending School–female | |
| Children out of School—total | Risk of Children not attending School–total | |
| Access to Improved Drinking Water | Access to Improved Drinking Water, %—rural | Risk of not having access to Improved Drinking Water—rural |
| Access to Improved Drinking Water, %—urban | Risk of not having access to Improved Drinking Water—urban | |
| Access to Improved Drinking Water, %—total | Risk of not having access to Improved Drinking Water—total | |
| Access to Improved Sanitation | Access to Improved Sanitation, %—rural | Risk of not having access to Improved Sanitation—rural |
| Access to Improved Sanitation, %—urban | Risk of not having access to Improved Sanitation—urban | |
| Access to Improved Sanitation, %—total | Risk of not having access to Improved Sanitation—total | |
| Access to Hospital Beds | Access to Hospital Beds—# beds/1000 pop | Risk of not having Access to Hospital Beds |
© 2019 by the authors. Licensee MDPI, Basel, Switzerland. This article is an open access article distributed under the terms and conditions of the Creative Commons Attribution (CC BY) license (http://creativecommons.org/licenses/by/4.0/).
Share and Cite
Takeda, S.; Keeley, A.R.; Sakurai, S.; Managi, S.; Norris, C.B. Are Renewables as Friendly to Humans as to the Environment?: A Social Life Cycle Assessment of Renewable Electricity. Sustainability 2019, 11, 1370. https://doi.org/10.3390/su11051370
Takeda S, Keeley AR, Sakurai S, Managi S, Norris CB. Are Renewables as Friendly to Humans as to the Environment?: A Social Life Cycle Assessment of Renewable Electricity. Sustainability. 2019; 11(5):1370. https://doi.org/10.3390/su11051370
Chicago/Turabian StyleTakeda, Shutaro, Alexander Ryota Keeley, Shigeki Sakurai, Shunsuke Managi, and Catherine Benoît Norris. 2019. "Are Renewables as Friendly to Humans as to the Environment?: A Social Life Cycle Assessment of Renewable Electricity" Sustainability 11, no. 5: 1370. https://doi.org/10.3390/su11051370
APA StyleTakeda, S., Keeley, A. R., Sakurai, S., Managi, S., & Norris, C. B. (2019). Are Renewables as Friendly to Humans as to the Environment?: A Social Life Cycle Assessment of Renewable Electricity. Sustainability, 11(5), 1370. https://doi.org/10.3390/su11051370