Article

A Forecast and Mitigation Model of Construction Performance by Assessing Detailed Engineering Maturity at Key Milestones for Offshore EPC Mega-Projects

1
Graduate Institute of Ferrous Technology (GIFT), Pohang University of Science and Technology (POSTECH), 77 Cheongam-Ro, Nam-Ku, Pohang 37673, Korea
2
Hyundai Heavy Industries (HHI), Engineering Management Team, 400 Bangeojinsunhwan-doro, Dong-gu, Ulsan 44114, Korea
3
Department of Industrial and Management Engineering, Pohang University of Science and Technology (POSTECH), 77 Cheongam-Ro, Nam-Ku, Pohang 37673, Korea
*
Author to whom correspondence should be addressed.
Sustainability 2019, 11(5), 1256; https://doi.org/10.3390/su11051256
Submission received: 25 December 2018 / Revised: 19 February 2019 / Accepted: 22 February 2019 / Published: 27 February 2019

Abstract

:
The main subject of this research is to develop a forecast and mitigation model of schedule and cost performance during a detailed engineering stage of offshore engineering, procurement and construction (EPC) projects. The weight factors of major elements in detailed engineering completion rating index system (DECRIS) were measured using a fuzzy inference system (FIS) and an analytic hierarchy process (AHP). At five key engineering milestones, from an EPC contract being awarded to the start of construction, detailed engineering maturities were assessed in fourteen historical offshore EPC projects using the DECRIS model. DECRIS cutoff scores for successful project execution were defined at the key engineering milestones. A schedule and cost performance was forecasted and validated through comparison of DECRIS and other models using statistical confidence of a fuzzy set qualitative comparative analysis (fsQCA) and a regression analysis. As a mitigation method for engineering risks to EPC contractors, engineering resource enhancement is recommended for trade-off optimization of cost overrun using a Monte Carlo simulation. The main contribution of this research is that EPC contractors could continuously forecast construction costs and schedule performance utilizing the DECRIS model, and could review the adequacy of engineering resources, assessing the trade-off between said resources and cost/schedule risk mitigation.

1. Introduction

International oil prices are, as of 2014, experiencing a downward trend which was caused by a diversification of oil mining and a reduction in oil demand due to the global economic recession. The low point was experienced in 2016, and is currently rebounding in correlation with growth in the global economy, though it has yet to fully recover. This is depicted in Figure 1 as the average West Texas Intermediate (WTI) oil price from 2010 to 2021 [1,2]. As a means to better understand the full industry, Figure 2 depicts the oil refinery break-even prices, including onshore, shallow water, and deepwater and ultra-deepwater plants [3]. These figures depict an industry that is currently experiencing growth, equating to an increase in international investments. British Petroleum 2017 energy outlook forecasted continuous growth in energy consumption from 2015 to 2035, expecting more than 1.3% average annual growth in oil and gas demand [4]. Furthermore, McKinsey reported that the domestic and international offshore oil and gas investment capital expenditure (CAPEX) scale in 2021 is expected to be over twice that of the 2016 CAPEX [2]. Due to this expected industry-wide growth, there is a renewed need to investigate the execution of offshore oil and gas projects, including the pre-construction factors that most significantly affect costs and schedule performance.
This purpose of this paper is to develop a prediction model of schedule and cost performance based on the activities performed within the pre-construction stage of offshore (oil and gas) EPC projects. The findings may support EPC contractors in forecasting the construction costs and schedule performance at key engineering milestones prior to construction. Furthermore, the process will aid EPC contractors to review the adequacy of their engineering resources, assessing the trade-off between resources in order to mitigate cost/schedule risks.

1.1. Existing Literature

There are many existing publications dedicated to causes of profit losses and construction delays on international EPC mega projects: Asia [5,6,7,8,9,10,11,12,13,14,15,16], Europe [17,18], Africa [19,20,21,22], Americas [23,24,25], and Australia [26,27]. Among the factors identified, the most common cause of project schedule and cost overrun was found to be poor design development prior to construction [5,6,7,8,12,13,15,16,17,18,22,23,24,27].
Le-Hoai [7] indicated that three design factors, (i.e., mistakes in design, design changes and additional work requirements) affect the construction industry. Our research shows the importance of design maturities with a comparison amongst countries to reduce construction risks. Design issues are included in the top five major causes of construction delays and cost overrun in many counties, including Vietnam, South Korea, Jordan, Kuwait, UAE, China, etc. [7,28]. Shrestha [24] studied the magnitude of construction costs and schedule delays based on the type, size, duration and completion years using statistical analysis. Sambasivan [6], Wong [27] and Habibi [23] hypothesized that design error and change is one of the major causes of delays through diverse data analysis techniques, such as a relative importance index ranking method, severe index, etc. Dosumu [22] indicated that about 36% of cost variation is caused by design errors, and recommended design maturity review prior to use to minimize design-error-induced variations. Many previous studies show data collection and analysis using a considerable amount of historical data. However, only limited recommendations of mitigation and recovery plans are specified without detailed forecasts and mitigation methodologies in most previous studies and research.
Love et al. [26] found the best-fit distribution curve between contract size and project cost overrun. Using the historical project cost data and fitting curves in their study, construction contingency as mean cost overrun (12.2% of the original budget) is recommended in case the design has not been fully defined prior to a contract being signed [26]. The levels of design maturity of a project at the contract session vary depending on efforts on front-end loading. Without assessment of the design maturity, it is not recommended that a unique percentage of construction contingency for cost overrun be used.
Ishii [29] studied a simulation model to decide the order acceptance in EPC projects. In the study, various acceptance strategies were compared to find the maximum profit case based on numeric calculation. The order acceptance in EPC bidding projects shall be managed with engineering execution man-hours and appropriate man-hour allocation. The paper describes the importance of engineering man-hour management for EPC projects and its appropriate control prior to the execution of the project, but the subject is limited to man-hour management between projects, and no mitigation plan after the contract being award was suggested [29].
Moreau et al. noted that engineering activities consume 28% of project labor costs and 22% of project time according to a study of 20 EPC projects [30]. The environment of EPC turnkey projects is dynamic for complex requirements and frequent variations [31]. In order to minimize the engineering risks on the project schedule and cost performance, Moreau [30] suggested that the efficient management of engineering could lead to reductions of the project cost and schedule. Similarly, Alsakini et al. [31] suggested performing continuous detailed planning throughout EPC executions to avoid project schedule delays. Mahmoud et al. [32] suggested that managing speed in EPC projects is one of the key parameters, and concurrent engineering with resource enhancement reduces project durations. These papers highlight the risks and influences of detailed engineering, and suggest that appropriate assessment and continuous management with proper mitigation plans for engineering are important to make project execution successful in EPC projects.
Senouci [14] studied the time delay and cost overrun in construction projects using analyses of variance and regression. Similarly, with the aforementioned research, significant data was collected and analyzed. From a statistical analysis of 44 EPC projects, Safapour et al. [33] found that the cost performance on projects with a high level of complexity is relatively better than that of projects with low levels of complexity. On EPC projects with a high level of complexity, contractors were found to assign sufficient resources on detailed constructability reviews, design maturity checks, change management, client relationship and team building [33]. As described above, many international EPC mega projects suffer from profit loss and construction delays, and Safapour et al.’s [33] findings are difficult to generalize to the entire project aspect. However, the said study shows the possibility that engineering risks in EPC mega-projects could be efficiently mitigated with adequate resource and project management.
According to a large-scale review of 20,000 US executed construction projects, only 47% of projects were completed on-time and under budget [34]. Often times projects will identify poor performance early on and will execute recovery strategies. This occurred on 37% of the projects identified in the study. The recovery strategy was found to increase project success to 68% [34]. Furthermore, the top five causes of troubled projects were identified as unclear requirements, lack of resources, unrealistic schedule, planning based on insufficient data and unidentified risks [34]. From this study, the most impactful recovery strategies are to fully understand project requirements, perform proper risk assessments based on sufficient and reliable data, and to provide adequate resources to perform the required activities [34].
The Construction Industry Institute’s (CII) project definition rating index (PDRI) is a remarkable tool to measure project definition prior to EPC bidding and contract. The PDRI’s hierarchy consists of sections, categories, and elements. Each element is assessed on a scale of 1 to 5, and a project definition rating is calculated using a scoresheet which is weighted and normalized for each element [8]. The CII recommends that the cutoff score of the PDRI at the end of the FEED stage should be 200, as the performance of a project with a score higher than 200 was historically not satisfactory in terms of cost and schedule. PDRI is a useful tool for the project owner to manage the project definition level prior to finalizing the EPC contract. The PDRI tool was developed to assess project definitions at the front-end loading stage before awarding an EPC contract. PDRI concerns are on the macro scale of the project; thus, it is difficult to assess and manage the project definition level during the detailed engineering stage after the EPC contract has been finalized [8,35].
Recently, the authors of this paper developed a detailed engineering completion rating index system (so-called DECRIS) as a tool to predict the likely project performance of an offshore oil and gas EPC projects at the point of starting construction (steel cutting) [8]. Strong statistically significant correlations were found between the design completion rating and the construction cost and schedule performance, verified through historical project data. However, the previous study focused on steel cutting as a construction initiation milestone, rather than the early stages of planning; subsequent preemptive mitigation plans could not be prepared [8].

1.2. Point of Departure and Research Contribution

This research most significantly builds on the findings by Kim et al. [8], focusing on defining activities related to project success at five key engineering milestones between the EPC contract being awarded and steel cutting (i.e., construction initiation milestone). The correlation between the detailed engineering completion rating and the project performance are analyzed using a fuzzy inference system (FIS), an analytic hierarchy process (AHP), and fuzzy set qualitative comparative analysis (fsQCA). The resultant model’s efficacy is tested by comparing it to Kim et al.’s previous DECRIS model [8] and the existing PDRI commercial model [35]. The main contribution of the present DECRIS model is that EPC contractors can forecast construction costs and schedule performance based on the completeness and accuracy of the identified elements at five key engineering milestones. EPC contractors can also define the potential construction risks caused by pre-construction activities, review the adequacy of engineering resources, and analyze the mitigation methods’ cost/benefit trade-offs.

2. Research Methodology

2.1. Research Process

The research processes are described in Figure 3. As seen, the first step was to develop the DECRIS model. This includes defining the key milestones or gates at which to perform assessments. The relative importance of each milestone, as it impacts the project’s success, is then identified, thus modifying the previous DECRIS model using FIS and AHP. The resultant model is then assessed using data from fourteen historical projects to create the cut-off score at each milestone. With this step, the DECRIS model could be fine-tuned to assess the engineering completion rating of the detailed engineering stage of EPC projects.
Next, a case study of a project through a few major milestones (i.e., in the bidding stage, after front-end engineering and design (FEED) completion) was performed to verify and present the model. The DECRIS score at FEED verification was assessed through a review of the invitation to bid (ITB) documents; the construction cost/schedule performance was then predicted. Cost/schedule risk mitigation methods were suggested, assessing the trade-off costs through a Monte Carlo simulation (MCS). The predicted influences on the project performance are compared with the actual project cost overrun in engineering and construction.
The last step consists of verification of the statistical significance using regression analysis and fsQCA. The regression analysis statistical significance of the modified DECRIS (AHP and FIS) was compared with the existing DECRIS [8] and the commercial PDRI model [29] to determine the model’s efficacy in estimating a project’s cost/schedule performance. In addition, the significance of each model is qualitatively compared using fsQCA.
The DECRIS model established at the first step was verified and validated through the 2nd and last step. These verification steps use several statistical tools which are described below. Most of the offshore oil and gas EPC projects were found to have engineering risks jeopardizing construction cost and schedule performances.
Please note that the traditional earned value management (EVM) system is one of the most powerful methods to predict the final cost and schedule of projects. Earned schedule or other statistical prediction methods could support precise predictions, but early-stage prediction performances are not reliable due to the limited nature of actual project performance data in EVM [36,37]. This means that an EVM model could not predict project performance before the start of the project. The DECRIS model introduced in this paper predicts the construction costs and schedule performance before the start of construction (even before start of the project), based on the project engineering completion ratio and the regression function of historical project performance data.
In the following sections, the existing DECRIS model [8] and analytical method for verification, AHP, FIS and fsQCA, are briefly explained.

2.2. Existing DECRIS Model

This research builds off an existing DECRIS model [8]. That model was developed with industrial experts and project management consultancies over the last two years. Sixty-nine elements to establish a detailed engineering completion rating were selected and categorized as 3 sections (Basis of Detail Design, Engineering Deliverables and Execution Approach) and 11 categories. The weight factor of the elements was calculated using expert survey and a data normalization process. The verification of the existing DECRIS model was performed through a regression analysis between the DECRIS score and the project performance using the following definitions of the cost and schedule performance [8].
Cost Performance via construction labor hours increase rate (CLIR) = Construction labor hours increased by design change/Planned construction labor hours
Schedule Performance via construction duration delay (CDD) = (Actual construction duration) − (Planned construction duration)
The DECRIS cutoff score at steel cutting (construction starting) was selected and statistically validated as 300. A cost and schedule performance at the steel cutting stage for an on-going project was forecasted, and matched well with the actual performance during the construction phase of the project [8].

2.3. Analytic Hierarchy Process (AHP)

AHP is a decision making tool designed to structure decision hierarchies and calculate the relative importance between a set of individual elements through pairwise comparisons. The AHP method has been used in various decision-making problems, including project management issues [38]. A typical AHP process is shown as below [39,40]:
  • Step (1) Problem definition
  • Step (2) decision hierarchy structure
  • Step (3) Pairwise comparison between each element
  • Step (4) Calculation of the relative weight and validate the AHP result using a consistency ratio
In order to start the AHP process, a pairwise comparison is required for each element using a survey. In case the pairwise comparison is more than one result, then a geometric mean of the comparison matrix is required. Once the comparison matrix A (m × m matrix, m is the number of criterion) is made, a normalized pairwise comparison matrix can be derived by making equal to one (1) the sum of the elements on each column, using Equation 3. As the final step, the criteria weight vector is calculated by averaging the entries on each row, using Equation (4) [38,41].
a j k ¯ = a j k / l = 1 m a l k
w j = l = 1 m a j l / m
where, ajk is the importance of jth criterion relative to kth criterion.
The consistency ratio to validate an AHP is calculated using Equation (5) [38,42].
C.R = consistency index / random-like matrix = ((λmax − n) / (n − 1)) / R.I.
where, R.I. = 0.38 when n = 3.
In this research, the AHP process is applied for calculating the relative importance of each section. A pairwise comparison from the industrial expert survey results was made, and the weight factor of each section, category and element was fine-tuned.

2.4. Fuzzy Inference System (FIS)

FISs are widely used as decision support tools and process control, and are applied as an application of fuzzy set theory [42,43,44]. Normally, the crisp set membership function can take only a 0 or 1 value. However, a fuzzy set membership function represents values ranging from 0 to 1 as its probability function. The FIS consists of a fuzzifier to transfer crisp inputs to fuzzy inputs. This uses a fuzzy membership function (a fuzzy rule basis defined on expert knowledge basis), an interface engine to integrate the identified fuzzy output based on the fuzzy rule basis, and a defuzzifier such as the Mandani method to transfer fuzzy output to crisp output [45]. The researchers used the two fuzzy set input parameters with triangular membership functions with a 1/2 overlap level and triangular output membership function [46].
The FIS has been adopted within two portions of the authors’ research process. Kim et al. [8] developed weight factors for each of the DECRIS elements, calculated from the expert survey questionnaires. Alternatively, in this research, the weight factor of the element is modified using FIS methodology in the first portion. The second portion of the FIS process is used for DECRIS assessment.

2.5. Fuzzy Set Qualitative Comparative Analysis (FsQCA)

FsQCA is an effective method for performing an analysis, which includes both qualitative and quantitative components. Fuzzy membership functions are used for the fsQCA instead of the crisp set membership as 0 and 1. In case of continuous variables such as percentage values, a fuzzy set calibration with qualitative anchor is applied. Through fuzzy set comparison analysis, fsQCA qualitatively compares fuzzy set variables, thereby affecting the outcomes [47]. Regression analysis, which was used in the previous section, analyzes the effect on the outcome and finds the trend line, i.e., magnitude and direction of the variable. In contrast, fsQCA is the method to find which variable led to the known outcome [48,49]. The fsQCA results are validated with consistency and coverage with the following equations.
Consistency   ( X < Y ) = min ( X , Y ) X
Coverage = min ( X , Y ) Y
where X is the fuzzy membership score in the causal variable and Y is the fuzzy membership score in the outcome.
The FsQCA method is applied for qualitative comparisons between the established DECRIS model and the previous project definition tool at the detailed engineering stage of EPC projects, as described in Figure 3.

3. DECRIS Model Development Using AHP and FIS

3.1. Key Milestone Definition

As mentioned in the previous sections, the research goals are to decide the DECRIS cutoff score for each engineering key milestone during detailed engineering in oil and gas EPC project in order to predict construction cost and schedule performances. As a first step, engineering key milestones were identified using historical projects. The most common five key milestones were selected (over half of the historical projects had these exact five key milestones and the remaining had slight variations). Selected key milestones are shown in Table 1.

3.2. Element Weight Factor Modification Using AHP and FIS

A questionnaire was performed [8], scoring each element within three sections. In order to verify the relative importance of the sections, the researchers adopted the AHP and FIS tools. Pairwise comparison from 32 industrial experts was collected and geometric means of ratio of Section II/Section I, Section I/Section III, and Section II/Section III was calculated as 3.865, 1.182 and 4.100, respectively. The weight of each section was normalized using Equations (3) and (4), as shown in Table 2.
FIS was applied with triangular membership functions in order to fine-tune absolute weight factors of each section. Table 3 shows the comparison of weight of each DECRIS section. Through the AHP and FIS processes, the weight of “Section I - Basis of Detail Design” was found to increase from 16.6% to 17.9%. The overall element weight factors adjusted as a combination of absolute weight earned from FIS and relative weight between the sections earned from AHP, as described in Table 4.

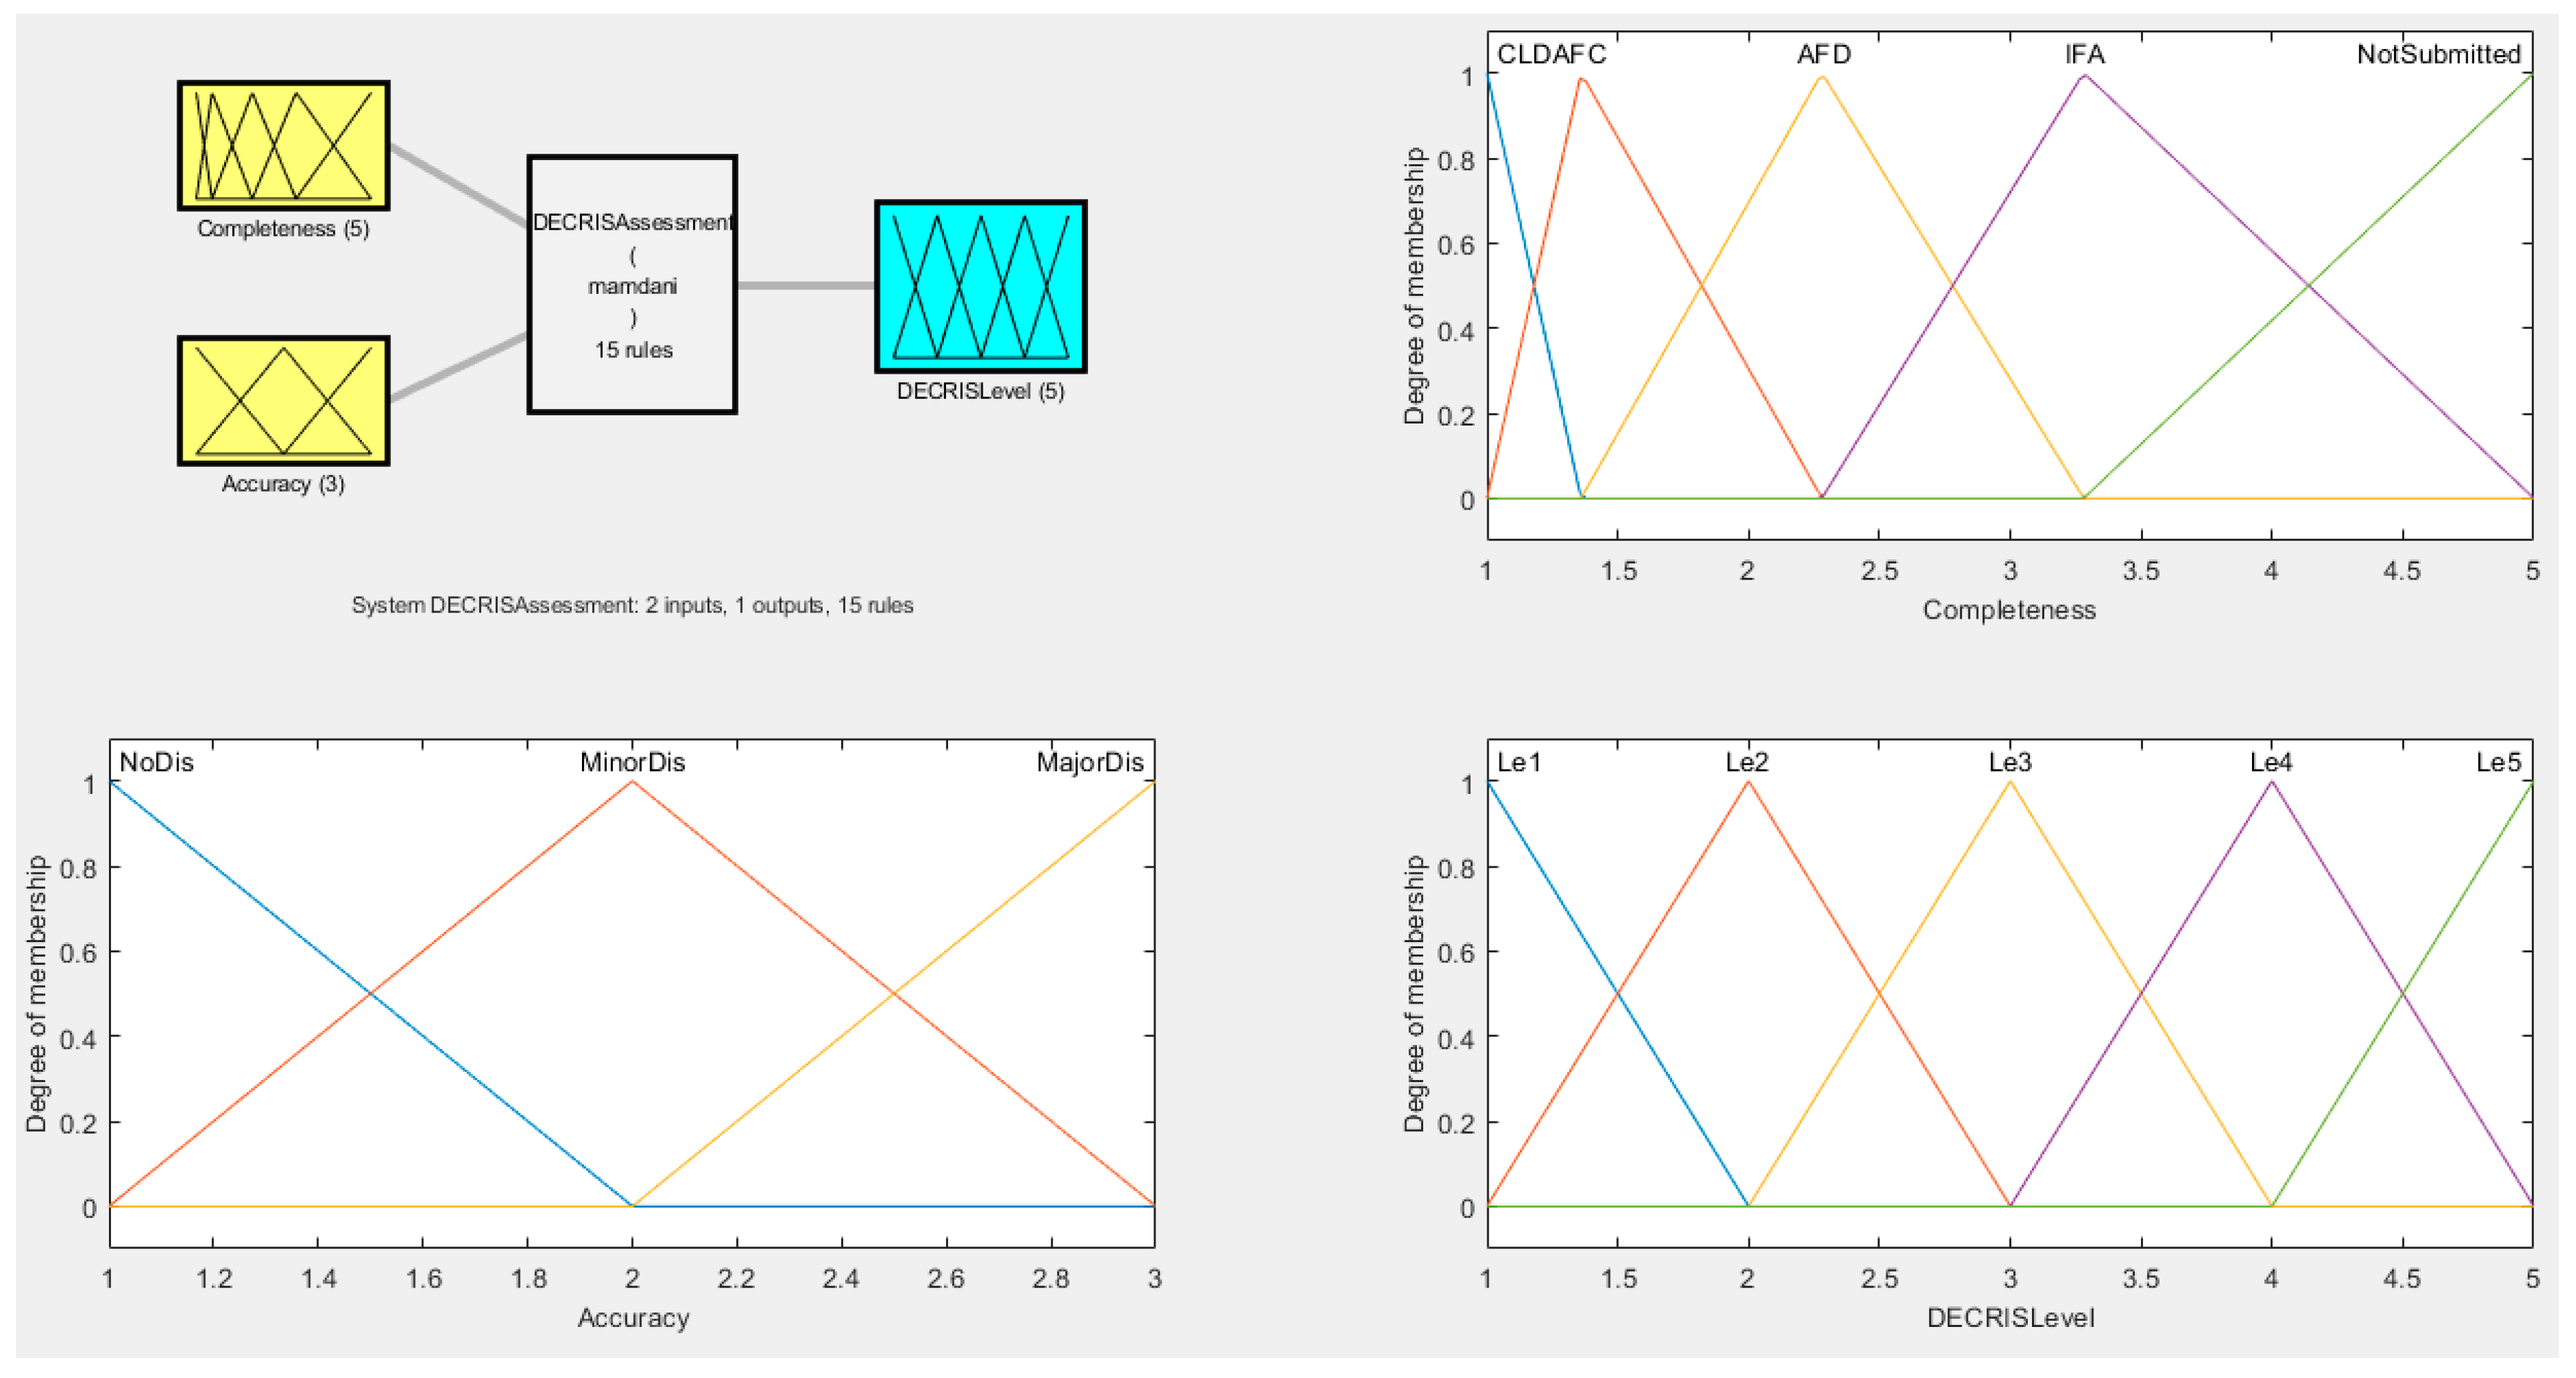
3.3. DECRIS Assessment Using FIS

The PDRI [29] and existing DECRIS [8] models’ assessments depend solely on expert judgment, based on who is assigned to a project [8,35]. In this research, FIS was chosen for the assessment as a decision-supporting tool to increase the output accuracy. The element levels of each project are calculated based on their completeness and accuracy. Completeness is calculated from the status of engineering deliverables collected from EPC contractor’s engineering document management system (EDMS) database. To define the completeness of the element, the researchers considered five sets of membership functions: (1) “Not submitted”, (2) “Issue for approval (IFA) submitted”, (3) “AFD submitted”, (4) “AFC submitted” and (5) “Closed”. Each membership is a triangular function with 1/2 overlap level. Each membership function of completeness input is earned from a mean value of survey results with ten industrial experts’ judgment as (3.28, 5, 5, 5), (2.28, 3.28, 3.28, 5), (1.36, 2.28, 2.28, 3.28), (1, 1.36, 1.36, 2.28) and (1, 1, 1. 36) respectively. Accuracy is calculated based on site expert judgement. With this fuzzifier and defuzzifier, using the Mandani method, the completion/accuracy ratings are transferred to a DECRIS element level score, which includes linguistic rating variables, “Low-low DECRIS level”, “Low DECRIS level”, “Medium DECRIS level”, “High DECRIS level” and “High-high DECRIS level”. The fuzzy membership function of the outcome was also considered on triangular functions, as shown in Figure 4.
Table 5 shows a sample calculation of the DECRIS assessment of Section I: “Basis of Detailed Design”, Category “Project Scope”. With the combination of the project completeness and accuracy, DECRIS level could be assessed using FIS within a range of 1 to 5.

4. Case Study: Predicting Schedule-Cost Performance at EPC Bidding Stage

4.1. DECRIS Assessments of A Sample Project

Using the AHP/FIS DECRIS model, DECRIS assessment was performed at EPC bidding stage (Gate #1) of a historical Project N in South-East Asia, classified as a fixed topside platform. Project N, which has 30 months’ project duration and 0.7 billion US dollars as its contract price was completed in 2017. The milestone of the DECRIS assessment was FEED verification (key milestone #1). The DECRIS score of the project was calculated as 808, signifying a 4.50% construction cost overrun (2.9 million $ of additional cost), as shown in Figure 5, and 130 days of construction duration delay.

4.2. Trade off Optinization

In order to minimize construction cost overruns, this paper also presents a mitigation plan using engineering resource enhancement via trade off optimization and empirical performance data. Monte Carlo simulations are widely used in various disciplines to compute difficult multi-dimensional integrals to reduce mistakes and prevent abuse. This paper used a dataset with strong correlation (over 0.6 R squared value), as recommended, for its input variables [44]. In addition, detailed information and graphs for the output distribution with more than or equal to 10,000 iterations and an adequate random number generator were requested in order to reduce the number of errors [50]. An engineering resource enhancement rate is selected as a variable “A” of the deterministic algebraic formula, and the below assumptions are applied to simplify the MCS model:
(1)
If a sampling dataset has a kurtosis less than 10 and a skewness less than 3, then the population could be assumed as normal distribution [51].
  • Absolute values of kurtosis and skewness of the CLIR (Variable “B”) residuals were calculated as 0.13 and 0.19 each.
  • The CLIR residual of regression analysis at each DECRIS score could be considered as normal distribution.
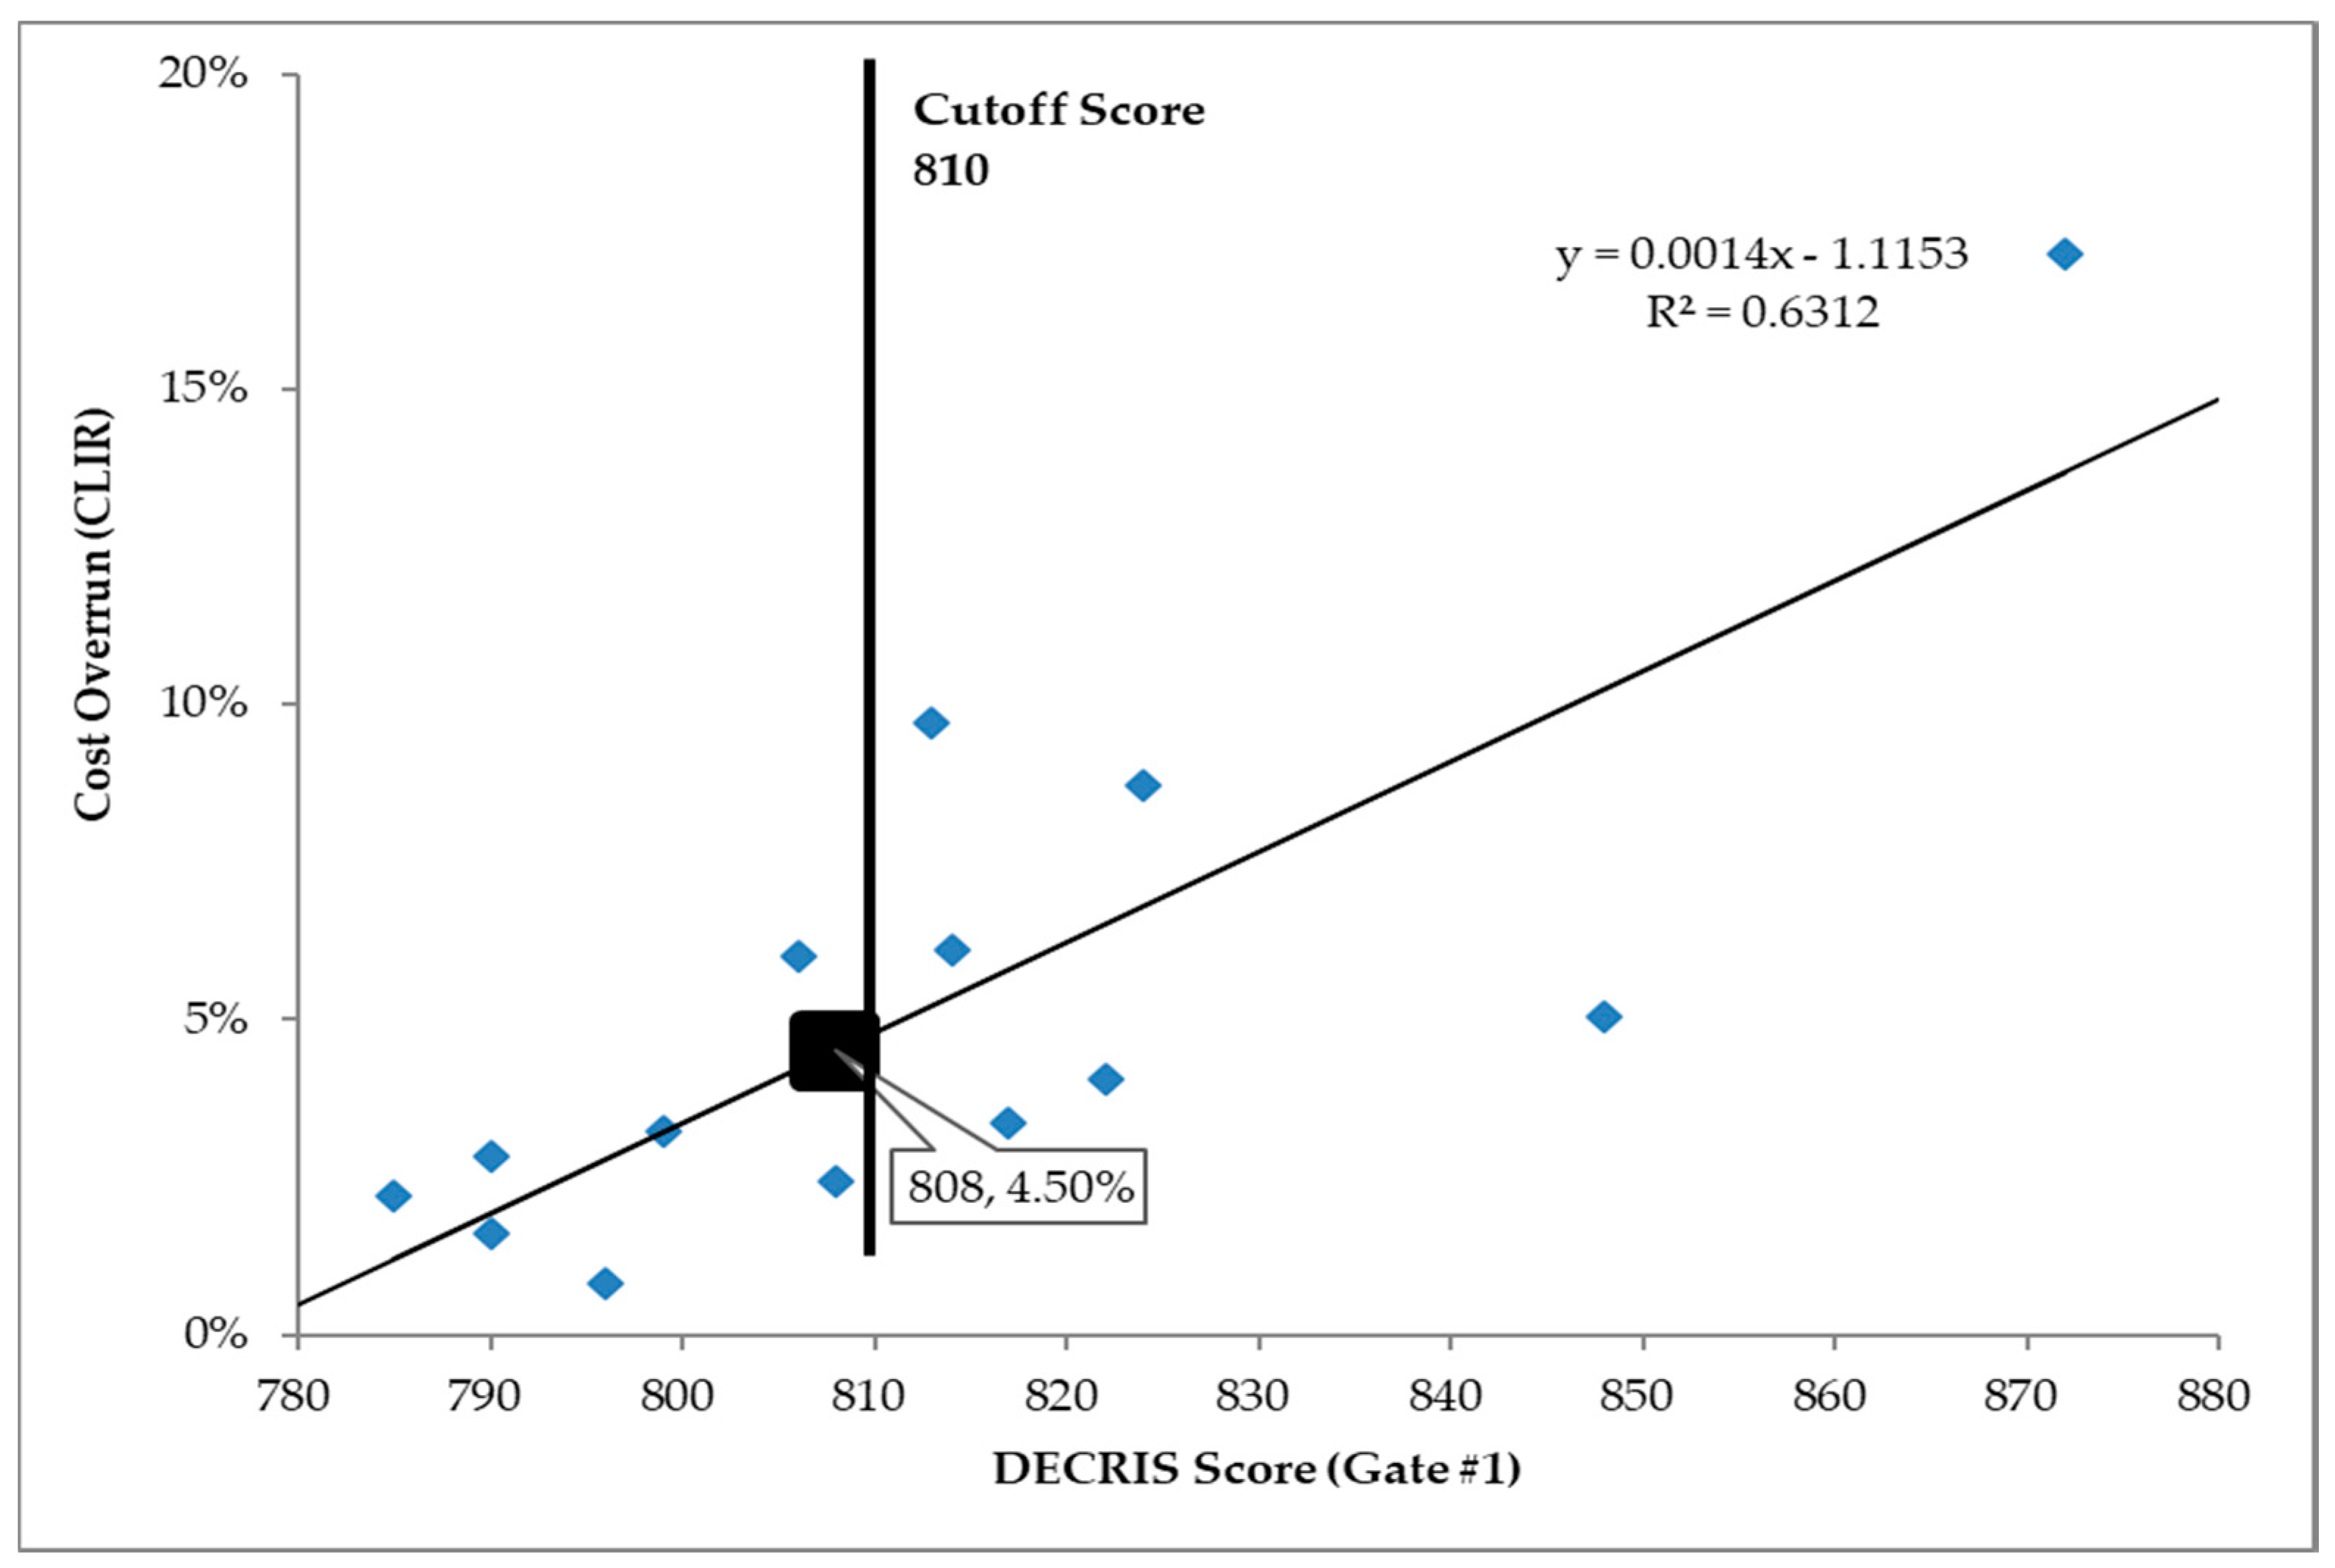
  • The standard error of the CLIR at the first key milestone is 0.02712 as per regression analysis results.
  • Based on the regression analysis, a mean value, standard deviation, 5% percentile and 95% percentile are calculated as 4.5%, 2.7%, -0.8% and 9.8% respectively.
(2)
A productivity of engineering resource enhancement is assumed to 80% of normal performance considering fast tracking processes.
(3)
In accordance with the definition shown in Equation 1, the construction cost performance predicted is the effect caused by low engineering maturity so that construction cost overrun will not be less than zero, i.e., high engineering maturity during EPC stage could not reduce the construction labor hours over the original planned value.
(4)
The cost impact output calculated with MCS distributed as a normal distribution.
(5)
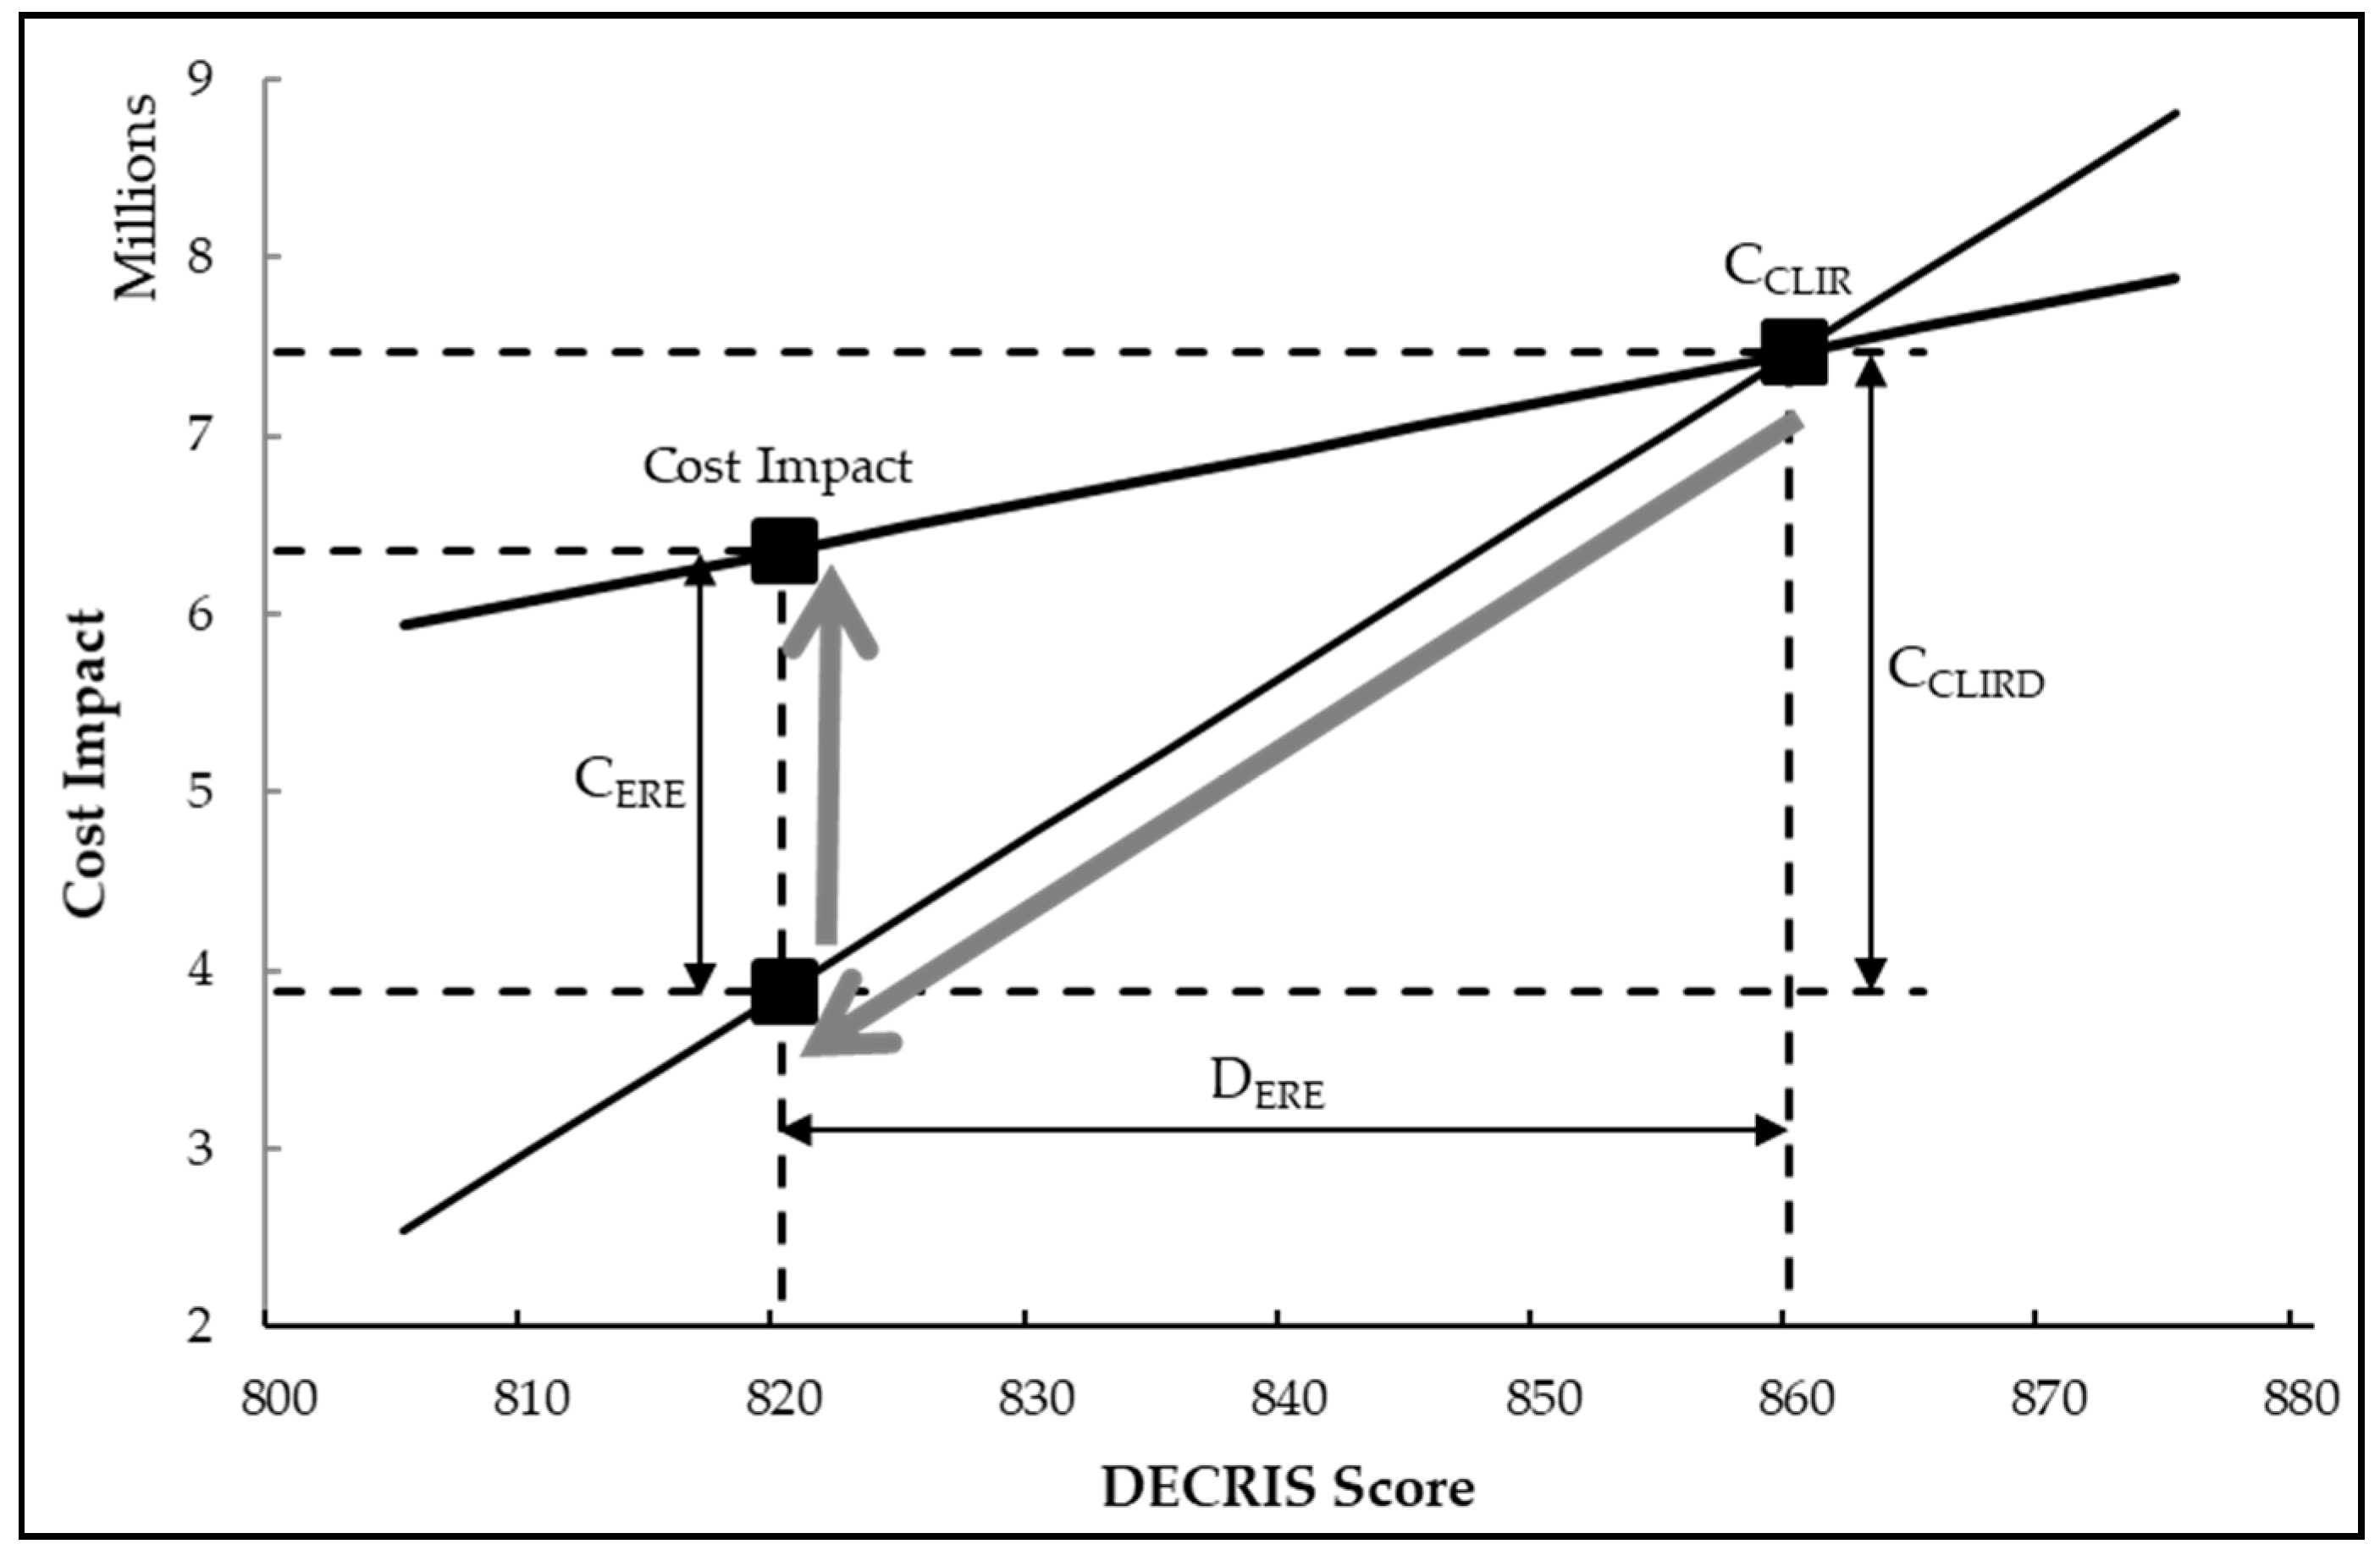
Equations (8) to (10) were adopted to develop the MCS model for the summation of cost impact calculation. Figure 6 illustrates the calculation method of the project cost impact changes incorporating construction cost deduction effect and engineering cost impact due to engineering resource enhancement.
Cost of Engineering Resource Enhancement (CERE) = Total Engineering Labor hours (hour) × Engineering Labor hour cost ($/hour) × A (%) = 35.2A
Cost of predicted CLIR (CCLIR) = Total Construction Labor hours (hour) × Construction Labor hour cost ($/hour) × B (%) = 62.0B
Cost of CLIR Deduction (CCLIRD) = DERE × slop of regression function (transferred from percentage to cost unit) = −52.9A
where DECRIS Score Deduction (DERE) = Total Engineering Labor hours × A × WFFastTrack × DECRIS deduction per engineering labor hour = −590A.
DECRIS deduction per engineering labor hour = −0.00126.
WFFastTrack = productivity of engineering resource enhancement = 0.8.
The deterministic algebraic formula used in the trade off optimization model of the Project N is shown in Equation 11. The constant numbers of Equations 8 to 11 are replaced with the project specific values depending on the project size, location, engineering maturity in ITB, etc.
Cost Impact
= CCLIR + CCLIRD + CERE = 62.0B − 17.7A,  CCLIR + CCLIRD > 0
= CERE = 35.2A,               CCLIR + CCLIRD < 0
One hundred of MCS cases are modeled with input variable X from 0.0% to 10.0% with a 0.1% gap. 10,000 iterations per case (total 1 million iterations) are performed using true-random number generated in Excel program. Detailed information on the 5.0% input variable case of mean, standard deviation, 95% percentile, 5% percentile, kurtosis and skewness is: 2,520,703, 1,028,727, 4,537,008, 504,397, 1.83 and 1.48 respectively. As per the result of the trade-off optimization model, we can consider that outcomes of cost impact are distributed as a normal distribution.
The MCS results described in Figure 7 show that the pre-matured design in ITB at gate #1 could be recovered with a mitigation plan to enhance engineering resource during EPC stage. In the case of project N, the predicted cost and schedule overrun at gate #1 can be deducted up to 2.5 million $ (about 0.5 million $ deduction) through 4.0% engineering resource enhancement.
Due to the limitation of research to collect and review the actual data in historical projects, the level of engineering resource enhancement performed in project N is not matched with the optimum point that are earned from the MCS model. Figure 7 additionally specifies the actual results of project N. In it, 7.1% of engineering resources are additionally assigned, and a $3.2 million impact is reported in engineering and construction labor hours. This is located on 0.8 sigma from the mean values within an inner range of 95% significance level (1.96 sigma).

5. Application and Validation

To validate the suggested model’s efficacy, three methods were performed on 14 historical projects: (1) comparison between the model performance of modified DECRIS and PDRI [29] using fsQCA, (2) comparison of the model performance between the existing DECRIS [8] and the modified DECRIS (using AHP and FIS), and (3) indirect validation of construction cost/schedule performance prediction and mitigation method for a bidding project using a trade-off optimization, as described in the previous part.

5.1. DECRIS Assessment through Sample Projects for Each Milestone

The fourteen (14) sample projects were selected amongst historical oil and gas EPC mega-projects completed from 2007 to 2018. The sample projects consist of nine (9) fixed platforms and five (5) floators such as Floating Production, Storage and Offloading (FPSO). A focus group of industrial experts was assigned for data collections and DECRIS assessments. A large amount of performance data on the historical projects was collected from the EDMS and the other project databases. Through the DECRIS assessment by a focusing group, DECRIS scores of 70 cases (14 projects × 5 key milestones) were obtained. Table 6 shows the details of the actual date of each gate and DECRIS assessment results. One outlier is shown in Project I (Actual date of the gate #4, 90% modeling review, is later than gate #5, work order).

5.2. DECRIS Cutoff Scores

Based on the DECRIS assessment results, the 14 projects were divided into two groups (i.e., high and low DECRIS score groups) to define the preliminary DECRIS cutoff score for each key milestone’s cost and schedule performances. Ten (10) sets of groups (5 key milestones and cost/schedule performance) were collected. One sample group set is specified in Table 7.
In order to verify the difference of the schedule performances of the two aforementioned groups, an independent t-test was carried out. Through the 10 sets of independent t-tests, the DECRIS cutoff score of each key engineering milestone were settled, as shown in Table 8. A set of regression analyses were then performed, resulting in ten (10) regression functions and associated R squared values, shown in Table 8. This describes acceptable statistical significances for every regression function and the independent t-test in both cost and schedule performances. The DECRIS cutoff score to justify the detailed engineering completion from EPC contract award to steel cutting was set and statistically verified. Figure 8 shows the DECRIS threshold (cutoff score) of each key engineering milestone and upper/low limits to specify DECRIS scores of 1.64 sigma (90% significance limit).

5.3. Comparison of DECRIS and Other Tools Using Regression and fsQCA

As described in the previous section, the regression results show strong correlations between DECRIS and construction cost overrun and schedule delay. In case of the PDRI, R-squared values at EPC bidding stage (Gate #1) were calculated as 0.47 [35]. The correlation between PDRI and construction cost overrun at steel cutting (Gate #5) was found to have an R-squared value of 0.042 [8]. The R-squared values of regression analysis using modified DECRIS at the same milestones are shown as 0.63 at EPC bidding and 0.60 at steel cutting, i.e., much higher than the values using PDRI. This result shows PDRI’s ability to assess project performances at front-end loading and EPC contract stage, but its weakened abilities at the construction start stage. In contrast, the DECRIS that focused on the EPC execution stage showed strong correlation that was maintained up to the start of construction. In addition to the PDRI methodology, researchers adopted AHP and FIS methodologies to the DECRIS model development and assessment method in order to enhance the statistical accuracies of the results.
In order to qualitatively compare the effect of DECRIS with the effect of PDRI scores on the project cost and schedule performance, the fsQCA method was used. Causal sets of the fsQCA are selected as “projects which have high DECRIS score” and “projects which have high PDRI score”, and two outcome sets were “projects which have large cost overrun during construction phase” and “projects which are significantly delayed during construction”.
Table 9 shows the sample result of the calibrated fuzzy set of two variables and two outcomes at the gate #5, steel cutting. DECRIS scores and two outcome sets (cost and schedule performance) were collected from fourteen sample projects assessed in the previous section. PDRI assessment data from the previous research were used for a PDRI score crisp set. The four crisp sets were calibrated to the fuzzy sets specified in the Table 9 using “fsQCA 3.0” program with 95% confidence level.
A truth table result was calculated, as shown in Table 10, to review the consistency of causal sets, DECRIS score and PDRI score, and the effect on the outcome.
Elliott and Ragin suggested that the basis of consistency level should be started from 0.8 and then be adjusted to 0.75 [47]. In this research, the same criteria were used. Two scenarios were selected as significant cases of the truth table analysis. In case both the DECRIS and PDRI scores are high, the construction schedule delay is increased. In addition, in case the DECRIS score is high and the PDRI score is low, then the construction schedule delay is also increased.
High_DECRIS * High_PDRI + High_DECRIS * Low_PDRI = Construction schedule delay
where * indicates “logical AND” and the + indicates “logical OR”.
This result can be simplified as below because a construction schedule is delayed regardless Low_PDRI or High_PDRI, and High_DECRIS leads to construction schedule delay.
High_DECRIS = Construction Schedule Delay
where consistency = 0.897 and coverage = 0.913.
The next step of the fsQCA is to perform a condition review of each component of a causal set. The result of a necessary condition review shows that high DECRIS score at steel cutting session has 0.91 consistency and 0.90 coverage with construction schedule delay. In contrast, the PDRI score’s significance values are 0.63 of consistency and 0.65 coverage, i.e., lower than the acceptance criteria, 0.75–0.8. This means that High DECRIS at steel cutting leads to construction schedule delays, regardless of the PDRI score.
Another fsQCA was carried out for the same causal set (DECRIS and PDRI score) and another outcome set (construction cost overrun). The truth table analysis specified a similar result as the previous fsQCA for schedule performance. The following logical formula was obtained, meaning that high DECRIS score leads to a construction cover overrun.
High_DECRIS = Construction Cost Overrun
where Consistency = 0.85, Coverage = 0.78.
The causal set review result shows that the PDRI tool was developed to assess project definitions at the front-end loading stage before EPC contract award. The PDRI concerns are on the macro scale of the project; thus, the correlation between construction performance and PDRI scores is statistically weak. Alternatively, the DECRIS model focuses on detailed engineering completion at the EPC project execution stage for the EPC contractor’s implementation; thus, the DECRIS elements contain detailed contents of detailed engineering. Therefore, the DECRIS score is more adequate to predict the construction cost/schedule performance effected by detailed engineering.
The weight factor of each element included in the existing DECRIS model was normalized using simple statistics such as fitting to standard distribution, boxplot, outlier exemption, etc. [8]. Alternatively, this paper’s research adopts the FIS and AHP to calculate a precise set of weight factor of each DECRIS element. To verify the performance of the AHP/FIS DECRIS model, a comparison of two DECRIS models using regression analysis results was performed at each key milestone. The presented DECRIS method represents an improvement, having a mean R squared value increase of 6.9% from the existing DECRIS model (increased from 0.575 to 0.615) for the cost performance–DECRIS score correlations. Similarly, there is a 4.1% of the R squared value increase on schedule performance. The results suggest that the prediction performance of the DECRIS model using AHP and FIS is stronger than the existing simple statistics model.
Through the direct and indirect verification using several statistical tools described in this section, most of the offshore oil and gas EPC projects were found to have engineering risks jeopardizing construction costs and schedule performance. The EPC contractor could use the modified DECRIS model to measure the engineering and subsequent construction risks and to mitigate the risks with EPC bid contingency before awarding the contract, and with recovery strategies thereafter.

6. Conclusions

A correlation between the engineering completion rating and construction cost/schedule performance was analyzed using various statistical methods, FIS, AHP and fsQCA at five key engineering milestones from the EPC contract award to steel cutting. The DECRIS thresholds at the five key engineering milestones were calculated and verified as 810, 660, 500, 380 and 300, respectively. A set of regression analyses was then performed, resulting in ten (10) regression functions and associated R squared values in the range of 0.58 to 0.86. The analysis results describes acceptable statistical significances of every regression function and independent t-test in both cost and schedule performance. Additionally, trade-off optimization on engineering resources and construction resources was suggested with case study result. In the case study, the authors found that the overall cost impact including engineering and construction resources were reasonably estimated using DECRIS model, i.e., within the 0.8 sigma of actual cost impact. The modified DECRIS model was found to be an improvement from the previous DECRIS (using simple statistics) and existing commercial PDRI model. The main contribution of the research is that EPC contractors could continuously forecast construction costs and schedule performance, and can review the adequacy of engineering resources, assessing the trade-off between said resources and cost/schedule risk mitigation.
Another contribution of this research is to provide a basis for assessments of construction costs/schedule performance. Previous tools depend solely on the subjective judgement of industrial experts and on-site staff. In this research, the DECIS assessment method is supplemented with the decision-making support tool FIS to calculate engineering completion rating measurements for completion level and accuracy level. With this approach, the DECRIS model makes it possible to be objective and yields accurate assessments using EDMS.

Future Research

The DECRIS model could be expanded to the entire detailed engineering duration rather than limiting assessment to key milestones from the EPC contract being awarded to steel cutting. The DECRIS model could also be expanded to include the earned value management (EVM) systems. The planned value would be earned with curve fitting from historical data, the earned values would be data mined from EDMS and earned value model would be the DECRIS assessment values. The engineering EVMS using DECRIS will be developed and compared with the other EVMS model. With the DECRIS EVMS system, the project team in EPC contractors can monitor the real time performance of detailed engineering, as well as the predicted effect on construction and the subsequent and sustainable risk mitigation strategies.
In addition, the DECRIS model could be expanded to forecast procurement costs and schedule performances (long lead equipment and bulk materials) by incorporating detailed engineering maturities. Gate #2 (Major equipment procurement) and Gate #3 (AFD P&ID) in this research are of the milestones of procurement, as well as the key engineering milestones. Through design maturity assessment utilizing DECRIS, EPC contractors could predict the rate of supplier variation order caused by engineering changes, and manage risk mitigation strategies by trade-off optimization among engineering, procurement and construction costs.

Author Contributions

M.H.K. developed the research concepts and drafted the manuscript. H.S.C. provided industry feedback on the research and E.B.L. reviewed and revised the manuscript and supervised the overall work. All the authors read and approved the final manuscript.

Funding

The authors acknowledge that this research was sponsored by the Ministry of Trade Industry and Energy (MOTIE/KEIT) Korea through the Technology Innovation Program funding for: (1) Artificial Intelligence Big-data (AI-BD) Platform for Engineering Decision-support Systems (grant number = 20002806); and (2) Intelligent Project Management Information Systems (i-PMIS) for Engineering Projects (grant number = 10077606).

Acknowledgments

The authors of this study would like to thank Hyundai Heavy Industries Co for their informational support and technical cooperation. The authors would like to thank C. J. Lee at POSTECH University and D. S. Alleman (a Ph. D. candidate in Univ. of Colorado at Boulder) for their academic inputs and feedback on this research.

Conflicts of Interest

The authors declare no conflict of interest.

References

  1. Garratt, A.; Vahey, S.P.; Zhang, Y. Real-time forecast combinations for the oil price. J. Appl. Econom. 2018. [Google Scholar] [CrossRef]
  2. Kutsal, E.A.F. Oil Production Capex: Is a Rebound in Sight? 2016. Available online: https://www.mckinseyenergyinsights.com/insights/oil-production-capex-is-a-rebound-in-sight/ (accessed on 19 November 2018).
  3. Albert, J. Guest Editorial: Delivering Long-Term Value in E&P. J. Pet. Technol. 2018, 70, 14–15. [Google Scholar] [CrossRef]
  4. BP Global. BP Energy Outlook 2017. Technical Report. 2017. Available online: https://www.bp.com/content/dam/bp/pdf/energy-economics/energy-outlook-2017/bp-energy-outlook-2017.pdf (accessed on 19 November 2018).
  5. Ullah, K.; Abdullah, A.H.; Nagapan, S.; Suhoo, S.; Khan, M.S. Theoretical framework of the causes of construction time and cost overruns. In IOP Conference Series: Materials Science and Engineering; IOP Publishing: Bristol, UK, 2017; Available online: http://iopscience.iop.org/article/10.1088/1757-899X/271/1/012032/meta (accessed on 19 November 2018).
  6. Sambasivan, M.; Soon, Y.W. Causes and effects of delays in Malaysian construction industry. Int. J. Proj. Manag. 2007, 25, 517–526. [Google Scholar] [CrossRef]
  7. Le-Hoai, L.; Lee, Y.D.; Lee, J.Y. Delay and cost overruns in Vietnam large construction projects: A comparison with other selected countries. KSCE J. Civ. Eng. 2008, 12, 367–377. [Google Scholar] [CrossRef]
  8. Kim, M.H.; Lee, E.B.; Choi, H.S. Detail Engineering Completion Rating Index System (DECRIS) for Optimal Initiation of Construction Works to Improve Contractors’ Schedule-Cost Performance for Offshore Oil and Gas EPC Projects. Sustainability 2018, 10, 2469. [Google Scholar] [CrossRef]
  9. Iyer, K.; Jha, K. Critical factors affecting schedule performance: Evidence from Indian construction projects. J. Constr. Eng. Manag. 2006, 132, 871–881. [Google Scholar] [CrossRef]
  10. Rajan, T.A.; Gopinath, G.; Behera, M. PPPs and project overruns: Evidence from road projects in India. J. Constr. Eng. Manag. 2013, 140, 04013070. [Google Scholar] [CrossRef]
  11. Salunkhe, A.A.; Patil, R.S. Effect of construction delays on project time overrun: Indian scenario. Int. J. Res. Eng. Technol. 2014, 3, 543–547. [Google Scholar]
  12. Lee, J.K. Cost overrun and cause in Korean social overhead capital projects: Roads, rails, airports, and ports. J. Urban Plan. Dev. 2008, 134, 59–62. [Google Scholar] [CrossRef]
  13. Koushki, P.; Al-Rashid, K.; Kartam, N. Delays and cost increases in the construction of private residential projects in Kuwait. Constr. Manag. Econ. 2005, 23, 285–294. [Google Scholar] [CrossRef]
  14. Senouci, A.; Ismail, A.; Eldin, N. Time delay and cost overrun in Qatari public construction projects. Procedia Eng. 2016, 164, 368–375. [Google Scholar] [CrossRef]
  15. Olawale, Y.A.; Sun, M. Cost and time control of construction projects: Inhibiting factors and mitigating measures in practice. Constr. Manag. Econ. 2010, 28, 509–526. [Google Scholar] [CrossRef]
  16. Lee, H.C.; Lee, E.B.; Alleman, D. Schedule Modeling to Estimate Typical Construction Durations and Areas of risk for 1000 MW Ultra-Critical Coal-Fired Power Plants (Major Risk Factors and Mitigations Identified Through a Case Study of Ultra-Critical Coal-Fired Power Plants in Korea). Energies 2018, 11, 2850. [Google Scholar] [CrossRef]
  17. Jo, S.H.; Lee, E.B.; Pyo, K.Y. Integrating A Procurement Management Process into Critical Chain Project Management (CCPM): A Case-Study on Oil and Gas Projects, the Piping Process. Sustainability 2018, 10, 1817. [Google Scholar] [CrossRef]
  18. Kostka, G.; Fiedler, J. Large Infrastructure Projects in Germany: Between Ambition and Realities; Springer: New York, NY, USA, 2016. [Google Scholar]
  19. Sinesilassie, E.G.; Tabish, S.Z.S.; Jha, K.N. Critical factors affecting schedule performance: A case of Ethiopian public construction projects—Engineers’ perspective. Eng. Constr. Arch. Manag. 2017, 24, 757–773. [Google Scholar] [CrossRef]
  20. Ameh, O.J.; Soyingbe, A.A.; Odusami, K.T. Significant factors causing cost overruns in telecommunication projects in Nigeria. J. Constr. Dev. Ctries 2010, 15, 49–67. [Google Scholar]
  21. Amu, O.O.; Adesanya, D.A. Mathematical expressions for explaining project delays in South Western Nigeria. Singap. J. Sci. Res. 2011, 1, 59–67. [Google Scholar]
  22. Dosumu, O.; Aigbavboa, C. An assessment of the causes, cost effects and solutions to design-error-induced variations on selected building projects in Nigeria. Acta Structilia 2018, 25, 40–70. [Google Scholar] [CrossRef]
  23. Habibi, M.; Kermanshachi, S.; Safapour, E. Engineering, Procurement and Construction Cost and Schedule Performance Leading Indicators: State-of-the-Art Review. In Proceedings of the Construction Research Congress (ASCE), New Orleans, LA, USA, 2–4 April 2018; Available online: https://ascelibrary.org/doi/abs/10.1061/9780784481271.037 (accessed on 18 November 2018).
  24. Shrestha, P.P.; Burns, L.A.; Shields, D.R. Magnitude of construction cost and schedule overruns in public work projects. J. Constr. Eng. 2013, 2013, 9. [Google Scholar] [CrossRef]
  25. Chang, A.S.T. Reasons for cost and schedule increase for engineering design projects. J. Manag. Eng. 2002, 18, 29–36. [Google Scholar] [CrossRef]
  26. Love, P.E.; Wang, X.; Sing, C.P.; Tiong, R.L. Determining the probability of project cost overruns. J. Constr. Eng. Manag. 2012, 139, 321–330. [Google Scholar] [CrossRef]
  27. Wong, K.; Vimonsatit, V. A study of the factors affecting construction time in Western Australia. Sci. Res. Essays 2012, 7, 3390–3398. [Google Scholar] [CrossRef]
  28. Ahsan, K.; Gunawan, I. Analysis of cost and schedule performance of international development projects. Int. J. Proj. Manag. 2010, 28, 68–78. [Google Scholar] [CrossRef]
  29. Ishii, N.; Takano, Y.; Muraki, M. An order acceptance strategy under limited engineering man-hours for cost estimation in Engineering–Procurement–Construction projects. Int. J. Proj. Manag. 2014, 32, 519–528. [Google Scholar] [CrossRef]
  30. Moreau, K.A.; Back, W.E. Improving the design process with information management. Autom. Constr. 2000, 10, 127–140. [Google Scholar] [CrossRef]
  31. Alsakini, W.; Wikström, K.; Kiiras, J. Proactive schedule management of industrial turnkey projects in developing countries. Int. J. Proj. Manag. 2004, 22, 75–85. [Google Scholar] [CrossRef]
  32. Mahmoud-Jouini, S.B.; Midler, C.; Garel, G. Time-to-market vs. time-to-delivery: Managing speed in Engineering, Procurement and Construction projects. Int. J. Proj. Manag. 2004, 22, 359–367. [Google Scholar] [CrossRef]
  33. Safapour, E.; Kermanshachi, S.; Habibi, M.; Shane, J. Resource-Based Exploratory Analysis of Project Complexity Impact on Phase-Based Cost Performance Behavior. Construction Research Congress 2018. Available online: https://ascelibrary.org/doi/abs/10.1061/9780784481271.043 (accessed on 18 November 2018).
  34. PM Solutions. Strategies for Project Recovery. 2011. Available online: http://www.pmsolutions.com/collateral/research (accessed on 18 November 2018).
  35. Dumont, P.R. Project Definition Rating Index (PDRI) for Industrial Projects. Ph.D. Thesis, University of Texas at Austin, Austin, TX, USA, 1995. [Google Scholar]
  36. Lipke, W.; Zwikael, O.; Henderson, K.; Anbari, F. Prediction of project outcome: The application of statistical methods to earned value management and earned schedule performance indexes. Int. J. Proj. Manag. 2009, 27, 400–407. [Google Scholar] [CrossRef]
  37. Narbaev, T.; De Marco, A. An earned schedule-based regression model to improve cost estimate at completion. Int. J. Proj. Manag. 2014, 32, 1007–1018. [Google Scholar] [CrossRef]
  38. Al-Harbi, K.M.A.S. Application of the AHP in project management. Int. J. Proj. Manag. 2001, 19, 19–27. [Google Scholar] [CrossRef] [Green Version]
  39. Saaty, T.L. Decision making with the analytic hierarchy process. Int. J. Serv. Sci. 2008, 1, 83–98. [Google Scholar] [CrossRef]
  40. Saaty, T.L. Decision-making with the AHP: Why is the principal eigenvector necessary. Eur. J. Oper. Res. 2003, 145, 85–91. [Google Scholar] [CrossRef]
  41. Mu, E.; Pereyra-Rojas, M. Practical Decision Making: An Introduction to the Analytic Hierarchy Process (AHP) Using Super Decisions; Springer: New York, NY, USA, 2016; Volume 2. [Google Scholar]
  42. Guillaume, S. Designing fuzzy inference systems from data: An interpretability-oriented review. IEEE Trans. Fuzzy Syst. 2001, 9, 426–443. [Google Scholar] [CrossRef] [Green Version]
  43. Zadeh, L.A. Fuzzy sets. Inf. Control 1965, 8, 338–353. [Google Scholar] [CrossRef] [Green Version]
  44. Kim, Y.G.; Lee, E.B. Optimal Investment Timing with Investment Propensity Using Fuzzy Real Options Valuation. Int. J. Fuzzy Syst. 2018, 20, 1888–1900. [Google Scholar] [CrossRef]
  45. Amindoust, A.; Ahmed, S.; Saghafinia, A.; Bahreininejad, A. Sustainable supplier selection: A ranking model based on fuzzy inference system. Appl. Soft Comput. 2012, 12, 1668–1677. [Google Scholar] [CrossRef]
  46. Pedrycz, W. Why triangular membership functions? Fuzzy Sets Syst. 1994, 64, 21–30. [Google Scholar] [CrossRef]
  47. Elliott, T. Fuzzy Set Qualitative Comparative Analysis; Research Notes: Statistics Group; UCI: Irvine, CA, USA, 2013. [Google Scholar]
  48. Mendel, J.M.; Korjani, M.M. A new method for calibrating the fuzzy sets used in fsQCA. Inf. Sci. 2018, 468, 155–171. [Google Scholar] [CrossRef]
  49. Mendel, J.M.; Korjani, M.M. Theoretical aspects of fuzzy set qualitative comparative analysis (fsQCA). Inf. Sci. 2013, 237, 137–161. [Google Scholar] [CrossRef]
  50. Burmaster, D.E.; Anderson, P.D. Principles of good practice for the use of Monte Carlo techniques in human health and ecological risk assessments. Risk Anal. 1994, 14, 477–481. [Google Scholar] [CrossRef] [PubMed]
  51. Kline, R.B. Principles and Practice of Structural Equation Modeling; Guilford Publications: New York, NY, USA, 2015. [Google Scholar]
Figure 1. WTI Price and Oil Production CAPEX (2010-2021) (modified from Garatt and Kutsal [1,2]).
Sustainability 11 01256 g001
Figure 2. Break-even prices for different asset classes (Modified from Albert [3]).
Sustainability 11 01256 g002
Figure 3. Research Process.
Sustainability 11 01256 g003
Figure 4. FIS Input and Outcome Membership Functions.
Sustainability 11 01256 g004
Figure 5. Predicted Cost Performance of the Project_N.
Sustainability 11 01256 g005
Figure 6. Cost Impact Calculation.
Sustainability 11 01256 g006
Figure 7. Trade-off Optimization Result of Engineering Resource Enhancement on a Case Study.
Sustainability 11 01256 g007
Figure 8. DECRIS cutoff score and upper/lower limits.
Sustainability 11 01256 g008
Table 1. Selected Five Key Milestones for Offshore EPC Projects.
Gate No.DefinitionAlternative DefinitionMilestone
#1FEED VerificationEffective DateContract Award(CA)
#2Equipment Procurement30% Modeling ReviewCA + 6 months
#3AFD P&ID a60% Modeling ReviewCA + 9 months
#4AFC P&ID b90% Modeling ReviewCA + 12 months
#5Steel CuttingWork OrderCA + 15 months
a Approval for design, piping and instrumentation diagram. b Approval for construction, piping and instrumentation diagram.
Table 2. Criteria Weight Vector Table of the DECRIS Sections.
Section ISection IISection IIISumWeight Factor
Section I—Basis of Detail Design0.1750.1720.1890.540.179
Section II—Engineering Deliverables0.6770.6660.6531.990.665
Section III—Execution Approach0.1480.1620.1590.470.157
Sum11131
Note: λmax = 3.0013, CI = 0.0007, RI = 0.58 (3 × 3 AHP), CR = 0.0011 < 0.1, AHP result are acceptable.
Table 3. Comparison of weight factor for each section.
DECRIS SectionsWeight aWeight bDifference
Section I—Basis of Detail Design0.1660.179+0.013
Section II—Engineering Deliverables0.6730.665−0.008
Section III—Execution Approach0.1610.157−0.004
a Weight in existing DECRIS using summation of absolute singleton weight factor of each element. b Weight in modified DECRIS adjusted using AHP and FIS.
Table 4. Weight Factor of Each DECRIS element modified with FIS and AHP (modified from Kim [8]).
CodeDescriptionWFCodeDescriptionWF
IBasis of Detail Design FStructural and Architectural
AProject Scope F1Structural Requirements15
A1Project Objectives Statement10F2Structural Analysis16
A2Project Scope of Work18F3Structural/Architectural Drawing13
A3Project Philosophies14F4Weight Control Report15
BProject Performance Requirement GInstrument and Electrical
B1Products14G1Control Philosophy15
B2Capacities14G2Logic Diagrams15
B3Technology13G3Cable Schedule14
B4Processes15G4Hook-up Diagram14
CDesign Guideline G5Critical Electrical Item lists14
C1Process Design Criteria17G6Electrical Single Line Diagrams15
C2Project Site Assessment15G7Instrument and electrical Specifications15
C3Lead discipline Scope of Work15HMaterial Take-Off
C4Project Schedule18H1Piping MTO (Material Take Off)15
C5Constructability Analysis16H2Structural and Architectural MTO15
IIEngineering Deliverables H3Instrument and Electrical Bulk Item MTO15
DProcess/Mechanical/Piping I3D modeling
D1Process Flow Diagrams15I13D Modeling Review17
D2Heat and Material Balances14I23D Modeling Input (Equipment/Piping)16
D3Piping/Instrumentation Diagrams18I33D Modeling Input (Structural)15
D4Process Safety Management (PSM)14I43D Modeling Input (Architectural)15
D5Utility Flow Diagrams14I53D Modeling Input (Instrument/Electrical)15
D6Process Datasheets15JGeneral Facility Requirement
D7Equipment Mechanical Datasheets15J1Preservation and Storage Requirement11
D8Specifications16J2Transportation Requirement13
D9Piping System Requirements14J3Welding Procedure Specification16
D10Plot Plan16IIIExecution Approach
D11Mechanical Equipment List13KEngineering Project Management
D12Line Lists13K1Team Participants and Roles13
D13Tie-in Lists13K2Engineering/Construction Methodology14
D14Piping Stress Analysis15K3Deliverables for Design and Construction15
D15Piping Isometric Drawings13K4Commissioning/Close-out Deliverables13
D16Piping Specialty Items Lists12K5Owner Approval Requirements14
D17Instrument Index12K6Interface Management/Communication15
EEquipment Vendor K7Risk Analysis14
E1Equipment Procurement Status14K8Long Lead/Critical Equipment/Materials15
E2In-line/Instrument Procurement Status14LProject Execution Plan
E3Equipment Arrangement Drawings16L1Project Cost Estimate and Control15
E4Process and Mechanical Documents14L2Procurement Procedures and Plans14
E5Instrument and Electrical Documents14L3Project Change Control14
E6Structural/Architectural Documents13
E7Equipment Utility Requirements14
Table 5. Sample Calculation of DECRIS Assessment (Section I Category “Project Scope”).
DECRIS ElementCompletenessAccuracyDECRIS Level
Project Objectives Statement3.481.342.48
Project Scope of Work1.082.181.81
Project Philosophies1.681.91.95
Products22.342.37
Capacities3.882.963.84
Table 6. DECRIS Assessment Result for five Gates.
ProjectGate #1
(Effective Date)
Gate #2
(30% Modeling)
Gate #3
(60% Modeling)
Gate #4
(90% Modeling)
Gate #5
(Work Order)
A817 661 534 452 326
B872 725 574 490 416
C785 630 478 333 270
D822 665 507 382 288
E790 644 477 350 299
F814 687 518 444 367
G806 661 520 360 341
H824 668 520 426 366
I790 628 431 Outlier247
J799 641 500 356 234
K808 638 466 312 259
L796 630 481 336 252
M813 658 518 468 302
X848 696 521 420 346
Table 7. A DECRIS group set of Schedule performance at Gate #2 (part of 10 group sets).
High DECRIS Score GroupLow DECRIS Score Group
ProjectDECRIS ScoreCDD
(days)
ProjectDECRIS ScoreCDD
(days)
A661 246 C630 −6
B725 411 E644 82
D665 102 I628 82
F687 305 J641 0
G661 210 K638 16
H668 246 L630 105
X696 198 M658 111
Mean680 245 Mean638 56
Table 8. DECRIS Cutoff Scores and analytical analysis results of each Key Milestone.
Key Engineering MilestoneFEED
Verification
Equipment
Procurement
AFD P&IDAFC P&IDSteel Cutting
DECRIS Cutoff score810660500380300
Regression
analysis
(Cost
performance)
Regression Functiony = 0.0014x − 1.1153 y = 0.0012x − 0.7569y = 0.0009x − 0.4217y = 0.0006x − 0.1788y = 0.0006x − 0.1375
P value (y-intersect)0.00098410.00090720.00342220.00928950.0099672
P value (x1)0.00068750.00053260.00148590.00163700.0010689
R Squared Value0.63120.6460.58290.60940.6042
Statistical SignificanceSignificantSignificantSignificantSignificantSignificant
Independent
T-test (Cost performance)
HomoscedasticityHeteroHeteroHeteroHeteroHetero
P value0.034150.013030.010760.032650.01640
Population homogeneityDifferentDifferentDifferentDifferentDifferent
Regression
analysis
(Schedule performance)
Regression Functiony = 3.9384x − 3051.9y = 3.7735x − 2337.8y = 2.7698x − 1243.2 y = 1.7208x − 523.09 y = 2.115x − 501.01
P value (y-intersect)0.00223890.00012600.00215420.00700390.0000217
P value (x1)0.00158260.00007130.00091350.00118690.0000013
R Squared Value0.57870.74440.6140.63070.8671
Statistical SignificanceSignificantSignificantSignificantSignificantSignificant
Independent
T-test (Schedule performance)
HomoscedasticityHomoHomoHomoHomoHomo
P value0.007270.000580.001570.011920.00042
Population homogeneityDifferentDifferentDifferentDifferentDifferent
Table 9. Fuzzy Set of Variables and Outcomes (Gate #5 Steel Cutting).
ProjectDECRIS AssessmentPDRI AssessmentConstruction Duration Delay
(CDD)
Construction Labor Hour Increase Rate (CLIR)
Variable IDfDECRISSCfPDRISCfCDDfCLIR
A0.66 0.65 0.82 0.30
B0.98 0.23 0.99 1.00
C0.20 0.50 0.07 0.20
D0.32 0.77 0.31 0.37
E0.42 0.65 0.25 0.16
F0.90 0.23 0.92 0.60
G0.77 0.50 0.72 0.59
H0.90 1.00 0.82 0.83
I0.09 0.23 0.25 0.25
J0.06 0.14 0.08 0.28
K0.14 0.35 0.10 0.21
L0.11 0.23 0.32 0.11
M0.44 0.86 0.34 0.89
X0.80 0.14 0.68 0.48
Table 10. Truth Table (Construction Duration Delay).
DECRIS AssessmentPDRI AssessmentNumberConstruction Duration Delay
(CDD)
Consistency
10310.914
11210.880
01300.605
00400.452

