Article

Post-Mortem Analysis of Inhomogeneous Induced Pressure on Commercial Lithium-Ion Pouch Cells and Their Effects

1
Chair of Electrochemical Energy Conversion and Storage Systems, Institute for Power Electronics and Electrical Drives (ISEA), RWTH Aachen University, Jaegerstr. 17/19, 52066 Aachen, Germany
2
Jülich Aachen Research Alliance, JARA-Energy, Forschungszentrum Jülich GmbH, 52425 Jülich, Germany
3
Institute for Power Generation and Storage Systems (PGS), E.ON ERC, RWTH Aachen University, Mathieustraße 10, 52074 Aachen, Germany
4
Helmholtz Institute Münster (HI MS), IEK-12, Forschungszentrum Jülich GmbH, 52425 Jülich, Germany
*
Author to whom correspondence should be addressed.
Sustainability 2019, 11(23), 6738; https://doi.org/10.3390/su11236738
Submission received: 1 November 2019 / Revised: 20 November 2019 / Accepted: 21 November 2019 / Published: 27 November 2019

Abstract

:
This work conducts a post-mortem analysis of a cycled commercial lithium-ion pouch cell under an induced inhomogeneous pressure by using a stainless-steel sphere as a force transmitter to induce an inhomogeneous pressure distribution on a cycled lithium-ion battery. After the cycling, a macroscopic and microscopic optical analysis of the active and passive materials was executed. Also, scanning electron microscopy was used to analyze active material particles. The sphere shape results in a heterogenic pressure distribution on the lithium-ion battery and induces a ring of locally high electrochemical activity, which leads to lithium plating. Furthermore, a surface layer found on the anode, which is a possible cause of electrolyte degradation at the particle–electrolyte interface. Significant deformation and destruction of particles by the local pressure was observed on the cathode. The analysis results validate previous simulations and theories regarding lithium plating on edge effects. These results show that pressure has a strong influence on electrolyte-soaked active materials.

1. Introduction

Today, lithium-ion batteries (LIBs) are omnipresent in everyday life. After their commercial introduction, LIBs have largely superseded other battery technologies due to their superior properties. They are used in nearly all portable devices such as mobile phones, smartwatches, cameras, laptops, e-cigarettes, and power tools. Furthermore, LIBs are increasingly penetrating the automotive market, where the battery is a crucial component for mobility. The battery cells of an electric car still account for the largest share of vehicle costs, and therefore, the lifetime and reliability of this component is essential. In almost every application, LIBs are integrated into housings and must be mechanically clamped. Previous work indicates that the design of a battery module consisting of several battery cells in terms of mechanical bracing is the crucial element of lifetime and reliability. Cannarella et al. showed that too much initial pressure applied to LIBs decreases their lifetime due to closed pores in the separator, which causes undesirable degradation effects [1].
Further work by the same research group shows that these effects can include local lithium deposition and dendrite growth, affecting electrochemical kinetics [2,3,4,5]. Wünsch et al. show that not only the initial pressure is an essential factor for the lifetime of LIBs, but also the type of bracing. Usually, a rigid bracing is used in the construction of LIB modules. Since LIBs with a graphite anode expand during the charging processes, under thermal stress and over a lifetime, the pressure on the cells in the module increases over time [6,7]. According to Wünsch et al., the cycle life can be significantly increased with a quasi-constant force bracing in contrast to the usually applied fixed bracing [7]. From this, it can be deduced that the application of constant pressure can significantly improve the lifetime of LIB modules.
While the work discussed in the previous paragraph analyzed the influence of homogenous pressure in LIB, also inhomogeneous pressure must be considered for real-life applications as the mechanical bracing used in battery modules does not always ensure that the pressure homogeneously distributed. The work of Cannarella and Liu shows that local mechanical deformations of the separator can cause local lithium plating due to inhomogeneous ion flux distributions [4,5]. Furthermore, the work of Tang et al. has shown that lithium plating occurs preferentially at electrodes edges of LIBs due to geometrics effects, which generates overpotential at the edges of the electrodes and leads to conditions which favor lithium plating [8]. Other investigations by Rahe et al. using Nano X-Ray tomography show particle cracks and current-collector corrosion on the cathode side [9], which also leads to a local pressure increase and strongly influences the porosity and thus the tortuosity of the active, cathode and anode, as well as the passive, separator, materials. Another effect observed by Waldmann et al. is that mechanical deformations occur at the jelly roll of a round cell at the end of lifetime. This mechanical deformation induces local inhomogeneous pressure on the active materials [10], which leads to inhomogeneous ion flux distributions and causes lithium plating. Bach et al. linked the sudden degradation effect at the end-of-life of round cells triggered by the appearance of lithium plating confined to small characteristic areas at the jelly roll, generated by heterogeneous compression, and mention the importance of cell and pack design considering a well mechanical bracing without inducing unwanted effects [11].
As presented in the previous paragraph, mechanical defects of the separator are linked to lithium plating. For lithium plating to occur, the local anode potential must be below 0 V vs. Li/Li+ [8,12]. Only under this condition, it is energetically more favorable for the lithium-ions to bond with each other and form metallic lithium. Especially for graphite anodes, lithium dendrites will continue to grow under this condition. Furthermore, as the lithium metal is exposed to the electrolyte, electrolyte degradation products (EDPs) will be produced, so that the lithium dendrites are covered with a thick lithium–electrolyte interface (LEI) [13]. This degradation process directly leads to capacity loss and gas formation. Also, localized defects can lead to local lithium deposition and dendrite growth, and the plating of lithium could trigger a short circuit by the penetration of a thin separator. In the worst case, dendrites can lead to catastrophic failure due to associate these internal short circuits and lead the LIB into the thermal runaway, as it happens in case of the Samsung Galaxy Note 7 [12,14].
Most of the previous work concerning local deformation of the separator and the resulting lithium plating was only carried out on half-cell experiments in the laboratory. The separator was locally deformed before installation in the half-cell causing locally closed separator pores, which lead to uneven ion currents [2,4,5]. There is no work available that has investigated local induced inhomogeneities in commercial pouch cells. Therefore, in this work, local pressure is applied to a commercial high energy pouch cell manufactured by Kokam SLPB526495, and a local deformation applied to the LIB. A stainless-steel sphere used as a force transmitter, which leads to radial inhomogeneous pressure distribution. The LIB cycled under this mechanical load. A post-mortem analysis (PMA) of the cell stack and the active and passive materials was then performed to analyze inhomogeneities in state of charge, surface layer formation, and particle morphology.

2. Materials and Methods

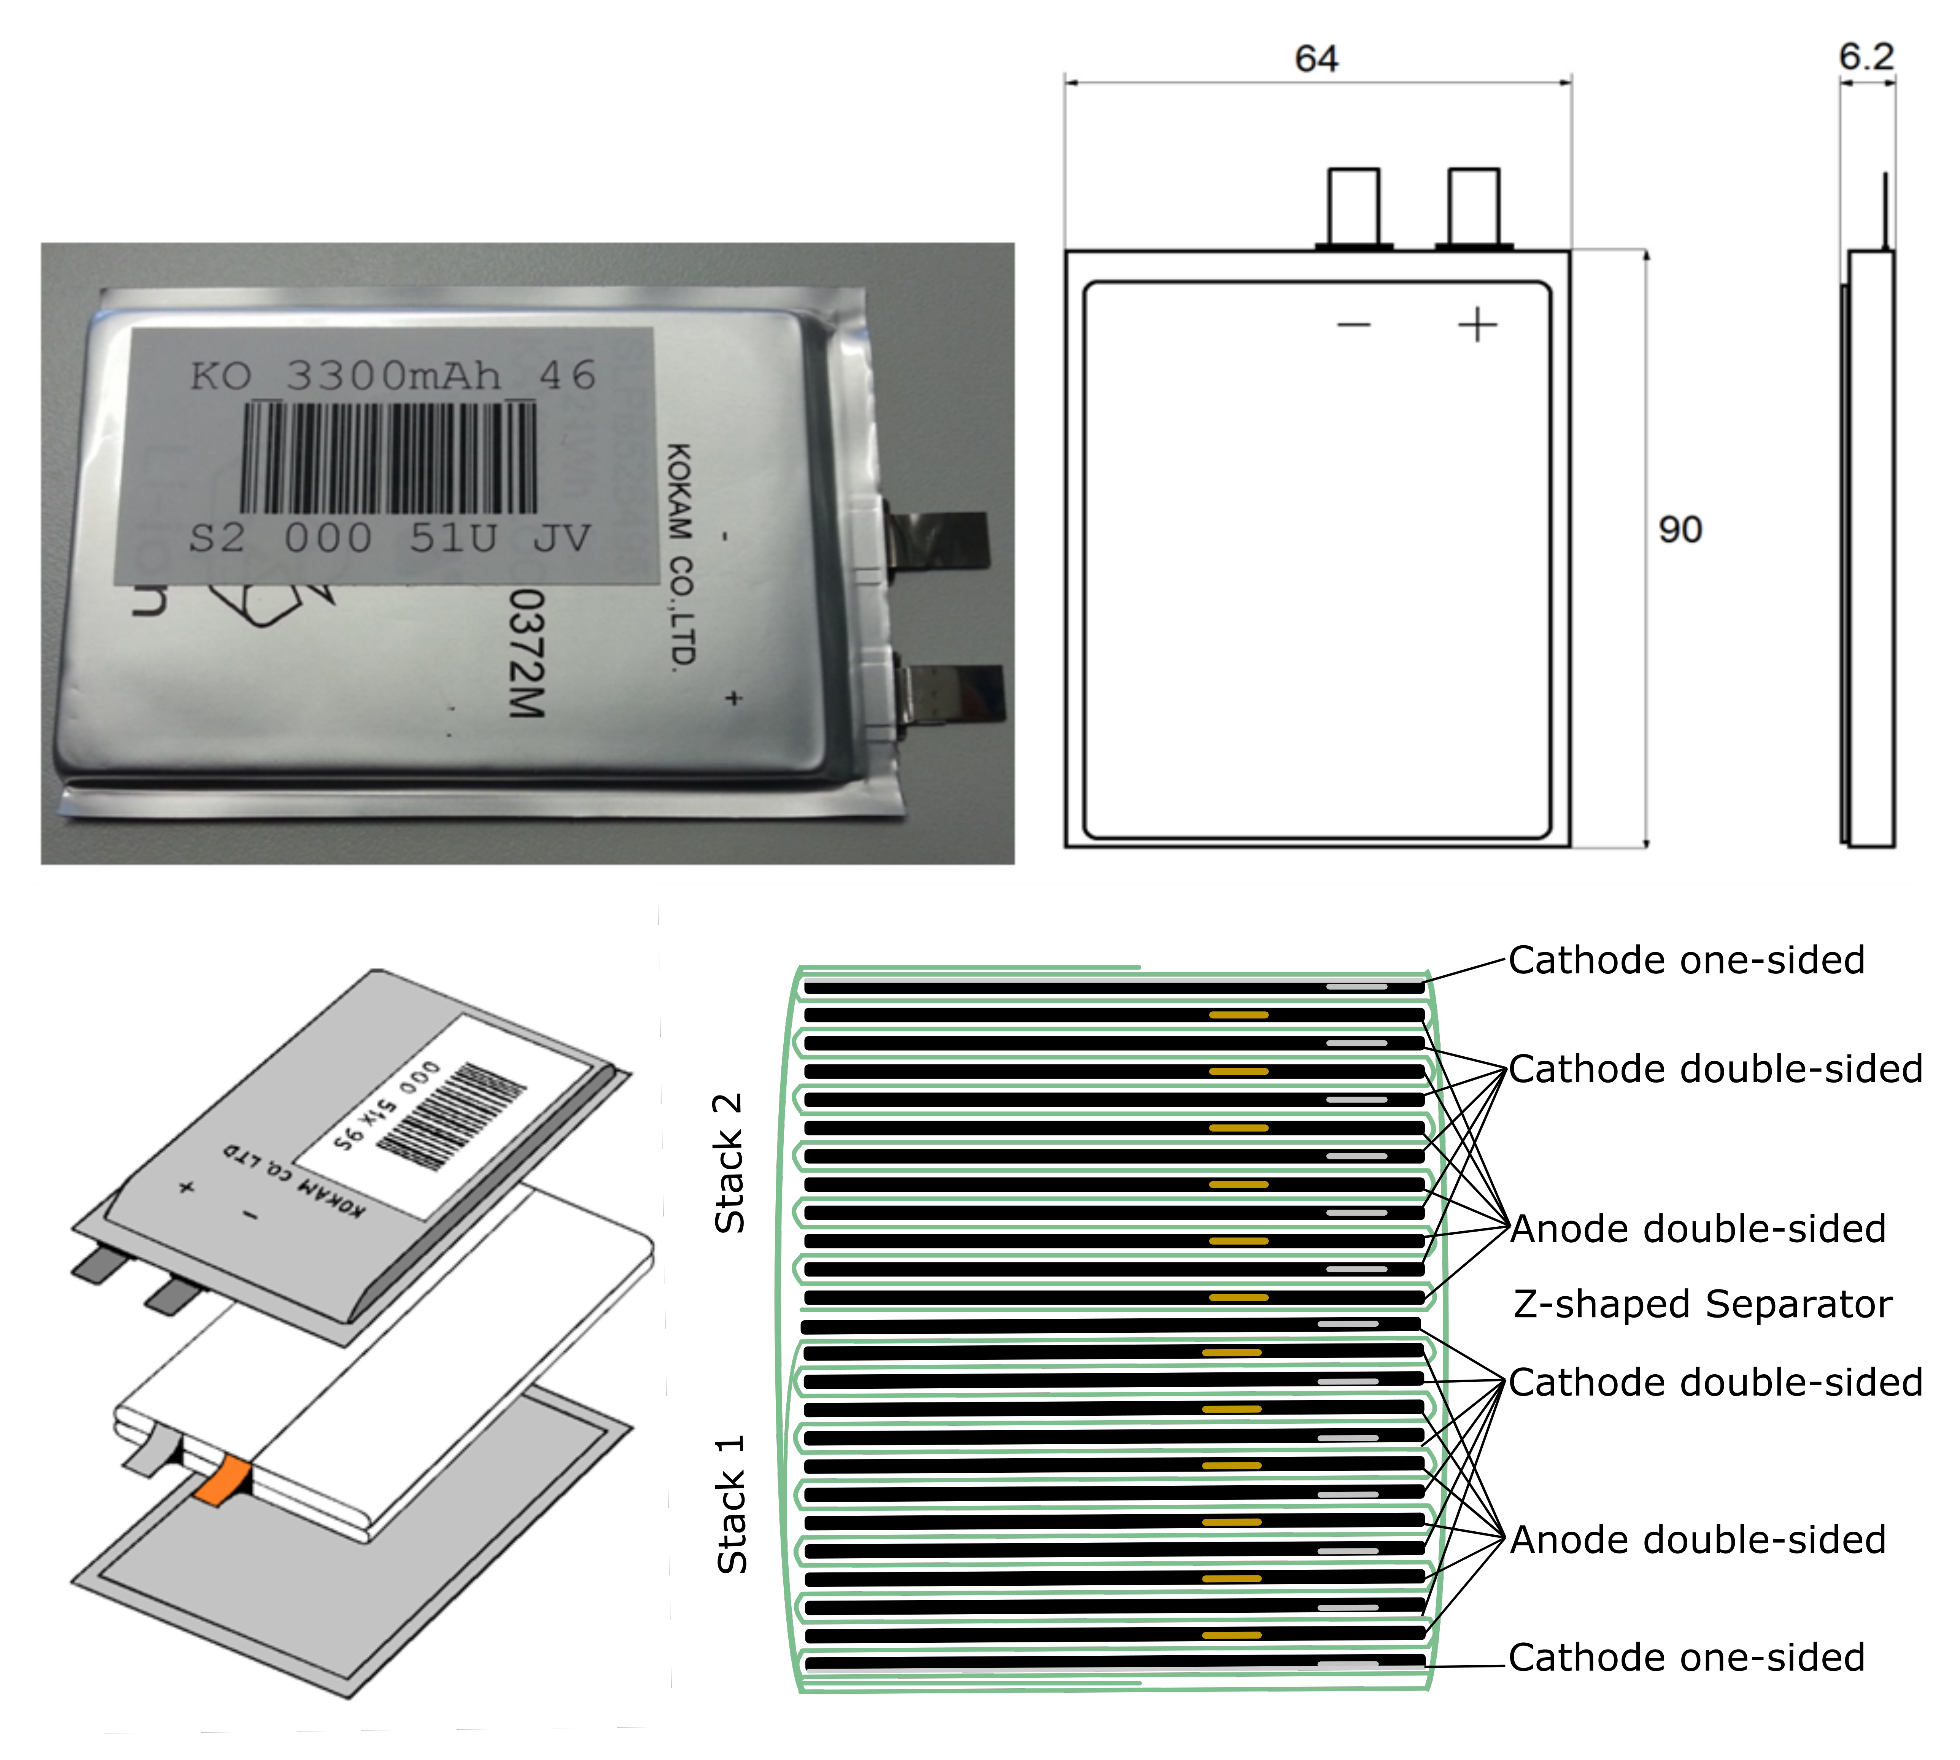
2.1. Investigated Lithium-Ion Battery

For the experiment, a LIB of the manufacturer Kokam SLPB526495 with a capacity of 3.3 Ah is used. The LIB is specified for a charging current of 2C and a voltage range of 2.7 V to 4.2 V between 0 to 45 C . According to the manufacturer, the cell is made of a graphite anode, a Li(NiCo)O 2 cathode, and an EC/EMC mixture with LiPFO 6 as an electrolyte. Figure 1 shows the mechanical structure of the LIB which consists of two electrode stacks connected in parallel. The first stack consists of six double-sided coated anodes, five double-sided coated cathodes, and one one-sided coated cathode. The second stack consists of one additional double-sided cathode. Each stack individually wrapped in a Z-shaped separator.

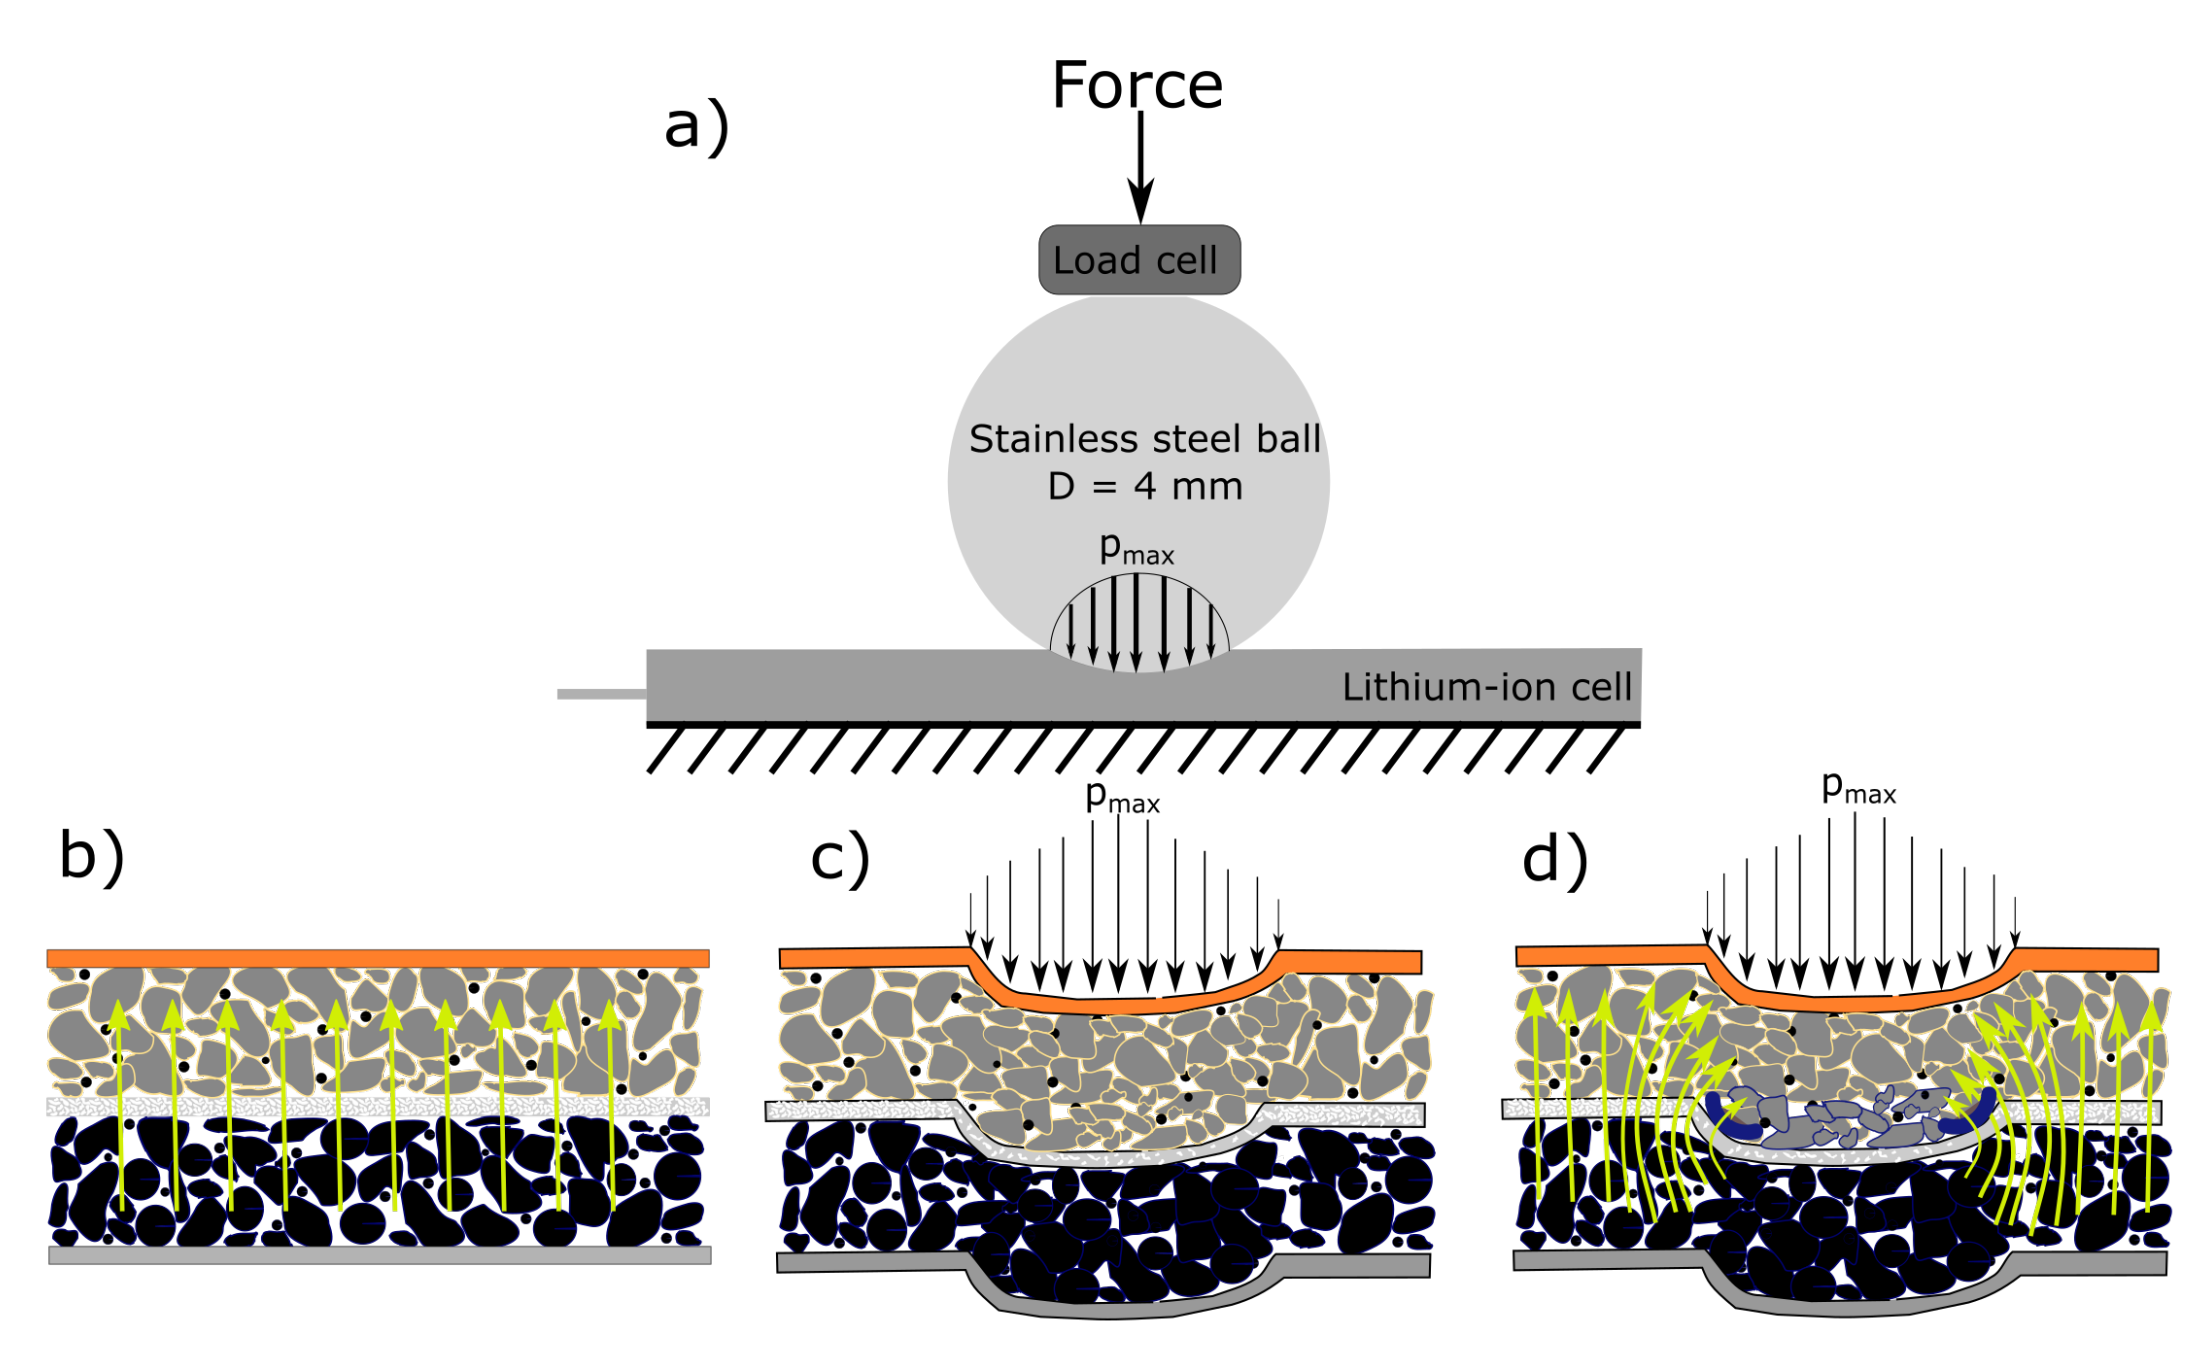
2.2. Experimental Setup

For examination and cycling of the lithium-ion battery, the cell test system Digatron MCFT 20-05-50ME with a current measurement precision of 0.2% is used. The measurement setup during cell cycling depicted in Figure 2a. In order to exert inhomogenous pressure, a stainless-steel sphere with a diameter of 4 mm placed on the center of the cell surface. A quasi-statically force is applied to the sphere via a hydraulic press so that the cell deforms—the applied force is measured with a load cell placed between the sphere and the hydraulic press. The applied pressure was chosen based on the analysis of Wang et al. and Tran et al. to apply as much force as possible without damaging the active material particles. Wang et al. suggests a pressure of 10 to 20 MPa as optimal pressure regarding the compression and contacting of graphite particles during the calendaring process of anodes after coating [15]. According to Tran et al., the pressure during calendaring of NCA cathodes is significantly higher and optimal at 500 to 692 MPa [16]. Therefore, a pressure of 20 MPa was chosen for the experiments.
The applied force by the press in order exert this pressure is calculate based on the formula for Hertzian pressure for a sphere-plane configuration. For this calculation, the Young’s modulus of the LIB must be known. As this quantity varies with cell type and not stated in the cell’s datasheet, different forces were applied to the cell, and the penetration depth was measured using a dial gauge. After this series of tests, a force of 1.4 kN with a penetration depth of 0.8 mm was determined to achieve a maximum pressure of 20 MPa in the center of the area under the sphere. Assuming the LIB to be an elastic body, Young’s modulus can be approximated to be 210 MPa. Nevertheless, since the active materials in LIB are porous and consist of multi-particle components, the force will be distributed over the particles. Therefore, the maximum local pressure could be much higher due to the tiny contact areas of the complex porous particle system. By applying the pressure, defects induced in the materials beneath the sphere. As the pressure decreases towards the edge, Figure 2b–d shows a transition area created where the porosity increases and therefore creates an unevenly increasing ion flux.
Another essential effect of particles in LIBs is the swelling during the lithiation process, and this adds additional local pressure on the contact areas. Also, the deposition of lithium metal will lead to an increase in the local pressure due to thickness change and stress the local particles furthermore.
To analyze the cell aging under the above-described inhomogeneous mechanical pressure, the tested cell then cycled several times. Before cycling, the pressure adjusted to 1.3 kN at a cell voltage of 3.55 V and a temperature of 20 C . After the application of the pressure, the cell relaxed for 30 min and was then charged with 1C to 4.15 V until the force increased to 1.4 kN. The force increases due to the swelling of the graphite anode particles during the charging process [17]. The LIB has then cycled in CC/CV mode three times with a current of 1C between 4.2 V and 2.7 V. The CV-phase takes 30 min in each cycle. During cycling under the hydraulic press, the force fluctuated by a maximum of 150 N. Finally, the cell was fully charged with a current of 1C to 4.2 V and then opened for a post-mortem analysis.
To evaluate the influence of inhomogeneous pressure during the operation of a commercial, two stacked pouch, cell one cycled, and one uncycled were analyzed in this experiment. Subsequently, the surface of carefully selected areas analyzed by scanning electron microscopy analysis (SEM). The electron microscope used was a Leo Supra 35 VP from Carl Zeiss AG with an INCA Energy 200 EDS detector from Oxford Instruments. Best images were recorded using an in-lens BSE detector in a working distance of 7 mm at a high vacuum (10 to 6 mbar) with an acceleration voltage of 5 kV. EDS spot measurements or mappings were carried out at 10 kV. The uncycled cell was opened in a pristine state and acted as a reference cell. Individual dry layers of the anode and cathodes were pressurized with a homogeneous pressure of 30 MPa to have a comparison to the inhomogeneous pressure effects on the electrodes of the LIB.
The cycled LIB was opened fully charged at 4.2 V under argon atmosphere in a glove box, as in the fully charged state, inhomogeneities within the cell can be better identified. A particular property of graphite is a color change depending on the lithiation, i.e., the state of charge. While completely delithiated graphite that corresponds to an SOC of 0% is black or gray and between a lithiation state 0% to 30% the color is very similar to that of the pristine graphite (gray-black), it discolors with increasing lithiation over dark blue (30 to 50% SOC) and red (50 to 90% SOC) to golden (90 to 100% SOC) [18,19]. This property makes it easy to determine the lithiation and thus SOC inhomogeneities of the opened cell.
The cathode electrode compositions are measured with Varian 725 induced coupled plasma-optical emission spectrometer (ICP-OES) (Agilent, Santa Clare, United States of America). For this, a disc of the double-coated electrode with a diameter of 20 mm is taken. This sample is washed with Dimethylcarbonat (Dimethylcarbonat Msynth plus, Merck KGaA, Darmstadt, Germany) before it is dissolved in aqua regia. The solution was filled with distilled water until a 100 ml solution was obtained. This solution was analyzed with the ICP-OES.

3. Results

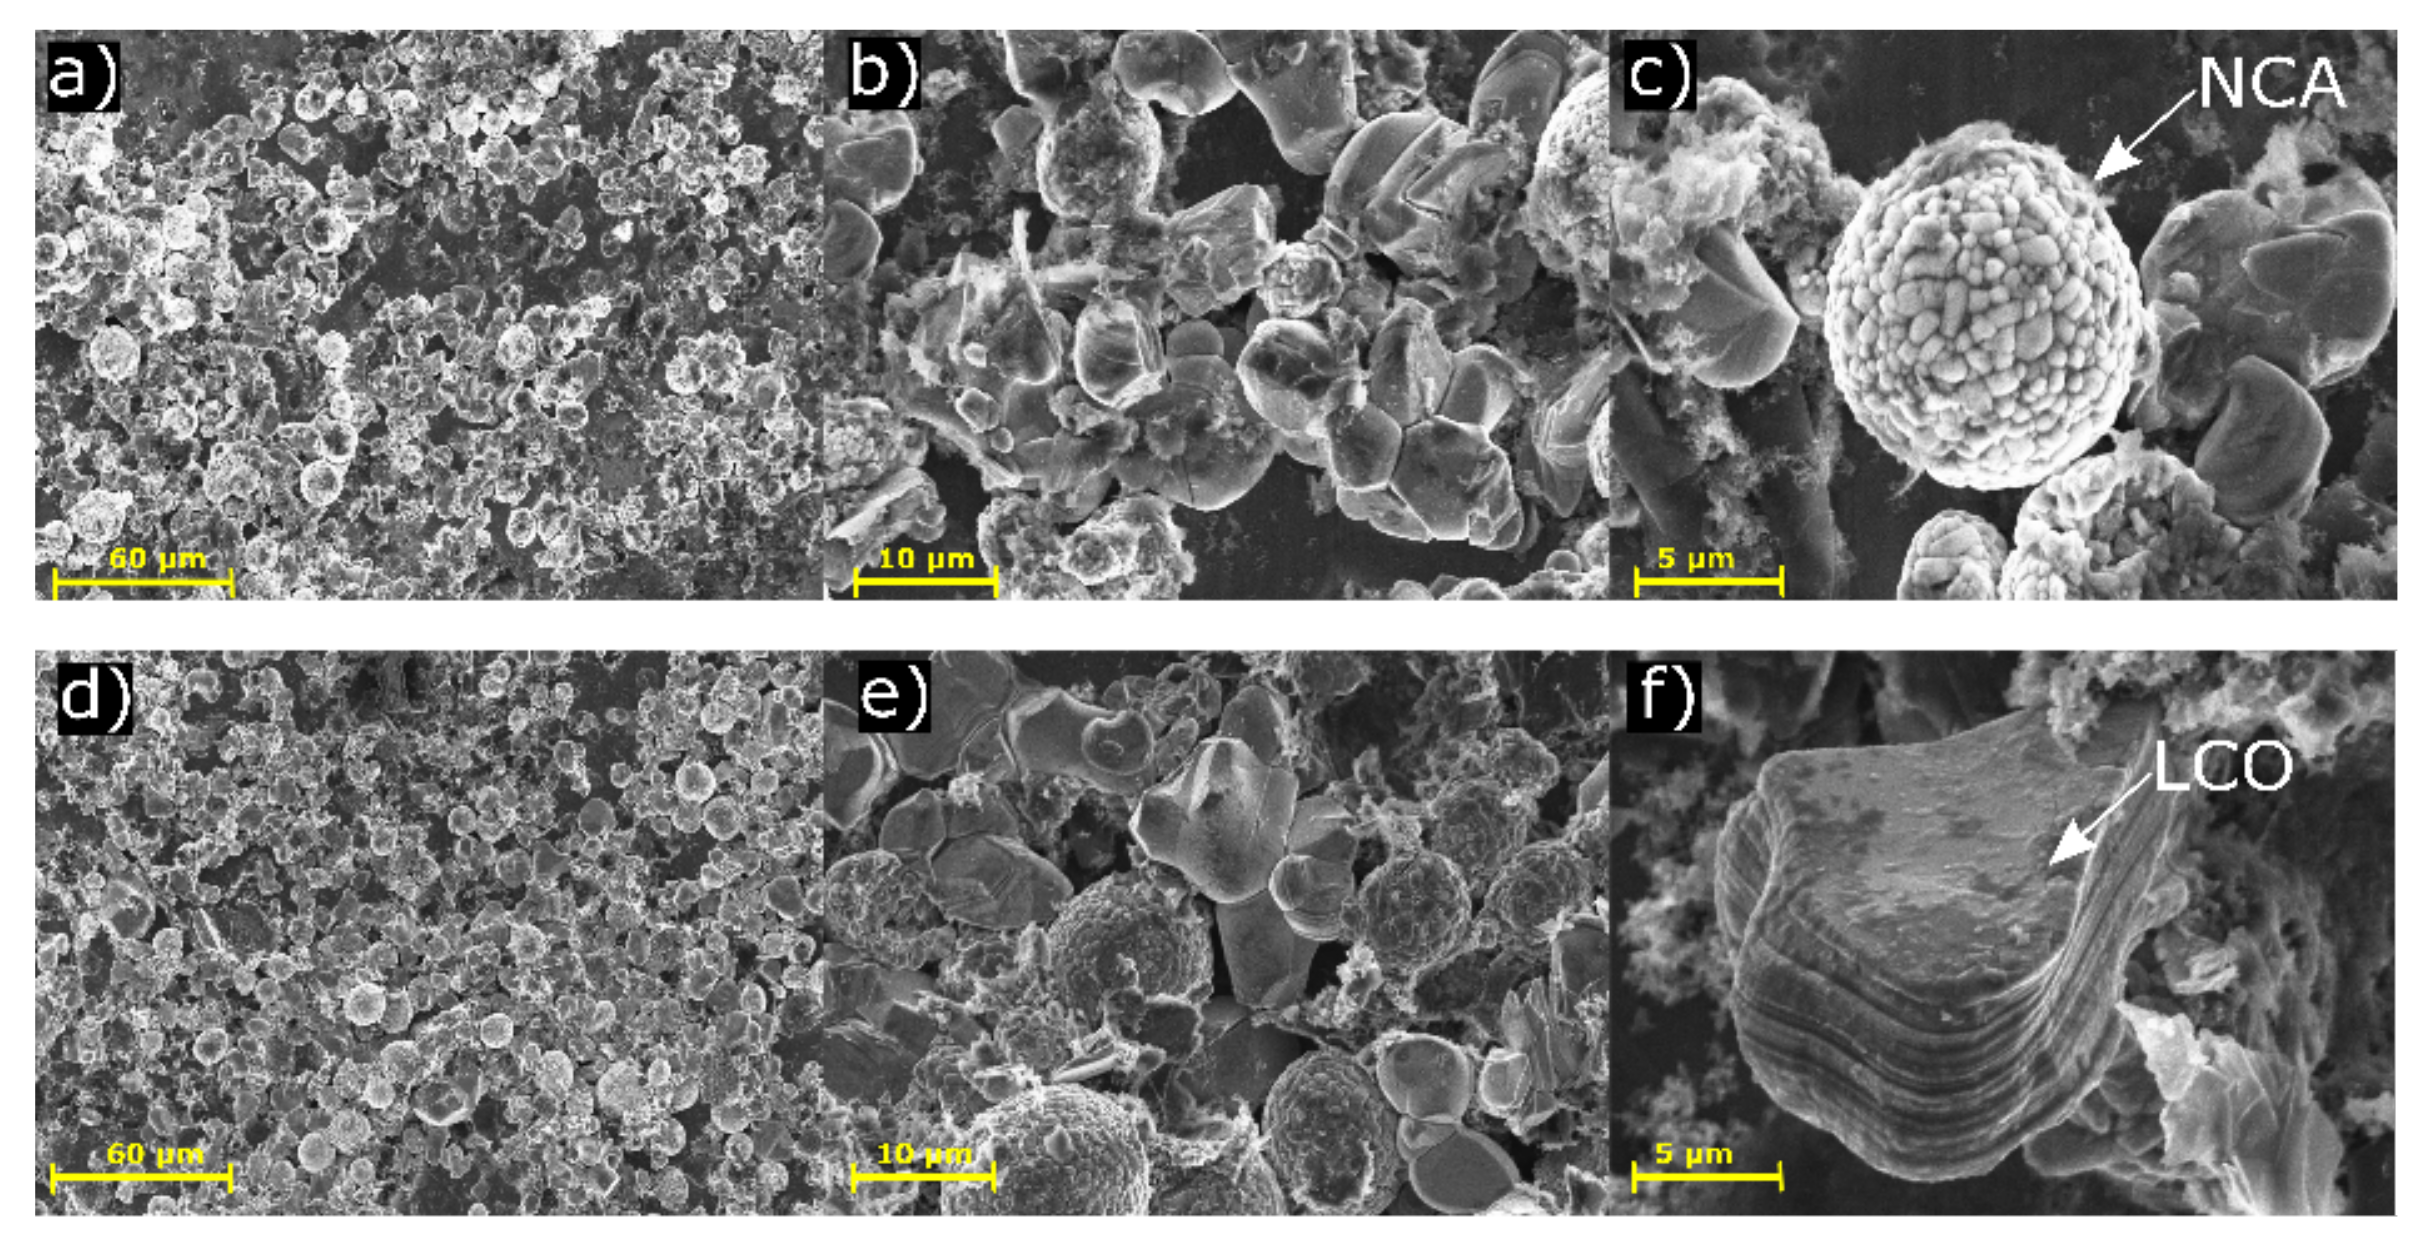
3.1. Cathode Compositions

The ICP-OES and EDX analysis shows that the cathode of the cell contains 64% Ni, 35% Co and 1% Al. Two particle types, a flake shaped layered LiCoO 2 particle, and a spherical LiNiO 2 particle was identified on the cathode by EDX during the SEM analysis. Based on these two analyses, we conclude that the active cathode material is either an NCA/LiCoO 2 mixture, a so-called blend material, or a mixture of LiNiO 2 and LiCoO 2 . As the Al content identified by ICP-OES can also be caused by contamination during the separation of the active cathode material and the aluminum current-collector, both material combinations are possible.

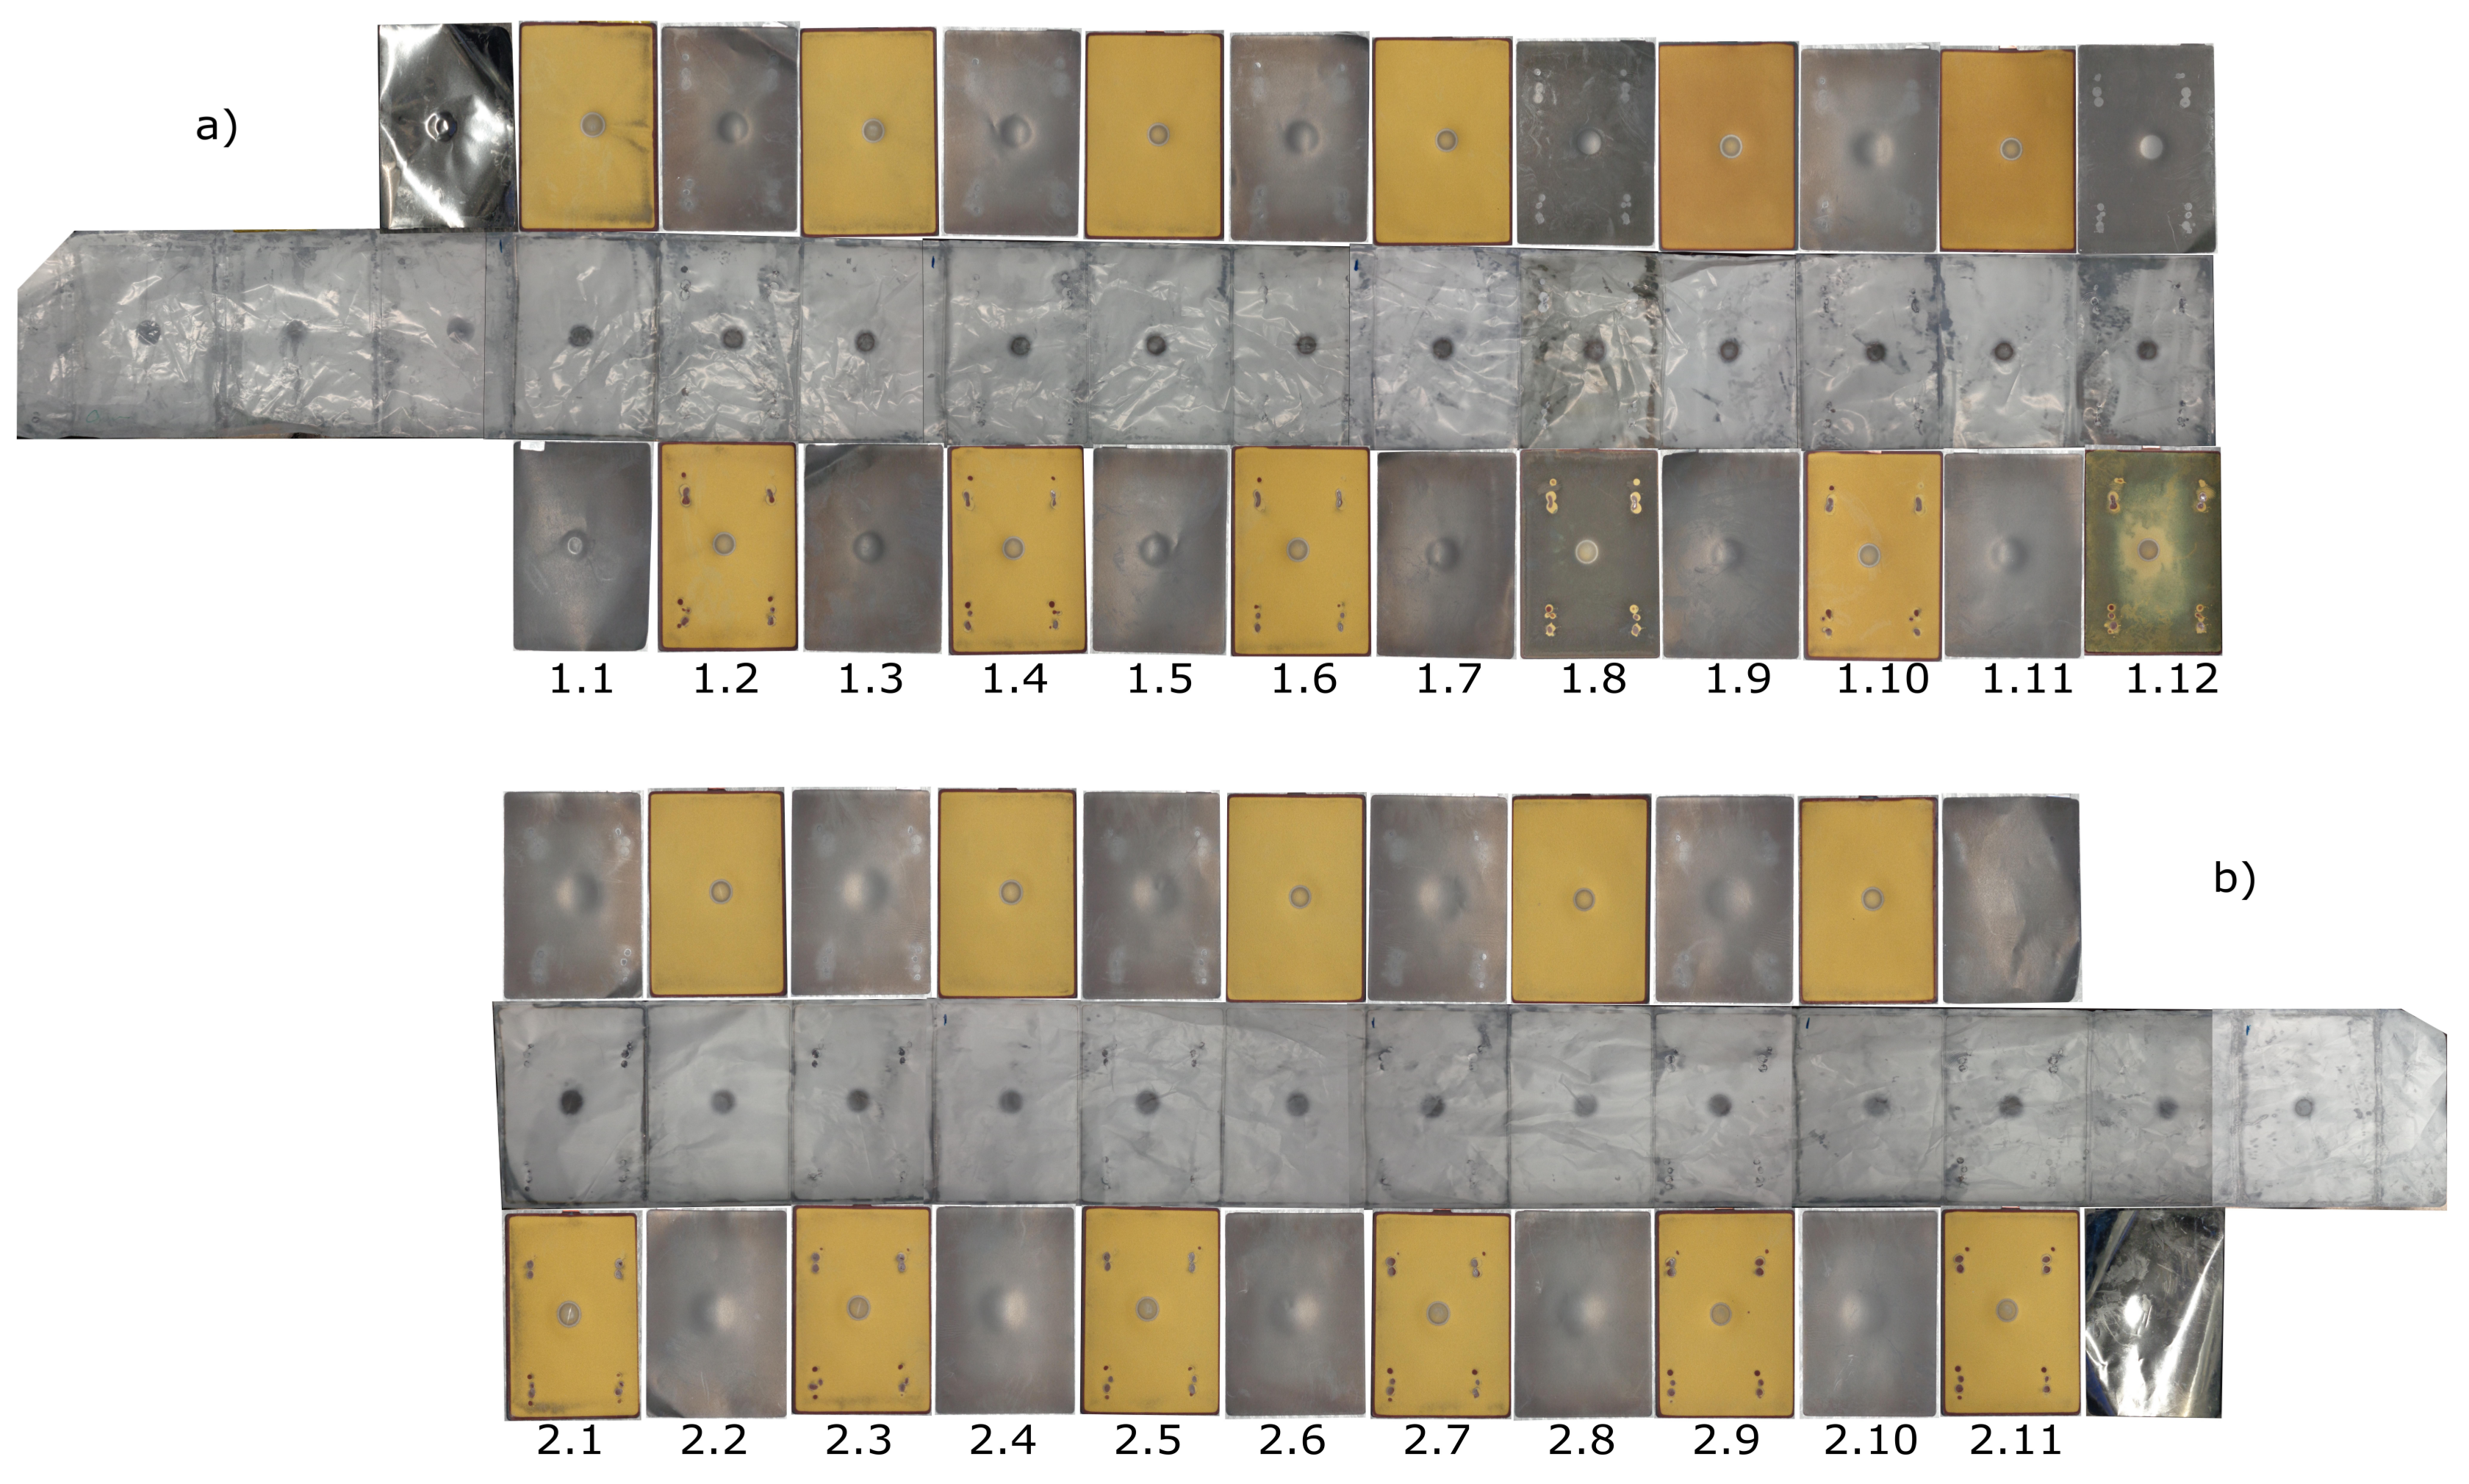
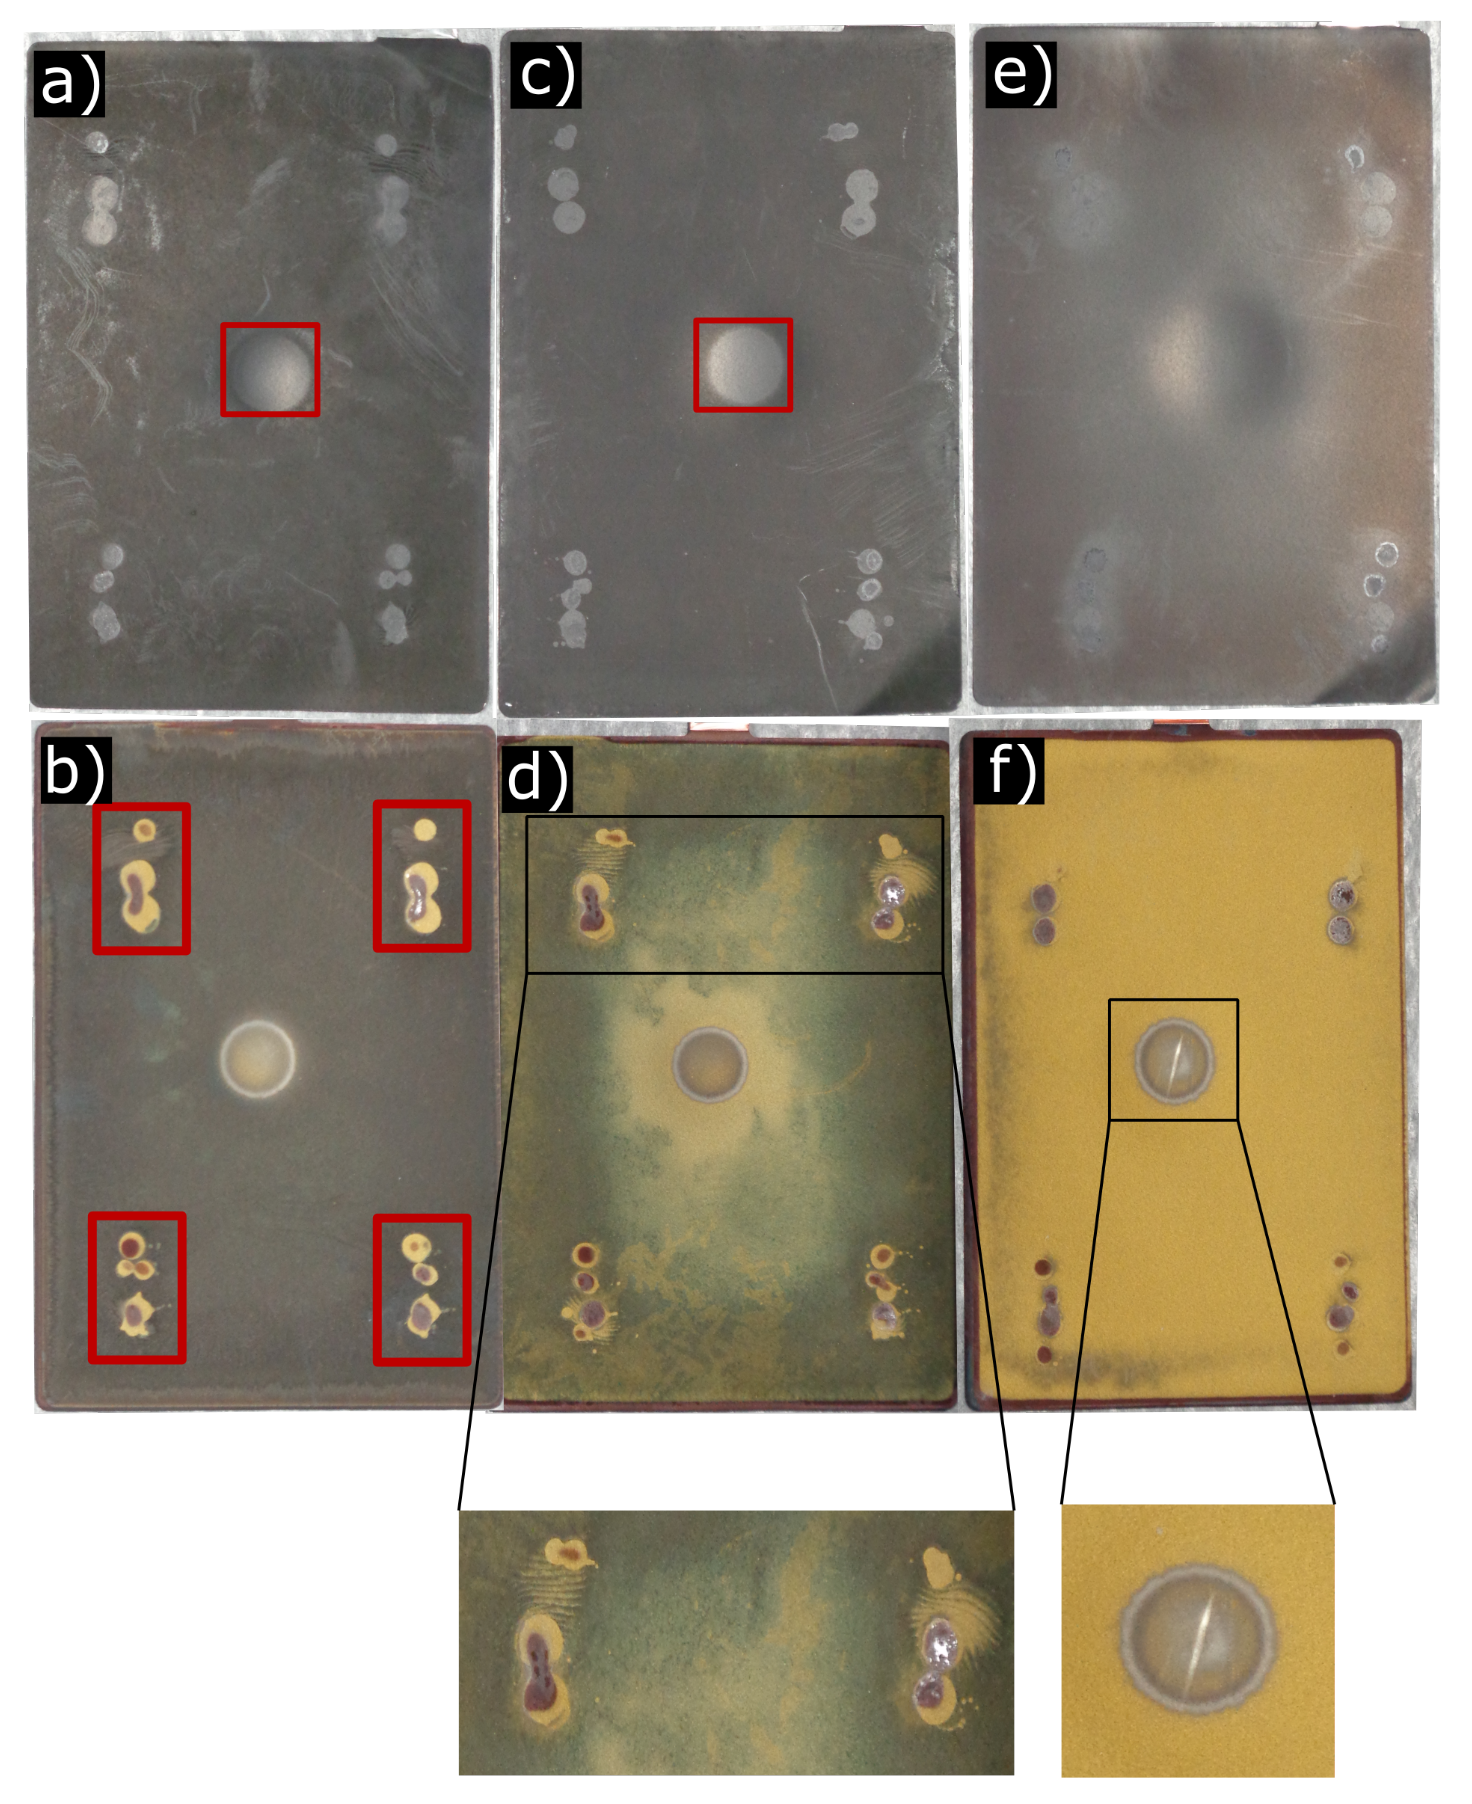
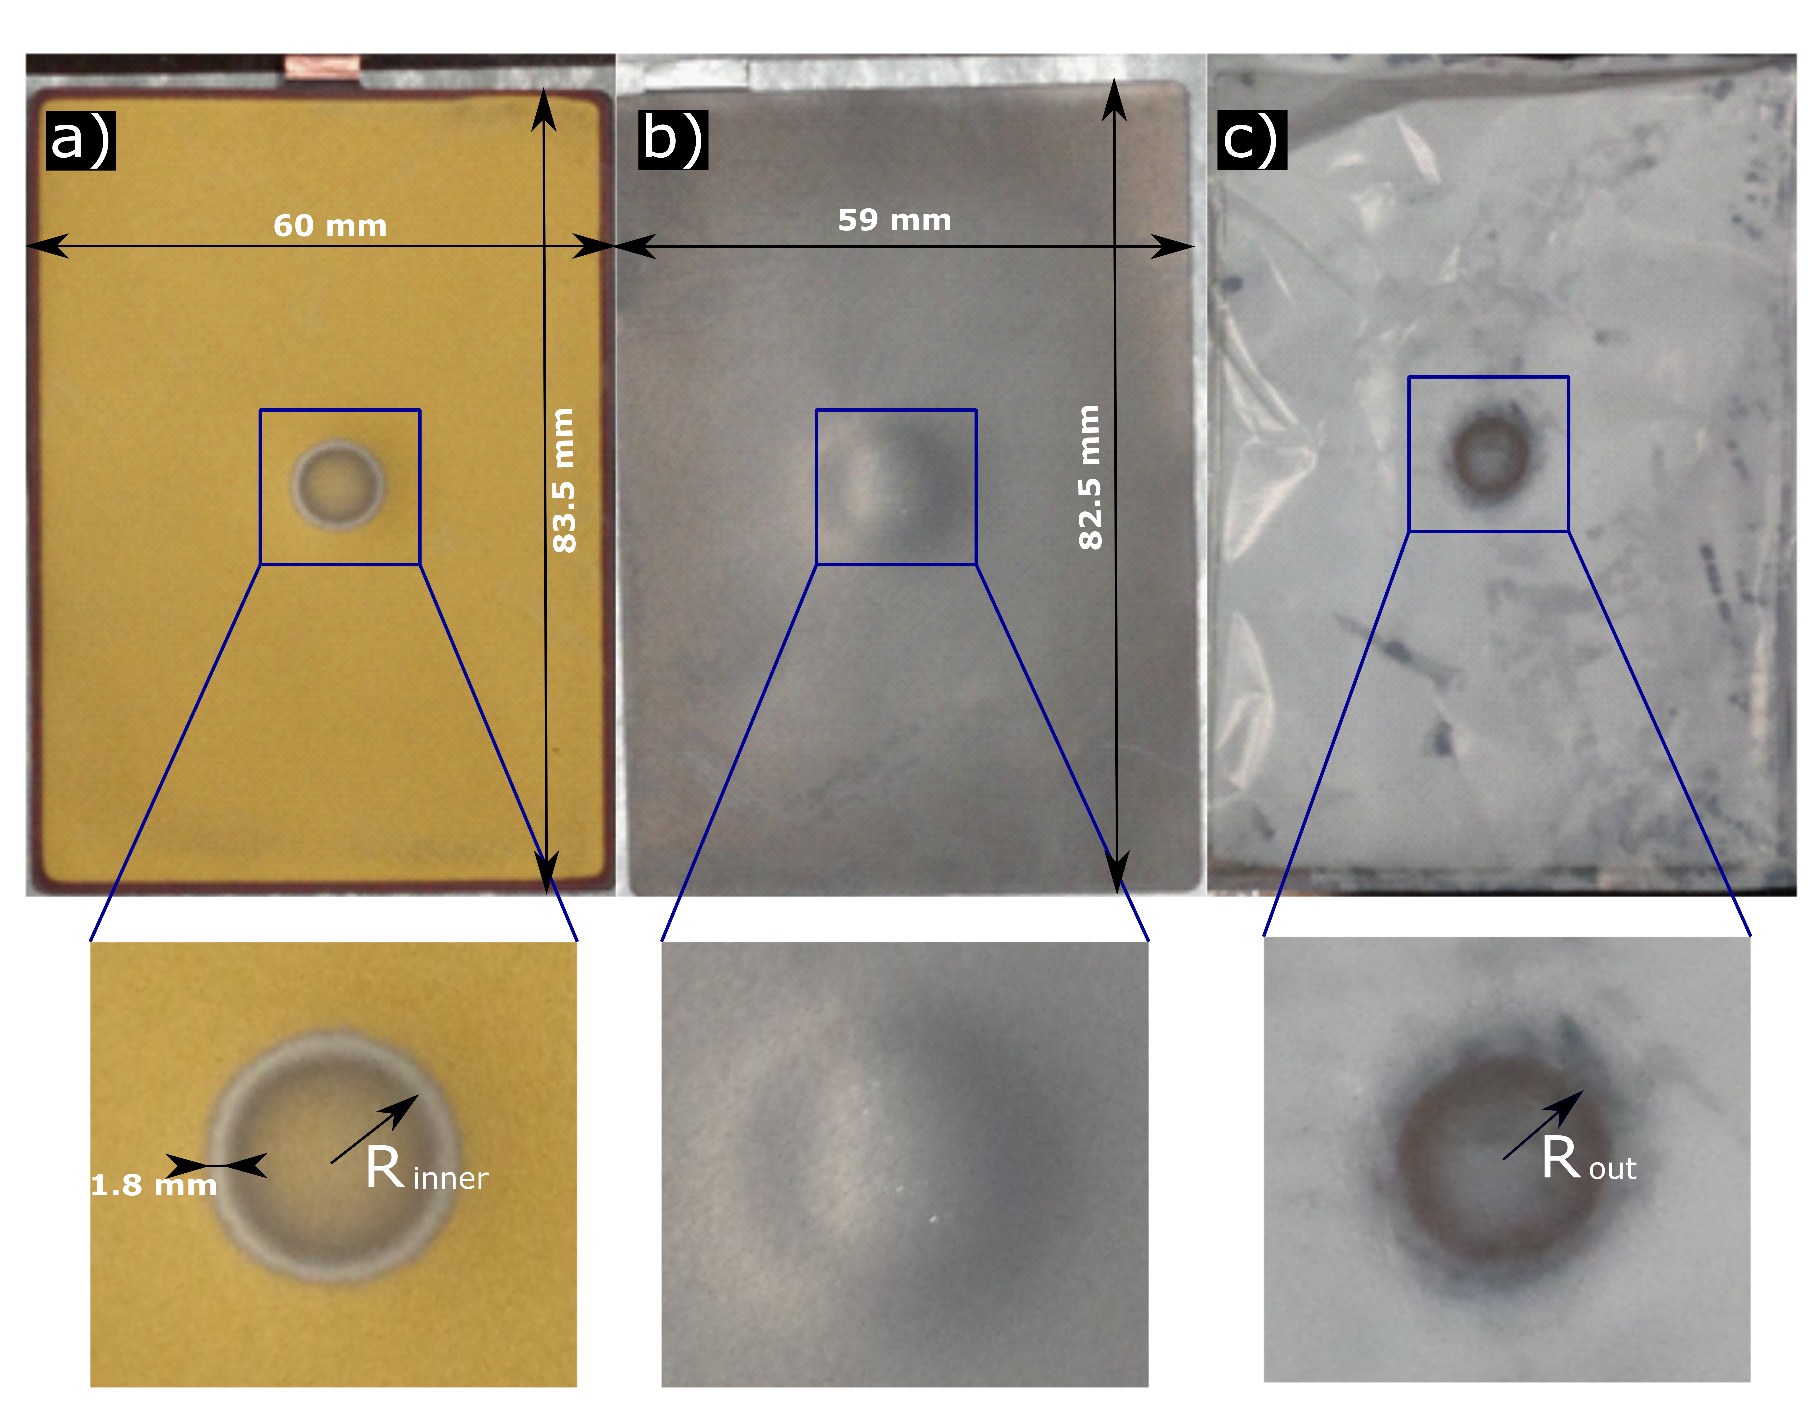
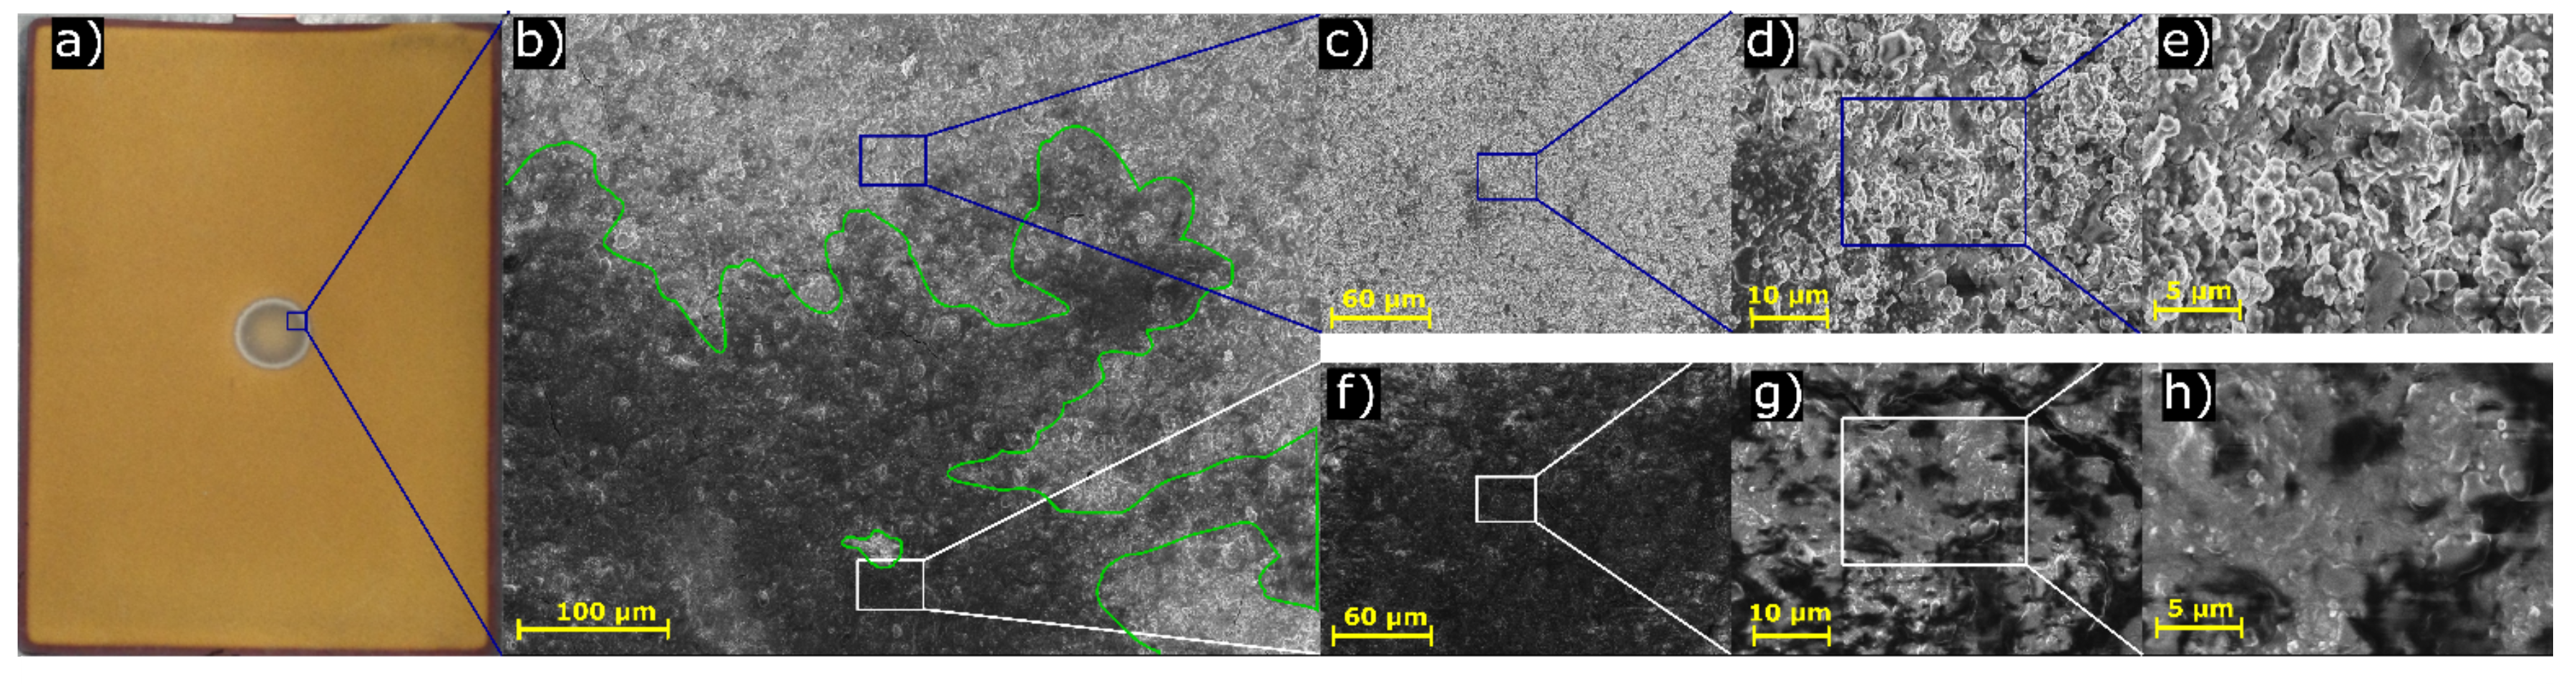
3.2. Post-Mortem Analysis

In this section, we first present the results of the optical PMA of the entire electrode surfaces. Figure 3 shows all electrode and separator sheets. Each number in Figure 3 corresponds to a galvanic element, 23 for the entire cell. Since the cell has been opened fully charged, most anodes are fully lithiated and, therefore, gold. As a first peculiarity in Figure 3, it is noticeable that in contrast to all other anodes, anode 1.8 and 1.12 is not fully lithiated. In the middle of the anode and cathode sheets, the pressure point of the sphere is visible. Abnormality of color can find in and around the pressure point at the anode, where a silver ring is visible. According to Cannarella et al. [4], this ring suggests the deposition of metallic lithium. This empirical observation matches the model of lithium deposition during cell charging of Tang et al. [8]. In the following, we will discuss all peculiarities of the consequence of inhomogeneous pressure on the cell stack.
Figure 4 shows three 1.8, 1.12, and 2.1 galvanic elements where the top cathode corresponds to the bottom anode. These galvanic elements are optically very different from the others in the cell after the experiment. Only the pressure point in the middle had been active Figure 4b,d,f, recognizable by the silver-colored ring in the middle of the anode as has been observed for all anodes. Also, the four dots, where the separator sticks together with the electrodes, in the corners are lithiated Figure 4b,d recognizable on the gold color around the dots. As a result of this, these dots stick on both electrodes and are therefore still active compared to the rest of the electrode. During the disassembly of the stack, no peculiarity regarding the contact of these anodes to the cathode was noticeable. A possible reason for the lack of lithiation could be that the pressure of the sphere caused the cell stack to bend so that the electrochemical contact of this electrode pair was lost during the cycling. Especially the points in Figure 4d, show a wave structure in the lithiation between the dots. Such wave structures can be created by bending and holding on to several points, so that the separator is folded in this region.
The galvanic element 1.12 in Figure 4c,d, which consists of an anode from stack one and a cathode from stack 2, also shows a very inhomogeneous lithium distribution around the pressure point. A possible reason for this is the transition from stack 1 to stack 2. The center of the anode 1.12 is lithiated more than the edge areas, which can be explained by the higher contact pressure in the center. In stack 2, all layers are lithiated similarly, and the pressure points have a similar appearance as well. The anodes of stack two elements 2.1 to 2.3 show an additional silver-colored diagonal line within the silver-colored ring in Figure 4f, which is very pronounced at 2.1 and almost entirely decreases up to 2.3. Also, the pressure point on the separator of galvanic element 2.1 is much darker than the other pressure point of the separator. For cathode layers 1.8 and 1.12 in Figure 4a,c, a silver-colored circle is also visible within the pressure area. The authors have no explanation for this coloration, and a change in color due to lithiation of the cathode is unknown in the literature, and the ICP-OES analysis shows no abnormality.
Figure 5 shows an example of an anode, cathode, and separator. The anode has a length of 60 mm and a width of 83.5 mm; compared to the cathode in Figure 5b, the anode is 1 mm bigger in all dimensions. Therefore, the edge of the anode becomes electrochemically inactive and does not participate in the charging and discharging process. For this reason, there is a black edge here called anode overhang. This anode overhang of the negative electrode beyond the edge of the additional positive capacitance and prevents lithium plating from occurring before the cutoff potential is reached [8].
The pressure point on the anode Figure 5a shows the anode with different color tones that corresponds to a different state of charges, and a silver-colored ring with the inner radius R i n n e r and the thickness of 1.8 mm, which indicates where the high ion flux starts and leads to lithium plating. This high current density rapidly builds a lithium metal layer on the particle surface. In this region, the anode voltage vs. Li/Li+ decreases to negative values, and metallic lithium deposited on the anode particles. Inside of this outer border region, a second ring with a very dark electrode surface has formed. As the dark color corresponds to a low state of charge, this area seems to be less active. Within the second ring, there is also a gold shimmer. One possible explanation is that the inner area was still active during cycling due to very inhomogeneous local pressure in this area. The non-transparent separator in this area supports this possibility. Nevertheless, the diffusion of lithium from active electrode parts outside the pressure area into the pressure area cannot be excluded. The initial cell voltage was 3.55 V, which corresponds to a SOC of 22%, where the graphite anode has not yet changed color [18]. Therefore, this area was lithiated during cell cycling.
The pressure point at the separator in Figure 5c has the same radius R o u t as R i n n e r , which indicates the beginning of a transition zone of weaker pore closure, where a very high ion current density occurs. The intact separator outside the pressure area has a white color, and in the innermost edge of the pressure area, the separator becomes transparent. This transparent separator appears dark in the pictures presented here as the background behind the separator was black when the pictures made. The transparent separator indicates a pore closure as shown by Cannarella et al. [4]. Furthermore, in the pressure area, the separator becomes brighter again, where it assumed that the pores have not completely closed and that a part can still be active.

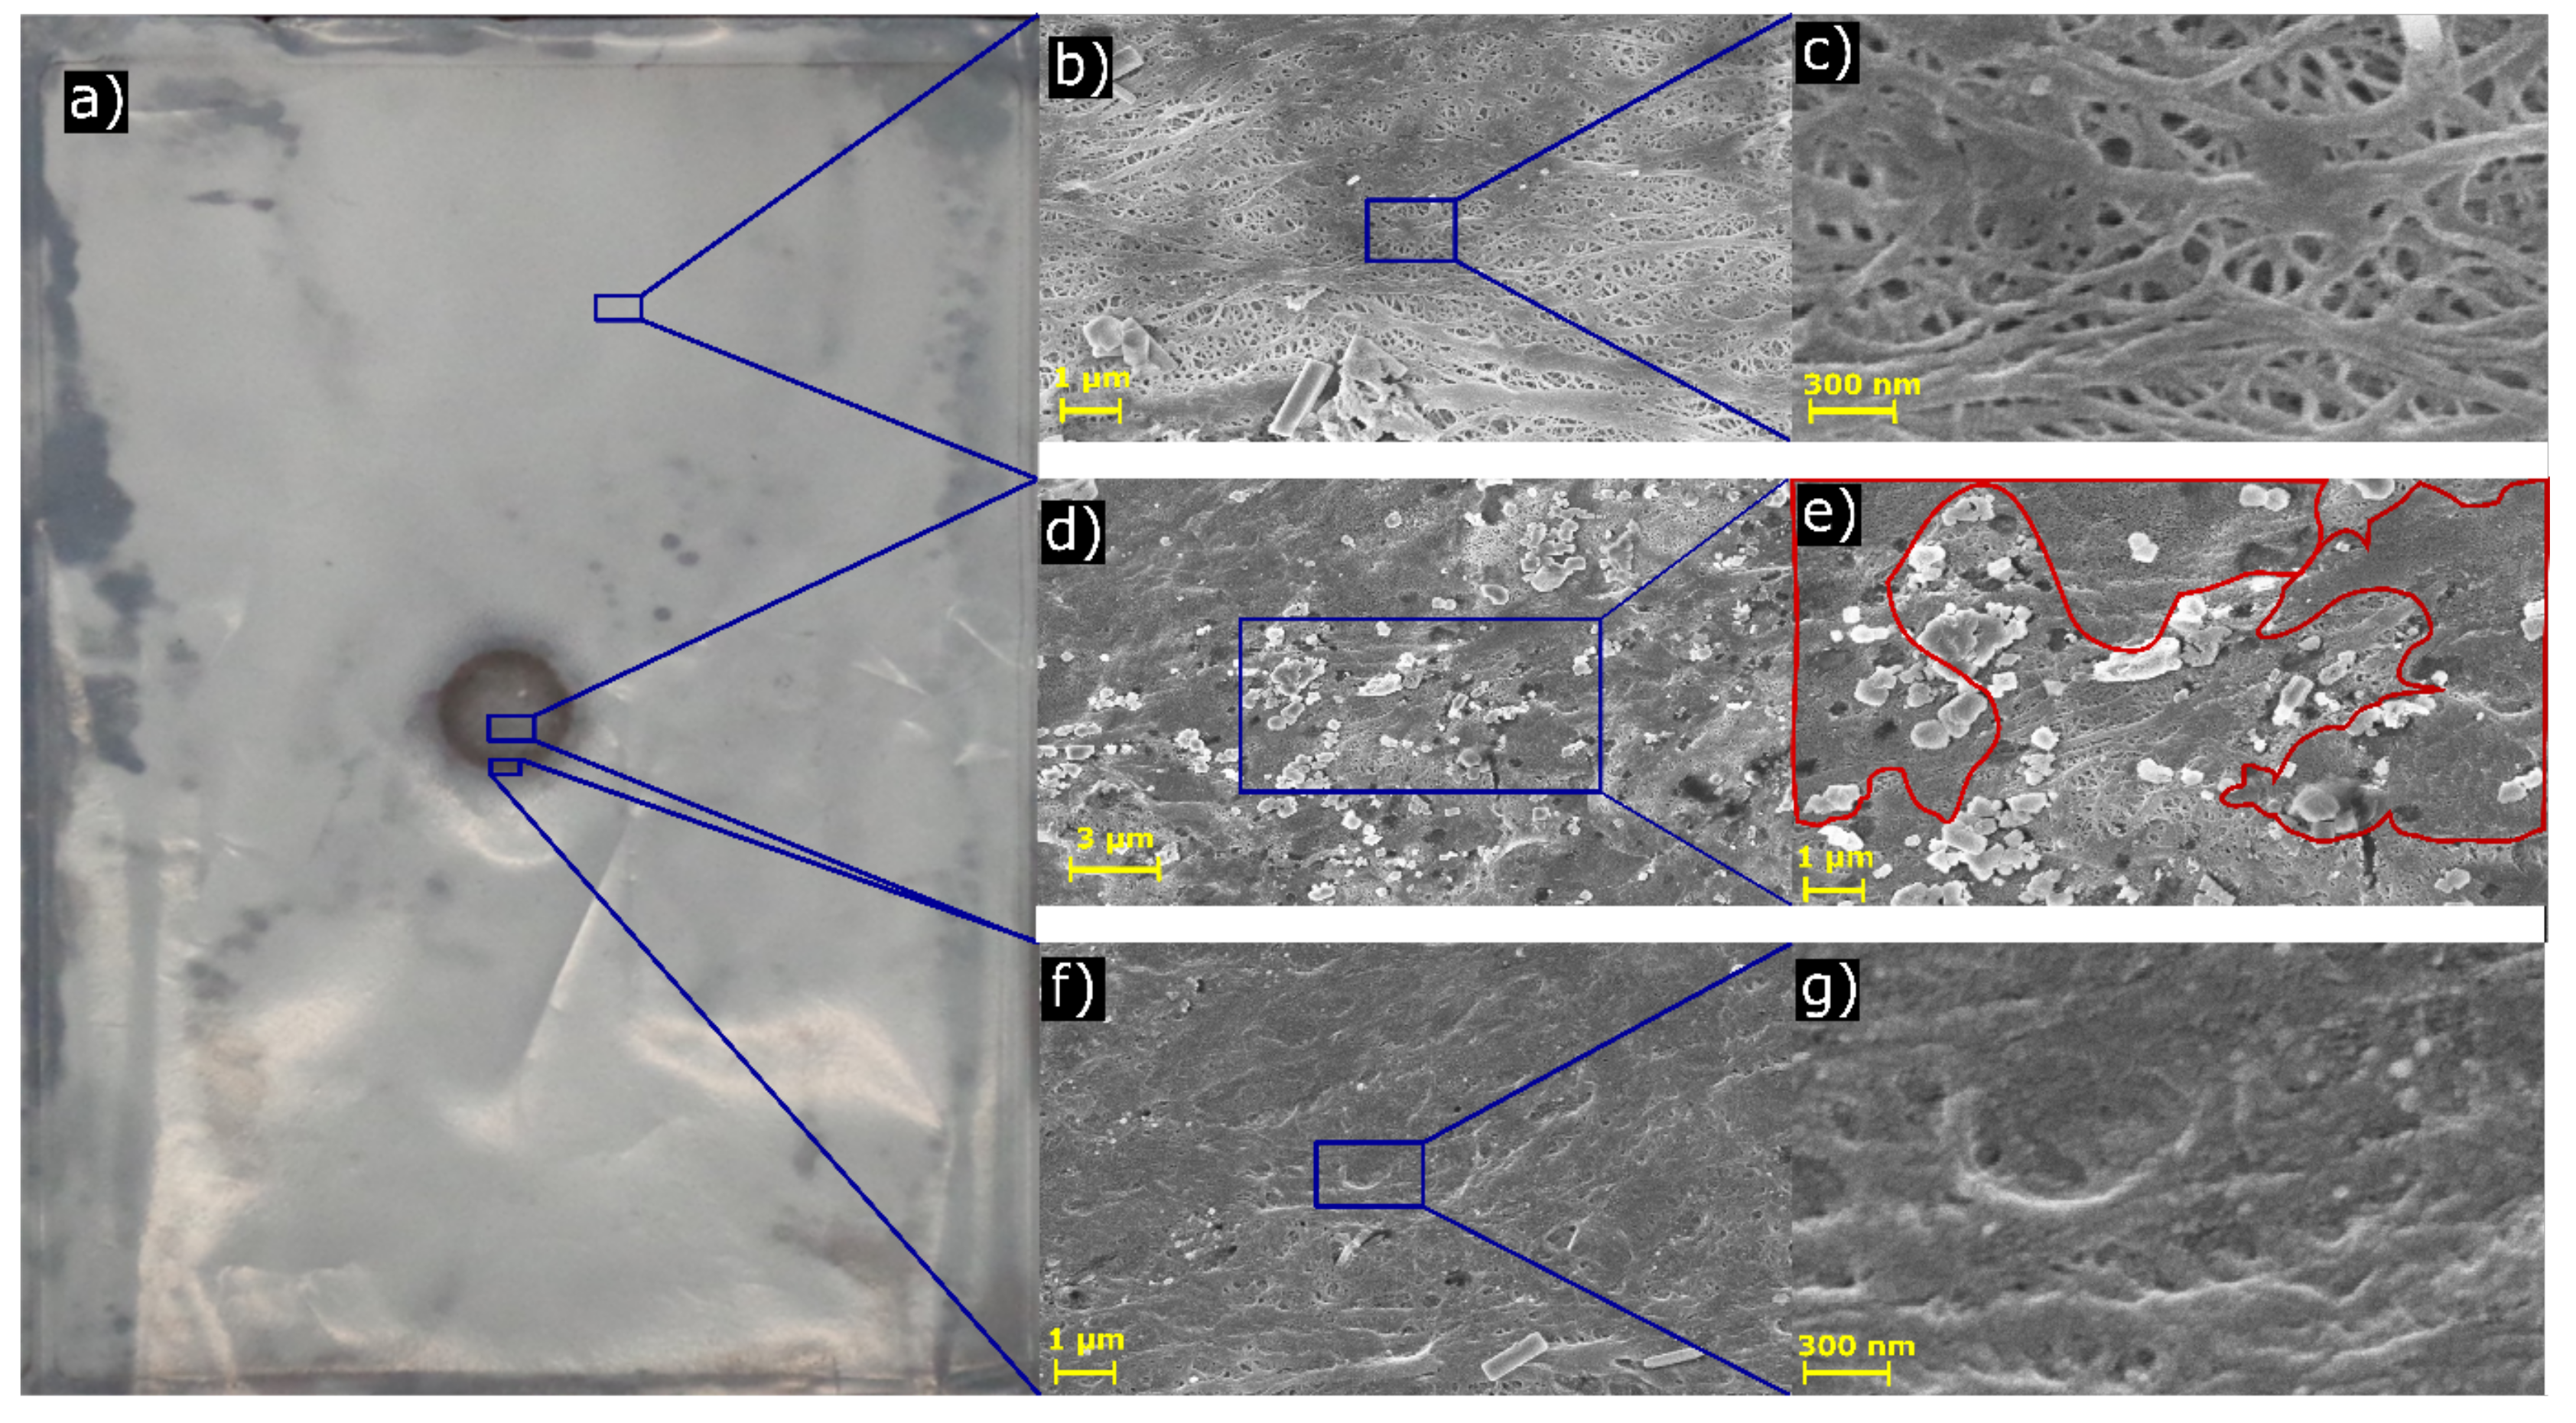
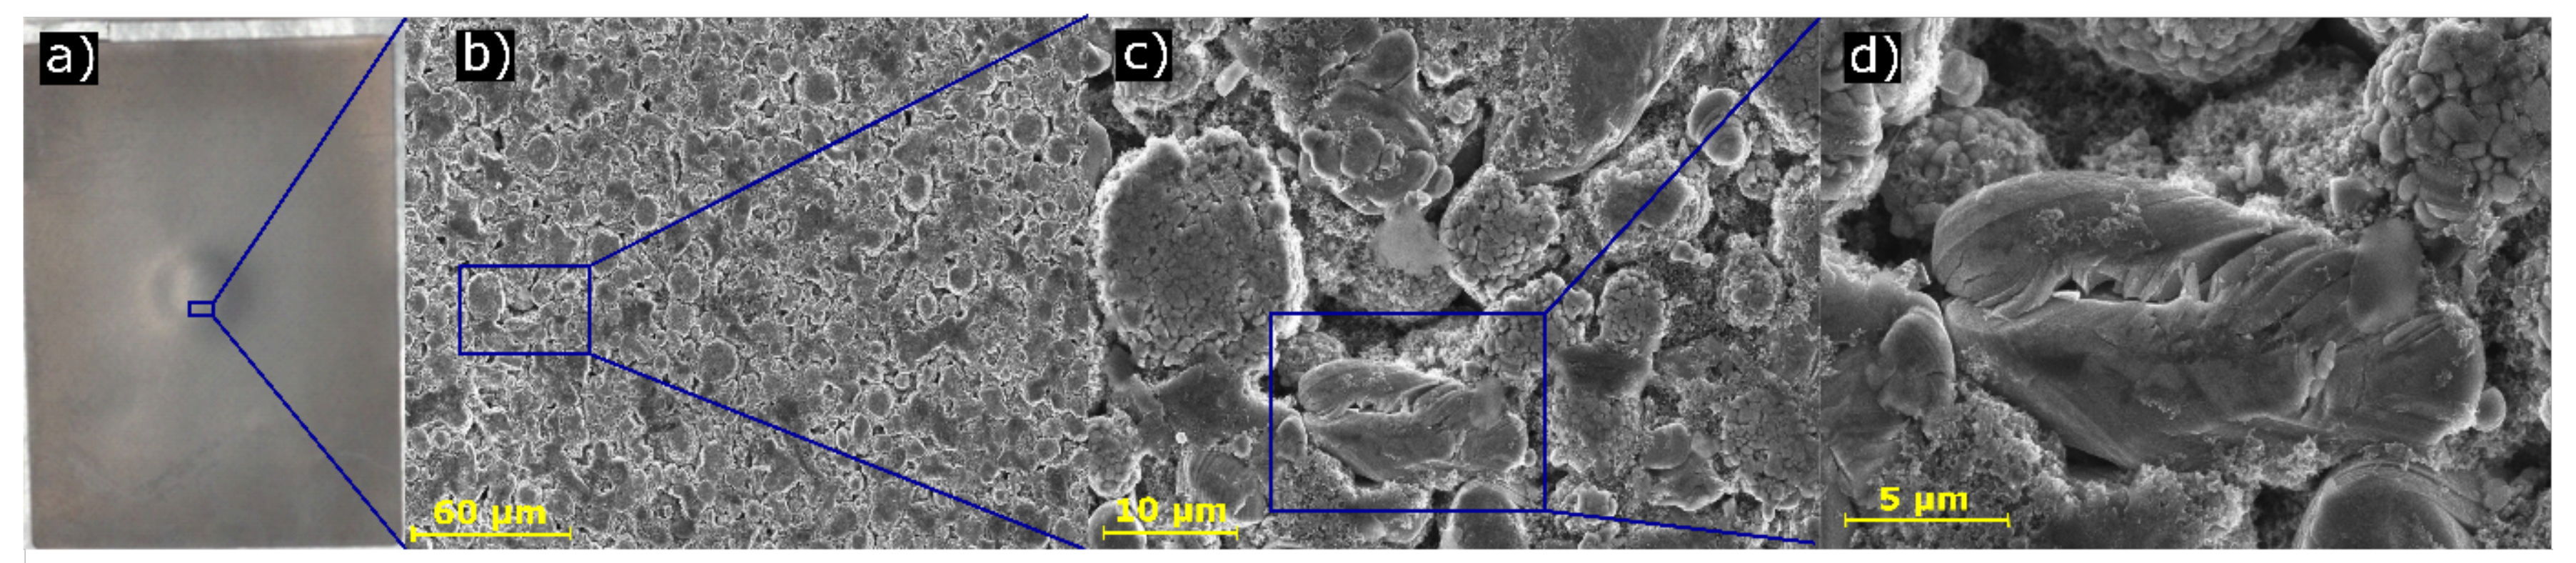
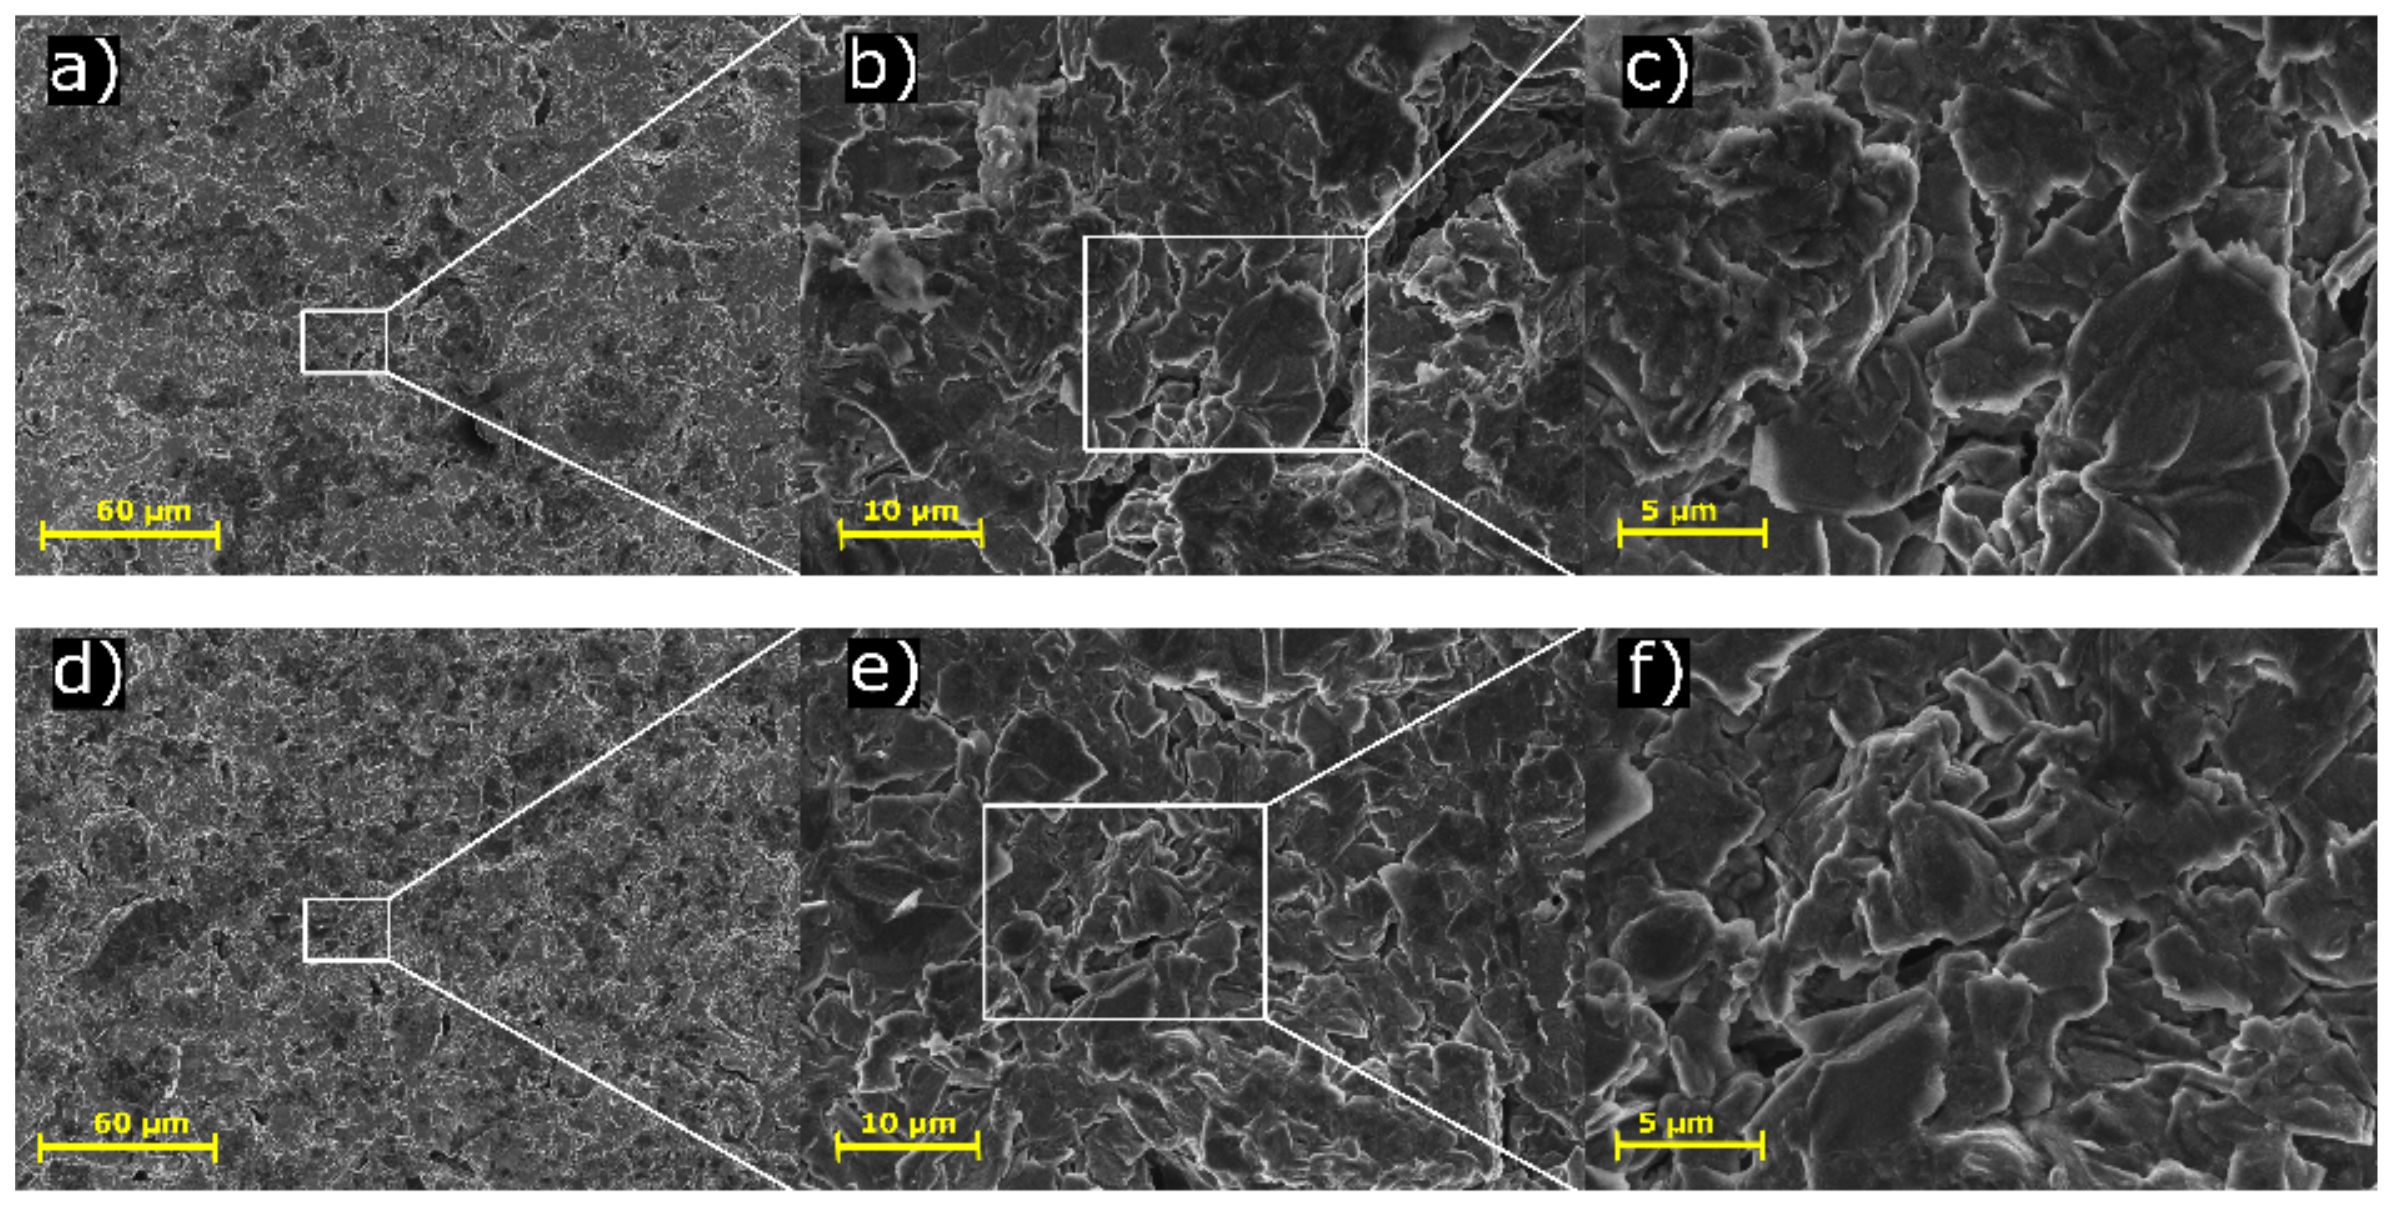
3.3. Scanning Electron Microscope Analysis

To get a deeper understanding of the influence of pressure on active and passive materials on a microscopic level, the two cells were analyzed by SEM. The effects of homogeneously pressed dried electrodes compared to the effects of heterogeneously pressed cyclical cells should give an idea of how strong the effects could be. Since the pressure was adjusted so that the active materials are not damaged according to [15,16] and the experiments on the single electrode sheets, the particles should occur without damage. Considering the applied pressure is above 10 MPa, an irreversible pore closure should occur in the [2]. Before the SEM analysis, the separator was sputtered with silver atoms to prevent static charging during measurement. For the cathode and anode, this is not necessarily due to their electrical conductivity. Figure 6 shows an SEM image of the separator in the area below the sphere, direct at the boundary, and in an area without applied pressure area. In Figure 6b,c, the open pores of the separator are visible, here the separator is fully intact. Due to the uniform lithiation in this area, it is assumed that the ion current density had to be homogeneously distributed in this area. Figure 6d,e shows a region with closed pores and only a small region with open pores as marked red in Figure 6e. This mixed region of open and closed pores confirms the observation of the PMA that the region inside the silver ring with the gold shimmer was at a higher state of charge compared to the initial state. In the dark region at the boundary of the pressure area, the pores fully closed as shown in Figure 6f,g. This dark region of fully closed pores proves that the pressure was strong enough to close the pores, which results in a very uneven ion current density distribution so that locally very high ion current densities occur. This heterogeneous pore structure leads to an uneven current distribution of the electrochemical system. According to Tang et al., this is strongly influenced by the balance of ohmic resistance from the electrolyte and kinetic resistance at the electrode interface, which is influenced by diffusion in the graphite. Uneven current distributions influence the possibility of lithium plating because of the generation of overpotential [8]. This analysis coincides with the observation in the PMA, where lithium deposition was observed in the form of a silver ring in all anodes.
Cannarella et al. builds a model of separator pore closure within a LIB based on Tang et al. [4,8]. The results of the model match with the observations of our experiment. The simulation from Cannarella et al. predicts a ring-shaped shape of the current density distribution around the pore-closed area on the negative electrode surface. Furthermore, by including the lithium plating kinetics and varying the corresponding plating exchange current density, the model calculates that the local potential of the anode vs. Li/Li+ will be negative around the pore-closed area so that the deposition of lithium will occur. This negative potential of the anode leads to lithium plating on the anode. Lithium plating is likely to lead to increased localized mechanical stress as this deposition can lead to measurable changes in anode thickness [20]. This local increase in thickness causes additional mechanical stress and could lead to further deformation of the components in the cell. Even if the simulation of Canarella et al. [4] is only a rough estimate of the real phenomena since the kinetics of lithium plating on graphite electrodes is still poorly understood. This work here and the simulation complement each other very well and jointly support the theory and understanding of the kinetics of lithium plating.
Previous publications of Cannarella et al., Lui et al. and Peabody et al. [2,4,5] mainly investigated the influence of defects in the separator, a question that remains to be clarified: What influence does the pressure have on the active materials in a commercial cell under cycling conditions? Figure 7 shows an SEM image of the cathode. The SEM image in the pressure region Figure 7b–d shows that the pressure was so high that the particles were strongly deformed that contradicts the pressure data of Tran et al. [16] and our experiments conducted on the uncycled single electrode sheets. In contrast, in these analyses, the active material is soaked with electrolyte and (de)lithiated during the application of pressure, which induces additional higher pressure on the particle due to the volume expansion of the graphite. Therefore, it assumed that both effects could have strongly influenced on the elastic properties of the particles. Figure 7c shows that the most NCA particles crushed and the LiCoO 2 flake in Figure 7d decompose in the direction of their layer structure. These cracks expose new surfaces to the electrolyte and enables an electrochemical degradation of the electrolyte, which introduced at the particle–electrolyte interface, the so-called cathode–electrolyte interface (CEI) [21]. The analogous process, as with graphite anodes, can cause lithium loss and gas formation.
In the SEM analysis of the anode, two regions in Figure 8a analyzed, as these differ significantly from their morphology and structure. In Figure 8b the border of the two regions is marked with a green line. The images of the anode in the pressure region in Figure 8f–h show that the contrast of the image deteriorates due to electrostatic charging of the sample during the SEM. It seems as if a new insulating layer has formed here, since the samples are electrostatically charged during the SEM. The influence on the electrochemical kinetic could come from squeezing the electrolyte partly away into the peripheral area. From this analysis, it cannot be determined whether the mechanical load deformed the graphite flakes. A possible cause for the insulating covering layer could be the growth of the solid–electrolyte interface (SEI). This layer can grow when new particle surfaces created by particle cracking exposed to the electrolyte. Microscopic analysis of the silver ring in Figure 8c–e shows a fine structure compared to the two previously discussed regions. This microstructure could be lithium dendrites or reaction products with deposited lithium. Unfortunately, metallic lithium cannot be determined with EDX and remains unexplained for the time being.
An uncycled cell was analyzed microscopically using SEM to compare pristine active materials with pressed active materials from the cycled cell. Furthermore, a dried single electrode layer of anode and cathode was put under a homogeneous pressure of 30 MPa, which is higher as the pressure in the experiment with the sphere, in order to compare dried pressed electrodes with soaked, cycled electrodes from the same LIB type. In Figure 9a–c, the particles of the pristine lithiated cathode are depicted. Figure 9d–f depicts the pressed lithiated cathode, which is like the pristine cathode. No deformed or crushed particles were observed. Also, the anode in Figure 10 shows no significant change under a homogeneous pressure of 30 MPa.

4. Conclusions

In this work, a sphere was used as a force transmitter to induce an inhomogeneous pressure distribution on a cycled LIB. The sphere shape results in a heterogenic pressure distribution on the LIB, which has its maximum in the middle point and decreases towards the edge and induce a ring of locally high electrochemical activity that leads to lithium plating. The force of 1.4 kN, which results in a maximum pressure of 20 MPa, was chosen so that only the separator closes its pores, and no influence on the positive and negative electrode should take place. The experiment in this thesis has shown that pressures in this low range are sufficient to cause defects in the active materials.
A macroscopic PMA of the cell shows that local mechanical effects change the properties of different components. Very inhomogeneous state of charge on individual layers show that these lose contact from each other in the multi-layer system. This contact loss indicates an internal bending of the layers due to different mechanical stress. Moreover, a discoloration was found on the individual two cathodes for which there is no explanation. Furthermore, the PMA showed that the load on the separator at the pressure point was very different, which could be seen optically by different color changes or transparencies. The edge of the pressure point had the most substantial color change, which indicates a secure pore closure of the separator. The center indicated a still partially active region. A silver ring of metallic lithium around the pressure point found on all anodes during the PMA. The lithium plating ring had a width of 1.8 mm and began where the substantial color change of the separator ended. A high current density due to the pore closure of the separator generating an overpotential in this region and create conditions which favor plating created the lithium plating ring.
A microscopic examination at selected locations on the separator, anode, and cathode confirmed and showed new findings regarding the effect of the pressure point on the LIB. The examination of the separator confirmed that below the pressure area, the separator was still partially active, as partly closed and open pores found in this region. The edge area of the separator showed closed entirely pores, which led to the uneven current distribution. The findings of the cathode show that almost all particles were crushed and deformed under pressure. Although the chosen maximum pressure should theoretically be too low for this, therefore, there must have been additional pressure development. The additional pressure development during (de)lithiation of the particles can be an explanation for the extreme increase in pressure. Since the graphite expands by 5% to 11% [17,22] and the cathode expands by 1% to 2% [17,23] the increase in pressure is probably caused by the anode over the cycling.
Moreover, it assumed that the fact that the particles were soaked with electrolyte has changed their elastic properties. Therefore, the authors assume that the pressure influence of dry active materials cannot be transferred to battery cells with filled electrolytes and has a strong influence. The findings of the anode show a transition of the pressure point to the lithium plating ring. In the area of the pressure area, a new insulating layer has formed on the particles because the SEM images have become blurred due to electrostatic charging. In the area of the lithium plating ring, the morphology has changed. This microstructure could be lithium dendrites or reaction products with deposited lithium.
Overall, homogeneous pressure distribution on LIB must be considered during the battery module design, especially pressure points with small areas should be prevented that can lead to unexpected phenomena. This pressure points can result in high-pressure development within the LIB during operation, causing lithium plating and dendrite growth, which can cause short circuits by penetrating the thin separator and trigger a thermal runaway.

Author Contributions

Conceptualization, G.F. and D.U.S.; Formal analysis, G.F. and F.R.; Methodology, G.F.; Validation, G.F.; Investigation, G.F. and L.W.; Writing—original draft, G.F.; Writing—review & editing, G.F., L.W., F.R. and D.U.S.

Funding

This research received no external funding.

Acknowledgments

The authors would like to thank Philipp Wunderlich (Institute of Inorganic Chemistry) for the SEM images EDX analysis of the probes and Rita Graff for the ICP-OES analysis. Philipp Dechent for proofreading.

Conflicts of Interest

The authors declare no conflict of interest.

Abbreviations

The following abbreviations are used in this manuscript:
LIBLithium-Ion Battery
EDPElectrolyte Degradation Product
LEILithium–Electrolyte Interface
PMAPost-Mortem Analysis
SEMScanning Electron Microscope
EDXEnergy Dispersive X-ray Spectroscopy
ICP-OESInductively Coupled Plasma-Optical Emission Spectrometry
ECEthylene Carbonate
EMCEthylmethyl Carbonate
LiPF6Lithiumhexafluorophosphat
LiCoO2Lithium-Cobalt(III)-oxid
LiNiO2Lithium Nickel Oxide
NCALithium Nickel Cobalt Aluminum Oxide (LiNiCoAlO 2 )
NMCLithium Nickel Cobalt Manganese Oxide (LiNiCoMnO 2 )
SOCState of Charge

References

  1. Cannarella, J.; Arnold, C.B. State of health and charge measurements in lithium-ion batteries using mechanical stress. J. Power Sources 2014, 269, 7–14. [Google Scholar] [CrossRef]
  2. Peabody, C.; Arnold, C.B. The role of mechanically induced separator creep in lithium-ion battery capacity fade. J. Power Sources 2011, 196, 8147–8153. [Google Scholar] [CrossRef]
  3. Cannarella, J.; Arnold, C.B. Ion transport restriction in mechanically strained separator membranes. J. Power Sources 2013, 226, 149–155. [Google Scholar] [CrossRef]
  4. Cannarella, J.; Arnold, C.B. The Effects of Defects on Localized Plating in Lithium-Ion Batteries. J. Electrochem. Soc. 2015, 162, A1365–A1373. [Google Scholar] [CrossRef]
  5. Liu, X.M.; Fang, A.; Haataja, M.P.; Arnold, C.B. Size Dependence of Transport Non-Uniformities on Localized Plating in Lithium-Ion Batteries. J. Electrochem. Soc. 2018, 165, A1147–A1155. [Google Scholar] [CrossRef]
  6. Oh, K.Y.; Siegel, J.B.; Secondo, L.; Kim, S.U.; Samad, N.A.; Qin, J.; Anderson, D.; Garikipati, K.; Knobloch, A.; Epureanu, B.I.; et al. Rate dependence of swelling in lithium-ion cells. J. Power Sources 2014, 267, 197–202. [Google Scholar] [CrossRef]
  7. Wünsch, M.; Kaufman, J.; Sauer, D.U. Investigation of the influence of different bracing of automotive pouch cells on cyclic liefetime and impedance spectra. J. Energy Storage 2019, 21, 149–155. [Google Scholar] [CrossRef]
  8. Tang, M.; Albertus, P.; Newman, J. Two-Dimensional Modeling of Lithium Deposition during Cell Charging. J. Electrochem. Soc. 2009, 156, A390. [Google Scholar] [CrossRef]
  9. Rahe, C.; Kelly, S.T.; Rad, M.N.; Sauer, D.U.; Mayer, J.; Figgemeier, E. Nanoscale X-ray imaging of ageing in automotive lithium ion battery cells. J. Power Sources 2019, 433, 126631. [Google Scholar] [CrossRef]
  10. Waldmann, T.; Gorse, S.; Samtleben, T.; Schneider, G.; Knoblauch, V.; Wohlfahrt-Mehrens, M. A Mechanical Aging Mechanism in Lithium-Ion Batteries. J. Electrochem. Soc. 2014, 161, A1742–A1747. [Google Scholar] [CrossRef]
  11. Bach, T.C.; Schuster, S.F.; Fleder, E.; Müller, J.; Brand, M.J.; Lorrmann, H.; Jossen, A.; Sextl, G. Nonlinear aging of cylindrical lithium-ion cells linked to heterogeneous compression. J. Energy Storage 2016, 5, 212–223. [Google Scholar] [CrossRef]
  12. Waldmann, T.; Hogg, B.I.; Wohlfahrt-Mehrens, M. Li plating as unwanted side reaction in commercial Li-ion cells—A review. J. Power Sources 2018, 384, 107–124. [Google Scholar] [CrossRef]
  13. Su, X.; Dogan, F.; Ilavsky, J.; Maroni, V.A.; Gosztola, D.J.; Lu, W. Mechanisms for Lithium Nucleation and Dendrite Growth in Selected Carbon Allotropes. Chem. Mater. 2017, 29, 6205–6213. [Google Scholar] [CrossRef]
  14. Loveridge, M.; Remy, G.; Kourra, N.; Genieser, R.; Barai, A.; Lain, M.; Guo, Y.; Amor-Segan, M.; Williams, M.; Amietszajew, T.; et al. Looking Deeper into the Galaxy (Note 7). Batteries 2018, 4, 3. [Google Scholar] [CrossRef]
  15. Wang, C.W.; Yi, Y.B.; Sastry, A.M.; Shim, J.; Striebel, K.A. Particle Compression and Conductivity in Li-Ion Anodes with Graphite Additives. J. Electrochem. Soc. 2004, 151, A1489. [Google Scholar] [CrossRef]
  16. Tran, H.Y.; Greco, G.; Täubert, C.; Wohlfahrt-Mehrens, M.; Haselrieder, W.; Kwade, A. Influence of electrode preparation on the electrochemical performance of LiNi0.8Co0.15Al0.05O2 composite electrodes for lithium-ion batteries. J. Power Sources 2012, 210, 276–285. [Google Scholar] [CrossRef]
  17. Rieger, B.; Schlueter, S.; Erhard, S.V.; Schmalz, J.; Reinhart, G.; Jossen, A. Multi-scale investigation of thickness changes in a commercial pouch type lithium-ion battery. J. Energy Storage 2016, 6, 213–221. [Google Scholar] [CrossRef]
  18. Shellikeri, A.; Watson, V.; Adams, D.; Kalu, E.E.; Read, J.A.; Jow, T.R.; Zheng, J.S.; Zheng, J.P. Investigation of Pre-lithiation in Graphite and Hard-Carbon Anodes Using Different Lithium Source Structures. J. Electrochem. Soc. 2017, 164, A3914–A3924. [Google Scholar] [CrossRef]
  19. Uhlmann, C.; Illig, J.; Ender, M.; Schuster, R.; Ivers-Tiffée, E. In situ detection of lithium metal plating on graphite in experimental cells. J. Power Sources 2015, 279, 428–438. [Google Scholar] [CrossRef]
  20. Bitzer, B.; Gruhle, A. A new method for detecting lithium plating by measuring the cell thickness. J. Power Sources 2014, 262, 297–302. [Google Scholar] [CrossRef]
  21. Liu, Y.M.; G Nicolau, B.; Esbenshade, J.L.; Gewirth, A.A. Characterization of the Cathode Electrolyte Interface in Lithium Ion Batteries by Desorption Electrospray Ionization Mass Spectrometry. Anal. Chem. 2016, 88, 7171–7177. [Google Scholar] [CrossRef] [PubMed]
  22. Hahn, M.; Buqa, H.; Ruch, P.W.; Goers, D.; Spahr, M.E.; Ufheil, J.; Novák, P.; Kötz, R. A Dilatometric Study of Lithium Intercalation into Powder-Type Graphite Electrodes. Electrochem. Solid-State Lett. 2008, 11, A151. [Google Scholar] [CrossRef]
  23. Itou, Y.; Ukyo, Y. Performance of LiNiCoO2 materials for advanced lithium-ion batteries. J. Power Sources 2005, 146, 39–44. [Google Scholar] [CrossRef]
Figure 1. Dimensions (in mm) and internal construction of the Kokam SLP526495 cell.
Sustainability 11 06738 g001
Figure 2. Setup and principle of the experiment (a) Li-cell with stainless-steel sphere and load cell (b) non-deformed state (homogeneous ionic current distribution yellow arrows) (c) deformed state due to inhomogeneous induced pressure distribution (d) deformed state with inhomogeneous flow field of ionic current density.
Sustainability 11 06738 g002
Figure 3. Optical post-mortem analysis after cell opening (a) stack 1 top (b) stack 2 bottom.
Sustainability 11 06738 g003
Figure 4. Optical PMA (a,d) galvanic element 1.8 (b,e) galvanic element 1.12 (c,f) galvanic element 2.1.
Sustainability 11 06738 g004
Figure 5. Exemplary layers of (a) Anode (b) Cathode (c) Separator.
Sustainability 11 06738 g005
Figure 6. SEM image from separator (a) General view (b,c) unpressed region (d,e) pressed region in the center under the sphere (f,g) edge of the pressed region under the sphere.
Sustainability 11 06738 g006
Figure 7. SEM image of cathode (a) general view of the cathode (bd) pressed region.
Sustainability 11 06738 g007
Figure 8. SEM image of the anode (a) overview (b) boundary of the silver ring to the pressure area (ce) internal pressed region (fh) transition zone (silver ring).
Sustainability 11 06738 g008
Figure 9. SEM image of a uncycled cell (ac) overview of a pristine lithiated cathode (df) pressed area of a single lithiated cathode layer with 30 MPa.
Sustainability 11 06738 g009
Figure 10. SEM image of a uncycled cell (ac) overview of a pristine delithiated anode (df) pressed area of a single delithiated anode layer with 30 MPa.
Sustainability 11 06738 g010

