Article

The Effect of Parental Economic Expectation on Gender Disparity in Secondary Education in Ghana: A Propensity Score Matching Approach

1
School of Management and Economics, University of Electronic Science and Technology of China, Chengdu 611731, China
2
Liberal Studies Department, Kumasi Technical University, P.O. Box 854, Kumasi 0023, Ghana
3
Department of Social Studies, Prempeh College, P.O. Box KS 1993, Kumasi 0023, Ghana
*
Author to whom correspondence should be addressed.
Sustainability 2019, 11(23), 6707; https://doi.org/10.3390/su11236707
Submission received: 27 September 2019 / Revised: 16 November 2019 / Accepted: 20 November 2019 / Published: 27 November 2019
(This article belongs to the Special Issue Economics of Education and Sustainable Development)

Abstract

:
Ghana, like most sub-Saharan African countries, continues to face gender disparity at the higher levels of the educational hierarchy. This paper seeks to investigate whether gender disparity in senior secondary schools in Ghana is influenced by the economic expectations that parents have for their children’s education. Using data from Ghana Living Standard Survey round 6 (GLSS 6), the study employs Propensity Score Matching in its analysis. Intra-household income inequality was used as a for measure parental expectations of the economic returns of education. The results revealed that, on the average, Ghanaian parents expect their male children to reap more economic benefits from education than girls. This attitude culminates in higher investment in boys’ education to the disadvantage of their female counterparts at senior secondary schools. It is therefore recommended that appropriate policies should be implemented to ensure that the barriers that prevent women from occupying high-earning positions in the labor market are expunged. With this, parents will believe that girls can have the same economic opportunities as boys and hence will invest equal resources in children’s education irrespective of their gender.

1. Introduction

Ensuring gender equality in all dimensions of life has become a top priority for many governments and international organizations. Since being brought into the international frontline by Convention on the Elimination of All forms of Discrimination Against Women (CEDAW) in 1976, there has been tremendous efforts to narrow and, if possible, eliminate all forms of gender inequalities especially in education [1]. Equal access to education, for boys and girls, is not only a fundamental human right; it also has economic, social, civil, and political benefits [2]. It is not surprising that gender equality in education features in two of the Sustainable Development Goals (SDGs). Goal 4 of the SDGs aims to ensure equitable and inclusive education of quality and also promotes lifelong educational opportunities for all. Goal 5 also seeks to empower all girls and women and achieve gender equality.
Equal access to education, for both genders, benefits both the current and future generations [3]. It is evident in the literature that education is associated with a higher flow of income, so education for all is a beacon of hope for alleviating poverty, especially among the marginalized (and women in particular). There is a ripple effect on the younger and unborn generations, as educating women lowers fertility and mortality rates and other forms of inequalities for their children, thereby helping to create a sustainable planet [4,5].
It also fosters economic growth and development [6]. In this contemporary world, nations that want to maintain their competitiveness and comparative advantage focus on education for all as a tool. Educating all potential members of the labor force, be they boys or girls, men or women, is the engine of economic growth and development, as it ensures the efficient utilization of all economically active citizens. A knowledge-based labor force is a crucial determinant of the pace and sustainability of a country’s economic transformation [7,8,9,10].
Equality in education is the agent of change for a more civilized global economy. When the citizens of an economy are well educated, there tends to be a reduction in the crime rate, domestic violence and other forms of gender inequalities. It also improves the social, political, and civic participation of the populace [8,11]. Education is therefore the new game-changer that underpins the achievement of most of the Sustainable Development Goals stipulated by the United Nations [12].
Even though education is seen as the fundamental solution to all forms of gender inequalities, girls and women continue to be disadvantaged in this sector. Despite the reduction in the number of girls out of school by 40% compared to the 1994 figure since the inception of the Millennium Development goals, girls still constitute the higher percentage of school dropouts [2]. Women account for about 60% of the world’s illiterates. The UNESCO Institute for Statistics (UIS) estimates that more than 17 million girls will never enter a classroom to receive formal education [13]. These figures are alarming and represent a vast number of untapped and wasted human resources.
The educational disparity between boys and girls worsens in most sub-Saharan African and South Asian countries. Women and girls continue to lag behind their male counterparts at most levels of the educational hierarchy. More than half of the world’s 58 million school-aged children who are not in school are girls, and about 75% of them are from these regions [13]. There is an average 10% completion gap between boys and girls at the primary level in sub-Saharan Africa, and the advantage goes to boys. Though there has been an increase in the secondary and tertiary school enrolment of girls, a substantial gap still persists [2]. This accounts for the high levels of domestic violence against women and girls, as well as the low political, social, and civic patronage of women in these regions [14]. The high level of untapped resources also explains the state of under-development of most of these countries and their non-convergence toward their developed counterparts [15].
There are numerous reasons why women and girls are discriminated against in terms of education in the sub-Saharan African region. Prominent among them are division of domestic chores based on gender, child labor, early marriage, and early pregnancy, among others [16].
In sub-Saharan Africa, children, especially girls, are an essential source of labor at homes. Due to cultural values and beliefs that consider male children as superior and therefore should not partake in many of the household activities, girls perform most of the domestic chores. A bulk of the household chores, such as cooking, washing, hauling water, and caring for younger siblings and sick family members, are performed by girls, while boys usually run errands. These activities are time-consuming and physically demanding, which affect girls’ academic performance and consequently impede them from schooling [17,18,19].
Early marriage and its associated consequence of early motherhood also increase the dropout rate of girls in this region. Most girls, especially those in the rural areas, are forced to marry early once they reach puberty or become sexually active. One of the reasons for early marriage in sub-Saharan Africa is the desire to prevent the negative tag associated with unmarried girls who get pregnant. Families that have more girls also gain economically from the bride prices or dowries paid for their daughters. This situation is more pronounced among poverty-stricken families with more children to feed. Parents are therefore not willing to invest their scarce resources in the education of a girl-child who will in a short period be married off to another family. In addition, their new roles as wives, mothers, and caregivers for the extended families of their husbands after marriage exert pressure on them. The time-consuming nature of these new roles contributes to the low enrolment and high dropout rates of girls from schools [18,20].
Girls who get pregnant or become mothers at an early age are often stigmatized and ridiculed by their teachers, friends, and schoolmates, which makes it difficult for them to return to school after childbirth. Some school do not even permit pregnant pupils or early mothers to be in class, as they are seen as bad influences on the rest of the students. In Ghana, girls who are pregnant are mostly not allowed to write the Basic Education Certificate Education (BECE) which is the prerequisite for senior secondary education. Even when schools allow these mothers to return, their re-entry depends on getting caretakers for their children, which they often cannot afford [18,21,22].
Another significant determinant of gender disparity in education is parents’ expectation of the economic returns on the educational investments they make in their children. The economic worth and value of boys and girls are not genetically or biologically determined; it is placed on them by society. Most parents in sub-Saharan African countries (including Ghana) have different expectations for the economic value of their children’s education. In most cases, higher value is placed on boys’ education. This is so because, in Ghana for instance, men continue to earn more income than women in the labor market. Even when both sexes have the same educational background, men tend to be dominant in the high-paying jobs [23]. Most employers offering top-position jobs prefer men to women because of the high rate of absenteeism among the latter due to maternity leave, the need to care for sick family members, etc. [24]. Furthermore, the patriarchal nature of Ghanaian society gives men an upper hand over their female counterparts on the job market [25]. Men, therefore, gain more economically from education than women. If, in a household, a husband earns more than his wife, it will confirm to the parents that men have better economic value from education and hence it is worth investing more in their sons’ education than their daughters.
Even though the parental economic expectation for girls from high-income families may exceed that of boys from low-income families, within each family, parents have higher expectations for sons than daughters due to the patriarchal nature of the Ghanaian labor market. Also, the magnitude of intra-household income inequality causes different levels of expectation. If parents of the same educational background work in a sector that is highly male-dominated, and as a result the gap between their incomes is very wide, the difference between the economic expectation for their sons and daughters will be higher than those of parents who work in a less male-dominated sector and have lower income inequality.
This paper aims to investigate whether gender disparity in senior secondary education in Ghana is influenced by the economic expectation parents have for their children’s education. The study adds to the literature by providing an alternative measure for the economic expectations parents have for the education of their male and female children. A lot of studies that included this important variable in the analysis of education used qualitative measures [26,27,28,29,30]. This paper, however, employs a quantitative measure of parental economic expectation for education. The authors believe that intra-household income inequality between the father and mother is a good measure of this variable.
Another significance of the study is that it applied the Propensity Score Matching (PSM) method to the analysis of education. Economics provides a quantitative approach in analyzing the behaviors and decisions of economic actors by mostly estimating the causal relationship between variables [7]. However, most of these causal claims are plagued with endogeneity which nullifies the potency of the causal estimates [31]. One solution to eliminating the effect of endogeneity from causation is the PSM. This method is therefore used to find out whether there is a significant relationship between parents’ expectations of the economic value of boys’ and girls’ education, measured by intra-household income inequality, and gender disparity in senior secondary education in Ghana.
The rest of this paper is as follows: Section 2 discusses gender inequality in Ghana’s educational system, while the Section 3 reviews existing literature. Section 4 looks at the methodology used, Section 5 explores the dataset, Section 6 details the analysis of the data, and the last section discusses the results and concludes the study.

2. Gender Inequality in Ghana’s Educational System

Ghana’s successes in the educational sector in the initial years after the nation’s independence in 1957 was marred by the economic recession it experienced in the early 1980s. The Structural Adjustment Programs (SAPs) the nation implemented in the early 1980s necessitated a drastic reduction in government expenditure in all sectors of the economy including education. Coupled with the introduction of the user fees in education, school enrolment for both boys and girls plummeted at all levels. For instance, girls’ enrolment in primary school for the eligible age group dropped from 71% in 1980 to 68% in 1983. Those who enrolled in the secondary schools also fell to 28% in 1983 from the 1980’s figure of 31%. A similar observation was made for boys. Primary school enrolment for boys declined from 89% in 1980 to 87% in 1983. The percentage of boys at the eligible age group who enrolled at the secondary schools decreased from 51 in 1980 to 47 in 1983 [32].
The end of the SAPs was marked by great achievements in the educational sector in general and for girls in particular. The period after the SAPs was met with the global advocacy for gender parity in all spheres of life. Ghana committed itself to ensuring gender equality in all aspect of the economy. It ratified several human right treaties, including the Convention on Rights of the Child (1989), the World Declaration for All (1990), the Beijing Declaration and Platform for Action (1995), and the Dakar Framework for Action (2000), which are against discrimination of all forms [2]. The 1992 constitution of Ghana also has a provision that makes education, especially at the primary level, free and compulsory for all children [33].
Several reforms and interventions have been made by the government to achieve Universal Primary Education (UPE) and also eliminate the disparity between boys and girls in the educational sector. Paramount among these interventions is the implementation of the Free Compulsory and Universal Basic Education (FCUBE) in 1997. To ensure the success of the FCUBE, the Girls’ Education Unit (GEU) was created under the Ghana Education Service (GES). Its aim was to ensure that there is equal enrolment of girls and boys in basic education and also to reduce the percentage of girls who drop out of both primary and lower secondary schools. In addition, it was tasked to improve the rate of girls’ enrolment in the senior secondary schools. Also, the government established the Capitation Grant in 2005, which abolished the user fee system and made education easily accessible to all [33].
These reforms catapulted the enrolment rate for both boys and girls at all levels of the educational ladder and even put girls at the advantageous position at the primary school level. The gross primary school enrolment of boys shot up from 74.7% in 2008 to 87.47% in 2014 before dropping to 82.87% in 2018. Same can be said about girls as their number increased to 87.81% in 2014 from the 2008 figure of 74.34% and afterward declined to 84.33% in 2018. Thus, the enrollment rate for girls in primary schools in recent years outweighs their male counterparts. It is worth noting that girls also outperform boys in terms of the progression rate to lower secondary schools. Figures from the World Bank’s World Development Indicators (WDI) shows that 97.81% of girls progressed to the lower secondary school while the rate for boys stood at 92.66% in 2017 [34].
Despite the successes achieved in the enrolment of girls at the primary school, they lag behind boys at the senior secondary and tertiary levels of education. The percentage of boys’ enrolment at the senior secondary and tertiary schools figured around 72.73 and 18.68, respectively, in 2018 as against 71.72 and 13.53 for girls. Furthermore, the literacy rate of men in Ghana outstrips that of women. The 2014 GDHS indicated that 82% of Ghanaian men are literate compared to the 67% for women. These rates, however, indicate an improvement in the 2008 figures for men and women which were 77% and 63%, respectively [35].
Several socio-economic factors account for the gender imbalance at the higher levels of education in Ghana. First of all, girls are over-burdened with domestic chores before and after school which affect their academic performance thereby causing them to drop out of school before attaining senior secondary education. Data from the Ghana Living Standard Survey round 6 (GLSS 6) indicates that the workload at homes for girls is three times more than that of boys. The proportion of girls who are out of school due to domestic chores in 2014 stood at 13.1, while the figure for boys was 3.2 [23]. Another factor that adversely affects the enrolment of girls in higher levels of education in Ghana is early marriage. Girls of secondary and tertiary school-going age are considered ripe for marriage. Apart from the economic gains from the dowries receive on their daughters, families of these girls attain social recognition if their female children marry before giving birth [21]. About 40% of girls of secondary and tertiary school-going age in Ghana are married, and one-fifth of them are mothers. The corresponding figures for boys are ten times lower [23]. Early marriage and motherhood burden child-brides financially and also in terms of time, which hinders their schooling. Furthermore, families in Ghana tend to place more economic value on the education of boys than girls. There is still a widely held belief that boys are superior to girls and will generate more income from schooling. This assertion encourages parents to invest more in their sons’ education.
Gender inequality in Ghana’s educational sector has a spatial dimension. The urban centers have a narrower gap between boys and girls in terms of those who attain higher level of education compared to the rural areas. The gender disparity gap between men and women in the rural communities stood around 16.4%, which is higher than the 11% recorded in the urban centers [23]. More so, urban women are more likely to have more education than their counterparts in the rural areas. The median years of schooling by urban women in 2014 was 8.5 years, which exceeded the 5.7 years by rural women [35].
Girls residing in rural areas in Ghana are more likely to marry at an early age compared to their counterparts in the urban centers. Due to the high incidence of poverty in the rural communities, parents usually pressure their daughters to marry early to relieve them of financial burdens. Again, the rate of teenage pregnancy and early motherhood in the rural areas surpass that of the urban centers because of the low patronage of family planning services in these areas. The higher rate of dropout of girls due to early marriage and motherhood in the rural areas cause gender disparity in education to be wider in those communities than in the cities [21].

3. Literature Review

Parental expectations of their children’s education play a critical role in the academic successes of their wards. Jacob (2010) [30] posited that its impact on the education attainment of children is the most pronounced among the four dimensions of parental involvement which include parental engagement in school-related activities, supervision at home and parent–child communication about school. Parental expectations, as defined by Yamamoto and Holloway (2010) [36], are realistic beliefs or judgments that parents have about their children’s future achievement as reflected in course grades, highest level of schooling attained, or college attendance. It is what parents actually believe their children can achieve in education. There are numerous research findings that support a positive relationship between parental expectation and educational achievements.
Yamamoto and Holloway (2010) [36] explained four trajectories through which parents’ expectations influence their children’s performance at school. First, parental expectations signal to children the confidence their parents have in them in terms of their academic achievements. This confidence becomes the norm that the children strive to attain. Second, children’s confidence about their own competence and capacities is boosted by the high expectations from parents and vice versa. Also, parents with higher expectations tend to be more involved in their children’s education. They invest quality time and resources in their schooling. They tend to spend more time helping their children with their homework, partake in school activities, communicate more with their teachers, and provide counselling and support. Finally, the performance of teachers is influenced by the expectations that parents have for their children. If teachers perceive that parents have high expectation for their children’s academic achievement, they will be motivated to work harder, as they know their effort will be complemented by parents at home.
The inclusion of parental expectations in the analysis of education is mostly in the domain of sociology and psychology. Most research in these academic fields that studied expectations of parents employed qualitative measures before re-coding them to be used in the analysis. The measurement approach includes the usage of categorical variables, constructs, and (in some cases) continuous variables.
A number of authors who studied the effect of parents’ expectation of educational attainments used a categorical variable for its measurement. For instance, using the Growing Up in Ireland (GUI) survey, Banks et al. (2016) [28] explored the effect of parental expectation on the academic success of disabled children who were 13 years old. Those included in their study suffered from general learning/intellectual disability, specific learning disability (such as dyspraxia, dyslexia), socio-emotional disability, and physical disability (such as mobility, visual and hearing impairment). Children whose parents who said they do not expect their children to attain more than Leaving Certificate education had poor academic performance compared to those whose parents had higher expectations. A similar approach was used by Einglund et al. (2004) [37], who investigated the impact of parents’ expectation on the educational success of 187 children from low-income families. Using a semi-structured interview, parents ranked how far they think their children would go in school. The responses ranged from “will not complete high school,” which was coded as 1, to “will go to graduate or professional school,” which had a code of 5. It was found out that the educational achievement of children from homes where parents have high expectations surpassed their counterparts. Studies by Kim et al. (2017) [27] and Gill and Reynolds (1999) [38] were not different from that of Einglund et al. (2004) [37].
In the case of O’Donnell (2007) [39], parents chose the probability that their children would 1) obtain a high school diploma by age 20, 2) obtain a college degree by age 30, 3) be employed by age 30, 4) be in jail by age 20, and 5) be a parent by age 20. The first three options were classified as positive expectations, and the remaining two were viewed as negative. The study used data from National Longitudinal Survey of Youth (NLSY97), and the participants included children who were aged 12–16 on 31 December 1996 and their parents. It was revealed that the positive expectations were associated with good outcomes, while the negative ones brought bad achievements.
Other studies used a construct in the measurement of parental expectation. For example, Jacob (2010) [30] examined the effect of parental expectation on the educational attainment of their wards using the Scale of Educational Aspirations and Expectations for Adolescent (SEAEA). Parents answered to 29 questions with each response ranging from strongly disagree to strongly agree. The responses were then loaded onto a single factor, and a path analysis was used for the exploration. In all, 598 parents of eighth to 10th grade students were sampled for the study. The result was the same as the other studies stated above. Weerasinghe and Panizzon (2015) [40] and Leung and Shek (2011) [41] employed a similar strategy to investigate why children from Asian lineage attain better performance in mathematics than others. Their constructs revealed that the “tiger” parents from Asia have high expectations for their kids and this accounts for their (children’s) higher performance and educational attainment.
Only a few studies used a continuous variable in the measurement of parental expectations. Zhan (2006) [42] transformed the categorical variable he used to measure parents’ expectation into a continuous variable. The question was “looking ahead, how far do you think your child will go in school?” The response by parents ranged from “leave high school before graduation,” coded as 1, to “take further training after college,” coded as 5. The author argued that the distribution of the response approached normality and there was a slight negative skew so the variable was treated as a continuous variable. The dataset used was the National Longitudinal Survey of Youth (NLSY79). The results showed that there is a direct relationship between expectations of parents and school performance. Clophus (2018) [26], on the other hand, employed the Career-Related Parent Support Scale (CRPSS) to measure parental expectations. The CRPSS contains 27 questions on a five-point Likert scale ranging from strongly disagree (1) to strongly agree (5). Parents who had a score of 27 were classified as those with the least expectations, while a score of 135 was seen as the highest. The participants included 58 males and 95 females from two high schools in Southwest Louisiana and their parents. The findings revealed that parental expectations had no significant effect on general educational successes as well as that of boys and girls.
It is worth noting that, although the expectations of parents positively impact on the educational achievement of their children, setting unrealistic target for children can be counterproductive. If children feel too much burden as a result of very high expectation from parents, they may work beyond their abilities and capabilities, which can cause emotional breakdowns, depression, etc. They may be demotivated if their relentless efforts do not achieve what their parents expected.

4. Methodology

The purpose of most evaluation studies is to make causal claims, i.e., to determine the effect of a treatment, an intervention or a program on an outcome variable. Counterfactuals are the key to understanding causal inferences. A counterfactual is simply the unobserved outcome of a studied agent. To obtain an unbiased causal estimate, the estimation technique used should be able to reconstruct a counterfactual for the observed outcomes [43,44,45].
Randomized controlled trials (RCTs) or experiments are the gold standards in generating counterfactuals for estimating causal effects. With this method, there is a random assignment of those who received the treatment (henceforth, the treated group/subject) and those who did not (henceforth, the untreated/control group) to either group making them similar in terms of their pre-treatment baseline characteristics. Technically, the control group serves as a counterfactual to the treated subjects in RCTs or experiments [31].

4.1. Observational Study

Most researchers in management studies use observational data. This is because large volumes of data can be obtained at a relatively cheaper cost compared to experiments. Others resort of this type of data due to ethical reasons. However, observational data often suffer from self-selection bias, which results in endogeneity [46]. Self-selection bias arises because there are often some baseline characteristics that influence some subjects to be selected into the treated group and others into the control group. There is mostly a systematic difference between the treated and untreated subjects even before the treatment is applied. The control group cannot be used as a counterfactual of the treated group since the two groups are not similar prior to the treatment. This makes the computation of the average treatment effect from the mean difference in the outcome variable between the two groups biased. The estimate will be uninterpretable and is not attributable to the treatment.
Self-selection bias threatens the internal validity of the variable or construct. It acts as an excluded or omitted variable from the model, and if not addressed, it will cause the treatment variable and the error term to correlate, leading to endogeneity [46].

4.2. Propensity Score Matching (PSM)

A good estimation technique to deal with the endogeneity resulting from self-selection biasedness is the Propensity Score Matching (PSM) introduced by Rosenbaum and Rubin (1983) [47]. This approach mimics RCTs by reconstructing counterfactuals for the treated studied agents from the observational data. For each subject in the treated class, PSM finds an observation(s) in the control group that has (have) similar characteristics to act as counterfactual(s). It does this by combining propensity score with an appropriate matching algorithm.
Propensity score, as defined by Rosenbaum and Rubin (1983) [47], is the likelihood that a studied agent will be assigned to a treatment class based on its pre-treatment characteristics. In estimating the propensity score (PS), the treatment variable (which is binary) is used as the dependent variable in the PS model, while the covariates serve as the independent variables. The logit or probit regression is then fitted using the measured values of the covariates. Once it has been computed, an agent in the control group whose propensity score is the same or close to the propensity score of another subject in the treated group is deemed as its counterfactual. It is recommended that the studied subjects should be stratified into five or more classes using their estimated PS, as this reduces about 90% of the bias in the covariate(s) between the treated and the control groups within each class [48]. The study used 1:1 matching. With this approach, each treated subject is paired to only one observation in the control group. After that, matching without replacement where an untreated agent that has been paired to a treated subject is not used again for matching was used.
Once the aforementioned procedure is done, the average treatment effect on the treated (ATT) can be computed as the mean difference in the outcome variable between treated group and their paired untreated counterparts after the treatment has been applied. Figure A1 in the Appendix A summarizes the steps used in PSM.

5. Dataset

5.1. Source of Data

The data set used for the analysis of this study is the sixth round of the Ghana Living Standard Survey (GLSS 6). GLSS 6 is a secondary data set that concentrates on the household as the main socio-economic unit. The survey used a two-stage stratification procedure to select the participating households. First of all, Ghana is divided into 10 strata according to the number of regions. Within each region, households are grouped in accordance to their place of residence, i.e., whether they reside in an urban or rural area.
In all, 18,000 households, which is a nationally representative sample, were covered in the survey. Only 16,772 out of the 18,000 households were successfully enumerated, which accounts for the 93.2% response rate. The GLSS 6 provides a detailed insight on the living conditions of the households involved. The data covers demographic characteristics, educational attainment, housing and income of household members.
The study considered all boys and girls of senior secondary/high school (SSS/SHS) age who still reside in their parents’ home and have no missing value for any of the variables used. As a result, 1368 boys and 1111 girls were used in the data analysis. Separate propensity score matching models were estimated for each gender.

5.2. Treatment and Outcome Variables

The study used enrolment in senior secondary/high school (SSS/SHS) as the outcome variable in its analysis. Boys and girls of relevant school age who have ever been enrolled in SSS/SHS were coded as 1 and 0 if otherwise. The treatment variable, which is parental economic expectation for child’s education, measured by intra-household income inequality, is obtained by subtracting the child’s father income from the income of his/her mother. A positive real number, implying a higher income for the father relative to the mother, was coded as 1 and 0 if otherwise.

5.3. Selection of Covariates

It is important to choose the right covariates in modeling the propensity score. Empirical studies and Monte Carlo simulations have proved that only true confounders (covariates that simultaneously influence the treatment and the outcome variables) and potential confounders (covariates that influence the outcome variable) should be included in the propensity score model. The exclusion of true confounders from the model violates the strongly ignorable assumption and will make the ATT estimate biased [44,49].
Following the steps of Moheyuddin (2005) [16], father’s and mother’s educational level (years spent in school), age of the child, place of residence (whether rural or urban), and wage earned by the child were used as confounders. Other covariates used include average minutes spent on domestic chores daily, marital status, and whether or not the respondent has a child. Thus, the aforementioned variables were used as independent variables in the propensity score model where economic expectations of parents served as the dependent variable. However, to achieve a balance in the covariates between the treated and control groups within each stratum, the square of the father’s education and the interaction of the father’s and mother’s education were included in the re-specified PS models.

6. Analysis of Data

6.1. Descriptive Statistics

This sub-section discusses the descriptive statistics for variables used in the separate PS models for boys and girls. The data confirms that parents in Ghana expect their sons to reap more economic benefits from education than girls. It was revealed that on a scale of 0 to 1, boys had an average of 0.53 in terms of expectation from parents, compared to 0.49 for girls. Table 1 displays the statistics for the continuous variables while Table 2 portrays that of the categorical variables. As shown in Table 1, the mean years of schooling of parents of girls outweighed that of boys. Fathers of girls spent an average of 8.92 years in school, while their mothers have 6.84 schooling years. The number for fathers and mothers of boys stood at 8.86 and 6.68 years respectively. Also, girls of SSS/SHS going age earned more weekly wages (₡111.74 GH ≈ $21.4 USD) and spend more minutes on domestic chores (169 min) than their male counterparts. The respective figures for boys are ₡99.51 GH ≈ $18.15 USD and 55 min, respectively.
The percentage of boys who have ever been enrolled in a senior secondary slightly surpassed proportion for girls. Table 2 showed that 29.82% of boys of the relevant age have obtained senior secondary education. The rate for girls was 29.34%. The percentage of boys who reside in urban areas (25.15%) marginally exceeded their female counterparts (24.57%). More girls than boys aged between 15 and 19 years have been enrolled in senior secondary schools. However, the proportions of boys of age cohort 20–24 and 25–29 years old who have had senior secondary education are more than girls of the same age groups. The ratio of secondary and tertiary school-going age girls who are married and have at least a child to boys is 10:1.

6.2. Covariate Balance Diagnosis

A critical component of propensity score matching is the balancing of covariates between the treated and untreated groups. If the covariates between the two groups are not balanced, the average treatment effect on the treated (ATT) cannot be computed as the difference in the means (in the case of continuous outcome variable) or proportions (in case of dichotomous outcome variable) of the outcome variable. There are several statistical tools used in checking the balance of these pre-treatment variables between the two groups. They include the t-test, the standardized difference, and other graphical displays such as the box plots and cumulative frequency function. In the event where these tools prove that there is no equality between the covariates in the treated and untreated groups, the PS model has to be re-specified to include higher-order moments of covariates and/or interactions between covariates [43,44].
The PS model of the study initially used the father’s and mother’s education together with residence of household, the respondent’s age, and their weekly wages as the pre-treatment characteristics. After classifying the subjects into strata, the balancing diagnosis revealed that the covariates between the two groups were not balanced. The “troublesome” variable was father’s education, which was not balanced in most of the strata. The square of father’s education and an interaction between the former and mother’s education were included in the re-specified PS model.
Results from the simple t-test indicated that the difference between means of each covariate in the treated and control groups within each stratum was not statistically significant as portrayed by Table A1 in the Appendix A. Table A1 reports the p-values of the t-test for the mean difference of each of the pre-treatment variables within each stratum. All the p-values exceeded 5% implying that there was no significant difference between the control and treated classes at 5% significant level. Balancing of covariates in the boys’ PS model was achieved with six strata, while five blocks were enough for the girls’ model to attain equality. Table A2, which showed the standardized difference before and after the matching, confirmed the results from the t-test (readers can resort to Li (2013) [43] for a detailed explanation on standardized difference). A standardized difference (SD) of less than 0.1 is considered negligible and hence no significant difference between the means of variable in the two groups [44]. All the variables had SD values of more than 0.1 before the matching was done. The matching, however, reduced the SD for each of the covariates to figures less than the threshold value.
Numerical analysis of balance of covariates takes into account the means of the variables and in some cases their standard deviations. This approach has a limitation as it considers only one or two dimensions of the variable. The means of the variable between the two groups may be the same but their mode, median, quantiles and other statistical summaries may differ. Linden (2015) [50] proposed the use of graphical displays to assess how equal the variable is between the two groups in terms of multiple dimensions. Since the estimated propensity score summarizes the distribution of all the covariates, the study employed the box plot and the cumulative frequency function of the estimated propensity score of the treated and untreated groups to assess the equality of the covariates. Figure A2 shows the box plots for boys and girls, while Figure A3 displays the cumulative frequency of their estimated propensity scores between the groups. The figures demonstrated that, in the case of both boys and girls, there is no statistical difference of the composite covariates (estimated PS) between the treated and control groups.

6.3. Estimating Causal Effect

After the covariates between the treated and control groups have been balanced within each stratum, the average treatment effect on the treated (ATT) was computed using the stratified matching. The formula for stratified matching is expressed as
A T T = q = 1 Q ( i I ( q ) Y i T N q T j I ( q ) Y j C N q C ) N q T N T
where Q is the number of strata used to achieve a balanced covariate, and Y i T and Y j C represent the value of the outcome variable for subject i in the treated group and its paired subject j in the control group respectively. N q T and N q C are the number of treated and control subjects in block q. N T , on the other hand, is the number of treated subjects in the entire study.
Estimates from the stratified matching showed that the ATT effect of parental expectation of the economic benefit of education on boys’ enrolment in senior secondary is 0.048 while the effect on girls figured around 0.029. The estimate for boys is significant at 5%, while that of girls is 10%.

6.4. Sensitivity Test

The last step in PSM analysis is to assess the sensitivity of the causal estimates to unobserved confounders. The ideal way is to compare the ATT estimate with the results of a similar study that used an experimental data. However, such results may be unavailable in a practice setting. An alternative approach is to re-specify the PS model by dropping or adding higher-order covariates such as quadratic or interaction terms. If the original estimated effect does not differ significantly from the re-specified model, then the ATT estimate is less sensitive and hence unbiased [43].
The squared of father’s education as well as the interaction of the former and mother education were dropped to re-calculate the propensity score and ATT. The estimation results after dropping those variables indicated that parental economic expectation increase boys’ senior secondary education by 0.043, and the effect for girls stood at 0.027. The new estimates pointed out that the original ATT estimates are insensitive and therefore unbiased.
Furthermore, Figure A4 in the Appendix A indicated that there is an overlap in the distribution of covariates between the treated and untreated group for both genders. This validates the results obtained in Table 3.

7. Discussion and Conclusions

Ghana, like most sub-Saharan African countries, continues to bedevil with gender imbalance at the higher levels of the educational hierarchy. Among the several socioeconomic factors that account for why more girls than boys do not attain secondary education is parental expectation of the economic benefits their sons and daughters will gain from education. This study investigated the role that this variable plays on gender disparity in the senior secondary schools. The data revealed that, on the average, Ghanaian parents expect their sons to reap more economic benefits from education than their daughters. The higher expectation for boys encourages parents to invest more in their sons’ education compared to their daughters. Results from Table 3 showed that parental expectation for sons increase the probability of boys’ enrolment in a senior secondary school by 0.048 while the figure for girls is 0.029 [51]. The estimate for boys is significant at 5%, while that of girls is 10%. Thus, boys are 1.66 times more likely than girls to attain senior secondary education due to parents’ expectation that they (boys) will gain more economically from education than girls.
The finding is consistent with the assertion in the literature that there is a positive relationship between parental expectation on education and academic achievements [26,27,28,29,30]. Ghanaian parents invest more monies and spend quality time on their sons’ education as against that of their daughters because they believe that top positions and high-paying jobs on the labor market is male-dominated and therefore boys will gain more economically from education than girls. Also, the confidence of boys is boosted because they know their parents expect more from them academically than girls. This confidence becomes the norm, which motivates them (boys) to attain higher levels of education [36].
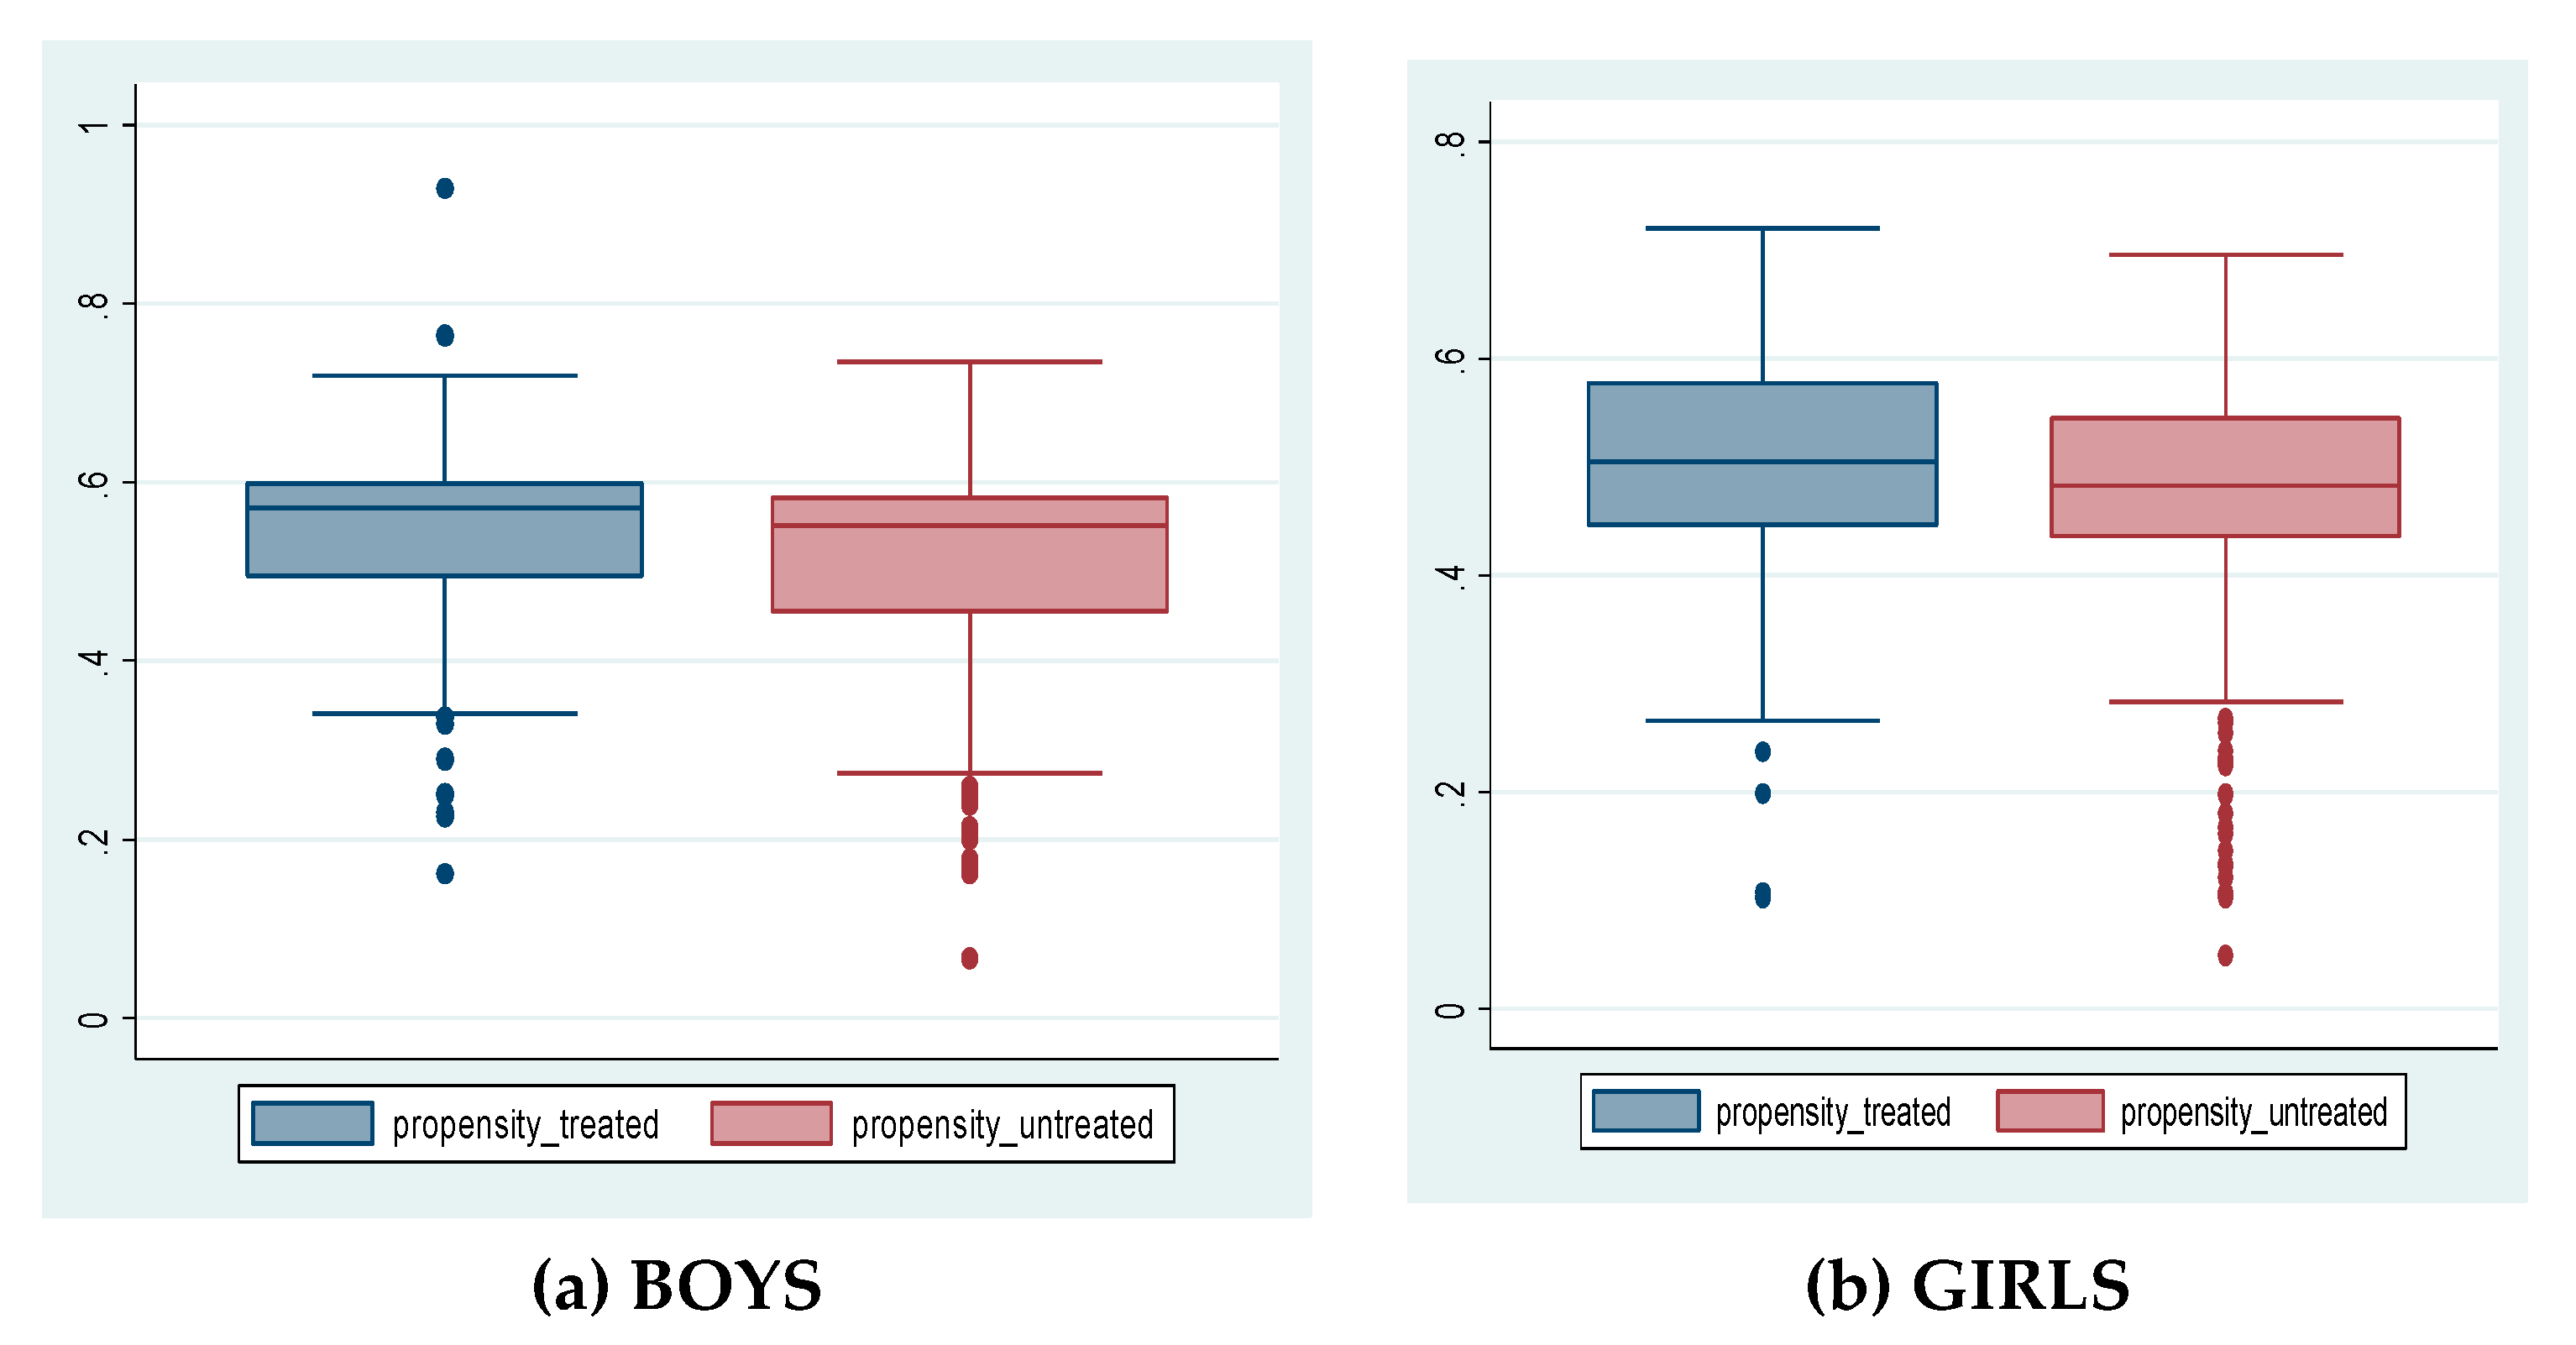
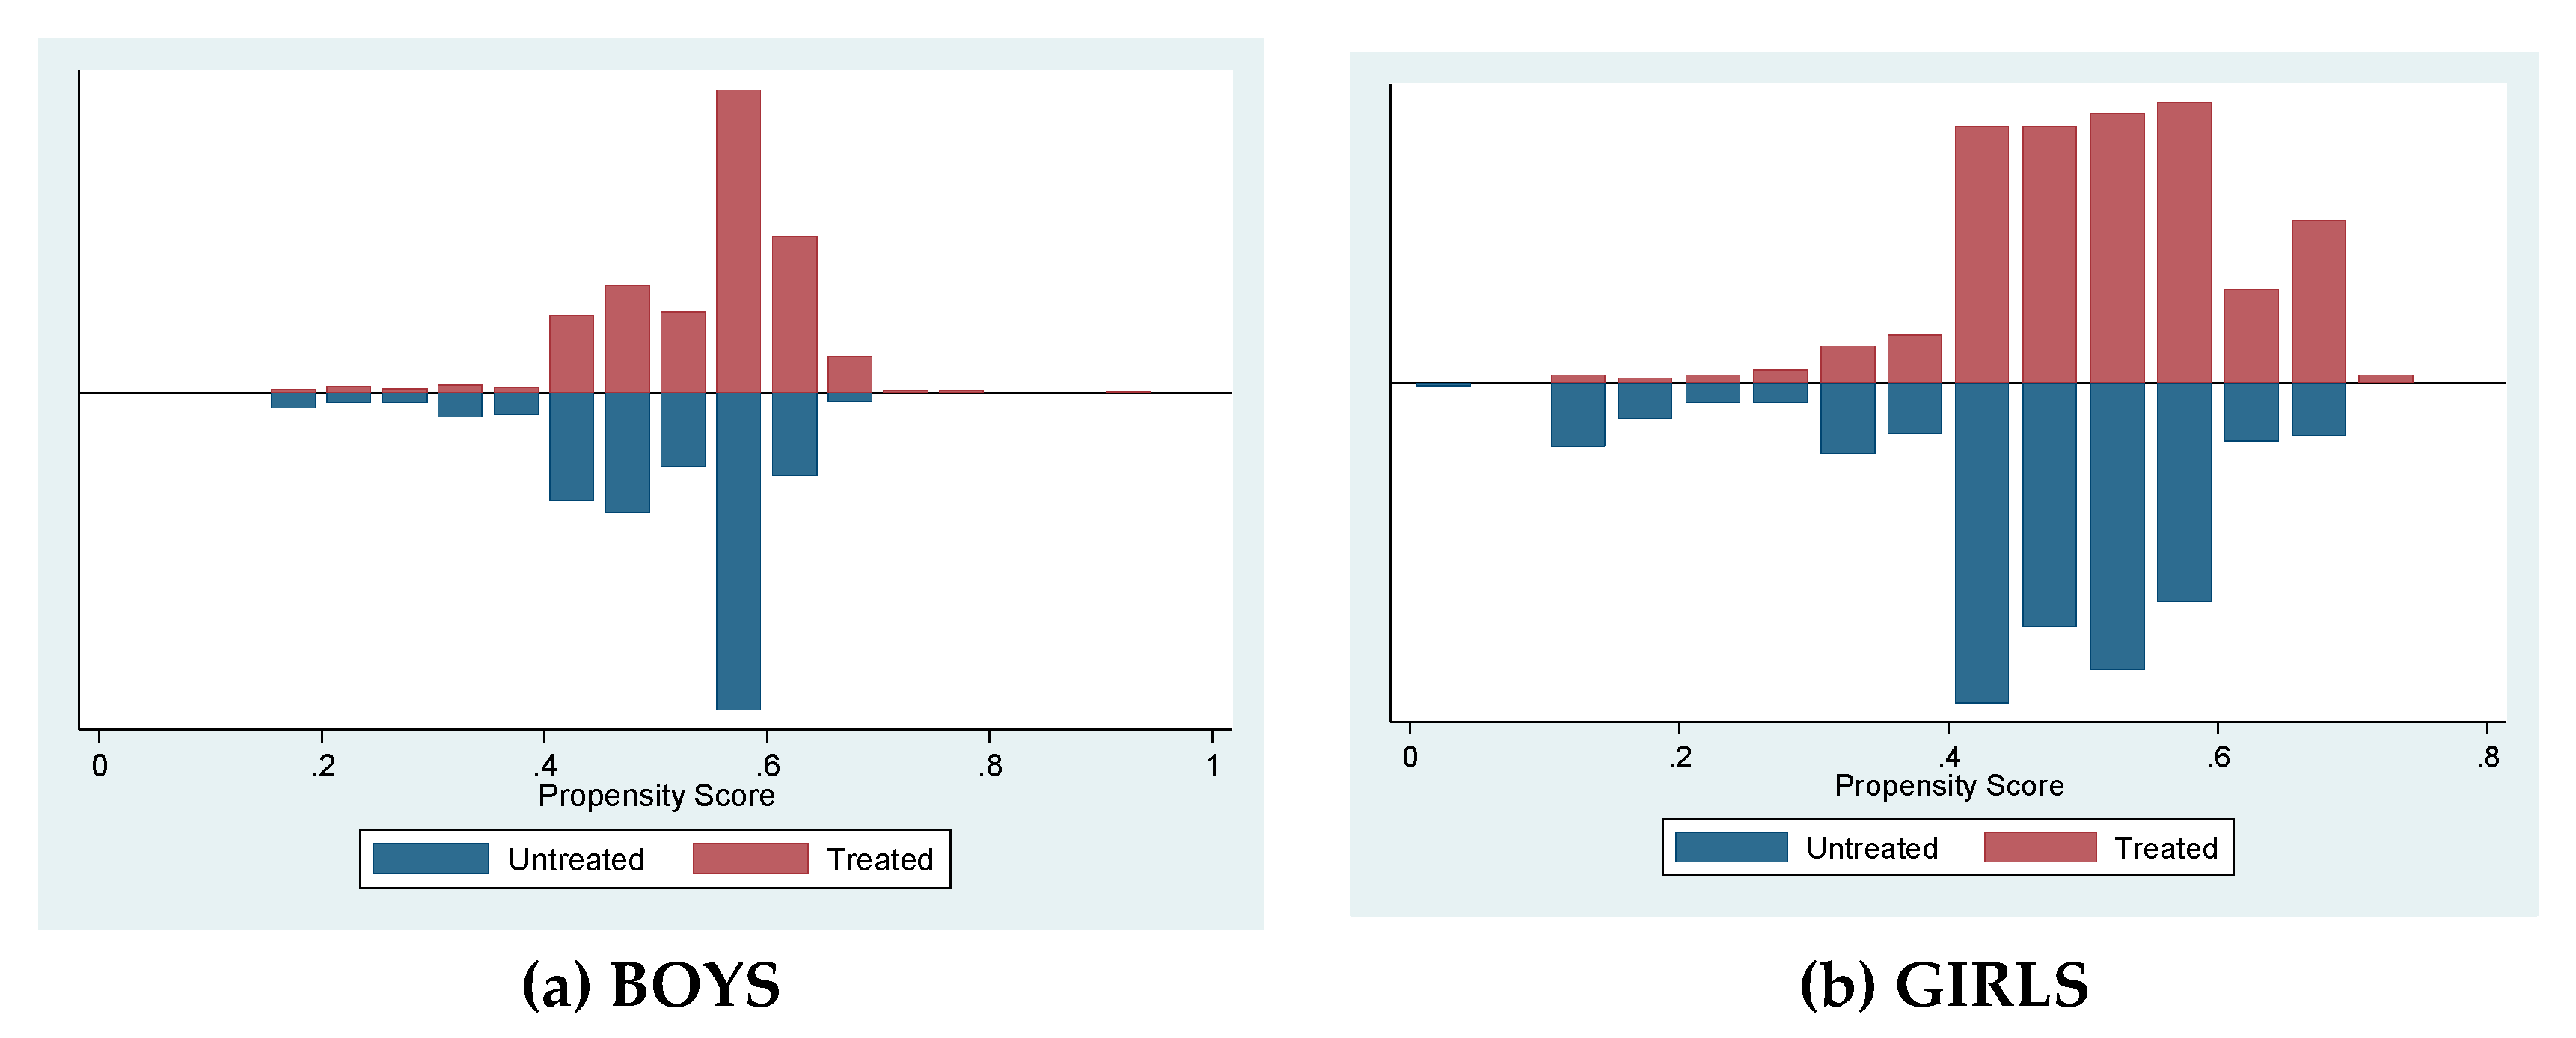
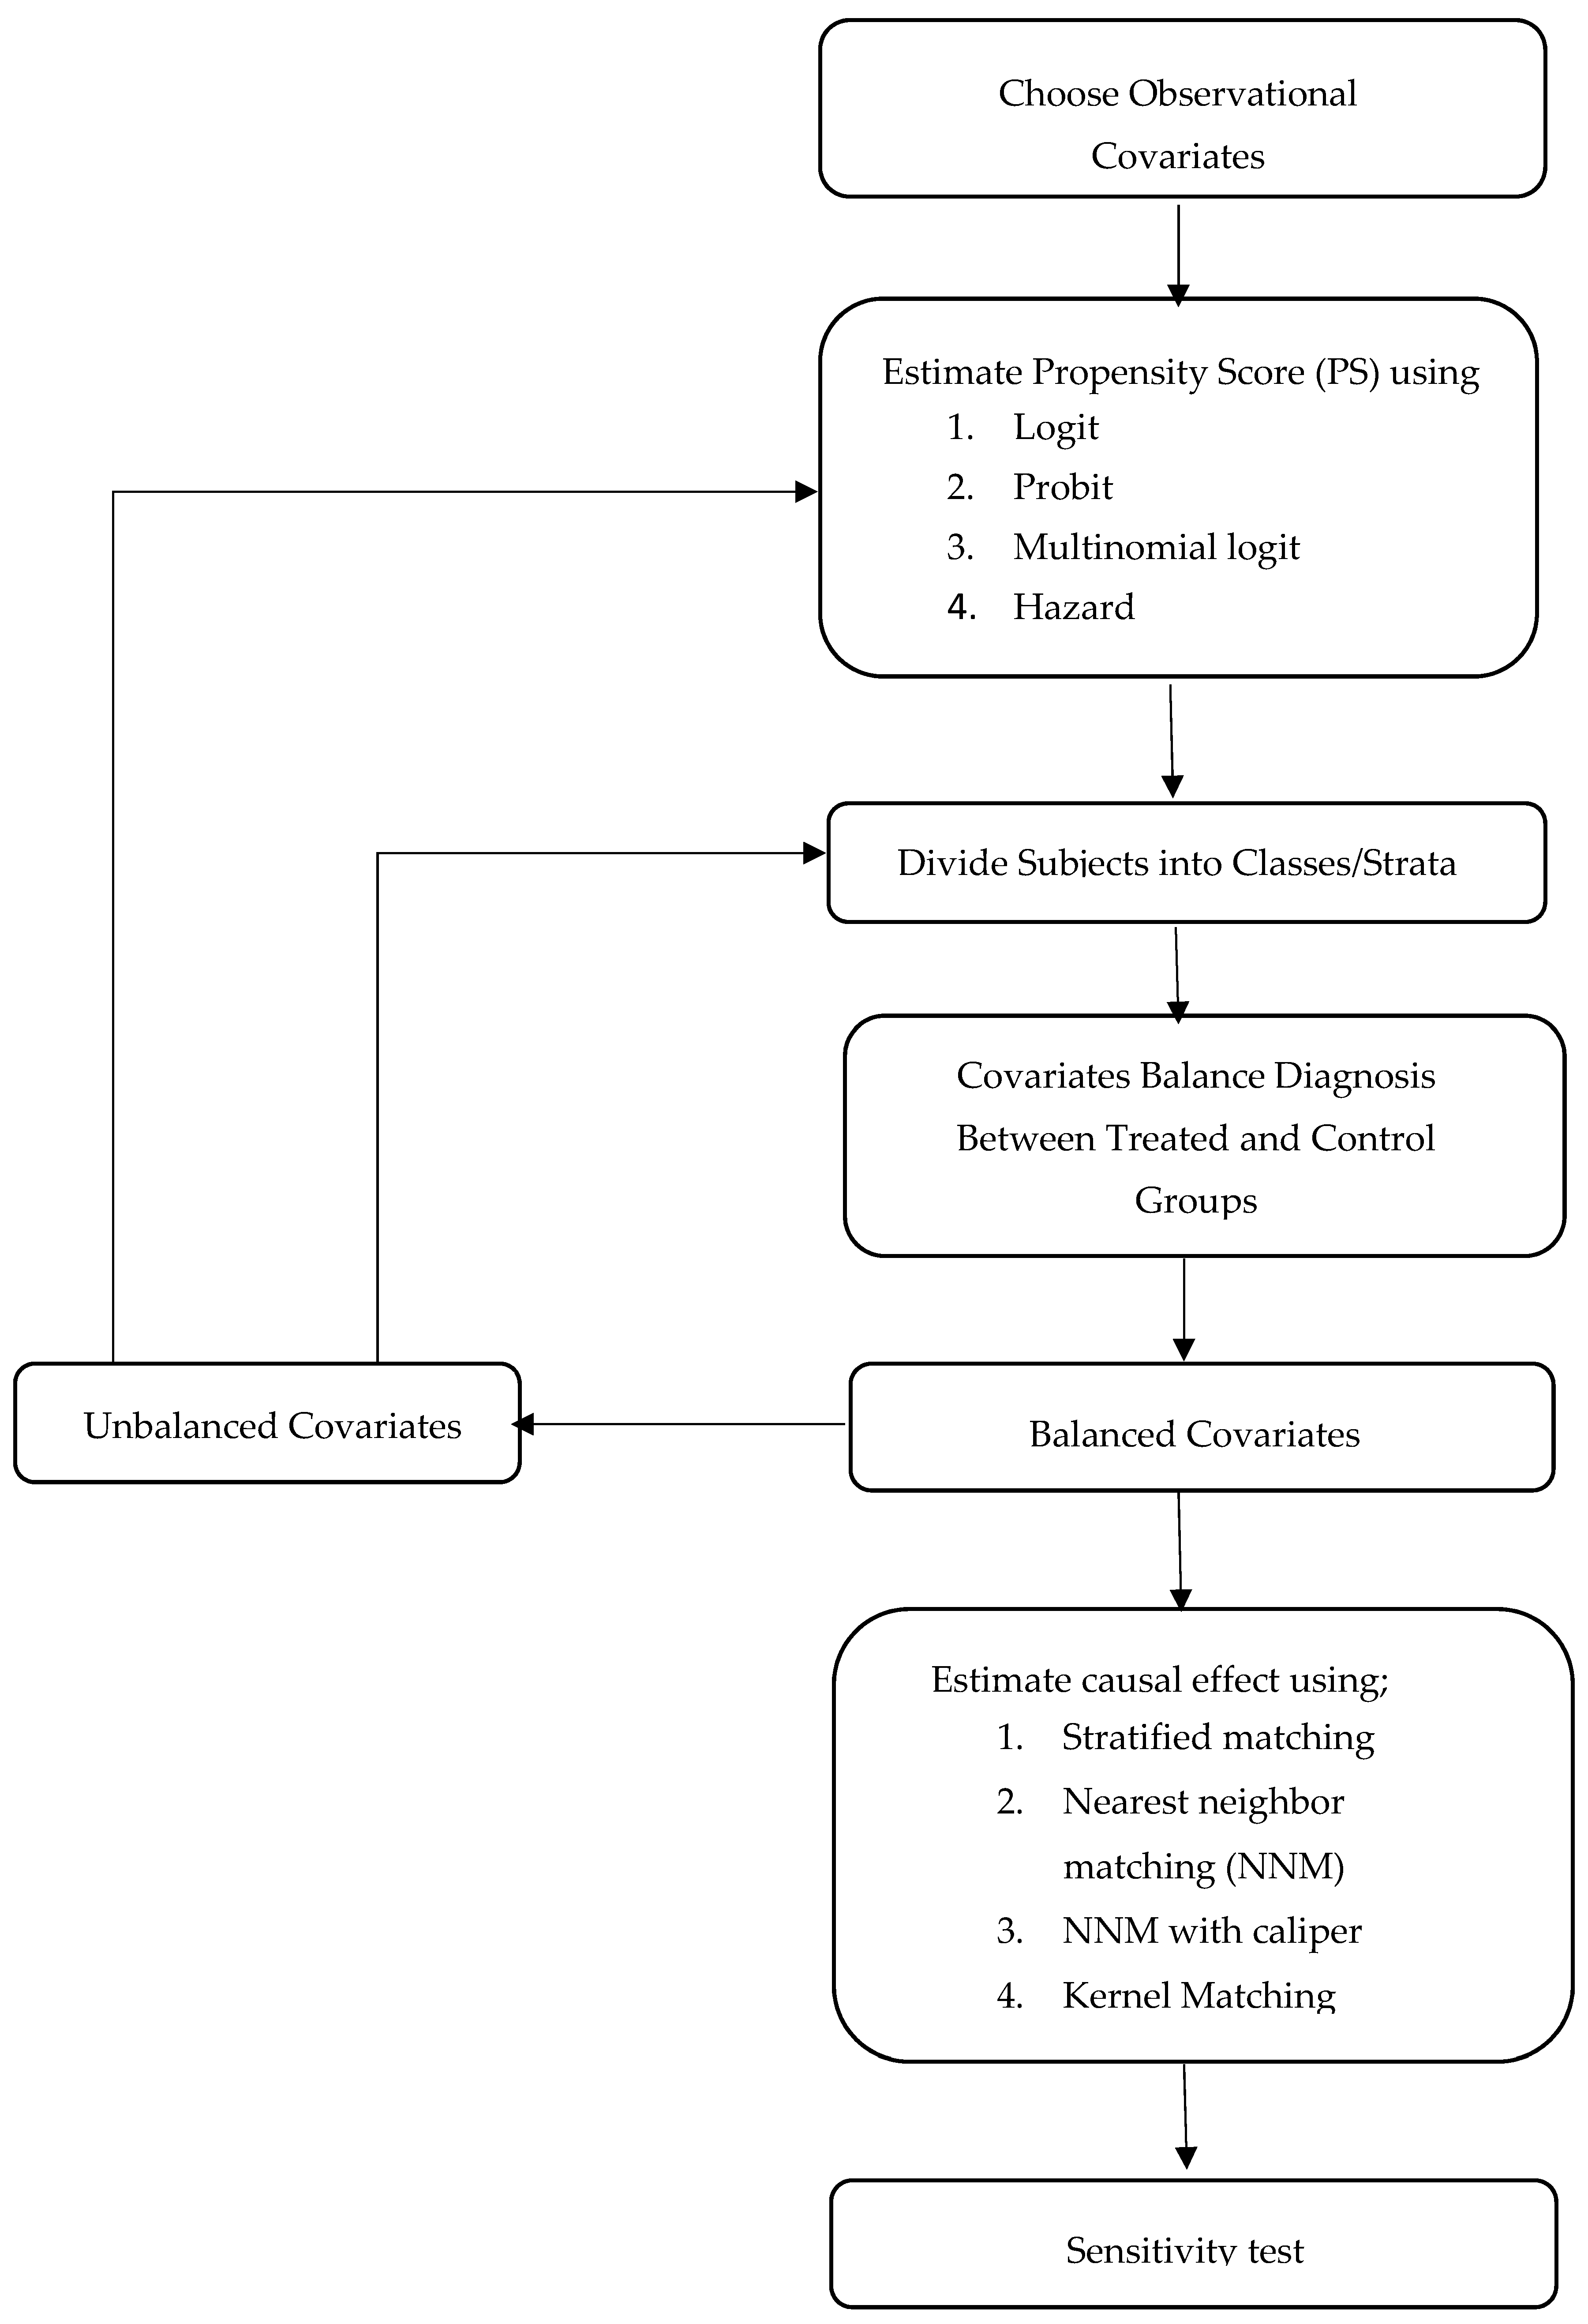
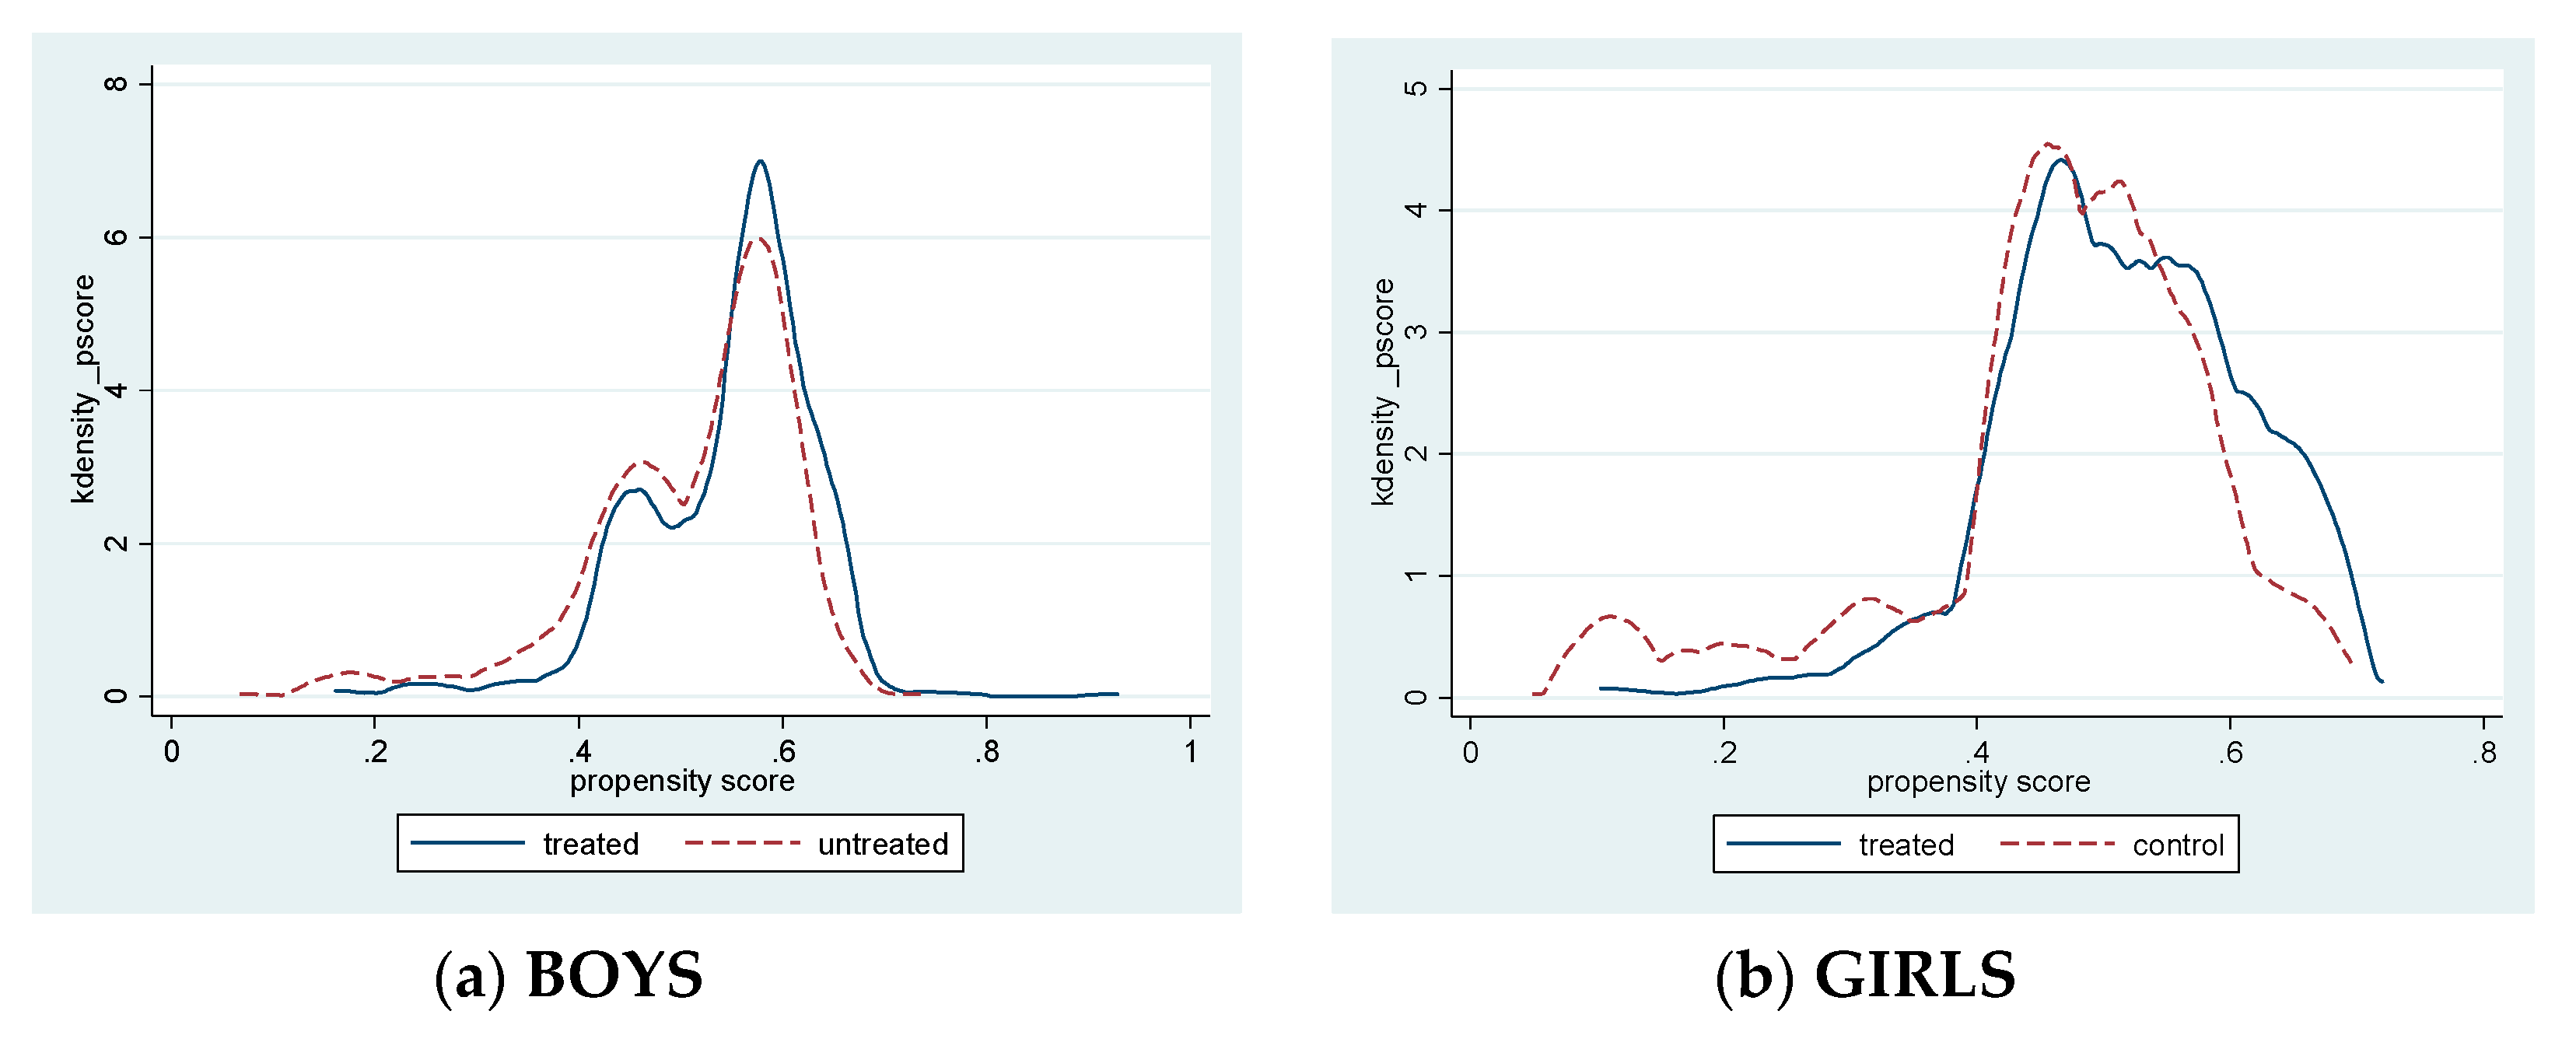
The study employed propensity score matching (PSM) in its analysis. This estimation technique is preferred to other methods because it overcomes the problem of self-selection bias inherent in observational data. Self-selection bias—the likelihood that some subjects will be selected into the treated group and others into the control group based on some pre-treatment characteristics—threatens the validity of causal estimates. If not solved, estimated results will be biased and uninterpretable. PSM is a good estimation method that eliminates the endogeneity that arises from self-selection bias. PSM is becoming increasingly proper because of its ability to reconstruct observational data to mimic an experiment, which is the gold standard for making causal inferences. Our estimates are therefore free from bias resulting from self-selection and hence are unbiased and interpretable. The sensitivity analysis allowed us to test how susceptible the estimates are to other cofounders. The results showed that our estimates are less sensitive to the inclusions or exclusions of other variables.
The findings from the study revealed that a plausible solution to combat gender inequality in Ghana’s educational system, especially at the higher levels, is to eliminate gender imbalances at the workplace. Men continue to be over-represented at top positions and high-paying jobs. This deepens the negative traditional view parents have about the future prospects of the female children. Appropriate policies should be implemented to ensure that barriers that prevent women from occupying such positions are expunged. With this, parents will believe that girls can have the same economic opportunities as boys and hence will invest equal resources in their children irrespective of their gender.
It is, however, important that Ghanaian parents change their stereotypical notion that girls from household where there is income inequality in favor of men will earn less income from education. This is so because, if given an equal opportunity, girls from such homes can outperform their male counterparts in the pursuit of higher levels of education that can consequently eliminate the gender gap in wages on the Ghanaian labor market.

Author Contributions

Conceptualization, P.D., D.Y. and G.A.-B.; methodology, P.D.; validation, D.Y., formal analysis, P.D., D.Y. and G.A.-B.; investigation, P.D. and D.Y.; writing—original draft preparation, P.D.; writing—review and editing, D.Y.; supervision, D.Y.

Funding

This research received no external funding.

Acknowledgments

I would like to express my profound gratitude to my wife, Doris Gyekye, Kwasi Sarfo-Adu, and Faustina Amponsah Partey for their painstaking effort in proofreading this article.

Conflicts of Interest

The authors declare no conflict of interest.

Appendix A

Figure A1. Steps for estimating treatment effect. Source: Li (2013) [43].
Sustainability 11 06707 g0a1
Table A1. Simple t-test for a balancing covariate diagnosis within each block/stratum.
BOYSGIRLS
BLOCKSBLOCKS
Covariates12345612345
Father’s education0.5580.4790.1860.7120.7430.6340.2710.4560.3780.4870.436
Mother’s education0.4620.3340.1830.4860.5580.5230.2510.6120.7340.9110.861
Father’s education squared0.6230.6780.2170.5670.8490.7340.3790.7800.3740.4420.156
Father’s education ∗ mother’s education0.6340.7540.2370.4870.7780.3210.2650.6230.2780.7460.192
Age cohort
20–240.4360.6430.7420.4870.5430.3210.2630.4340.4460.2510.532
25–290.3450.2310.6660.4420.5210.4380.3340.2760.4300.4280.174
Urban0.3290.3420.2670.6330.3610.2360.9820.1920.5340.3570.242
Child’s wage0.3740.7340.3230.2340.4420.7230.6230.2930.6340.1470.542
Av. minutes on domestic chores0.4360.5890.4430.6780.1110.4560.6710.2310.4320.3870.789
Married0.5470.1820.2060.4210.6570.2310.8750.1450.2130.5530.331
Has a child0.3240.4750.3960.3920.7750.4230.6660.4520.3340.2130.423
Table A2. Standardized difference of covariates before and after matching.
BOYSGIRLS
Standardized DifferenceStandardized Difference
CovariatesUnmatchedMatchedUnmatchedMatched
Father’s education10.30.0023.2−0.03
Mother’s education3.20.0353.10.007
Father’s education squared7.9−0.0734.80.057
Father’s education ∗ mother’s education−8.30.0241.70.003
Age cohort
20–24−13.7−0.0325.7−0.06
25–292.60.048−10.50.047
Urban−9.5−0.0035.2−0.038
Child’s wage6.90.019−9.80.028
Av. minutes on domestic chores8.90.076−10.60.068
Married−1.7−0.0024.10.005
Has a child2.40.0566.2−0.045
Figure A2. Box plots of estimated propensity score for treated and untreated class.
Sustainability 11 06707 g0a2
Figure A3. Cumulative density function of estimated propensity score for treated and untreated class.
Sustainability 11 06707 g0a3
Figure A4. Distributional overlap of covariates between untreated and untreated groups.
Sustainability 11 06707 g0a4

References

  1. Reeves, H.; Baden, S. Gender and Development: Concepts and Definitions; BRIDGE—Institute of Development Studies, Report No. 55; University of Sussex: Brighton, UK, 2000. [Google Scholar]
  2. GCE. Gender Discrimination in Education: The Violation of Rights of Women and Girls. Available online: www.campaignforeducation.org/docs/reports/GCE_INTERIM_Gender_Report.pdf (accessed on 15 June 2019).
  3. USAID. Education from a Gender Equality Perspective. 2008. Available online: www.ungei.org/resources/files/Education_from_a_Gender_Equality_Perspective.pdf (accessed on 13 June 2019).
  4. USAID. Gender and Extreme Poverty: Getting to Zero. 2015. Available online: https://www.usaid.gov/sites/default/files/documents/1870/Gender_Extreme_Poverty_Discussion_Paper.pdf (accessed on 13 June 2019).
  5. Sheehan, K. Does Gender Inequality in Education Affect Educational Outcomes? Bachelor’s Thesis, University of Connecticut, Storrs, CT, USA, 2012. [Google Scholar]
  6. Bandiera, O.; Natraj, A. Does gender inequality hinder development and economic growth? Evidence and policy implications. In Policy Research Working Paper WPS6369; The World Bank Group: Washington, DC, USA, 2013. [Google Scholar]
  7. Burgess, S. Human Capital and Education: The State of the Art in the Economics of Education; IZA DP No. 9885; Institute for the Study of Labor: Bonn, Germany, 2016. [Google Scholar]
  8. Marimuthu, M.; Arokiasamy, L.; Ismail, M. Human capital development and its impact on firm performance: Evidence from developmental economics. J. Int. Soc. Res. 2009, 2, 265–272. [Google Scholar]
  9. Kwon, D.-B. Human Capital and Its Measurement. In Proceedings of the 3rd OECD World Forum on “Statistics, Knowledge and Policy” Charting Progress, Building Visions, Improving Life, Busan, Korea, 27–30 October 2009. [Google Scholar]
  10. Krasniqi, F.X.; Topxhiu, R.M. The importance of investment in human capital: Becker, Schultz and Heckman. J. Knowl. Mgt. Econ. Inf. Technol. 2016, 6, 1–18. [Google Scholar]
  11. McConnell, R.C.; Brue, S.L.; Macpherson, D.A. Contemporary Labour Economics, 11th ed.; McGraw Hill Education: New York, NY, USA, 2016. [Google Scholar]
  12. OECD. The ABC of Gender Equality in Education: Aptitude, Behaviour, Confidence; PISA, OECD Publishing: Paris, France, 2015. [Google Scholar]
  13. UN. The World’s Women 2015: Trends and Statistics, 6th ed.; Department of Economic and Social Affairs, Statistics Division: New York, NY, USA, 2015. [Google Scholar]
  14. Wodon, Q.; De la Briere, B. The Cost of Gender Inequality Unrealized Potential: The High Cost of Gender Inequality; The World Bank Group: Washington, DC, USA, 2018. [Google Scholar]
  15. Baah-Boateng, W. Human capital development: The case of education as a vehicle for Africa’s economic transformation. Leg. J. Int. Aff. Dip. 2013, 7, 31–55. [Google Scholar]
  16. Moheyuddin, G. Gender Inequality in Education: Impact on Income, Growth and Development; MPRA Paper No. 685; Munich Personal RePEc Archive: Munich, Germany, 2005. [Google Scholar]
  17. Chimombo, J.; Chibwanna, M.; Dzimadzi, C.; Kunkwenzu, E.; Kunje, D.; Namphota, D. Classroom, School and Home Factors That Negatively Affect Girls’ Education in Malawi; A Report Submitted to UNICEF; CERT: New York, NY, USA, 2000.
  18. Shahidul, S.M.; Karim, A.H.M.Z. Factors contributing to school dropout among the girls: A review of literature. Eur. J. Res. Reflect. Educ. Sci. 2015, 3, 25–36. [Google Scholar]
  19. Emmanuel, L. The Influence of Household Chores on Girls’ Academic Performance in Secondary School in Morogoro Rural District. Master’s Thesis, The Open University of Tanzania, Arusha, Tanzania, 2015. [Google Scholar]
  20. Okepechi, P.A.; Eloma, U.E.; Bassey, E.E. Negative effects of domestic chores on role performance of academic women in tertiary institutions and the need for effective management and counselling in Cross River State—Nigeria. Int. J. Educ. Learn. Dev. 2016, 4, 12–22. [Google Scholar]
  21. Adam, S.; Adom, D.; Bediako, A.B. The major factors that influence basic school dropout in rural Ghana: The case of Asunafo South District in the Brong Ahafo Region of Ghana. J. Educ. Pract. 2016, 7, 1–8. [Google Scholar]
  22. Kipkulei, B.C.; Chepchieng, M.C.; Chepchieng, M.J.; Boitt, L.M. Selected factors affecting girls’ participation in primary school education in Kenya. J. Educ. 2012, 48, 52–61. [Google Scholar]
  23. GSS. Ghana Living Standards Survey (GLSS 6); Ghana Publication Ltd.: Accra, Ghana, 2014.
  24. Anku-Tsede, O. Maternity leave policy and work-family balance: Evidence from working mothers in Ghana. Bus. Mgt. Res. 2015, 4, 1–7. [Google Scholar]
  25. Nyantakyiwaa, A. Leadership styles practiced by females in leadership positions in the University of Cape Coast. Int. J. Res. Soc. Sci. 2014, 4, 52–58. [Google Scholar]
  26. Clophus, L.M.K. The Relationship between Parental Expectations and Post-Secondary Choices of High School Seniors. Ph.D. Thesis, Liberty University, Lynchburg, VA, USA, 2018. [Google Scholar]
  27. Kim, Y.; Huang, J.; Sherraden, M.; Clancy, M. Child development accounts, parental savings, and parental educational expectations: A path model. Child. Youth Serv. Rev. 2017, 79, 20–28. [Google Scholar] [CrossRef]
  28. Banks, J.; Maitre, B.; McCoy, S.; Watson, D. Parental Educational Expectations of Children with Disabilities; Research Series No. 50 Dublin 2; The Economic and Social Research Institute: Dublin, Ireland, 2016. [Google Scholar]
  29. Wang, X. The Influences of Parental Expectations on Children’s Academic Achievements: A Comparative Analysis of the United States and China. Master’s Thesis, Loyola University, Chicago, IL, USA, 2013. [Google Scholar]
  30. Jacob, M.J. Parental Expectations and Aspirations for Their Children’s Educational Attainment: An Examination of the College-Going Mindset among Parents. Ph.D. Thesis, University of Minnesota, Minneapolis, MN, USA, 2010. [Google Scholar]
  31. Antonakis, J.; Bendahan, S.; Jacquart, P.; Lalive, R. On making causal claims: A review and recommendations. Leadersh. Q. 2010, 21, 1086–1120. [Google Scholar] [CrossRef]
  32. Baden, S.; Green, C.; Otoo-Oyortey, N.; Peasgood, T. Background Paper on Gender Issues in Ghana. Available online: https://pdfs.semanticscholar.org/ddee/86acfcd0087228b142ff469155aa27c696f3.pdf (accessed on 23 July 2019).
  33. Wolf, S.; McCoy, D.C.; Godfrey, E.B. Barriers to school attendance and gender inequality: Empirical evidence from a sample of Ghanaian schoolchildren. Res. Comp. Int. Educ. 2016, 11, 178–193. [Google Scholar] [CrossRef]
  34. The World Bank. World Development Indicators. Available online: https://data.worldbank.org/country/ghana?view=chart (accessed on 18 July 2019).
  35. GSS. Ghana Demographic and Health Survey; Ghana Publications Ltd.: Accra, Ghana, 2014.
  36. Yamamoto, Y.; Holloway, S.D. Parental expectations and children’s academic performance in sociocultural context. Educ. Psychol. Rev. 2010, 22, 189–214. [Google Scholar] [CrossRef]
  37. Einglund, M.M.; Luckner, A.E.; Whaley, G.J.L.; Egeland, B. Children’s achievement in early elementary school: Longitudinal effects of parental involvement, expectations, and quality of assistance. J. Educ. Psychol. 2004, 96, 723–730. [Google Scholar] [CrossRef]
  38. Gill, S.; Reynolds, A.J. Educational expectations and school achievement of urban African-American children. J. Sch. Psychol. 1999, 37, 403–424. [Google Scholar] [CrossRef]
  39. O’Donnell, C. Impact of parental expectations on education and employment outcomes. In Virginia Policy Review; University of Virginia: Charlottesville, VA, USA, 2007; pp. 14–22. [Google Scholar]
  40. Weerasinghe, D.; Panizzon, D. A cross-cultural comparison of parental expectations for the mathematics achievement of their secondary school students. In Mathematics Education in the Margins, Proceedings of the 38th Annual Conference of the Mathematics Education Research Group of Australasia; Mathematics Education Research Group of Australasia (MERGA): Adelaide, Australia, 2015; pp. 635–642. [Google Scholar]
  41. Leung, J.T.Y.; Shek, D.T.L. Expecting my child to become “dragon”—Development of the Chinese parental expectation on child’s future scale. Int. J. Disabil. Hum. Dev. 2011, 10, 257–265. [Google Scholar] [CrossRef]
  42. Zhan, M. Assets, parental expectations and involvement, and children’s educational performance. Child. Youth Serv. Rev. 2006, 28, 961–975. [Google Scholar] [CrossRef]
  43. Li, M. Using the propensity score method to estimate causal effects: A review and practical guide. Organ. Res. Methods 2013, 16, 188–226. [Google Scholar] [CrossRef]
  44. Austin, P.C. An introduction to propensity score methods for reducing the effects of confounding in observational studies. Multivar. Behav. Res. 2011, 46, 399–424. [Google Scholar] [CrossRef]
  45. Morgan, S.L.; Winship, C. Counterfactuals and Causal Inference: Methods and Principles for Social Research, 1st ed.; Cambridge University Press: Cambridge, UK, 2007. [Google Scholar]
  46. Clougherty, J.; Duso, T. Correcting for Self-Selection Based Endogeneity in Management Research: A Review and Empirical Demonstration; Working Paper No. 1465; German Institute of Economic Research: Berlin, Germany, 2015. [Google Scholar]
  47. Rosenbaum, P.R.; Rubin, D.B. The central role of the propensity score in observational studies for causal effects. Biometrika 1983, 70, 41–55. [Google Scholar] [CrossRef]
  48. Cochran, W.G. The effectiveness of adjustment by subclassification in removing bias in observational studies. Biometrika 1968, 24, 295–313. [Google Scholar] [CrossRef]
  49. Caliendo, M.; Kopeinig, S. Some Practical Guidance for the Implementation of Propensity Score Matching; IZA DP No. 1588; Institute for the Study of Labor: Bonn, Germany, 2005; Available online: http://ftp.iza:dp1588.pdf (accessed on 25 November 2019).
  50. Linden, A. Graphical displays for assessing covariate balance in matching studies. J. Eval. Clin. Prac. 2015, 21, 242–247. [Google Scholar] [CrossRef] [PubMed]
  51. Austin, P.C. A tutorial and case study in propensity score analysis: An application to estimating the effect of in-hospital smoking cessation counseling on mortality. Multivar. Behav. Res. 2011, 46, 119–151. [Google Scholar] [CrossRef] [PubMed]
Table 1. Descriptive statistics of continuous variables.
VariablesBOYSGIRLS
MeanStd. Dev.MeanStd. Dev.
Father’s education8.864.108.924.40
Mother’s education6.683.996.843.90
Child’s wage99.5141.34111.7438.05
Av. minutes on domestic chores558.0716934.86
Table 2. Descriptive statistics of categorical variables.
BOYSGIRLS
VariablesNumberPercent (%)NumberPercent (%)
SSS/SHS Enrolment
No96070.1878570.66
Yes40829.8232629.34
Residence
Urban34425.1527324.57
Rural102474.8583875.43
Age Cohort
15–19110280.5693183.80
20–2422616.5215413.86
25–29 402.92262.34
Marital Status
Yes785.7047642.84
No129094.3063557.16
Do you have a Child
Yes332.4121119.0
No133597.5990081.0
Table 3. Estimation results of stratified matching.
Outcome Variables:
Enrolment in SSS/SHS
BOYS GIRLS
ATTStd. ErrorPATTStd. ErrorP
Treatment Variable:
Parental economic expectation0.0480.0230.0360.0290.0170.087

