Is Sustainable Economic Development Possible Thanks to the Deployment of ICT?

 ,
, 
Abstract
1. Introduction
2. Theoretical Framework
2.1. ICT and Sustainable Environment
2.2. ICT and the Environment
2.3. Growth Theories and ICT
3. Empirical Framework
4. Results
5. Discussion
6. Conclusions
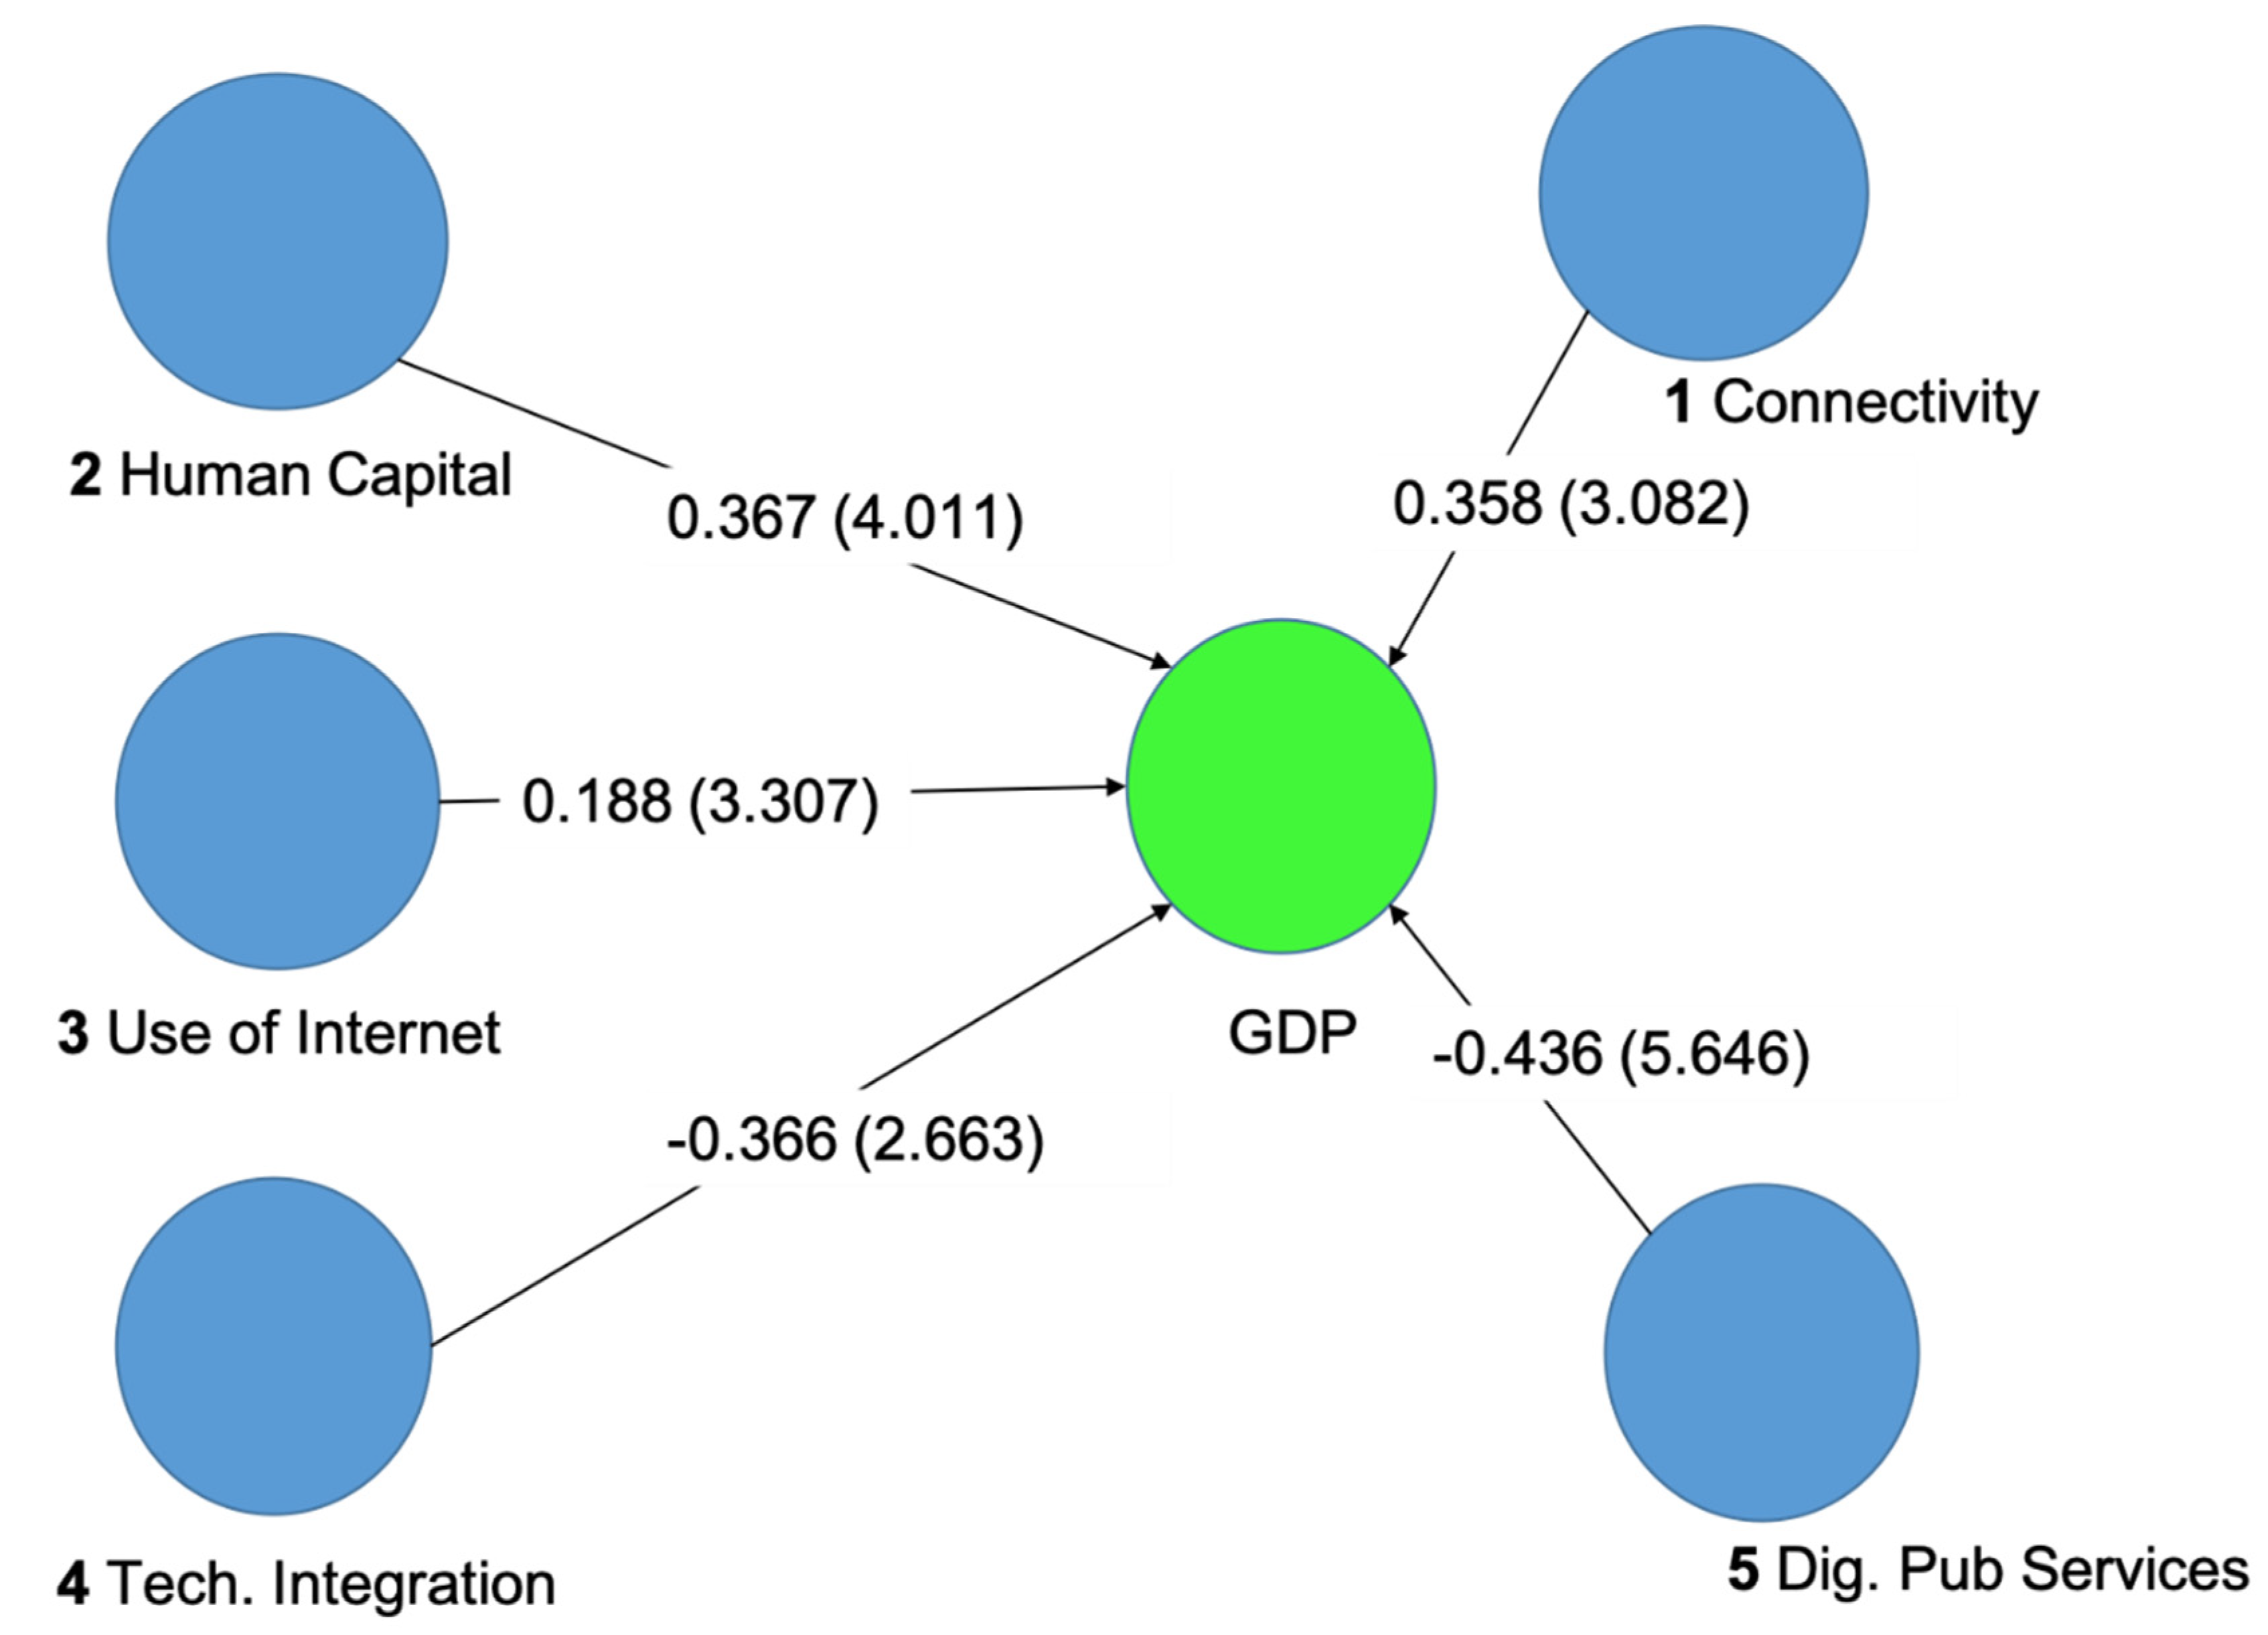
- It would be interesting to investigate in-depth the reasons why hypotheses 4 and 5 obtained a negative path when applying the PLS algorithm.
- Lastly, it would be interesting to carry out the study at the regional level, by comparing the results of less-developed regions with more-developed regions to see if they contribute to sustainable development.
Author Contributions
Funding
Conflicts of Interest
Appendix A

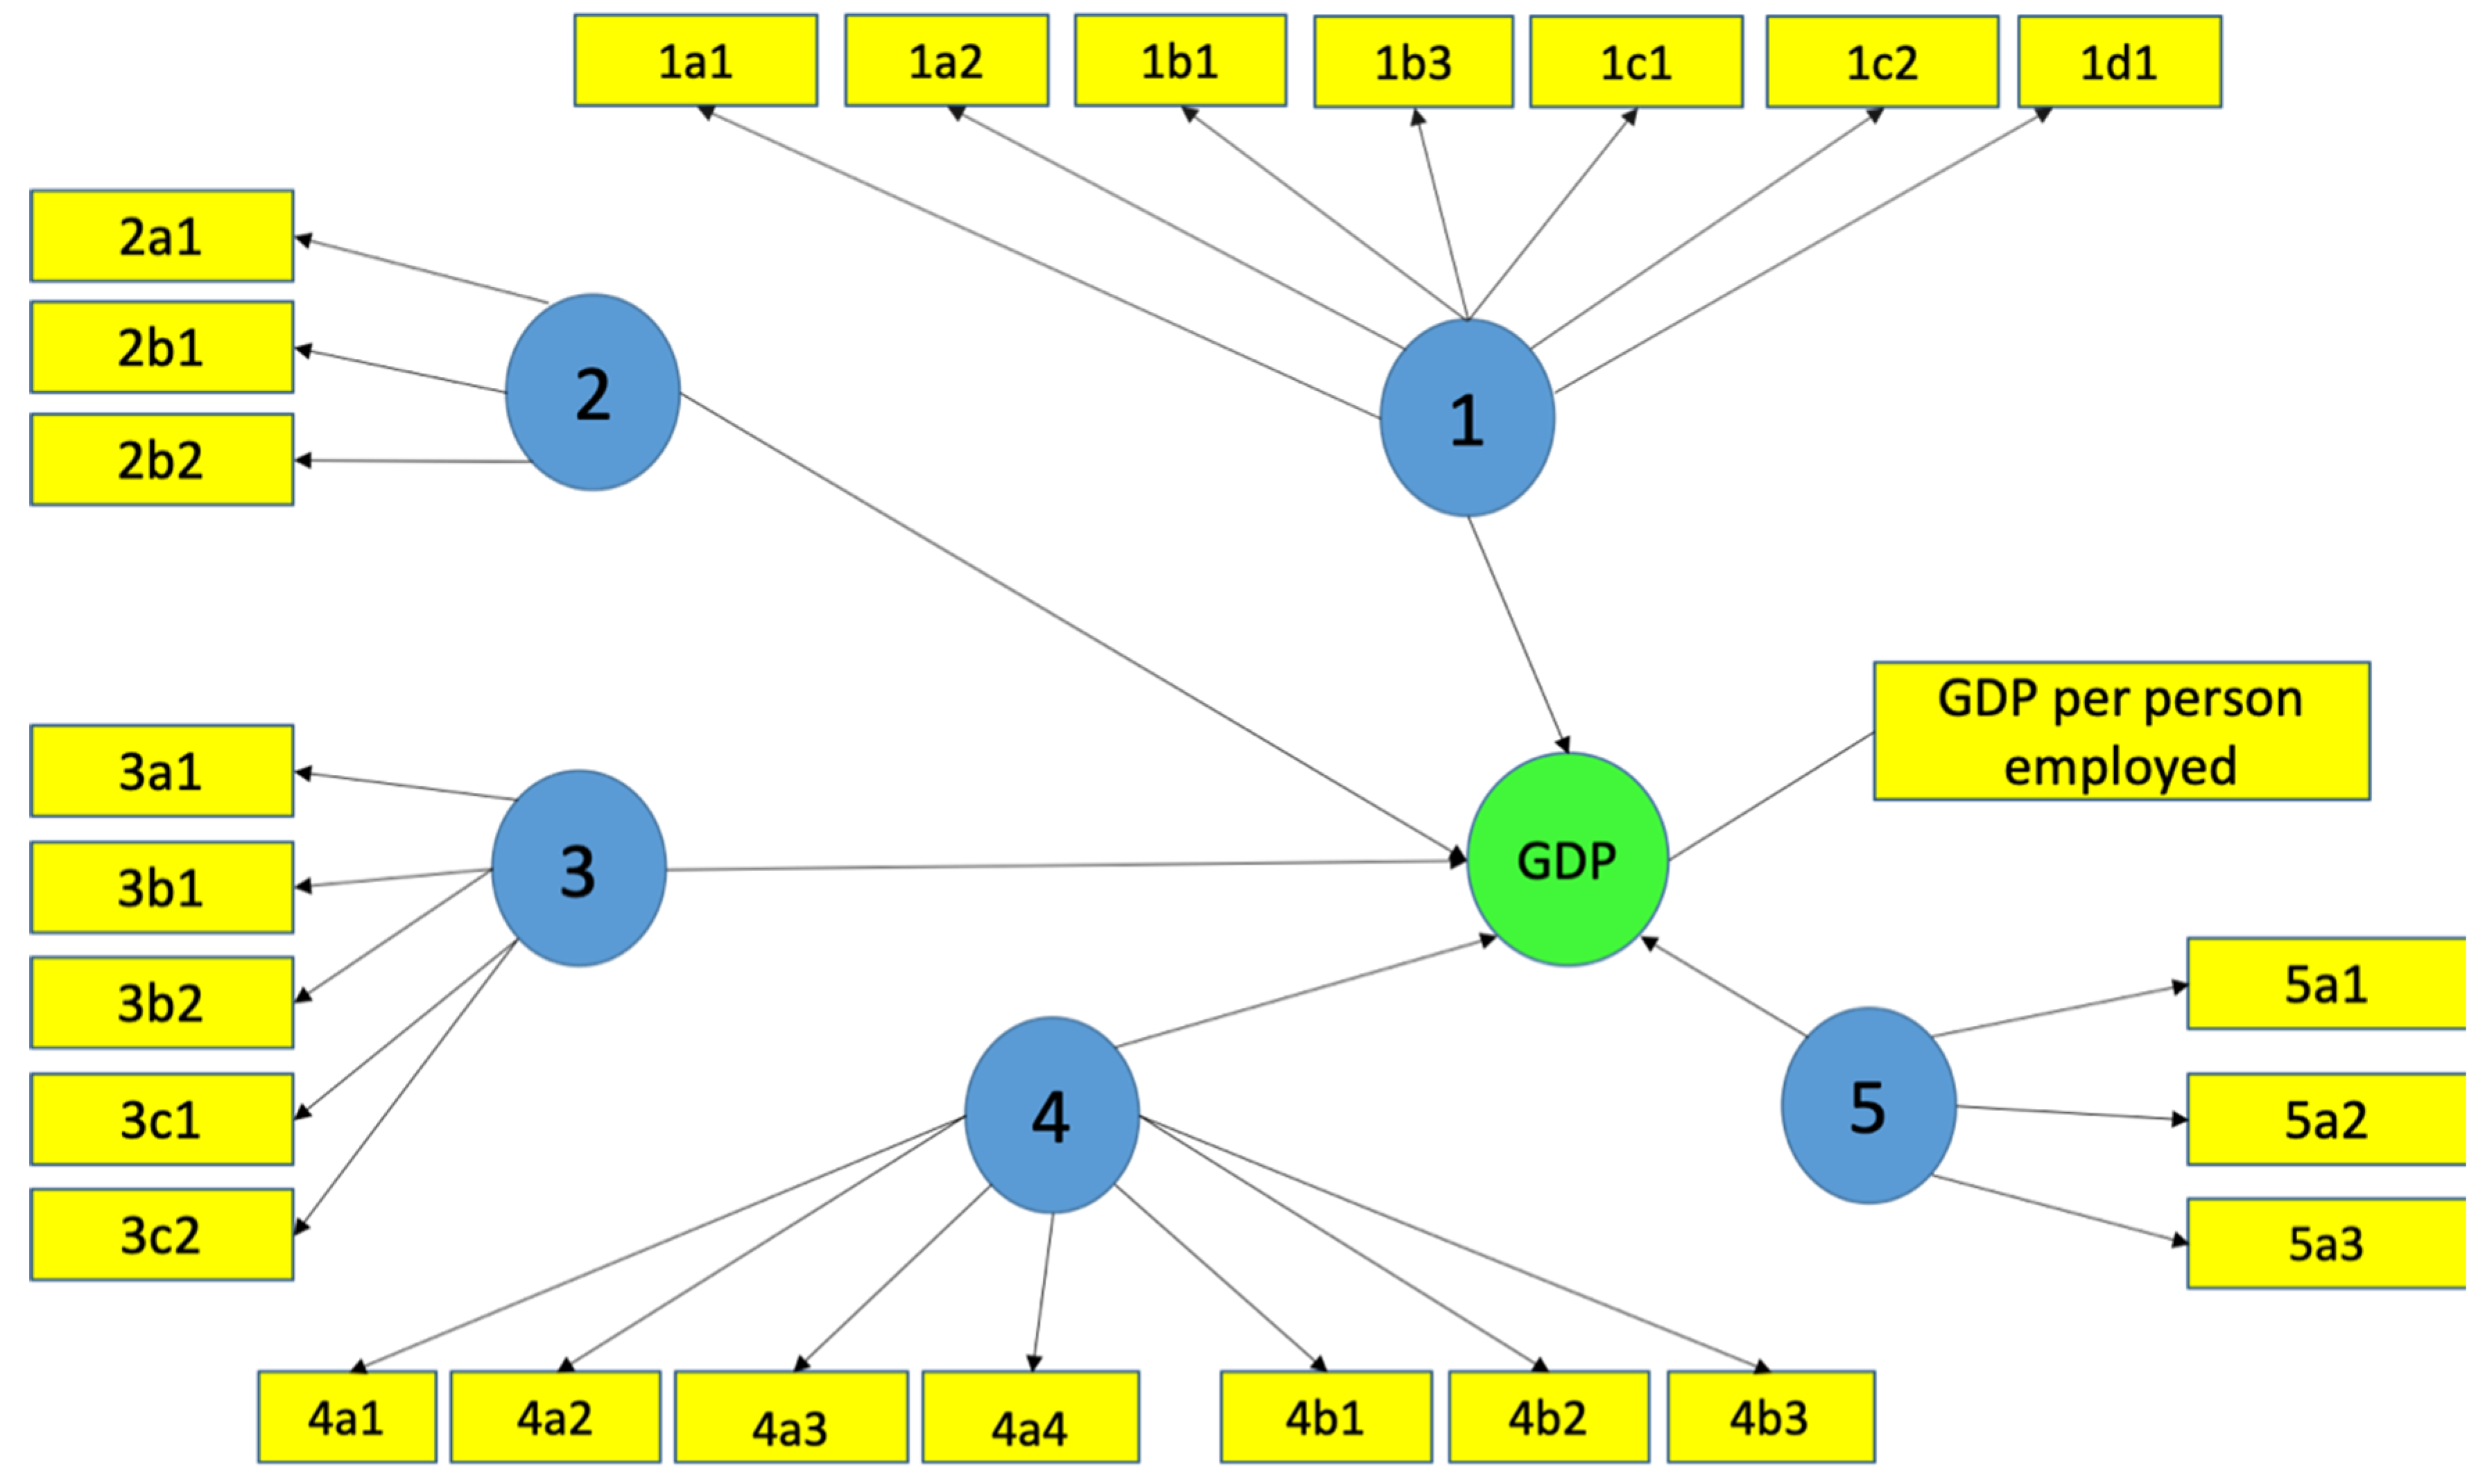
| CODE | DIMENSION/SUBCATEGORY/INDICATOR |
|---|---|
| 1 | CONNECTIVITY |
| 1a | Fixed broadband Allocated spectrum for wireless broadband in EU harmonized bands Speed |
| 1a1 | Full standard broadband coverage |
| 1a2 | Households with fixed broadband access |
| 1b | Mobile bandwidth |
| 1b1 | Penetration of active mobile broadband users |
| 1b3 | Spectrum allocated to wireless broadband in EU harmonized bands |
| 1c | Speed |
| 1c1 | Full broadband coverage of new generation access |
| 1c2 | Subscriptions of fixed broadband with speed >=30 Mbps |
| 1d | Affordability |
| 1d1 | Monthly Internet access rate with download speed above 12 and up to 30 Mbps (internet only) |
| 2 | HUMAN CAPITAL |
| 2a | Basic skills and use |
| 2a1 | Individuals who use Internet regularly |
| 2a2 | Individuals with basic or above basic digital skills |
| 2b | Advanced skills and development |
| 2b1 | Employed people with ICT specialist skills |
| 2b2 | Tertiary graduates in Science and Technology |
| 3 | USE OF INTERNET |
| 3a | Content |
| 3a1 | Individuals who use the Internet to read online newspapers/magazines |
| 3a2 | Individuals who use the Internet to play or download games, images, films, or music |
| 3a3 | Households subscribed to some form of video-on-demand |
| 3b | Communication |
| 3b1 | Individuals who use the Internet to make video calls |
| 3b2 | Individuals who use the Internet to participate in social networks |
| 3c | Transactions |
| 3c1 | Individuals who use the Internet for Internet banking |
| 3c2 | Individuals who use the Internet to order goods and services |
| 4 | TECHNOLOGICAL INTEGRATION |
| 4a | Digitalization of companies |
| 4a1 | Companies that have enterprise resource planning (ERP) software packages to share information between different functional areas |
| 4a2 | Companies that use radio frequency identification technology (RFID) as part of the production and service delivery process |
| 4a3 | Companies that use two or more of the following social media: social networks, blog or micro blog of the company, websites for sharing multimedia content, and knowledge-sharing tools based on wiki |
| 4a4 | Companies that send electronic invoices corresponding to the appropriate format for automatic processing |
| 4a5 | Companies that buy medium-high satisfaction cloud computing services |
| 4b | E-commerce |
| 4b1 | SMEs that sell at least 1% of total sales online |
| 4b2 | Total electronic sales by SMEs, as a percentage of their total turnover |
| 4b3 | Companies that have made electronic sales to other EU countries different to theirs |
| 5 | DIGITAL PUBLIC SERVICES |
| 5a | E-government |
| 5a1 | Individuals who use the Internet to deal with public authorities, broken down by the purpose of submitting completed forms |
| 5a2 | Amount of data that is previously filled in the online Public Services forms |
| 5a3 | Degree of completion of online services, assessment from 0 to 100 |
| 5a4 | Marking of information of the public sector |
References
- OECD. ICT for Development: Improving Policy Coherence; OECD: Paris, France, 2010. [Google Scholar]
- Hartwick, J.M. Intergenerational equity and the investing of rents from exhaustible resources. Am. Econ. Rev. 1977, 66, 972–974. [Google Scholar]
- Solow, R.M. Intergenerational equity and exhaustible resources. Rev. Econ. Stud. 1974, 41, 29–45. [Google Scholar] [CrossRef]
- Solow, R.M. On the intertemporal allocation of natural resources. Scand. J. Econ. 1986, 88, 141–149. [Google Scholar] [CrossRef]
- Solow, R.M. Sustainability: An. Economist’s Perspective; The eighteenth J. Seward Johnson Lecture; Woods Hole Oceanography Institution: Woods Hole, MA, USA, 1991. [Google Scholar]
- Solow, R.M. An almost practical step toward sustainability. Resour. Policy 1993, 19, 162–172. [Google Scholar] [CrossRef]
- Howarth, R.B.; Norgaard, R.B. Intergenerational transfers and the social discount rate. Environ. Nat. Resour. Econ. 1993, 3, 337–358. [Google Scholar] [CrossRef]
- Anand, S.; Sen, A.K. Sustainable Human Development: Concepts and Priorities. Hum. Dev. Rep. Off. Occas. Pap. 1996, 1, 1–82. [Google Scholar]
- Anand, S.; Sen, A.K. Human Development and Economic Sustainability. World Dev. 2000, 28, 2029–2049. [Google Scholar] [CrossRef]
- Hartwick, J.M. Pollution and National Accounting; Institute for Economics Research, Queens University: Kingston, ON, Canada, 1990. [Google Scholar]
- Hartwick, J.M. Natural resources, national accounting and economic depreciation. J. Public Econ. 1990, 43, 291–304. [Google Scholar] [CrossRef]
- Hanley, N.; Shogren, J.; White, B. Environmental Economics in the Theory and Practice; Oxford University Press: New York, NY, USA, 1997. [Google Scholar]
- United Nations. Indicators of Sustainable Development: Framework and Methodologies. Department of economics and social affairs, Commission on Sustainable Development, 2001. Available online: http://www.un.org/esa/sustdev/csd/csd9_indi_bp3.pdf (accessed on 25 July 2019).
- Arias, F. Desarrollo Sostenible y sus Indicadores. Revista Sociedad y Economía 2006, 11, 200–229. [Google Scholar]
- Vu, K.M. ICT as a source of economic growth in the information age: Empirical evidence from the 1996-2005 period. Telecommun. Policy 2011, 35, 357–372. [Google Scholar] [CrossRef]
- Ho, S.C.; Kauffman, R.J.; Liang, T.P. Internet-based selling technology and e-commerce growth: A hybrid growth theory approach with cross-model inference. Inf. Technol. Manag. 2011, 12, 409–429. [Google Scholar] [CrossRef]
- Warr, B.; Ayres, R.U. Useful work and information as drivers of economic growth. Ecol. Econ. 2012, 73, 93–102. [Google Scholar] [CrossRef]
- Chaves, R.; Bernal, E.; Mozas, A.; Puentes, R. Improving e-economy by regional governments. Manag. Decis. 2014, 52, 559–572. [Google Scholar] [CrossRef]
- Jorgenson, D.W.; Vu, K.M. The ICT revolution, world economic growth, and policy issues. Telecommun. Policy 2016, 40, 383–397. [Google Scholar] [CrossRef]
- Kumar, R.R.; Stauvermann, P.J.; Samitas, A. The effects of ICT on output per worker: A study of the Chinese economy. Telecommun. Policy 2016, 40, 102–115. [Google Scholar] [CrossRef]
- Venturini, F. The modern drivers of productivity. Res. Policy 2015, 44, 357–369. [Google Scholar] [CrossRef]
- Solow, R. A Contribution to the Theory of Economic Growth. Q. J. Econ. 1956, 70, 65–94. [Google Scholar] [CrossRef]
- Swan, T.W. Economic Growth and Capital Accumulation. Econ. Rec. 1956, 32, 334–361. [Google Scholar] [CrossRef]
- Bertschek, I.; Cerquera, D.; Klein, G.J. More bits–more bucks? Measuring the impact of roadband internet on firm performance. Inf. Econ. Policy 2013, 25, 190–203. [Google Scholar] [CrossRef]
- Colombo, M.G.; Croce, A.; Grilli, L. ICT services and small businesses’ productivity gains: An analysis of the adoption of broadband Internet technology. Inf. Econ. Policy 2013, 25, 171–189. [Google Scholar] [CrossRef]
- Haller, S.A.; Lyons, S. Broadband adoption and firm productivity: Evidence from Irish manufacturing firms. Telecommun. Policy 2015, 39, 1–13. [Google Scholar] [CrossRef]
- Mayer, W.; Madden, G.; Wu, C. Broadband andeconomic growth: A reassessment. Inf. Technol. Dev. 2019, 1–18. [Google Scholar] [CrossRef]
- Thompson, H.G.; Garbacz, C. Economic impacts of mobile versus fixed broadband. Telecommun. Policy 2011, 35, 999–1009. [Google Scholar] [CrossRef]
- World Commission on Environment and Development (WCED). Our Common Future; Oxford University Press: Oxford, UK, 1987. [Google Scholar]
- Constanza, R.; Patten, B.C. Defining and predicting sustainability. Ecol. Econ. 1995, 15, 193–196. [Google Scholar] [CrossRef]
- Bhujabal, P.; Sethi, N. Foreign direct investment, information and communication technology, trade, and economic growth in the South Asian Association for Regional Cooperation countries: An empirical insight. J. Public Aff. 2019, e2010. [Google Scholar] [CrossRef]
- Toader, E.; Firtescu, B.N.; Roman, A.; Anton, S.G. Impact of Information and Communication Technology Infrastructure on Economic Growth: An Empirical Assessment for the EU Countries. Sustainability 2018, 10, 3750. [Google Scholar] [CrossRef]
- Chen, Y.; Gong, X.; Chu, C.C.; Cao, Y. Access to the Internet and Access to Finance: Theory and Evidence. Sustainability 2018, 10, 2534. [Google Scholar] [CrossRef]
- Pradhan, R.P.; Mallik, G.; Bagchi, T.P. Information communication technology (ICT) infrastructure and economic growth: A causality evinced by cross-country panel data. IIMB Manag. Rev. 2018, 30, 91–103. [Google Scholar] [CrossRef]
- Sepehrdoust, H. Impact of information and communication technology and financial development on economic growth of OPEC developing economies. Kasetsart J. Soc. Sci. 2018. [Google Scholar] [CrossRef]
- Meijers, H. Does the Internet generate economic growth, international trade, or both? Int. Econ. Econ. Policy 2014, 11, 137–163. [Google Scholar] [CrossRef]
- Kim, S. ICT and the UN’s Sustainable Development Goal for Education: Using ICT to Boost the Math Performance of Immigrant Youths in the US. Sustainability 2018, 10, 4584. [Google Scholar] [CrossRef]
- Batool, R.; Sharif, A.; Islam, T.; Zaman, K.; Shoukry, A.M.; Sharkawy, M.A.; Gani, S.; Aamir, A.; Hishan, S.S. Green is clean: The role of ICT in resource management. Environ. Sci. Pollut. Res. 2019, 26, 25341–25358. [Google Scholar] [CrossRef] [PubMed]
- Andreopoulou, Z.S. Green Informatics: ICT for Green and Sustainability. Agric. Inform. 2012, 3, 1–8. [Google Scholar] [CrossRef]
- Hong, J.; Thakuriah, P.V. Examining the relationship between different urbanization settings, smartphone use to access the Internet and trip frequencies. J. Transp. Geogr. 2018, 69, 11–18. [Google Scholar] [CrossRef]
- Kostoska, O.; Kocarev, L. A Novel ICT Framework for Sustainable Development Goals. Sustainability 2019, 11, 1961. [Google Scholar] [CrossRef]
- Bieser, J.C.T.; Hilty, L.M. Assessing Indirect Environmental Effects of Information and Communication Technology (ICT): A Systematic Literature Review. Sustainability 2018, 10, 2662. [Google Scholar] [CrossRef]
- Pohl, J.; Hilty, L.M.; Finkbeiner, M. How LCA contributes to the environmental assessment of higher order effects of ICT application: A review of different approaches. J. Clean. Prod. 2019, 219, 698–712. [Google Scholar] [CrossRef]
- Schien, D.; Shabajee, P.; Yearworth, M.; Preist, C. Modeling and assessing variability in energy consumption during the use stage of online multimedia services: Energy consumption during use of online multimedia services. J. Ind. Ecol. 2013, 17, 800–813. [Google Scholar] [CrossRef]
- Røpke, I.; Christensen, T.H. Transitions in the wrong direction? Digital technologies and daily life. In Sustainable Practices Social Theory and Climate Change; Shove, E., Spurling, N., Eds.; Routledge: Abingdon, Oxon, UK, 2013; pp. 49–68. [Google Scholar]
- Hilty, L.M.; Aebischer, B. ICT for Sustainability: An Emerging Research Field. In ICT Innovations for Sustainability; Springer International Publishing: Cham, Switzerland, 2015; pp. 3–36. [Google Scholar]
- Truby, J. Decarbonizing Bitcoin: Law and policy choices for reducing the energy consumption of Blockchain technologies and digital currencies. Energy Res. Soc. Sci. 2018, 44, 399–410. [Google Scholar] [CrossRef]
- Ruth, S. Reducing ICT-related carbon emissions: An exemplar for global energy policy? IETE Tech. Rev. 2011, 28, 207–211. [Google Scholar] [CrossRef]
- Moyer, J.D.; Hughes, B.B. ICTs: Do they contribute to increased carbon emissions? Technol. Forecast. Soc. Chang. 2012, 79, 919–931. [Google Scholar] [CrossRef]
- Jacob, P. Information and communication technology in shaping urban low carbon development pathways. Curr. Opin. Environ. Sustain. 2018, 30, 133–137. [Google Scholar] [CrossRef]
- Shabanpour, R.; Golshani, N.; Tayarani, M.; Auld, J.; Mohammadian, A. Analysis of telecommuting behavior and impacts on travel demand and the environment. Transp. Res. Part. D Transp. Environ. 2018, 62, 563–576. [Google Scholar] [CrossRef]
- Giovanis, E. The relationship between teleworking, traffic and air pollution. Atmos. Pollut. Res. 2018, 9, 1–14. [Google Scholar] [CrossRef]
- Asongua, S.A.; Rouxa, S.L.; Biekpeb, N. Environmental degradation, ICT and inclusive development in Sub-Saharan Africa. Energy Policy 2017, 111, 353–361. [Google Scholar] [CrossRef]
- Elliot, S. Environmentally sustainable ICT: A critical topic for IS research? PACIS 2007 Proc. 2007, 1, 114–128. [Google Scholar]
- Van Heddeghem, W.; Lambert, S.; Lannoo, B.; Colle, D.; Pickavet, M.; Demeester, P. Trends in worldwide ICT electricity consumption from 2007 to 2012. Comput. Commun. 2014, 50, 64–76. [Google Scholar] [CrossRef]
- Houghton, J.W. ICT and the Environment in developing countries: An overview of opportunities and developments. Commun. Strateg. 2009, 76, 39–60. [Google Scholar]
- Kramers, A.; Höjer, M.; Lövehagen, N.; Wangel, J. Smart sustainable cities-exploring ICT solutions for reduced energy use in cities. Environ. Model. Softw. 2014, 56, 52–62. [Google Scholar] [CrossRef]
- Lee, J.W.; Brahmasrene, T. ICT, CO2 emissions and economic growth: Evidence from a panel of ASEAN. Glob. Econ. Rev. 2014, 43, 93–109. [Google Scholar] [CrossRef]
- Alexandru, A.; Ianculescu, M.; Tudora, E.; Bica, O. ICT challenges and issues in climate change education. Stud. Inform. Control 2013, 22, 349–358. [Google Scholar] [CrossRef]
- Jorgenson, D.W.; Ho, M.S.; Stiroh, K.J. A Retrospective Look at the U.S. Productivity Growth Resurgence. J. Econ. Perspect. 2008, 22, 3–24. [Google Scholar] [CrossRef]
- Albiman, M.M.; Sulong, Z. The linear and non-linear impacts of ICT on economic growth, of disaggregate income groups within SSA region. Telecommun. Policy 2017, 41, 555–572. [Google Scholar] [CrossRef]
- Cea, R. CSR communication in Spanish quoted firms. Eur. Res. Manag. Bus. Econ. 2019, 25, 93–98. [Google Scholar]
- Bernal-Conesa, J.A.; Briones-Peñalver, A.J.; De Nieves-Nieto, C. The integration of CSR management systems and their influence on the performance of technology companies. Eur. J. Manag. Bus. Econ. 2016, 25, 121–132. [Google Scholar] [CrossRef]
- Skorupinska, A.; Torrent-Sellens, J. ICT, Innovation and Productivity: Evidence Based on Eastern European Manufacturing Companies. J. Knowl. Econ. 2017, 8, 768–788. [Google Scholar] [CrossRef]
- Trașcă, D.L.; Ștefan, G.M.; Sahlian, D.N.; Hoinaru, R.; Șerban-Oprescu, G.L. Digitalization and Business Activity. The Struggle to Catch Up in CEE Countries. Sustainability 2019, 11, 2204. [Google Scholar] [CrossRef]
- Romer, P.M. Increasing returns and long-run growth. J. Political Econ. 1986, 94, 1002–1037. [Google Scholar] [CrossRef]
- Romer, P.M. Endogenous Technological Change. J. Political Econ. 1990, 98, S71–S102. [Google Scholar] [CrossRef]
- Lucas, R.E. On the Mechanics of Economic Development. J. Monet. Econ. 1988, 22, 3–42. [Google Scholar] [CrossRef]
- Lucas, R.E. Making a miracle. Econometrica 1993, 61, 251–272. [Google Scholar] [CrossRef]
- Rigdon, E.E.; Sarstedt, M.; Ringle, C.M. On comparing results from CB-SEM and PLS-SEM: Five perspectives and five recommendations. Mark. Zfp 2017, 39, 4–16. [Google Scholar] [CrossRef]
- Hair, J.F.; Hult, G.T.M.; Ringle, C.M.; Sarstedt, M.; Thiele, K.O. Mirror, mirror on the wall: A comparative evaluation of composite-based structural equation modeling methods. J. Acad. Mark. Sci. 2017, 45, 616–632. [Google Scholar] [CrossRef]
- Gefen, D.; Straub, D.W.; Rigdon, E.E. An update and extension to SEM guidelines for admnistrative and social science research. Manag. Inf. Syst. Q. 2011, 35, 3–24. [Google Scholar] [CrossRef]
- Rigdon, E.E. Partial least squares path modeling. In Structural Equation Modeling: A Second Course, 2nd ed.; Hancock, G.R., Mueller, R.O., Eds.; Information Age: Charlotte, NC, USA, 2013; pp. 81–116. [Google Scholar]
- Richter, N.F.; Cepeda-Carrión, G.; Roldán Salgueiro, J.L.; Ringle, C.M. European management research using partial least squares structural equation modeling (PLS-SEM). Eur. Manag. J. 2016, 34, 589–597. [Google Scholar] [CrossRef]
- Hair, J.F., Jr.; Hult, G.T.; Ringle, C.M.; Sarstedt, M.; Apraiz, J.C.; Carrión, G.C.; Roldán, J.L. Manual de Partial Least Squares Structural Equation Modeling (PLS-SEM), Segunda Edición; OmniaScience: Terrassa, Spain, 2019. [Google Scholar] [CrossRef]
- Nitzl, C.; Chin, W.W. The case of partial least squares (PLS) path modeling in managerial accounting research. J. Manag. Control 2017, 28, 137–156. [Google Scholar] [CrossRef]
- Henseler, J.; Ringle, C.M.; Sarstedt, M. A new criterion for assessing discriminant validity in variance-based structural equation modeling. J. Acad. Mark. Sci. 2015, 43, 115–135. [Google Scholar] [CrossRef]
- Licerán-Gutiérrez, A.; Cano-Rodríguez, M. Using partial least squares in archival accounting research: An application to earnings quality measuring. Span. J. Financ. Account./Revista Española de Financiación y Contabilidad 2019, 1–28. [Google Scholar] [CrossRef]
- Sarstedt, M.; Ringle, C.M.; Hair, J.F. Partial Least Squares Structural Equation Modeling. In Handbook of Market Research; Springer International Publishing: Cham, Vietnam, 2017; Volume 26, pp. 1–40. [Google Scholar] [CrossRef]
- Shmueli, G.; Ray, S.; Estrada, J.M.V.; Chatla, S.B. The elephant in the room: Predictive performance of PLS models. J. Bus. Res. 2016, 69, 4552–4564. [Google Scholar] [CrossRef]
- Barroso, C.; Cepeda, G.; Roldán, J.L. Applying Maximum Likelihood and PLS on Different Sample Sizes: Studies on SERVQUAL Model and Employee Behavior Model. In Handbook of Partial Least Squares; Vinzi, V.E., Chin, W., Henseler, J., Wang, H., Eds.; Springer Handbooks of Computational Statistics.; Springer: Berlin/Heidelberg, Germany, 2010; pp. 427–447. [Google Scholar]
- Céspedes, J.; Sánchez, M. Tendencias y desarrollo recientes en métodos de investigación y análisis de datos en dirección de empresas. Revista Europea de Dirección y Economía de la Empresa 1996, 5, 23–40. [Google Scholar]
- Chin, W.W. The partial least squares approach to structural equation modeling. In Modern Methods for Business Research; Marcoulides, G.A., Ed.; Erlbaum: Mahwah, NJ, USA, 1998. [Google Scholar]
- Hair, J.F.; Ringle, C.M.; Sarstedt, M. PLS-SEM: Indeed a silver bullet. J. Mark. Theory Pract. 2011, 19, 139–152. [Google Scholar] [CrossRef]
- Hair, J.F., Jr.; Sarstedt, M.; Hopkins, L.; Kuppelwieser, V.G. Partial least squares structural equation modeling (PLS-SEM) An emerging tool in business research. Eur. Bus. Rev. 2014, 26, 106–121. [Google Scholar] [CrossRef]
- Nunnally, J.C. Psychological Theory; MacGraw-Hill: New York, NY, USA, 1994. [Google Scholar]
- Dijkstra, T.K.; Henseler, J. Consistent partial least squares path modeling. MIS Q. 2015, 39, 2. [Google Scholar] [CrossRef]
- Bagozzi, R.P.; Yi, Y. On the evaluation of structural equation models. J. Acad. Mark. Sci. 1988, 16, 74–94. [Google Scholar] [CrossRef]
- Fornell, C.; Larcker, D. Structural equation models with unobservable variables and measurement error: Algebra and Stadistics. J. Mark. Res. 1981, 18, 39–50. [Google Scholar] [CrossRef]
- Henseler, J.; Ringle, C.M.; Sinkovics, R.R. The use of partial least squares path modeling in international marketing. In New Challenges to International Marketing; Emerald Group Publishing Limited: Bingley, UK, 2009; pp. 277–319. [Google Scholar]
- Fernández, A. Factores determinantes para la elaboración de un modelo de éxito de la empresa en el medio digital. Diss. tesis doctoral, Departamento de Economía Financiera y Contabilidad, Universidad de Extremadura, Badajoz, Spain, 2016. [Google Scholar]
- Fernández-Portillo, A.; Hernández-Mogollón, R.; Sánchez-Escobedo, M.C.; Coca-Pérez, J.L. Does the Performance of the Company Improve with the Digitalization and the Innovation? In Annual Meeting of the European Academy of Management and Business Economics; Springer: Cham, Swizerland, 2018; pp. 276–291. [Google Scholar]
- Robina-Ramírez, R.; Fernández-Portillo, A.; Díaz-Casero, J.C. Green Start-Ups’ Attitudes towards Nature When Complying with the Corporate Law. Complexity 2019, 4164853. [Google Scholar]
- Hair, J.F.; Risher, J.J.; Sarstedt, M.; Ringle, C.M. When to use and how to report the results of PLS-SEM. Eur. Bus. Rev. 2019, 31, 2–24. [Google Scholar] [CrossRef]
- European Comision. The Digital Economy and Society Index. Available online: https://ec.europa.eu/digital-single-market/en/desi (accessed on 5 May 2019).


| Impact of ICT on Sustainability | Author |
|---|---|
| Promotion of sustainable development of entrepreneurship and small and micro enterprises: it improves financing by reducing information asymmetry and reducing the cost of the agency. | [33] |
| Cohesion in regional differences. | [34] |
| Quick and easy access to information not only for economic agents, but also for the whole society. | [35] |
| Access of human capital through teleworking | [36] |
| Fast and effective business communication: reducing costs and increasing productivity. | [37] |
| Reflective Construct | Cronbach’s Alpha | Rho_A | Composite Reliability | Average Variance Extracted | Discriminant Validity |
|---|---|---|---|---|---|
| 1_Connectivity | 0.644 | 0.693 | 0.781 | 0.549 | YES |
| 2_Human Capital | 0.915 | 1.043 | 0.957 | 0.918 | YES |
| 3_Use of Internet | 1 | 1 | 1 | 1 | YES |
| 4_Tech. Integration | 0.666 | 0.738 | 0.806 | 0.585 | YES |
| 5_Dig. Pub Services | 0.827 | 1.080 | 0.867 | 0.692 | YES |
| GDP | 1 | YES |
| Analysis | Parameter | Values Higher Than | Justification |
|---|---|---|---|
| Individual reliability | Loadings | 0.4 | [84,85] |
| Construct reliability | Cronbach´s Alpha | 0.7 | [86] |
| rho_A | 0.7 | [87] | |
| Composite Reliability | 0.6 | [86,88] | |
| Convergent validity | Average variance extracted (AVE) | 0.5 | [89,90] |
| Discriminant validity | It compares the AVE with the correlations between constructs | AVE > Correlations | [84,90] |
| Heterotrait-monotrait ratio (HTMT) | 0.85 | [77] |
| Hypothesis | Evaluation | Confidence Level | t-Statistic | Path Coefficient |
|---|---|---|---|---|
| 1_Connectivity → GDP | Accepted | Yes | 3.110 (***) | Yes (0.358) |
| 2_Human Capital → GDP | Accepted | Yes | 4.037 (***) | Yes (0.367) |
| 3_Use of Internet → GDP | Accepted | Yes | 3.272 (***) | Yes (0.188) |
| 4_Tech. Integration → GDP | Rejected | Yes | 2.691 (***) | No (–0.366) |
| 5_Dig. Pub Services → GDP | Rejected | Yes | 5.632 (***) | No (–0.436) |
| Hypothesis | R2 | Q2 | Path | Correlation | Variance Explained |
|---|---|---|---|---|---|
| H1_Connectivity→GDP | 0.358 | 0.305 | 10.92% | ||
| H2_Human Capital→GDP | 0.367 | 0.224 | 8.22% | ||
| H3_Use of Internet→GDP | 0.188 | 0.205 | 3.85% | ||
| H4_Tech. Integration→GDP | –0.366 | –0.146 | 5.34% | ||
| H5_Dig. Pub. Services→GDP | –0.436 | –0.327 | 14.26% | ||
| ICT | 0.426 | 0.359 |
© 2019 by the authors. Licensee MDPI, Basel, Switzerland. This article is an open access article distributed under the terms and conditions of the Creative Commons Attribution (CC BY) license (http://creativecommons.org/licenses/by/4.0/).
Share and Cite
Fernández-Portillo, A.; Almodóvar-González, M.; Coca-Pérez, J.L.; Jiménez-Naranjo, H.V. Is Sustainable Economic Development Possible Thanks to the Deployment of ICT? Sustainability 2019, 11, 6307. https://doi.org/10.3390/su11226307
Fernández-Portillo A, Almodóvar-González M, Coca-Pérez JL, Jiménez-Naranjo HV. Is Sustainable Economic Development Possible Thanks to the Deployment of ICT? Sustainability. 2019; 11(22):6307. https://doi.org/10.3390/su11226307
Chicago/Turabian StyleFernández-Portillo, Antonio, Manuel Almodóvar-González, José Luís Coca-Pérez, and Héctor Valentín Jiménez-Naranjo. 2019. "Is Sustainable Economic Development Possible Thanks to the Deployment of ICT?" Sustainability 11, no. 22: 6307. https://doi.org/10.3390/su11226307
APA StyleFernández-Portillo, A., Almodóvar-González, M., Coca-Pérez, J. L., & Jiménez-Naranjo, H. V. (2019). Is Sustainable Economic Development Possible Thanks to the Deployment of ICT? Sustainability, 11(22), 6307. https://doi.org/10.3390/su11226307