1. Introduction
As the scale of modern IT services grows with increasing diversity of component architectures and behavioral patterns, the mission of seamless operation and efficient management becomes more challenging. A primary technique of achieving such goals is through log analytics [
1,
2,
3,
4,
5,
6]. The logs, generated from the system software, middleware, as well as applications, are the continuous stream of textual information that encode internal states of running applications. They are typically found in
/var/log directory as text files in Linux, although locations are configurable. The capability to analyze logs is indispensable for enterprise-grade IT service management today. The log messages can be used as direct hints to the status or problems of services, or they can be viewed as a generic time-series data to which to apply time-series analysis to learn interesting temporal patterns. Although the ability to analyze the logs is critical to modern IT services, it is becoming significantly more challenging to perform log analysis at scale such that it provides actionable insight. The foremost reason is the sheer volume of log data. Software architecture paradigms such as containerization [
7], micro-services [
8,
9], and serverless computing [
10] push towards larger number of smaller components each generating their own log streams. Even with powerful search functions, text pattern matching, and aggregation tools, system operators are quickly overwhelmed with the volume and complexity. In addition, with the variety and diversity of cloud software, logs generated from the software and systems tend to have very different formats, levels of detail, and content.
Various approaches have been proposed in this field for diagnosing service failures using logs. A big proportion of research focuses on detecting anomalies or outliers from the logs [
11,
12,
13,
14,
15,
16,
17] after a failure occurs. Log analysis has been a good target for applying data mining and AI techniques [
18]. Although a large number of techniques are available, they detect anomalies via post-mortem analysis or provide only statistical analysis of the monitored data, rather than revealing the actual importance and relevance in a cloud operational context. Therefore, it still remains a challenge for operators to be able to quickly narrow down to the small set of relevant logs for closer inspection.
Furthermore, cloud environments involve changes to applications, system software, patches, cluster provisioning, tenancy, and configuration. In a practical setting, even detected anomalies and outliers, while statistically relevant as rare occurrences, may be normal in a complex cloud setting based on the operational context (for example, uncommon but normal load changes, software updates and patches, routine configuration modifications, system utilization changes). With increased use of monitoring tools and analysis technologies to tame complexity, false alarms, and particularly excess alarm fatigue for system administrators is increasing. This leads to system administrators being overwhelmed by the number of anomalies reported and begin to ignore many of them. Further, the diversity of log types adds another layer of challenge for developers. Therefore, it is key that such analytics or AI identified statistical outliers be filtered or at least sorted in order of importance in the cloud operational domain context. An ideal log based alerting system would not only look at correlations between logs to predict outliers, but also temporal correlations between active system operations (such as planned configuration changes, planned or unplanned maintenance schedules, load patterns, daily health check runs, white lists, etc.). Incorporating and correlating this operational domain knowledge with AI and analysis is the ideal goal.
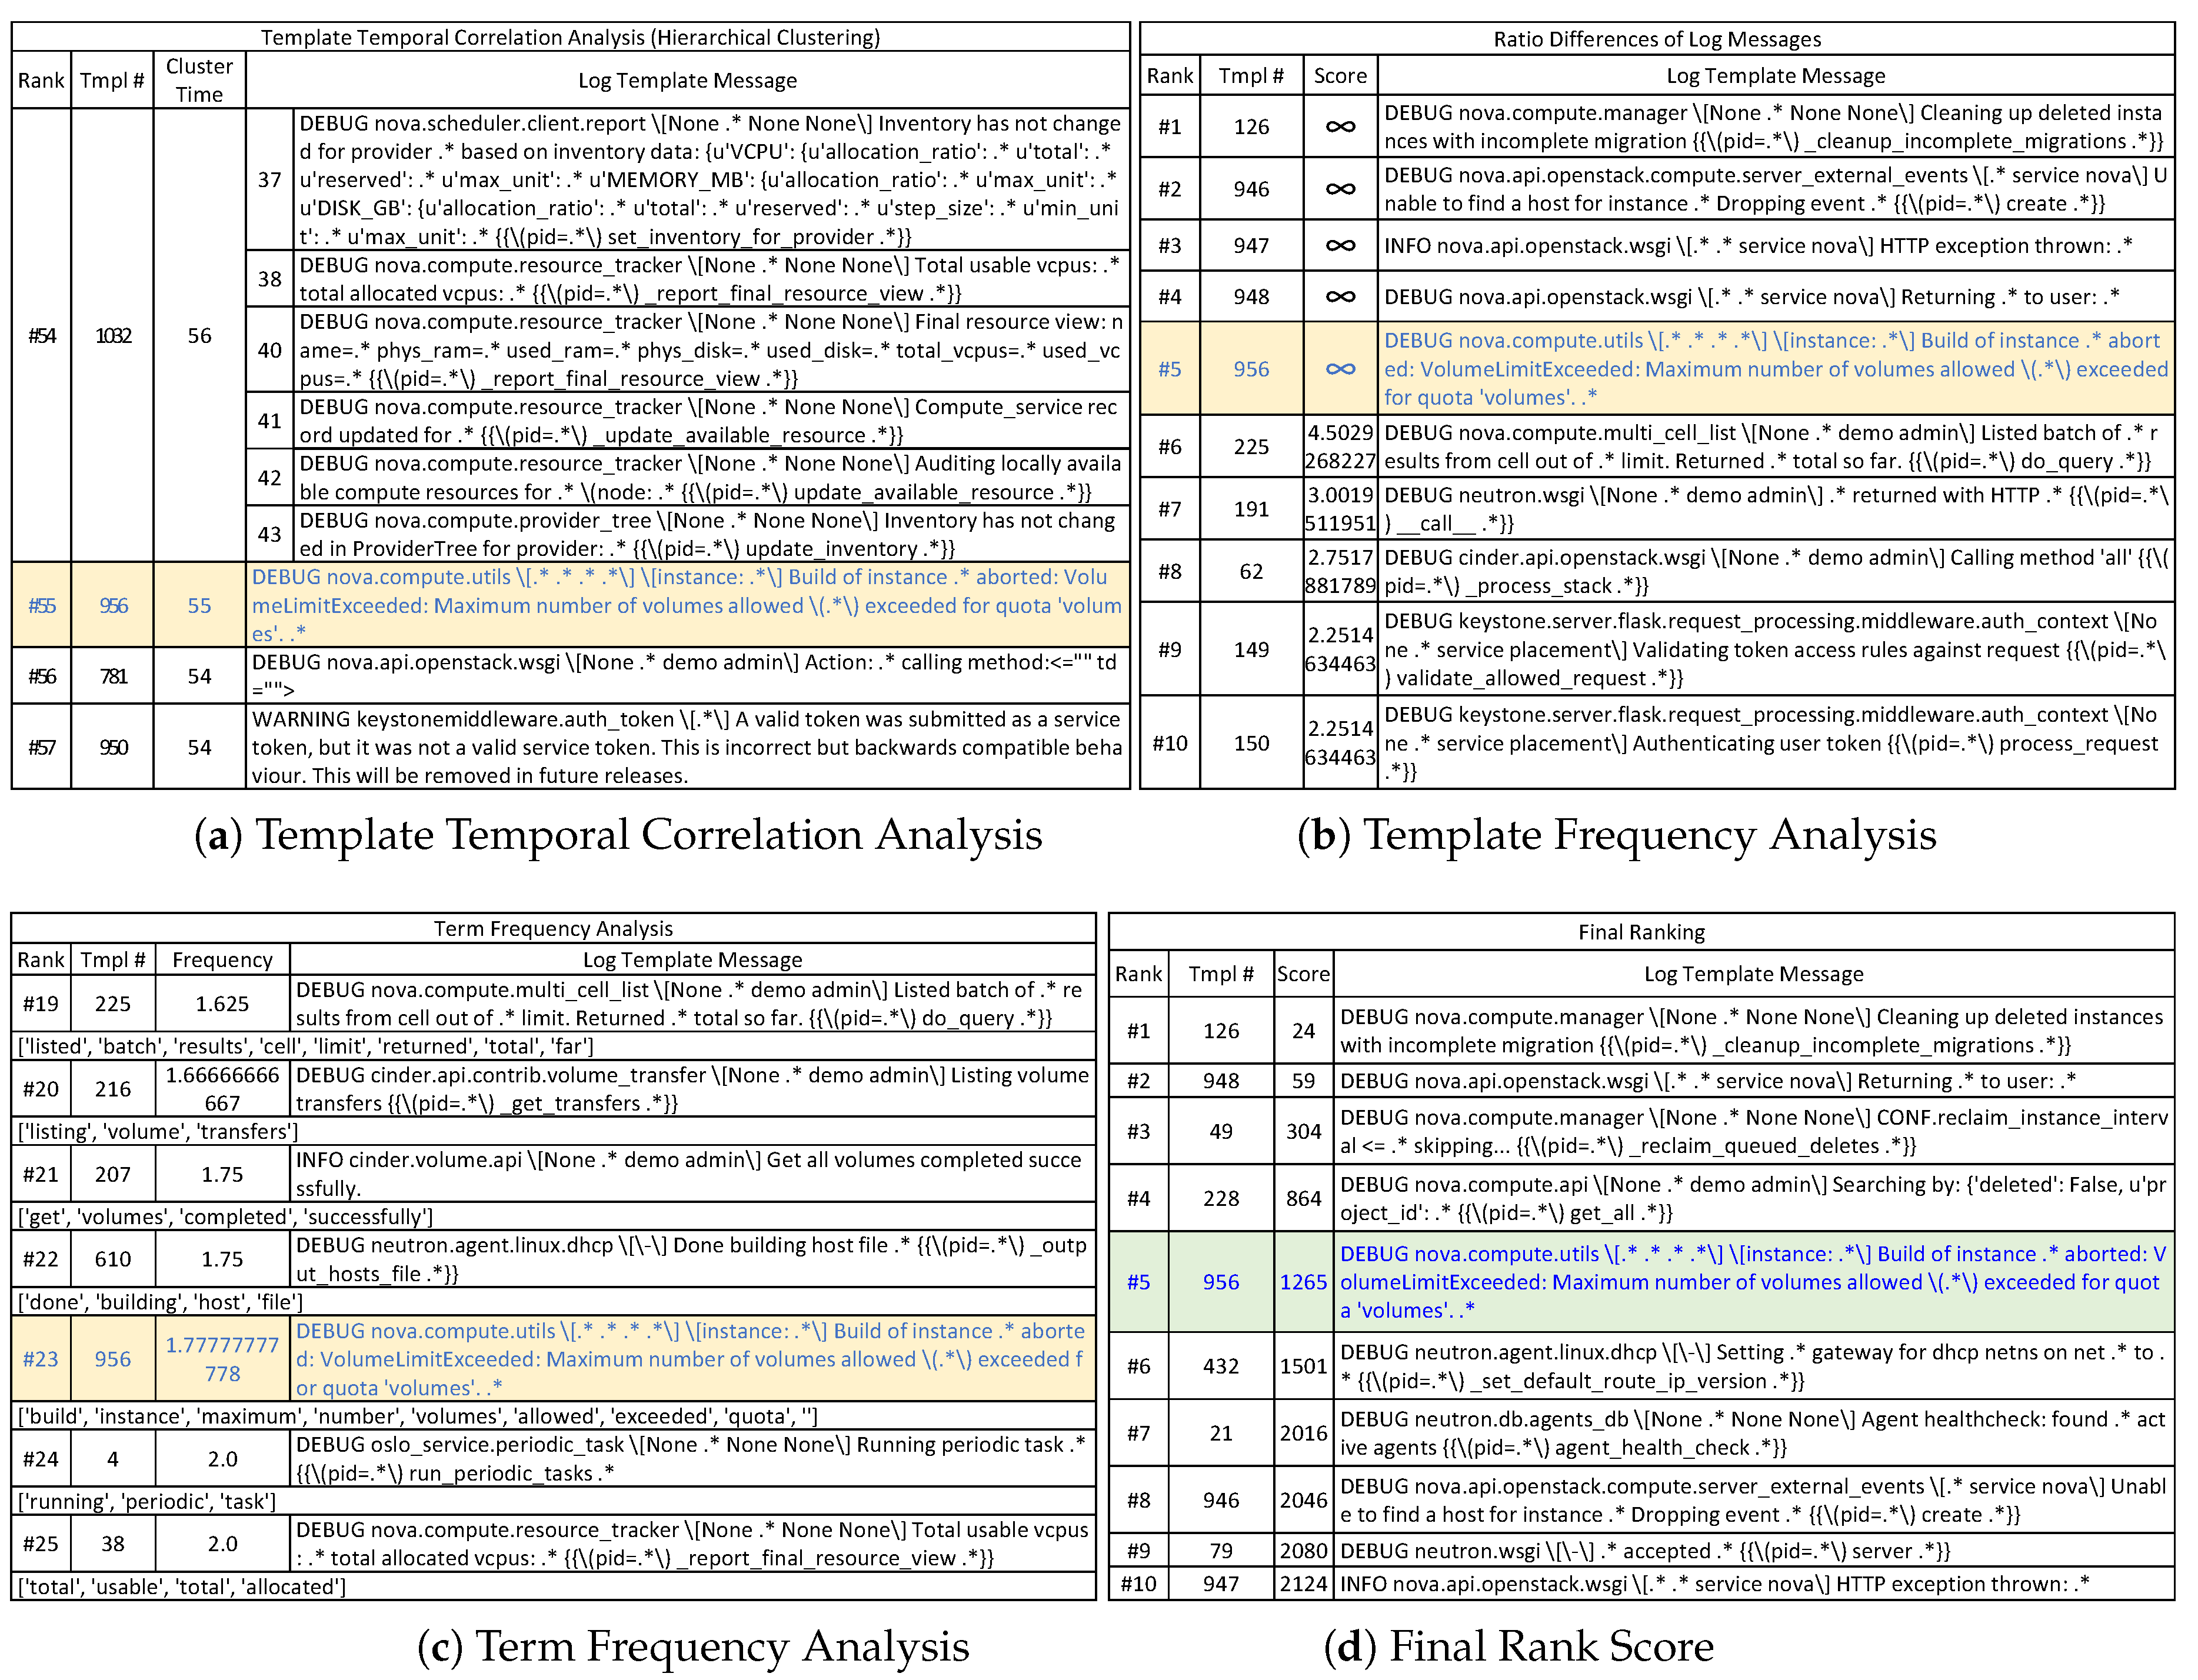
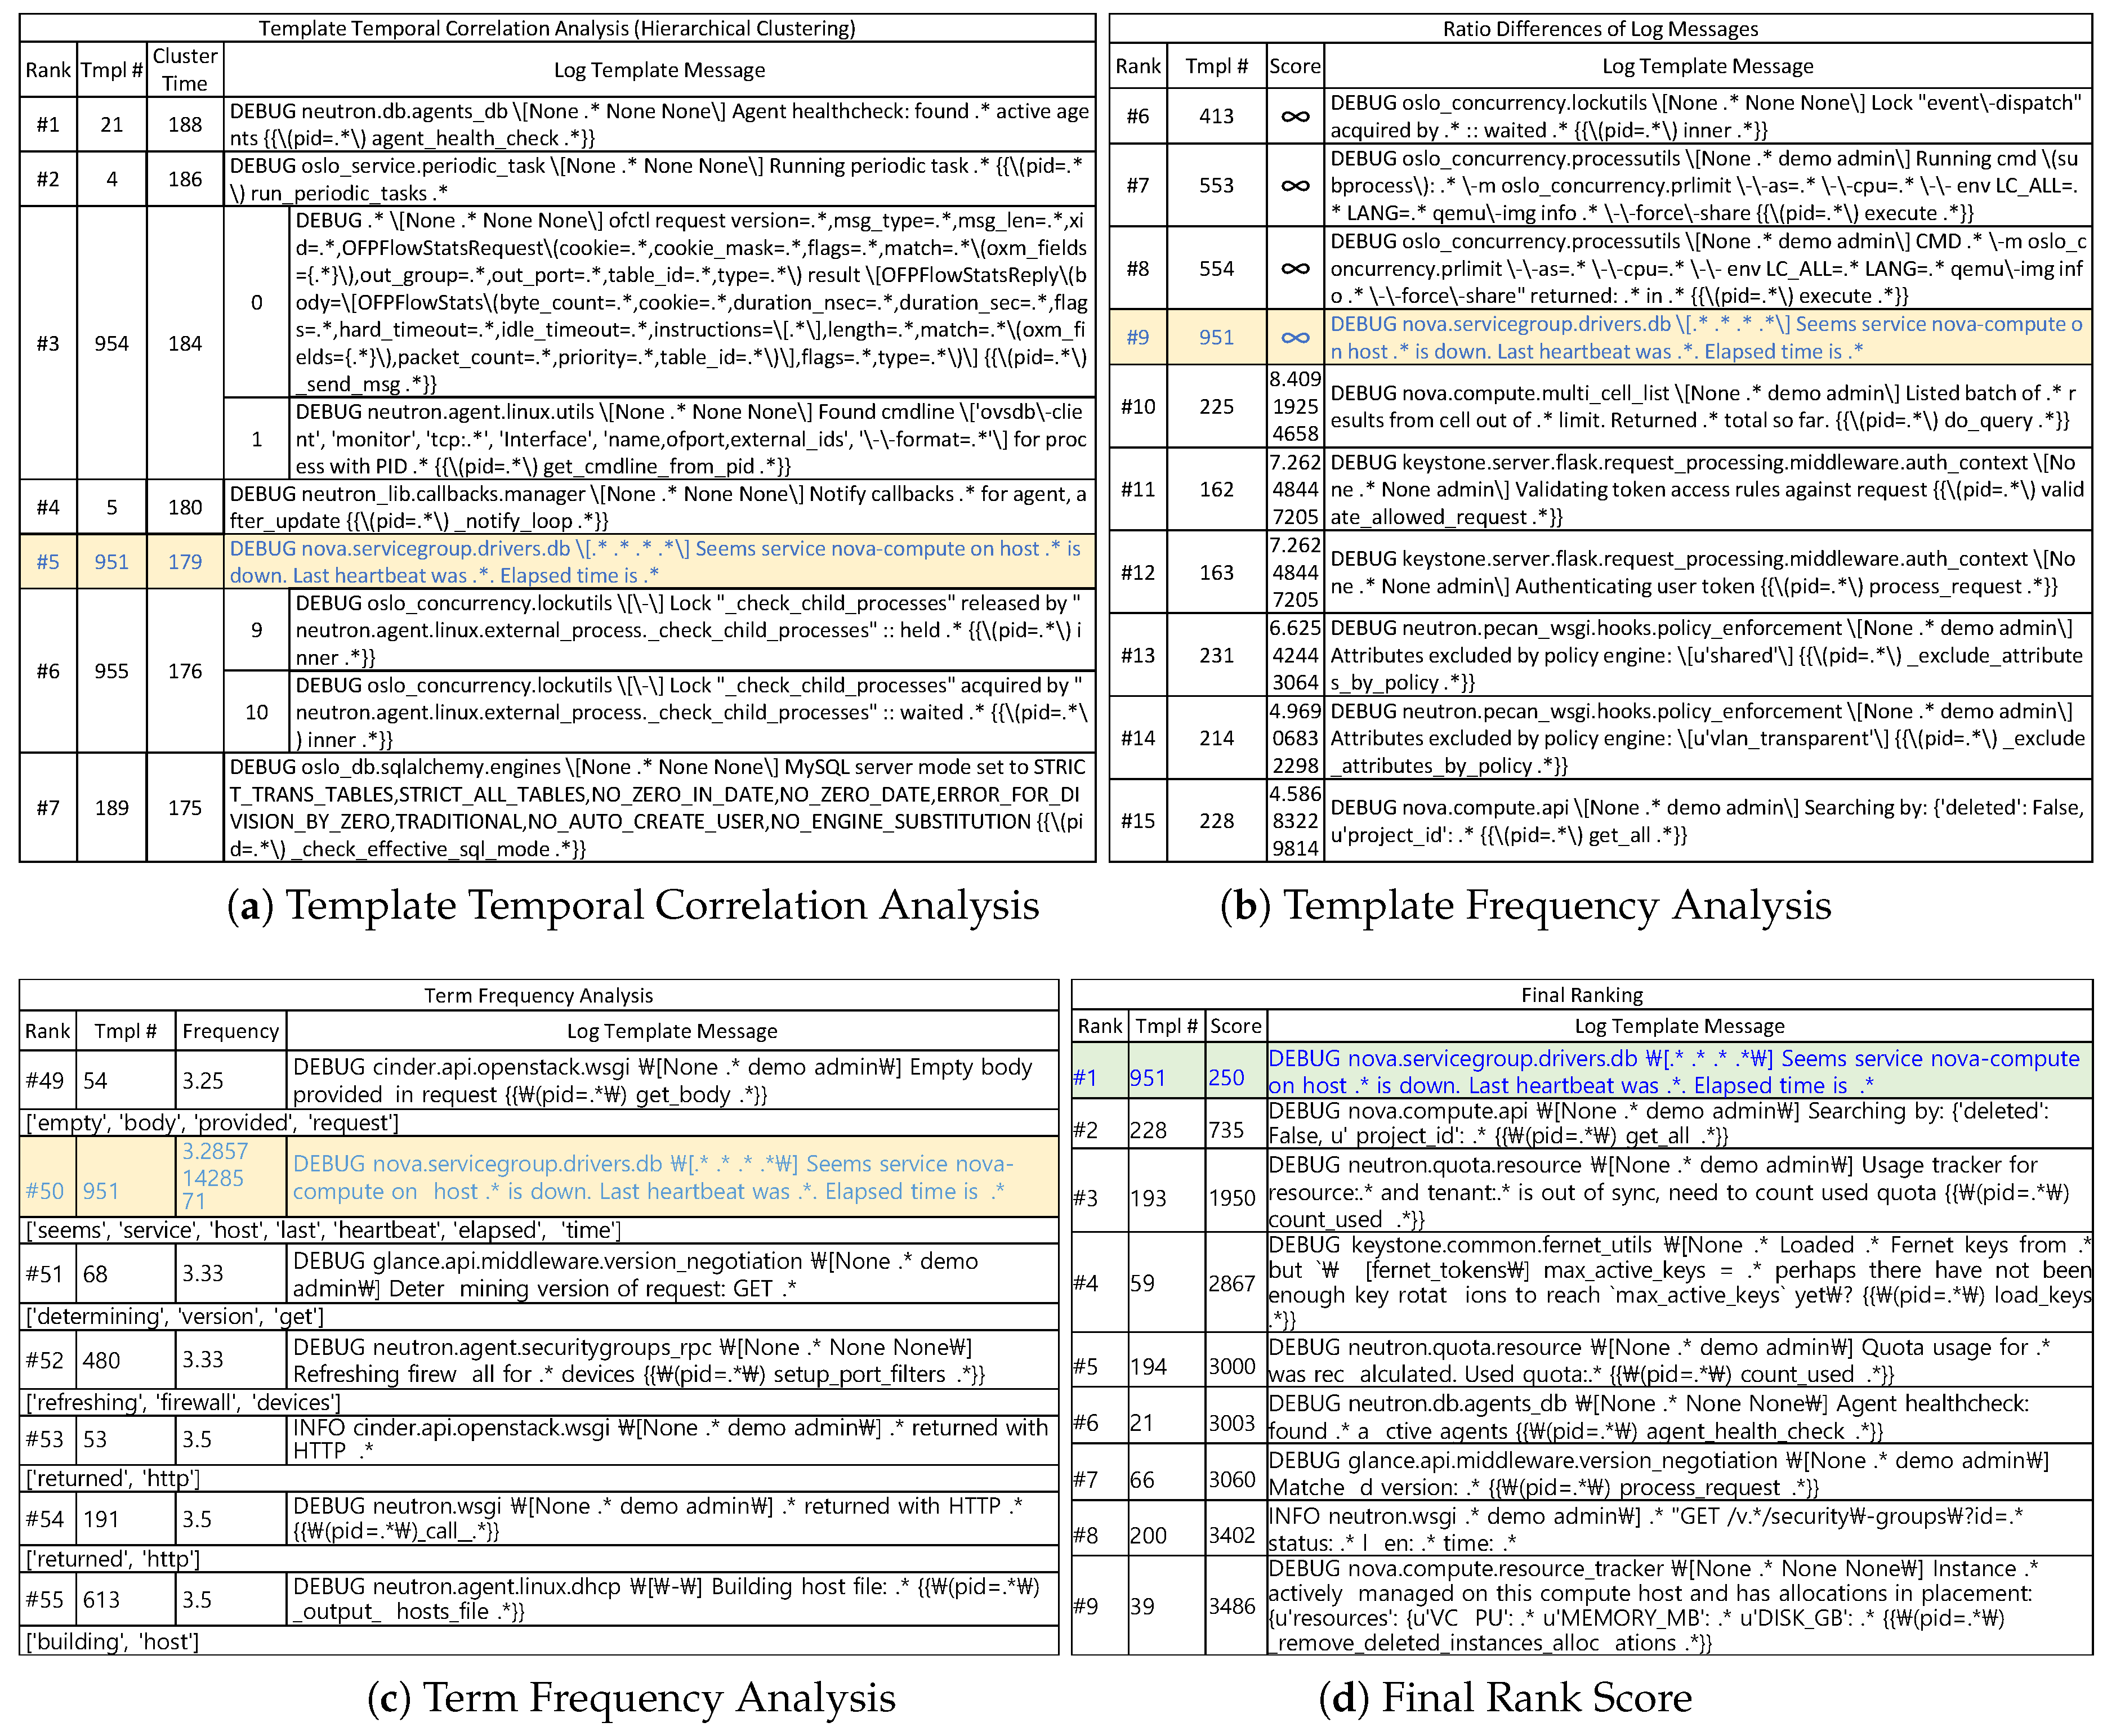
To this end, we have designed and implemented a novel method, called Priolog, to narrow down from volumes of raw logs to the small number of most relevant logs that are highly likely to carry the key information to the root cause of the problem. At the high-level, Priolog applies three independent analyses—log template temporal correlation analysis, log template frequency analysis and term frequency analysis. In the first template temporal correlation analysis, we look at the correlations among the time-series of log message types in order to find outlying log message types. A log message type, or a log template, is a static string part of a log message within which contextual values or strings are embedded to reflect the current execution state. We transform the raw log streams into n time-series, one from each log template, and cluster them by strength of temporal correlations. Intuitively, log message types that do not cluster well with others are a product of abnormal behaviors likely to contain important information. Such log templates are given high scores in this analysis. In the second template frequency analysis, we look at the frequency of the log messages per their corresponding log message types and identify the ones that significantly departs from the normal level of frequencies. If certain log templates show sudden change of frequencies, this may be indicative of unusual activities. Investigation of them may be helpful to finding the root cause. Similarly a newly appearing log template types (i.e., increase of frequency from 0 to some value) could carry a high-value information. The third term frequency (TF) analysis tries to compute the scores of individual messages by taking into account the rareness of individual words within the log messages. The score of a log message is computed as a function of the rareness scores of individual component words. The reasoning behind this is that certain words that are not seen in other messages could be a direct description of abnormal conditions. This 3rd analysis step is intended to further narrow down the log templates having similar score from previous two analyses into the ones of higher value. As a final output, Priolog generates a ranked list of log message types sorted by the product of all three ranks from the analyses.
In order to verify the effectiveness of our methodology in real-world problems, we have applied
Priolog into the problem determination task for OpenStack [
19], the open-source IaaS (Infrastructure-as-a-Service) platform. We first created several failure scenarios of selected operations—launch of oversized VM (Virtual Machine), VM launch failure due to core component failure, and exceeding the VM volume attach limit. For each failure cases,
Priolog was able to successfully list highly relevant logs containing direct hints to the within top-ten of the ranked list of log message types.
The objective of Priolog is to support the problem diagnosis and root cause analysis by bringing upfront the most important logs to the user. In this regards, our contributions are: (i) Proposing novel log selection algorithm made of three independent analyses, and (ii) demonstration of the feasibility through evaluation of popular software. From (i) we learn that simple single criteria does not work well in searching the most important logs, but the combination of multiple techniques must be applied to obtain reasonable accuracy. From (ii) we find that application logs do contain a wealth of useful information hidden in the logs. One requirement for Priolog to be effective was that the logs should contain high-value information in the first place. Through evaluation, we verify that it is the case. This motivates us to develop more advanced techniques to further identify relevant information from logs.
The rest of the paper is organized as follows.
Section 2 provides details of architecture designs and justifications.
Section 3 presents our evaluation of the effectiveness of
Priolog using OpenStack. Related work is described in
Section 4. Finally, we provide a concluding remark in
Section 5.
2. Design of Priolog
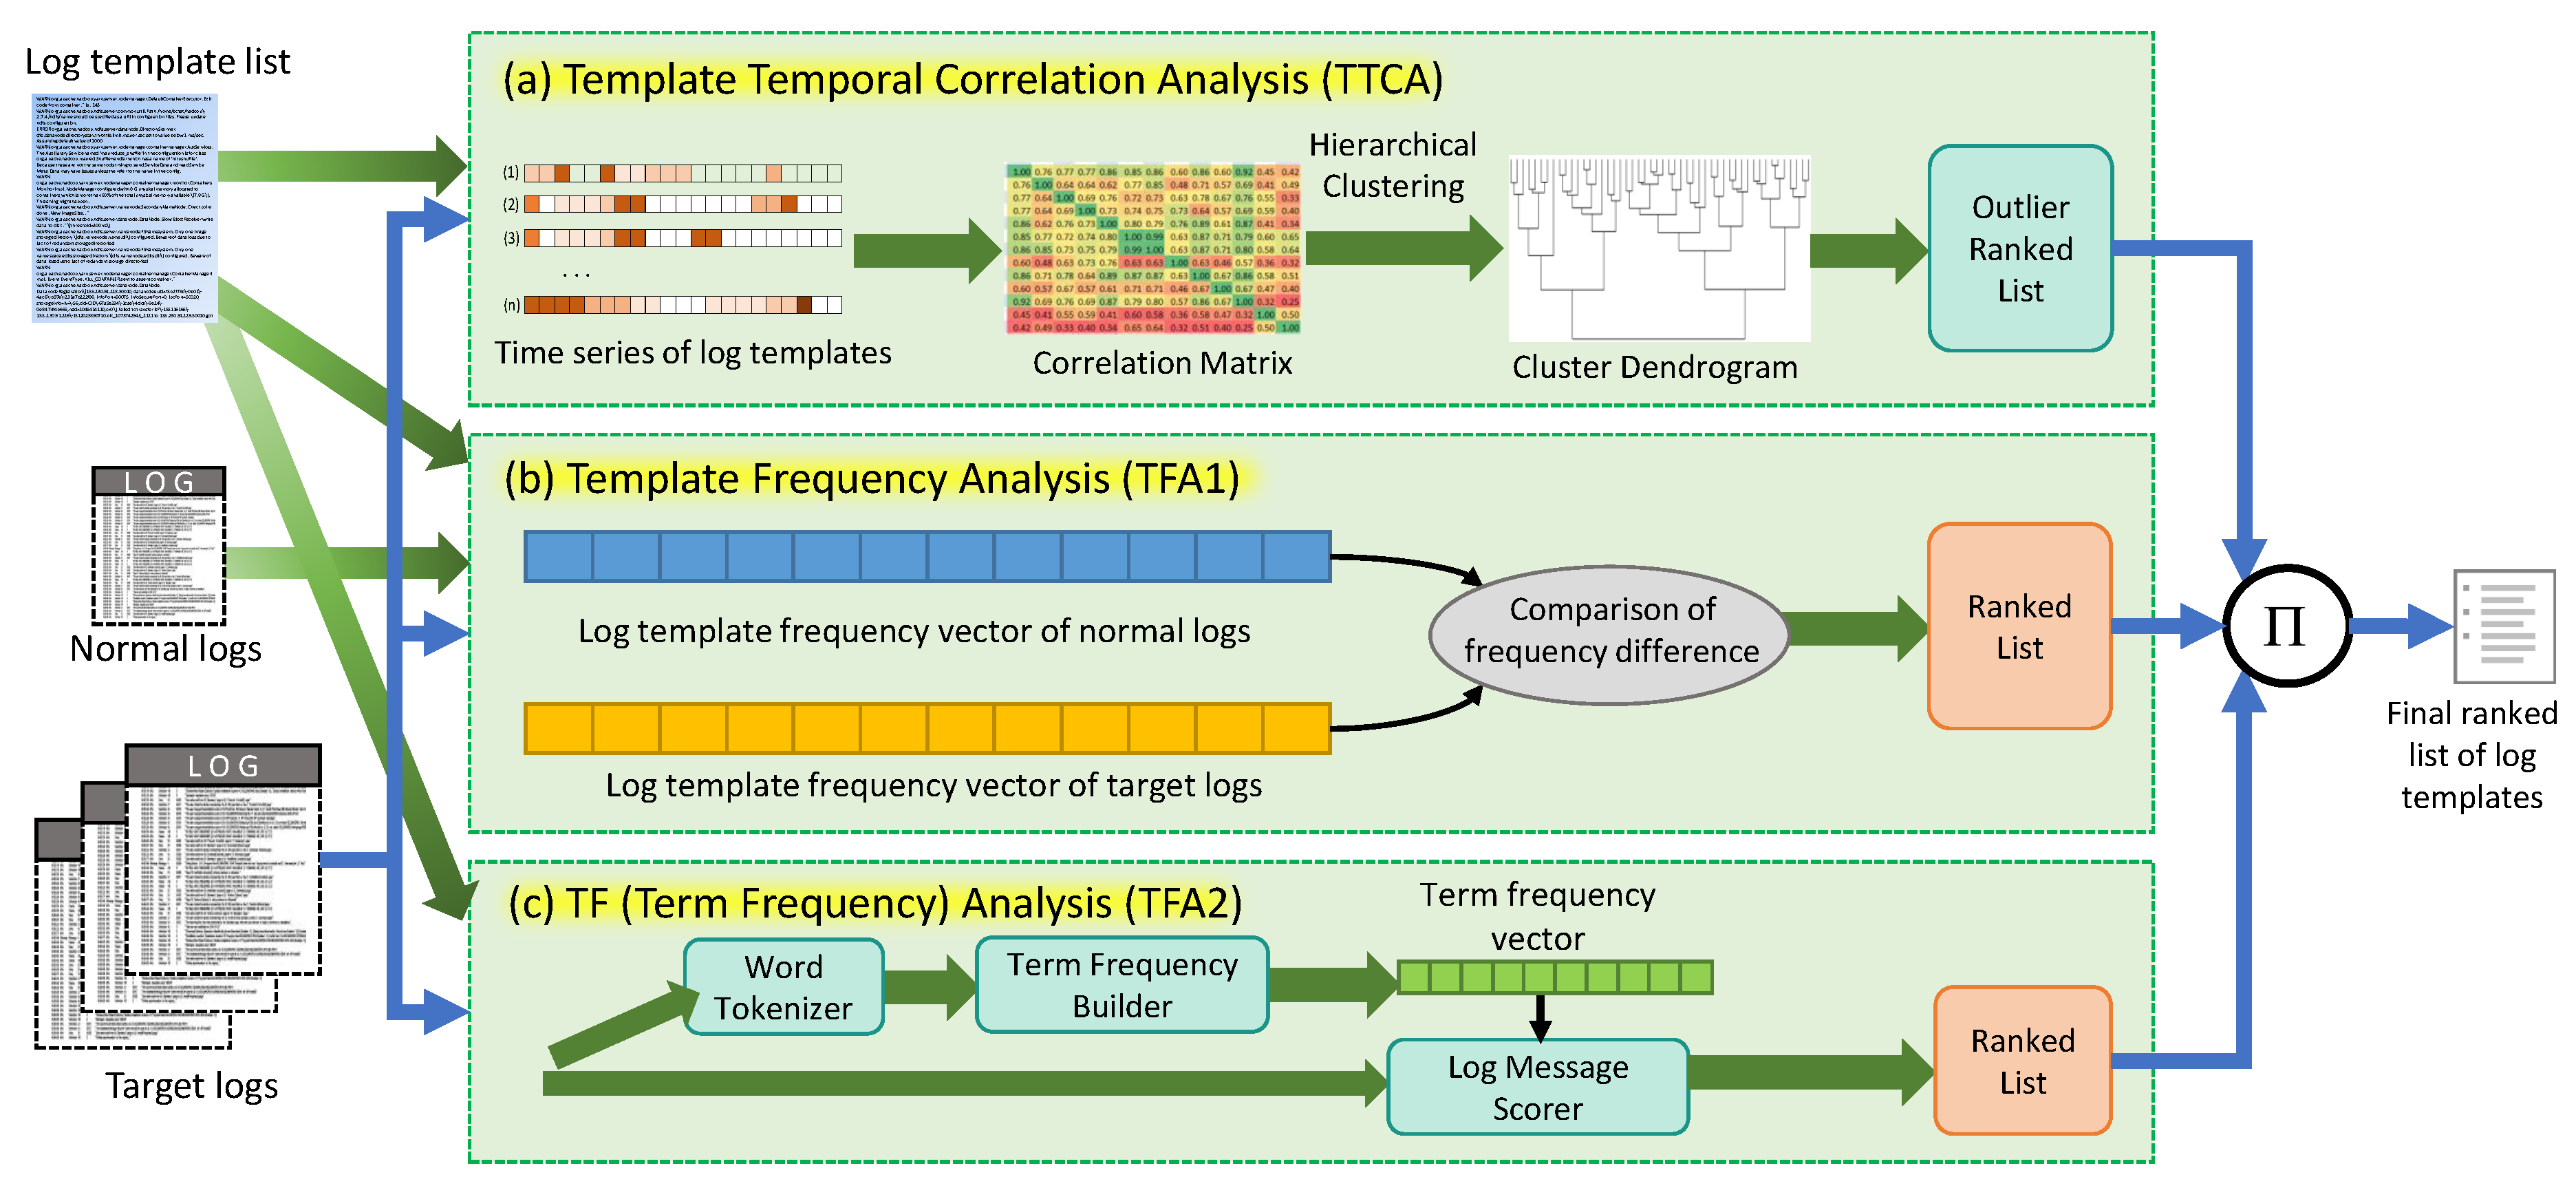
The overall architecture of
Priolog is shown in
Figure 1. The input data to the
Priolog are:
Log template list: List of log templates prepared by the log template discovery algorithm. The technique of log template discovery is out-of-scope. We assume this list is made available by using existing techniques. Log template list is used in the (a) Log Template Time Series Analysis and (b) Log Template Frequency Analysis stages.
Normal logs: logs collected from normal and error-free execution of the application of interest. This is used only for the (b) Log Template Frequency Analysis stage to build the log template frequency vector.
Target logs: logs collected from the application instance that experiences some problem. This is the main input data from which we are trying to determine the root cause of the reported problem.
The log processing flow in the
Priolog consists of three separate stages—(a) template temporal correlation analysis (TTCA), (b) template frequency analysis (TFA1), and (c) term frequency analysis (TFA2). Each analysis produces its own ranked list of log templates. Assume that there is a list of log templates of size
n for an application. Let us denote
as the
ith log template in this list. Also, the function
returns the rank of a log template in the ranked list. That is,
would be equals to some integer which represents the rank in the list generated by the template temporal correlation analysis (TTCA). New final score for a log template
is currently generated by calculating the product of all these three ranks.
where
are the acronyms of three analyses. The final list of log templates is sorted by this metric
. We have chosen the product instead of summation or average of ranks because we wanted to penalize more if rank of any one of the three analyses results low. Summation or average of ranks are unable to differentiate the log templates that ranks consistently from the ones that has high variations across the analysis.
2.1. Template Temporal Correlation Analysis
The goal of this analysis is to identify a set of log templates that are unrelated to the major activities in the application. We refer to such log templates as outliers. The reasoning behind this analysis is as follows. All activities of applications can be categories as two kinds: (i) periodic and automatic background jobs and (ii) predefined set of operations triggered by requests from other components or users. Therefore, applications tend to generate log messages in some fixed and repeated sequences depending on the combination of such activities. Viewing the logs along the time progression, logs will be in a burst of several log messages as a consequence of executing certain tasks. If we aggregate the logs and count the log templates, these co-occurring log templates will maintain certain ratios. In addition, these logs from the log templates will be located within the time range. The overall logs we see in the log files are the interleaving of many such activities.
For the problem diagnosis, we are interested in locating the logs of high importance that are not part of any common activities within the applications. Thus, we want to filter out the group of logs whose log templates have high temporal correlations within themselves. Such temporally correlated logs are probably the output from normal and uninteresting activities. If the application encounters error conditions or problems, it will start to execute error-handling logic. This will be reflected in the logs as the a stream of log sequences that are previously unseen. This, in turn, implies that there will be logs from new (or rare) log templates and they would not be temporally correlated to the existing log templates or background jobs which were already going on within the application.
In order to take advantage of this principle in narrowing down the logs to the most important ones, we first convert the logs as multiple time series data per each log template. Then, we try to identify the log templates that have high temporal correlations and cluster them together. At the end of this task, if there are some log templates that do not belong to any clusters, these would be treated as outliers.
2.1.1. Log Templates
Log templates are a finite set of static string patterns that are used as a template from which actual logs are produced by embedding values of state variables or numbers that represent the current execution state of the application. They are usually the hard-coded part of the string within the log print statements of the application code.
Table 1 are some of the example log templates found in the OpenStack platform. The variable parts within the log templates are expressed as wildcard following the regular expression notation.
Although
Table 1 lists only 10 log templates, the length of full list can be at the order of hundreds or thousands. The frequency distribution of log templates exhibit power law pattern which implies that majority of the log message are from small subset of the entire log templates. Also, there are large number of log templates that are used in small numbers or infrequently. Some of the log templates are not seen until unusual conditions arise during the application run.
In this work we assume that we have already prepared such set of log templates for a given application using existing techniques. Accurately discovering the log templates from the given set of log data is an active field of research and there are several techniques available for us to use [
20,
21,
22,
23]. It is not the goal of this work to design new log template discovery techniques.
2.1.2. Log Template Time-Series Generation
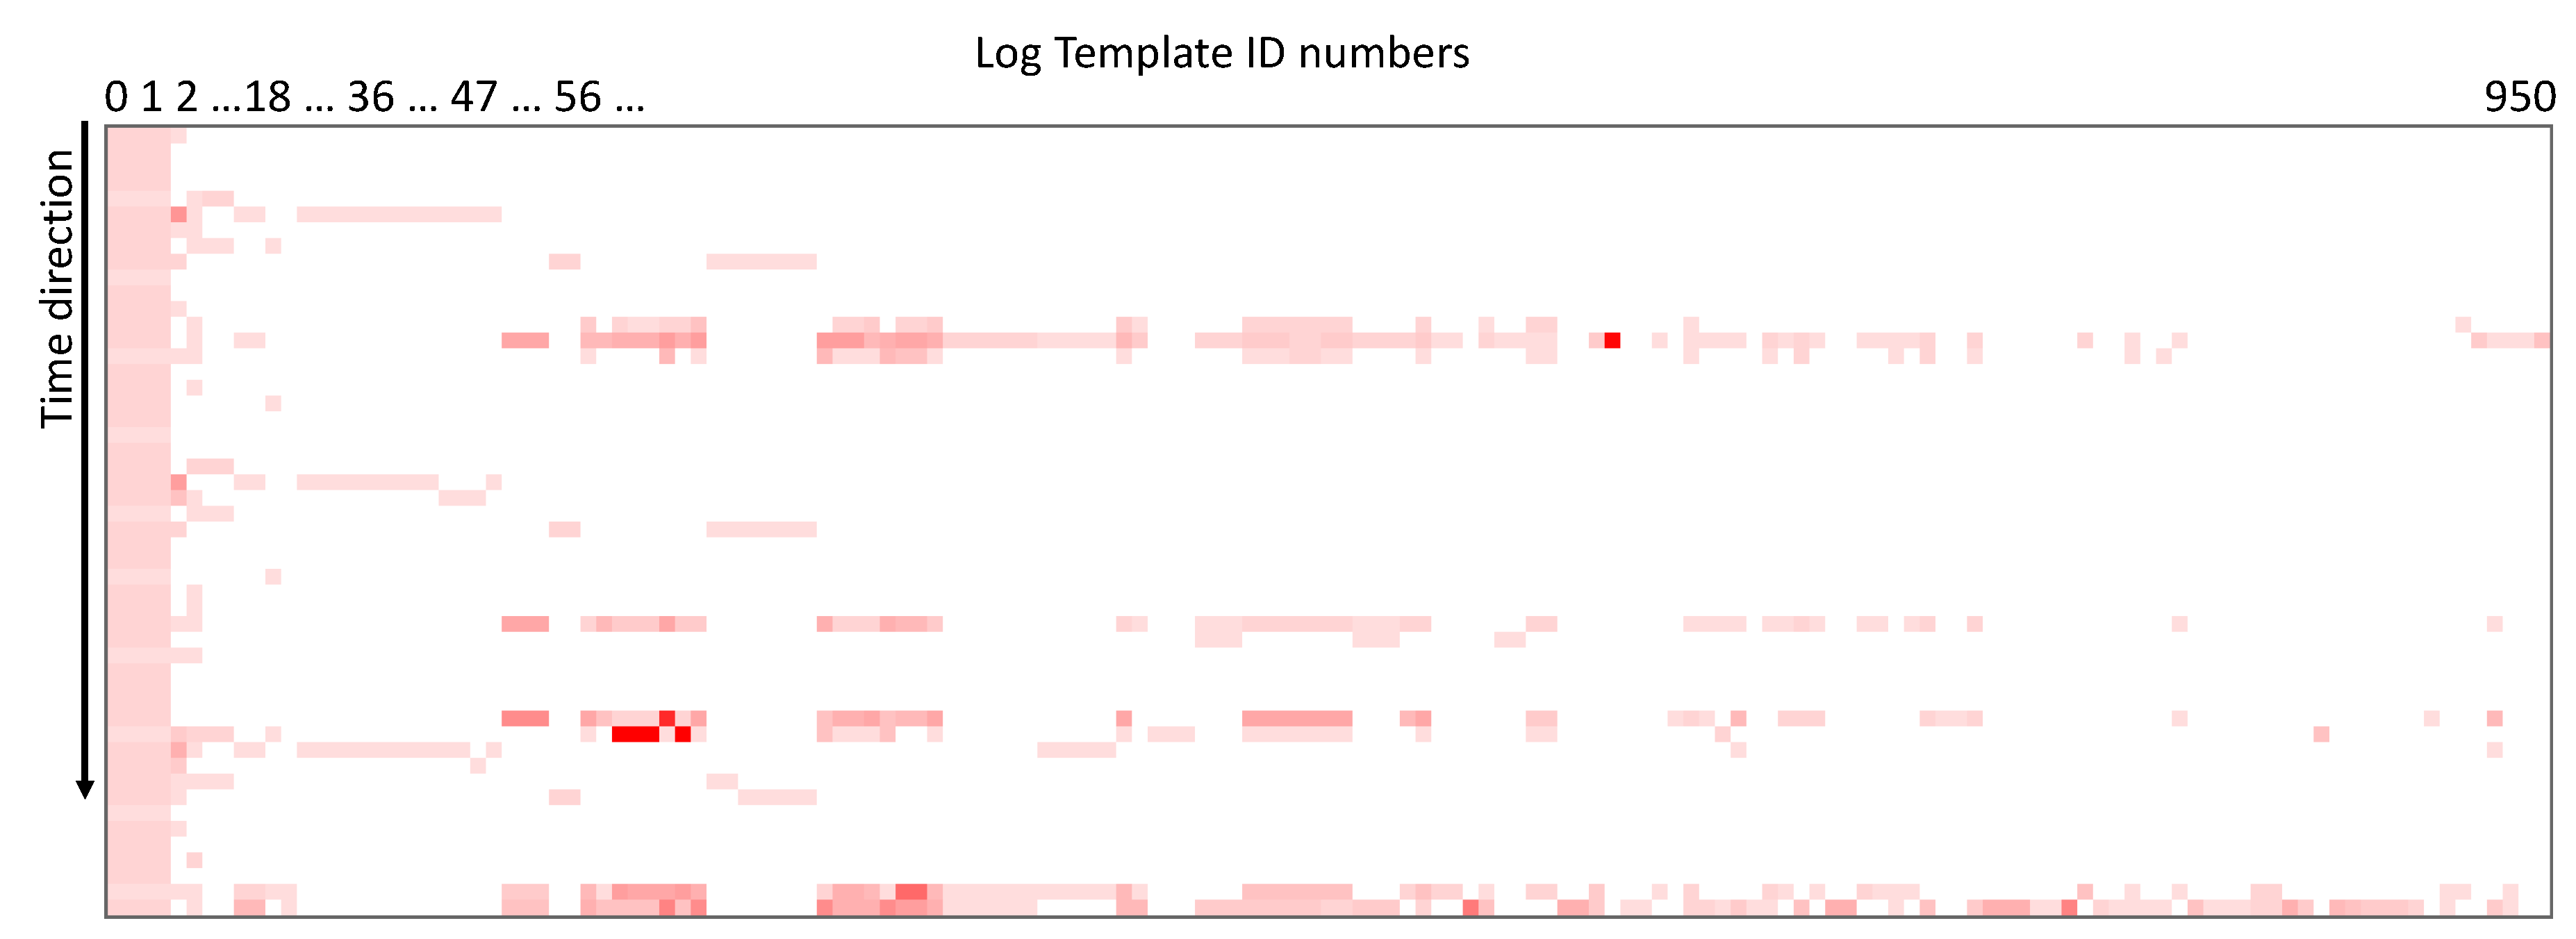
As a first step of the temporal correlation analysis, Priolog takes in the target logs and convert them into n time series assuming the length of log template list is n. For the time series generation, we define a time window and count the number of logs appearing within each window for each log template. The window size is determined by dividing the duration of log start and end time by 50 for convenience. This factor can be adjusted as necessary to some other value. In our cases, it ranges roughly from 10 to 100 ms.
The visualization of sample time series obtained from the actual logs is shown in
Figure 2. Since there are three axes (log template IDs, time, and log counts), we used a heat-map style for the log count quantity. Each small square indicates the presence of logs and the color intensity is the relative density. If the color is stronger toward red, it implies there are large number of logs within that time window. The log template ID is roughly sorted in a way that smaller ID is assigned to more frequently used log templates. The log template ID 0 is a special template where unclassified logs are assigned. Visualization reveals that there are several group of log templates that has temporal locality. As the log template ID increases (i.e., to the right side of the figure), the log counts become scarce and most of the time window is blank.
2.1.3. Correlation Matrix Construction
For all pairs of time series derived from the log template counts, we calculate the correlation coefficients and construct correlation matrix. In computing the correlation we apply the Pearson correlation coefficient metric which is defined as the covariance of two time series data divided by the product of two standard deviations. The value closer to 1 indicates stronger correlation.
We perform this step in order to initialize the distances between log template time series for the following hierarchical clustering step. As the hierarchical clustering progresses, this correlation matrix will have new time series added and the correlation coefficients calculated as needed. More details are explained in the following subsection where hierarchical clustering step is explained.
Intuitively, strong correlation of log template time series is interpreted as coming from the same system activities. Certain tasks of applications tend to generate logs only from certain subset of log templates since the application logic will execute identical log print statements for a given task although there may be minor non-deterministic variations. This behavior will, in turn, generate temporally correlated series of log template counts which we aim to discover by clustering log templates time series.
2.1.4. Hierarchical Clustering
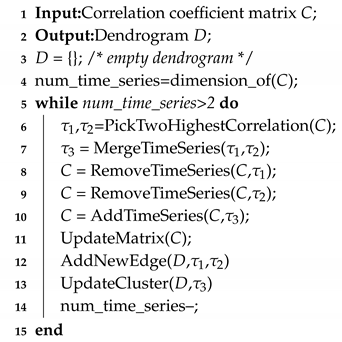
Using the initial correlation coefficient matrix from the previous step,
Priolog now performs a hierarchical clustering. Using the bottom-up fashion, we repeatedly cluster two log template time series
and
that have highest correlation coefficient among the current set of clusters. These two log template time series are, then, merged into one denser time series
and put back into the clustering. New entries are added to the correlation coefficient matrix. At the same time,
and
are removed from the matrix making the overall size of the matrix shrink by 1 in both dimensions. The Pearson correlation is calculated to populate this new entry in the matrix. Then, next highest correlation values are sought among the remaining log templates and the merged groups. This process of merging repeats until we end up with one final cluster. These processes are described in Algorithm 1.
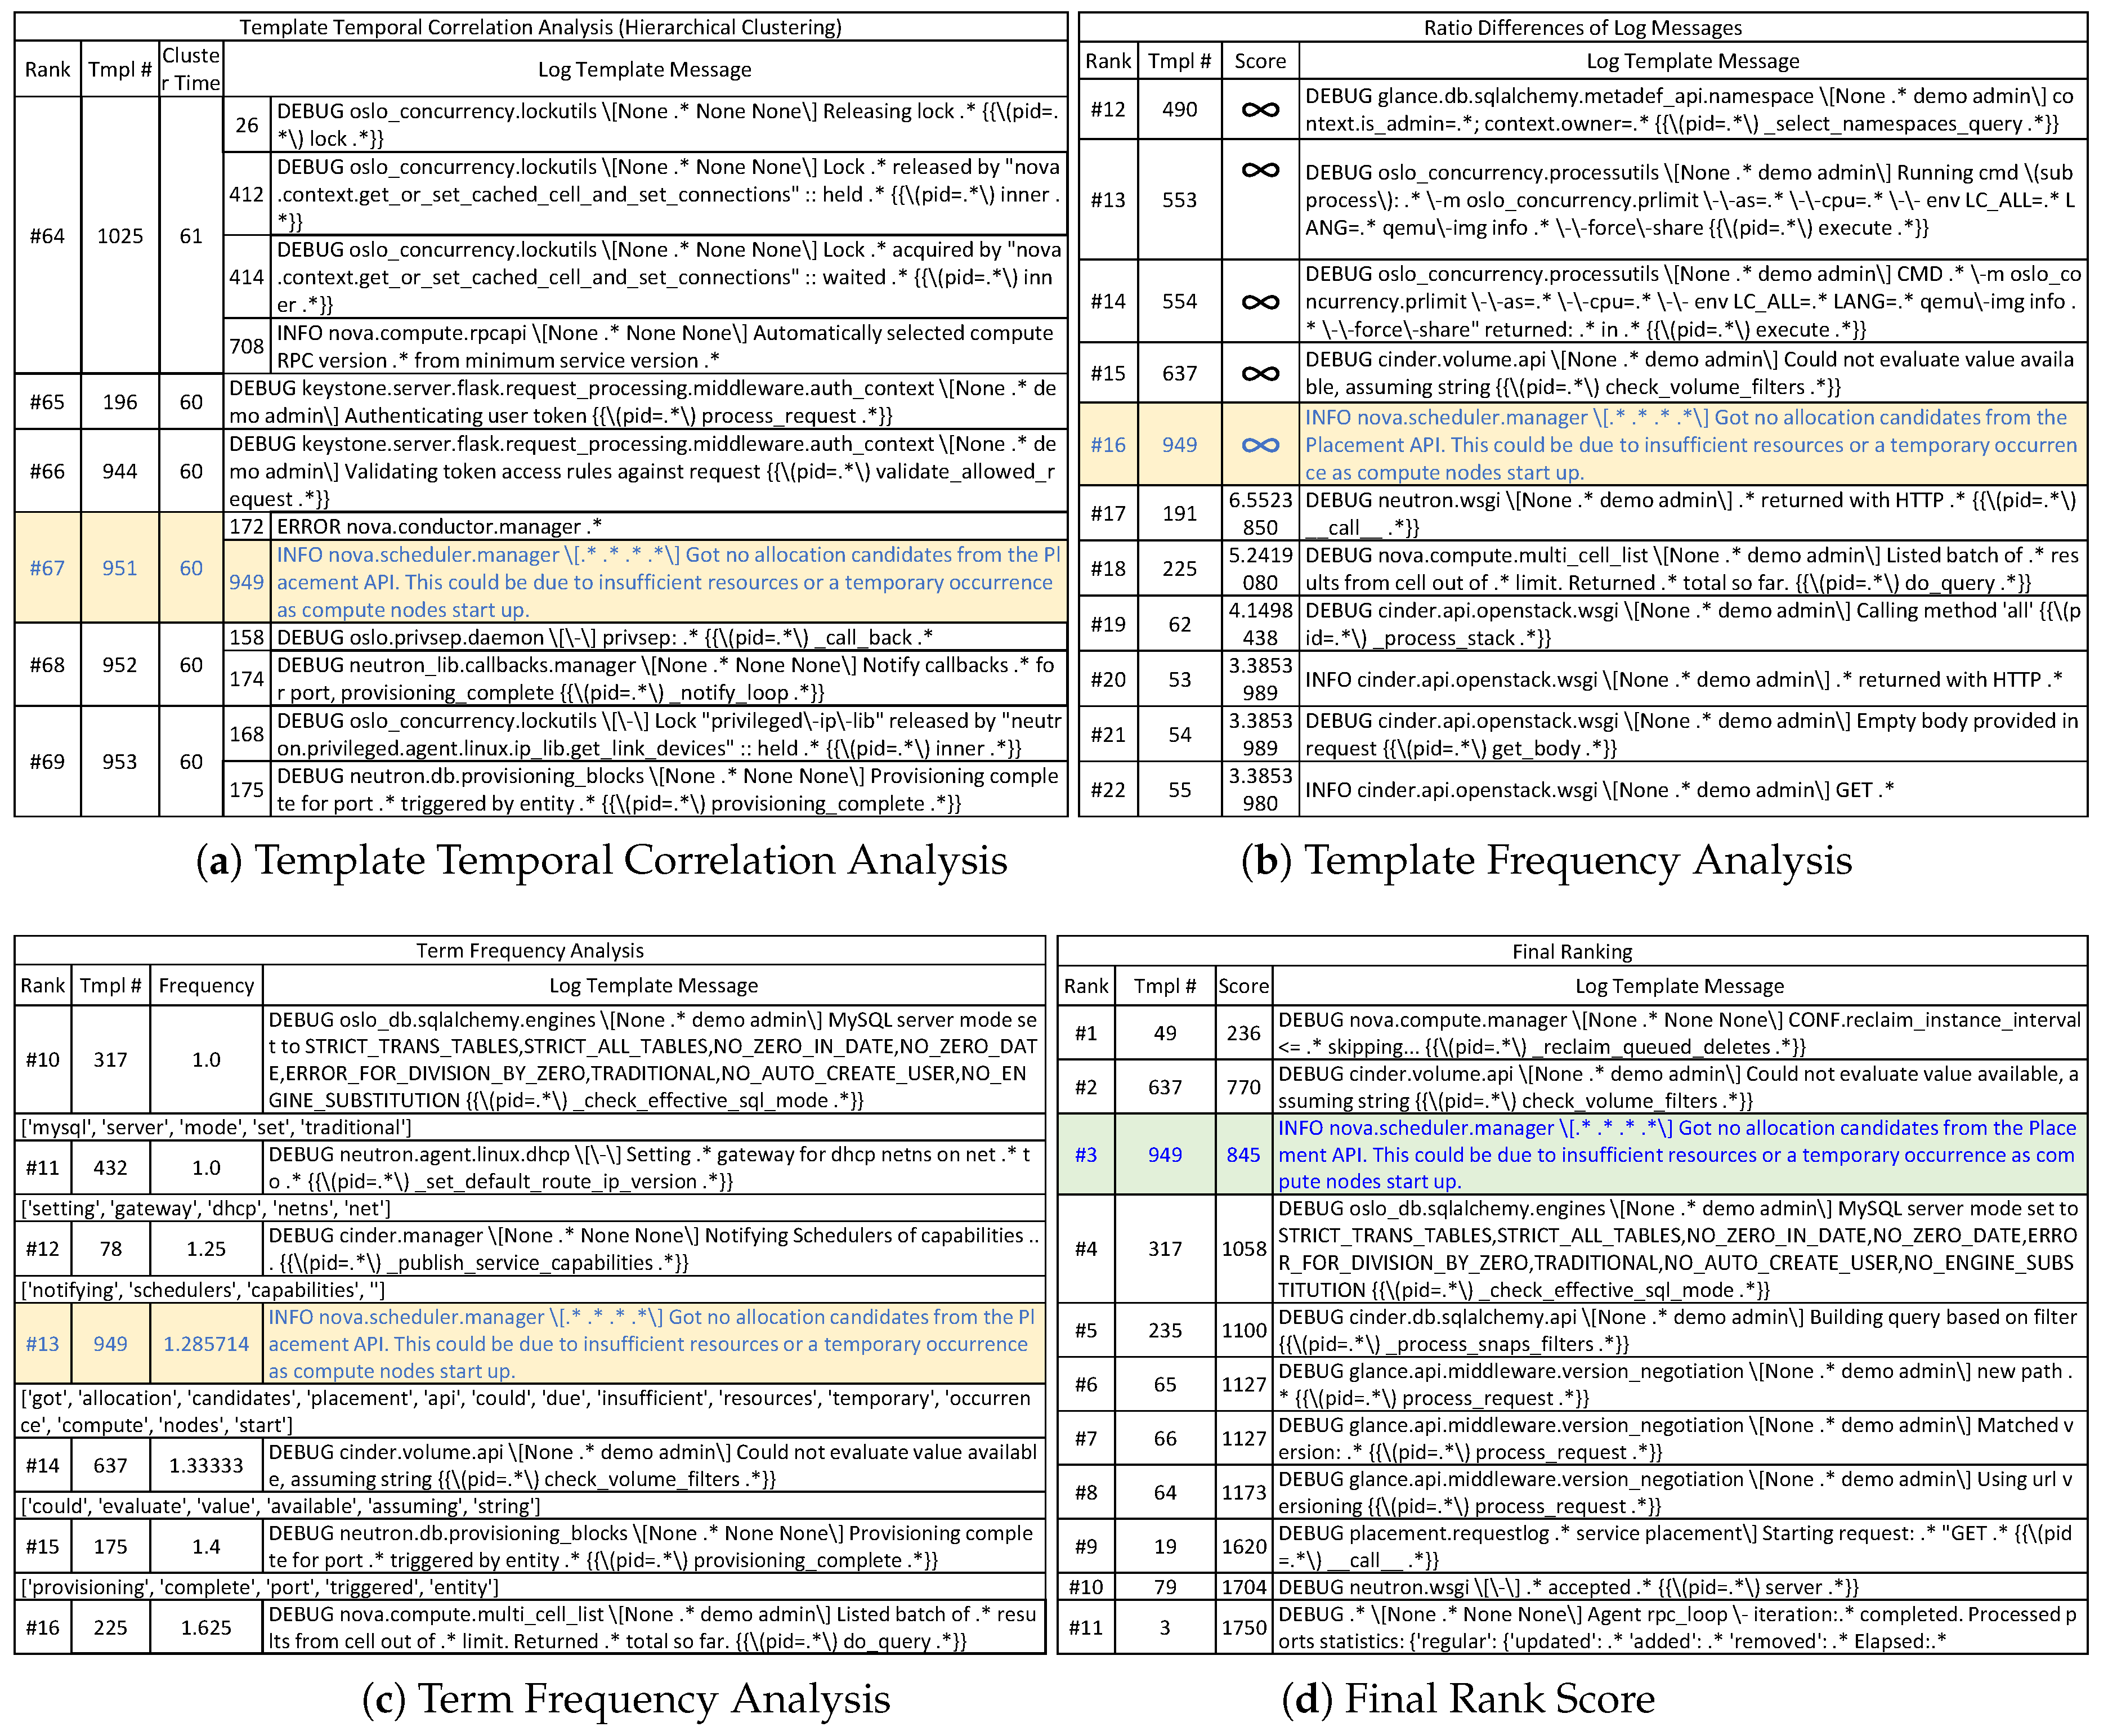
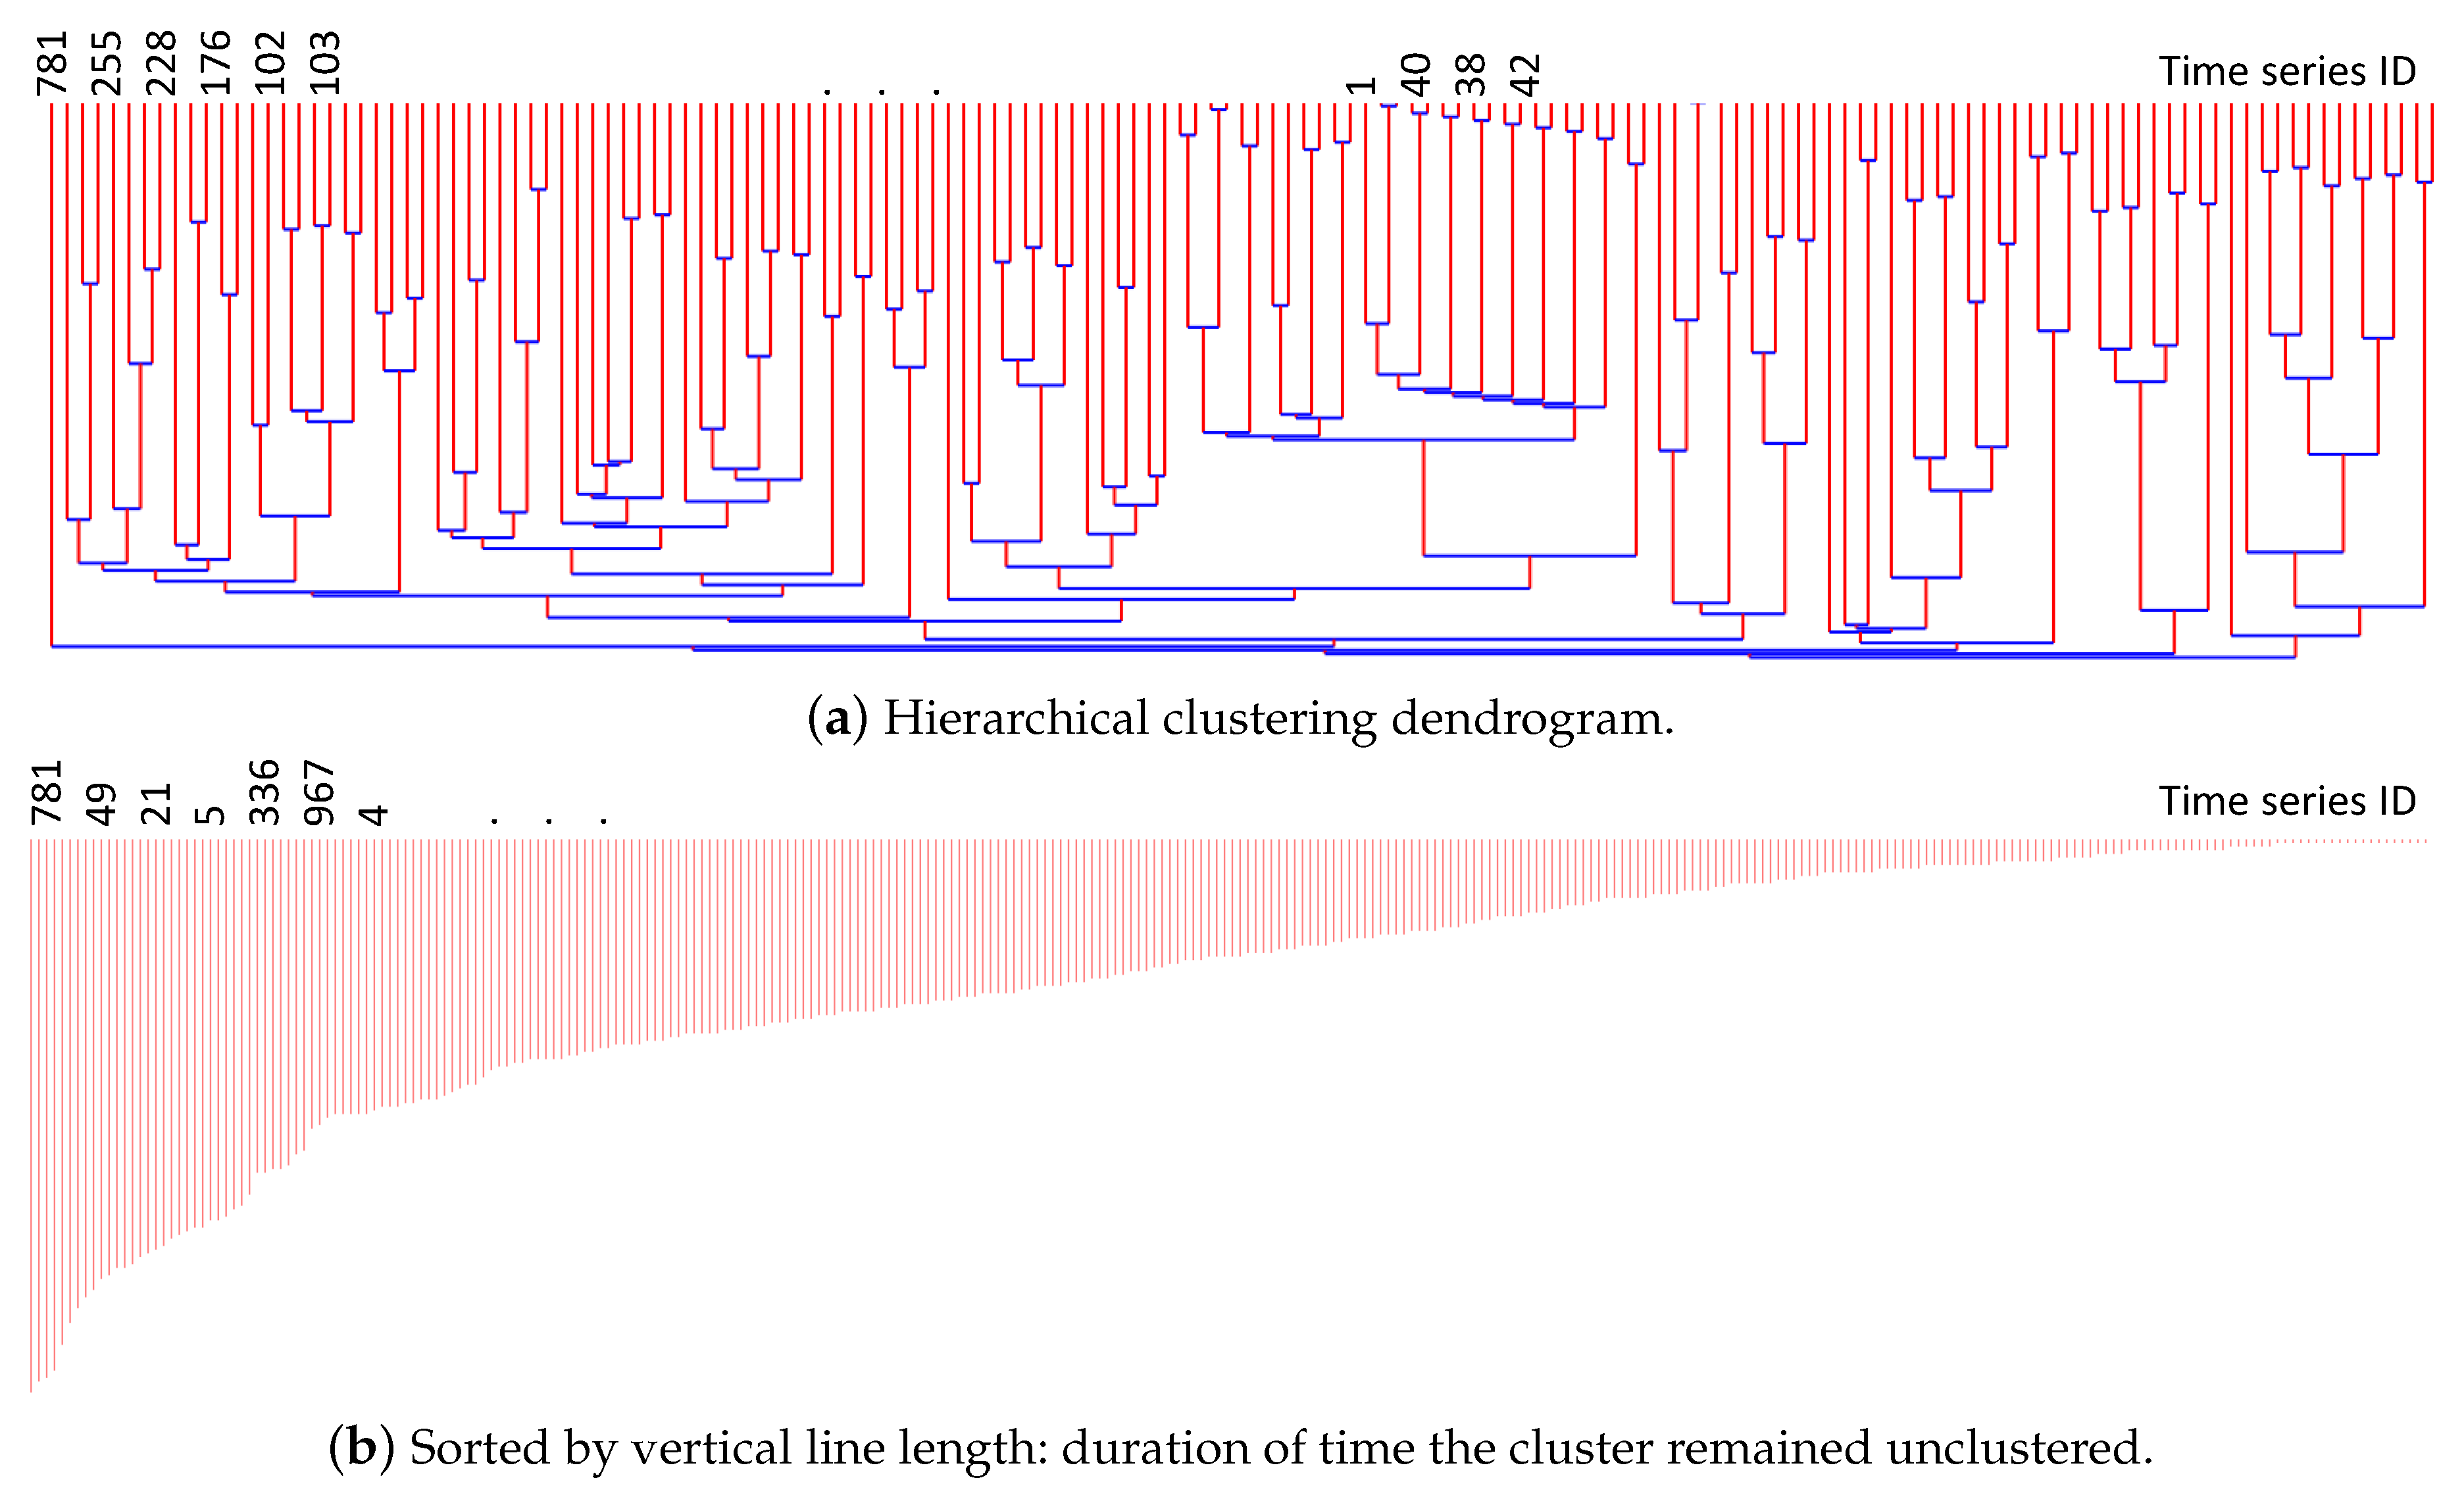
Figure 3a shows the result of hierarchical clustering as a dendrogram.
| Algorithm 1: Hierarchical clustering in Priolog. |
![Sustainability 11 06306 i001]() |
2.1.5. Outlier Identification
The construction of the hierarchical clustering structure does not yet provide us with the quantification of a logs’ importance. In order to obtain this, we use the time duration of the time series that remained un-merged for the longest time. If a log template time series has a low correlation with any other log templates, it will remain un-selected by the clustering algorithm for a long time and be merged towards the end of the clustering process. This implies that such log templates are the product of some unusually outlying activity in the system. If some logs are generated from natural normal behaviors, they would show higher correlation with several other co-occurring log templates. Note that the outlier can be a single log template or a group of small log templates that are merged early on during the clustering and remained unmerged for a long time. Our goal is to find such outlying log template (groups) and highlight them as important or ‘requiring attention’.
Figure 3b is the sorted list of vertical edges from (a). The left-most vertical line comes from the time series 781 in the figure and this is the most uncorrelated time series (and the log templates that comprises this time series). Note that the time series could be the one created by merging several log templates together during the clustering process. In such case, it means that those group of log templates are together part of the same activity, but they, as a group, is distinctly unique compared to other activities. The final rank of log templates as the result of the analysis is assigned using this sorted list of vertical lines.
2.2. Template Frequency Analysis
The approach of this analysis is to score the log templates based on the observed frequencies. The assumption behind this analysis is that, if the number of logs of certain log templates shows higher frequency than normal, this log is probably important. This idea is first proposed in the work by Sabato et al. [
24]. The key to the successful application of this idea is how to define the ‘normal’ level of frequency for each log templates. We adopt this method in
Priolog as one of the analysis.
Frequency Vector Construction
When it was first proposed, Sabato et al. [
24] assumed an environment where there were large number of computers working on heterogeneous tasks. Thus, one of the focus of this work was to apply the clustering to build accurate cluster of computers performing similar tasks. The ‘normality’ is, then, defined per these clusters. However, in our settings, we do not assume the existence of large number of servers. Instead, we assume to maintain a staging environment identical (or similar) to the production settings and we perform planned experiments to collect the logs that represent the ‘normal’ runs. Nevertheless the output of this is the same—probability vector
. The probability vector
P is of length
n, the number of log templates, and it holds the probability of corresponding log templates to appear in the logs.
Given the target logs, Priolog builds the frequency vector F similar to the probability vector. This frequency vector is normalized so that the sum of all the elements would be 1 and then compared with P. Then, we compute the ratio between and as for each log template i. These ratios of log templates are used to rank them. If a log template is previously unknown, it will not be in . In such case, the ratio will be infinity and that log template will have the rank 1 since newly appearing logs are likely to be important.
2.3. Term Frequency (TF) Analysis
The first two analyses are effective for ruling out unimportant logs to reduce the log volumes. Unfortunately, they are not fit for pinpointing the logs that contain high-value information because of these reasons. For the template temporal correlation analysis (TTCA), in order for this analysis to work well, the time series data must be ‘rich’ with data. However, for large number of unpopular log templates, their time series is mostly filled with zeros and very occasionally (or never) non-zeros. Such times series does not generate meaningful correlation coefficients. This implies that the clustering by the temporal information will only be able to identify clusters that are uninteresting to us that should be eliminated. Most of the times, high-value logs are usually from the rarely occurring log templates. For the template frequency analysis (TFA1), the problem with this is that the increase of log template frequency does not strongly indicate that such logs are more important. Rather, increased log instances can be considered as less valuable because it is more common. Another problem is that there can be excessively large number of log templates that suddenly appear which were non-existing in the normal case. We have experienced this problem frequently and were unable to further narrow down the logs to the most relevant ones.
The third term frequency analysis (TFA2) is introduced to address these shortcomings of other analyses. The hypothesis is that, among the candidate logs, if any one of them contains the words that do not appear often in other log templates, then probably such words are important. It may be the words that directly describe the abnormal condition because the programmer may have added log print statements in the code in such a way that current conditions are revealed. Based on this idea, we perform a word-level frequency analysis as the third analysis.
A log template contains many tokens that include numbers, special characters, and punctuation characters. In this analysis, we mean by words only those tokens that contain alphabets and underscore. The score for the rank,
, is calculated as Equation (
2). Let us use
to denote the total word set in the
ith log template. The total number of effective words in the
ith log template is
. Let
be the frequency of word
w in the entire log template set. Then,
becomes the overall proportion at the global level of
w in the log template set. In words, we calculate the average of proportions of all the words within a given log template and use them as the score.
Final ranked list of this analysis is generated by sorting the log templates by this scores.
4. Related Work
There has been extensive research in the detection of anomalies or outliers in logs using both machine learning approaches and using relations across multivariate time-series data in several application domains [
14,
17,
18,
24,
25,
26,
27,
28,
29,
30,
31]. In this section, we review a set of representative examples of outlier detection applied to log analysis, and highlight a key focus of the contributions of our paper in the context of these rich body of prior art.
In the field of log-based anomaly detection, there are two types of anomalies—performance anomaly and behavioral anomaly. Most of the previous work focus on the detection of performance anomalies. In 2006, Mirgorodskiy et al. [
29] developed a performance anomaly detection technique that is based on the traces of function running time. Function traces of HPC applications, collected by light-weight agent, are converted into vectors. Then,
kth nearest neighbor search is used for a given trace to decide whether it is normal or abnormal. Xu et al. [
30] proposed a technique of automatically creating features and applying PCA to detect anomalies. In order to create features, they parse the source code to understand the log templates, state variables and any identifiers. Two feature vectors, state ratio vector and message count vector, are constructed and they are fed into the PCA-based outlier detection technique to find anomalous log groups. Lou et al. [
14] presents a technique that mines linear invariants from the logs. They first parse the logs into static log messages part and variable parts. Then, they group logs by the program variable values to form log groups. Per each group, they build message type count vector. From the invariant space of the matrix, they derive the execution flow invariants, and any violation of these invariants are considered as anomalies. ELT [
25] proposes two stage approach for log-based troubleshooting. In the first stage, it uses hierarchical clustering on the message appearance vector to quickly group logs into anomalous and normal ones. Then, in the second stage, it uses message flow graph to further identify anomalous logs within the large normal cluster. Additionally, ELT supports the functionality of key message extraction by building difflogs which represents the set of log messages that do not appear in the normal logs. ELT can also do an invariant check of user-provided invariant rules. In lprof [
27], authors have constructed the causal sequence of logs to build the model of correct execution sequence. Nandi et al. [
17] have also tried to build the causal relationship of logs using a few heuristics to use them as a standard in detecting the deviation of log patterns. Logan [
6] aims to help the admins to promptly perform the problem diagnosis and root cause analysis by performing automatic comparison of normal logs and problematic logs. Also, they narrow down the logs into the most likely meaningful regions of log.
Sabato [
24] developed a method for ranking log messages by their importance to the users. It determines that the log is important if it appears more than expected. The objective of this work is closely in line with ours. However, we have learned that the log frequency method alone was insufficient to find the important logs. Our evaluation results shows that using the frequency of logs alone do not give high ranking of true positive logs. SALSA [
32] parses logs using known keywords to extract states and constructs control-flow view and data-flow view of the Hadoop execution. These views are presented to the user for better understanding and problem diagnosis. Along with the state information it also extracts the duration of each state. They demonstrate that state duration information can be made into histogram by states per host and this histogram comparison allows them to identify problematic hosts. GAUL [
28] is for problem diagnosis using logs in storage systems. It uses logs to detect recurring problems and solutions.
In Deeplog [
18], a deep learning approach based on LSTMs is presented for log analytics that is able to create workflows from logs, and give conditional probabilities of subsequent logs given current log based on an implicit finite state machine. Log sequences are treated in a manner similar to sequences of natural language sentences for deep learning purposes. Anomalies are detected, by detecting changes in the workflow expected sequence of logs and deviation from expected conditional probabilities. In addition, the method is able to perform online learning as combinations of logs change. This approach provides an improve way to detect anomalies in log sequences and relate these found anomalies them to expected workflows or sequences thereby providing additional insight to the developer. The method does not leverage domain knowledge or filter for false positives as done in our current work. The most recent work in the log anomaly detection field is the LogRobust [
31]. Zhang et al. have developed a Bi-LSTM classification model from the fixed dimension semantic vectors of logs and improved the anomaly detection capability.
The goal of our work differs from most of the anomaly detection work in that we focus on developing set of techniques that help in the root cause identification rather than the anomaly detection. We assume that the fault has already happened and been detected by the administrator. Thus, Priolog is complementary to the anomaly detection work.
There are several research work focusing on the problem diagnosis based on the correlation analysis of metrics data, but not necessarily the logs.
Priolog performs time series correlation analysis after converting the log streams to time series. CloudPD [
33] is a cloud problem management framework that collects various metrics from the host server and VMs. Then, it uses a light-weight method such as kNN to detect potential anomalies. Once potential anomalies are detected, it undergoes correlation analysis between all metrics within a problematic host and between the same type of metrics across other hosts. If it is beyond some threshold, it considers as a problem. Once a problem is found, it matches the correlation signature to the known root-cause database which is built by experts. The similarity to our work is that it also uses correlations, but on system monitoring metrics. Jiang et al. [
34] proposed an algorithm using the autoregressive models with exogeneous inputs (ARX) to discover hidden invariants between various system measurements. The example of invariants could be: the number of output requests of a load balancer must be equal to the number of input requests, the ratio of input request and the number of SQL query to the database is 2. Since it is difficult to holistically understand the distributed application, they say that it becomes easier if we monitor many of such small invariants, which hopefully characterizes the system well enough. PeerWatch [
35] also uses correlation techniques to discover problems. It first collects various metrics such as CPU utilization, memory utilization, context switch, etc., from VMs running the same kind of applications. Then, it uses canonical correlation analysis (CCA) to discover highly correlated metrics between all pairs of VMs. CCA gives the list of metrics pairs in the order of correlation strength. PeerWatch first uses this information to identify which VM is faulty. Then, within a faulty VM, it identifies which attributes have changed significantly in terms of distribution.
5. Conclusions
We have presented a novel method, called Priolog, that is designed to quickly mine the most informative logs from the volume of log files for speedy problem diagnosis. The technique is based on the combination of log templates’ temporal analysis, template frequency analysis, and word-level term frequency analysis. These three techniques, combined together, complement each other to generate accurate ranked list of most important logs. We have tested Priolog to the popular OpenStack platform under various failure scenarios. The results indicated that the Priolog’s approach is promising for log-based problem diagnosis.
As a future direction, we plan to apply state-of-the-art techniques from the NLP domain such as the word embedding or n-gram analysis to improve the capability of Priolog in finding the most important logs. For example, the word embedding allows us to search for the words having similar meaning to critical words such as ‘failure’ or ‘errors’. Since word usage depends on the programmers who generated the log messages, word embedding allows us to learn the intended meaning of important terms. This would help us prioritize logs better. Another technique, n-gram analysis, can be used to learn the probabilistic model of word orders so that appearances of any abnormal word can be quantified and prioritized by the degree of statistical abnormality.


