Article

Service Quality and Customer Loyalty in a Post-Crisis Context. Prediction-Oriented Modeling to Enhance the Particular Importance of a Social and Sustainable Approach

by
Diego Monferrer
*,
José Ramón Segarra
,
Marta Estrada
and
Miguel Ángel Moliner
Department of Business Administration and Marketing, Universitat Jaume I, 12071 Castellón, Spain
*
Author to whom correspondence should be addressed.
Sustainability 2019, 11(18), 4930; https://doi.org/10.3390/su11184930
Submission received: 30 July 2019 / Revised: 3 September 2019 / Accepted: 6 September 2019 / Published: 9 September 2019
(This article belongs to the Special Issue Consumption, Consumer Behaviour and Sustainability)

Abstract

:
Research into the influence of service quality on customer loyalty has typically focused on confirming isolated direct causal influences regarding particular dimensions of quality, usually undertaken in the context of positive, firm-customer relations. The present study extends analysis of these factors through a new lens. First, the study was undertaken in a market context following a crisis that has had far-reaching consequences for customers’ relational behaviors. We explore the case of the Spanish banking industry, a sector that accurately reflects these new relational conditions, including a rising demand for more socially responsible banking. Second, we propose a holistic model that combines the effects of four key factors associated with service quality (outcome, personnel, servicescape and social qualities). We also apply an innovative predictive methodological technique using partial least squares (PLS) and qualitative comparative analysis (QCA) that enables us not only to determine the direct causal effects among variables, but also to consider different scenarios in which to predict customer loyalty. The results highlight the role of outcome and social qualities. The novelty of the social qualities factor helps to underscore the importance of social, ethical and sustainable practices to customer loyalty, although personnel and servicescape qualities must also be present to improve the predictive capability of service quality on loyalty.

1. Introduction

Loyalty intentions are increasingly attracting scholarly attention in the subject of consumer behavior, within the area of marketing research, particularly when studies demonstrate the significant benefits for the firm of retaining a single customer rather than attracting a new one [1,2,3,4]. As a result, companies are trying to identify which factors may have a greater influence on maintaining customer relationships; that is, on their loyalty [4,5,6,7]. Pritchard et al. indicate that, “understanding how or why a sense of loyalty develops in customers remains one of the crucial management issues of our day” [8] (p. 333). In general, the service literature regards service quality as a key construct in explaining the variables associated with relationship quality [3,6,9,10,11,12,13]. Underlying this assumption is the premise that the evaluation by the client of the quality of the services received from a service provider leads to an affective response [5].
However, after a comprehensive revision of the previous literature on the relationship between service quality and loyalty, we conclude that this relationship is characterized by the convergence of four principal conditioning factors: (1) it is almost exclusively centered in areas of study associated with positive firm-customer relational contexts; (2) it is normally based on models that focus in isolation on certain specific dimensions of service quality; (3) the classic conceptualization of the dimensions of service quality has not integrated social determinants, neglecting the obvious need to provide understanding of the behavior in the exchange of goods and services from a sustainability perspective; (4) the main methodology used, structural modeling equations (SEM), is generally associated with analyzing direct causal relationships among variables. These four aspects have given rise to significant gaps and limitations that condition the current state of the art in this field. In response, the present study aims to contribute to the existing literature by offering an analysis through an innovative and differentiating lens.
First, the study is framed in a post-crisis market context in which, in general, customers’ relational behaviors have been negatively affected. Our study examines the Spanish banking sector, which perfectly illustrates these new determining relational factors. The consequences of the global crisis that happened between 2008 and 2014 were particularly severe in the financial sector, and triggered a series of deep changes in the competitive environment of modern financial entities [3,4,7,10,14]. This study is framed in a post-crisis market context in which, in general, customers’ relational behaviors have been negatively affected. Indeed, research by the Spanish Sociological Research Center showed that in October 2005, 61% of the Spanish population reported having little or no trust in banks, a percentage that rose to 65.3% in December 2008 and 76.7% in October 2010 [15]. In turn, the results of the Edelman Trust Barometer [16] on society’s trust in a range of sectors confirmed the banking and savings bank sector as the least trusted sector in general terms among both the most informed public (28% reported trusting this sector) and the general public (only 18% trusted these institutions). More recent studies also support the thesis that the crisis had a negative emotional impact and led to the breakdown of trust in the relationship between banks and their customers. Moreover, it verified the difficulties that banks are still facing in designing strategies and introducing mechanisms that improve the sector’s reputation and the positive relational bond between customers and banks [17]. These new conditions have generated a profoundly emotional climate that has undoubtedly affected the relational behaviors and attitudes of banking consumers toward the financial systems and firms operating in this sector [3,7], and has raised social awareness among regulators, shareholders, employees and consumers, who are now demanding socially responsible behaviors with a strong commitment to sustainability, and calling for better tools with which to evaluate business practices [2,5,18,19]. In summary, the crisis called into question a philosophy in the sector in which certain actions of dubious integrity were undertaken as a matter of routine (abusive fees, disproportionate interest rates, sale of preferred stock, etc.) [3]. The complex and difficult period experienced between 2008 and 2014 contributed to the development of a new social awareness among customers seeking a more ethical and socially responsible form of banking, accompanied by a certain widespread rejection of banks that continued to implement unsustainable practices, even leading to the appearance of so-called ethical banking [20]. In recent years this new disruptive paradigm is driving the incorporation of the sustainability concept in the banking sector, where, in contrast to the industrial and consumer sectors, it is a relatively new concept, since the practice of socially responsible and sustainable actions was in its infancy and responded to marketing needs rather than to a real awareness [2,21,22]. The above points would, therefore, seem to suggest—and investigation into this little studied question is one of the main contributions of the present article––that one of the consequences of the banking crisis is the positive evaluation of developing sustainable practices in banking among clients, shareholders and suppliers, which is perceived as an important indicator of the quality provided by the bank and a basic element in the relationship between the customer and the bank, thus in the development of the long-term relational bond.
Second, in a turbulent environment such as the present one, it is crucial for businesses to know which factors have the greatest influences on sustaining satisfactory and long-lasting relationships with their customers [3,4,5,10,13,14,23,24]. The need to discover these factors is even more pressing in the banking sector, if we bear in mind the increasing homogenization of the products and services banks offer [2]; as a result, the alternative on which to consolidate a competitive advantage must involve improvements to the process of delivering this undifferentiated service to customers [6,13]. Managers, therefore, need to identify which quality factors their customers most value in order to then assign resources and design strategies to retain and increase their loyal customer base [3,13,25].
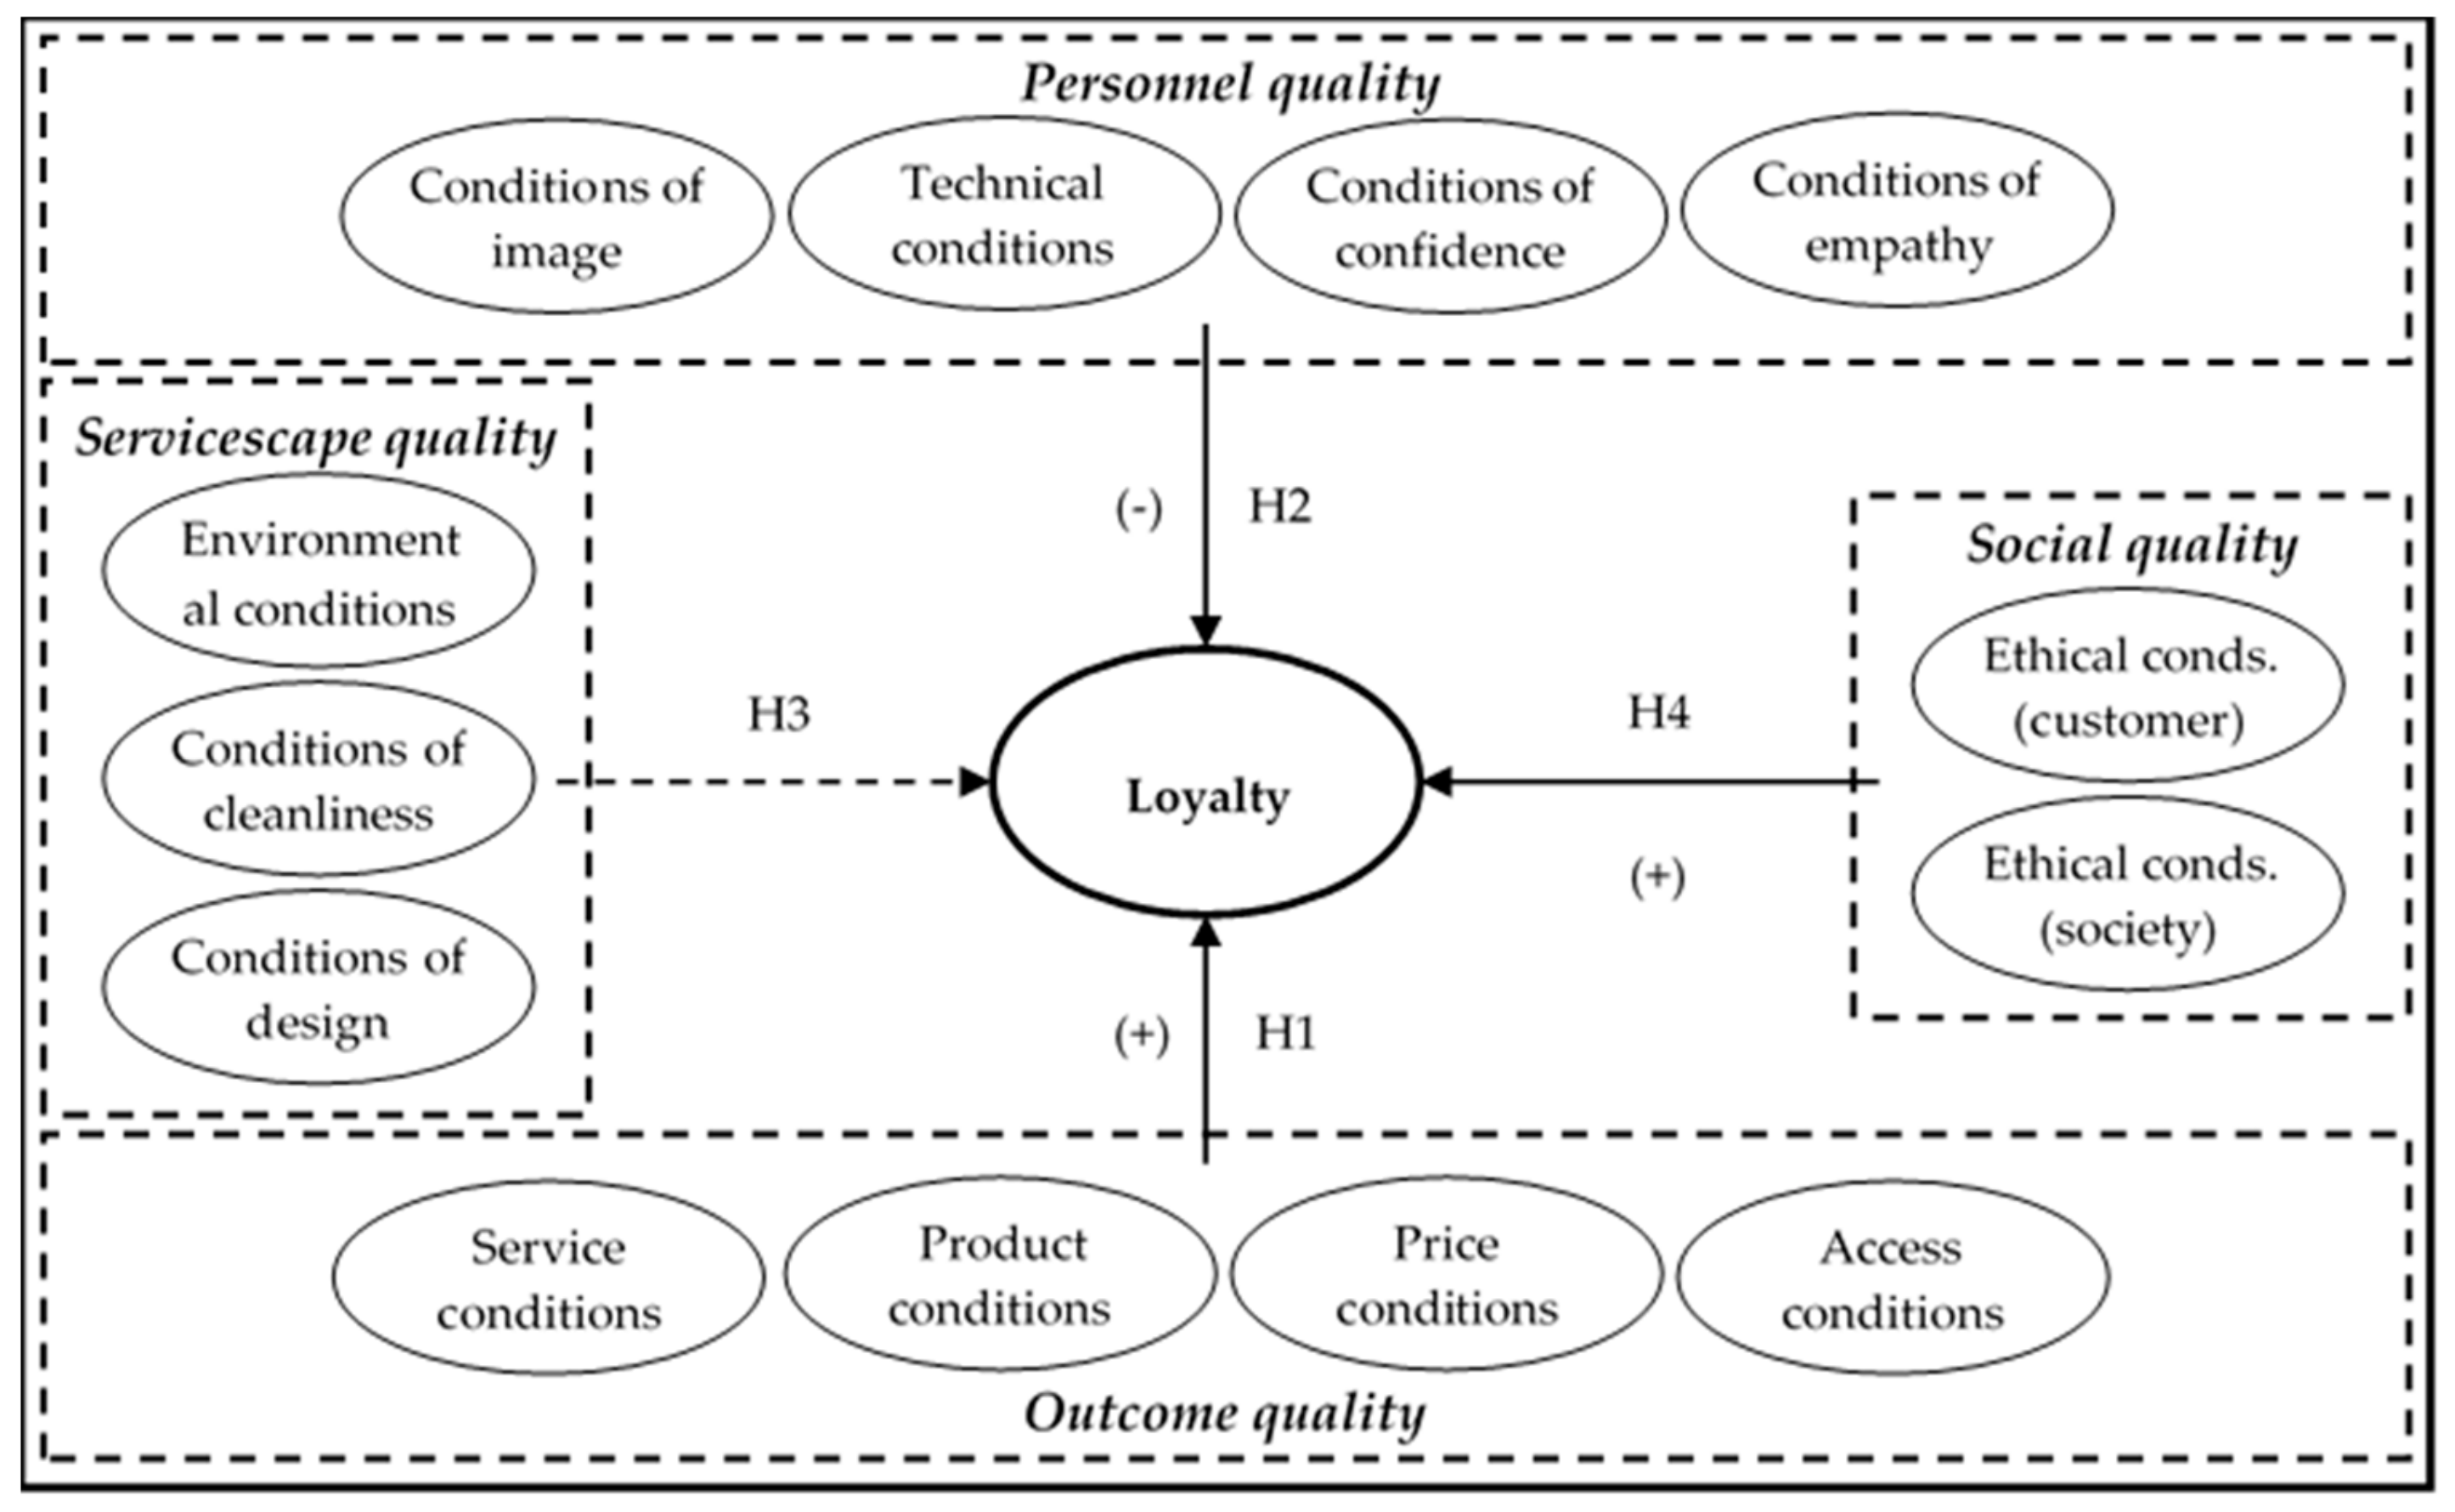
To this end we propose a holistic model that combines the effects on loyalty of four key factors associated with service quality. There is a general consensus that the main function of any business is to create value through the production of goods and services demanded by its customers [12,26,27]. Hence, the first of these four service quality elements corresponds to the value associated with the product or service itself (outcome quality). Second, employees are the agents responsible for providing the service, and therefore, exert a great deal of influence on the service quality perceived by the customer (personnel quality). Third, services are delivered in a setting with physical and environmental features that have a bearing upon the customer’s perception of quality (servicescape quality). In this study we added a fourth determining factor of service quality, namely social quality, associated with social and sustainable commitment, which many authors have called for in recent years [5,19,22,28,29,30,31,32].
In summary, and in line with Ha et al., [5], it is essential to jointly consider all the elements of value involved in providing the service to the customer, since consumers’ assessments of the service do not rely on one particular element of quality. For this reason, models focused on the basic quality dimensions provide a partial and incomplete vision of the factors that determine the overall service assessment [3,5,33].
Third, and in line with the previous argument, including social quality as an additional service quality dimension makes some notable contributions. Studies analyzing the link between social and sustainable responsibility initiatives and marketing outcomes are a relatively new area of academic inquiry, particularly from the marketing perspective [19,22,28,29,30,31,32,34,35,36,37,38], and several gaps have emerged in this recent field of research: (1) although socially and sustainable responsible initiatives have been widely adopted by the global banking community, there has been no research on the impact of social quality measures in determining customers’ relational behaviors during the service experience [2,18,19,21,28,32,35]; (2) existing empirical research on consumers’ responses to social and sustainable initiatives largely focuses on sectors associated with consumer goods, whereas studies in service sectors, such as banking, are scarce and limited [18,21,31,32,34,35,36,37,38]. Thus, in view of the growing social, sustainable and ethical initiatives by banks in response to negative public opinion about the sector, the way to build solid and sustainable competitive advantages over the client by financial entities in this social context, compared to the other traditional dimensions of service quality, is a major question from both the academic and the managerial perspectives [19,28,29,32].
Finally, given the apparent lack of research on the relative and combined influence of possible determining factors in purchasing intent in service contexts, the present research aims to offer a more comprehensive vision of the influence of service quality elements from a marketing approach by enhancing bank customer loyalty. To that end, we used a new methodological technique, prediction-oriented modeling through partial least squares (PLS), which has seldom been applied in business research [39]. Indeed, in 2016 the Journal of Business Research published a special issue on advances in PLS and prediction, aiming to provide a springboard for predictive modeling in the social science disciplines. Prediction adds a new dimension to the study of the causal relationship between two variables, by following a methodology based on holdout samples, in which the model tested on one sample is then tested on a second sample to evaluate the predictive validity using different indicators. In contrast to the explanatory-predictive value of multilevel structural equation modelling (ML-SEM) results, which is limited to the value of the parameter of the causal relationship, prediction-oriented modeling enriches the interpretation by comparing different settings or scenarios [40].
Taking the above aspects into consideration, the objective of this study is to contribute to the construction of a comprehensive model focused on the achievement of customer loyalty with respect to their banks with which to identify and analyze the combined predictive power of the different variables associated to service quality provisions (outcome, personnel, servicescape and social qualities). With this aim, the Spanish banking sector is taken as a reference.
The paper begins with a description of the theoretical framework that undergirds the hypotheses for the model of effects of service quality in Spanish banks on their customers’ loyalty. The different aspects associated with the methodology used are presented below, as well as the results obtained from the analyses performed. Finally, the conclusions, limitations and future lines of research are presented.

2. Service Quality Determinants

Service quality is a personal and subjective concept in which the consumer’s perceptions are an essential part of its definition [5]. On this basis, it has widely been defined as “those features of products which meet customer needs and thereby provide customer satisfaction” [41]. In other words, service quality implies a comparison of the perceived and the expected service, resulting from the customer’s appraisal of a set of factors associated with the service [3,9,13,24,42,43].
This definition has given rise to considerable discussion in the literature about the particular characteristics that underlie service quality [3,42,44,45,46]. Indeed, a large number of proposals have arisen from this debate: (1) The Nordic model [47], which covers service quality dimensions in terms of functional and technical quality; (2) the three-component model [48], comprised of the variables service product, service delivery and service environment; (3) the multilevel model [49], a hierarchical perspective that classifies service quality on three different levels: customers’ overall perceptions of the service quality, primary dimensions, and sub-dimensions [50]; and (4) the SERVQUAL model, which understands perceived service quality as gaps between customers’ expectations and perceptions of five elements [51]: reliability or capacity to deliver the service; responsiveness/capacity to attend customers quickly; appearance of the organization, equipment and physical facilities; the capacity to instill trust in customers; and personalized or service empathy.
Despite the numerous contributions to the literature, there is still little consensus on the variables associated with service quality [44,45,46]. In fact, a growing number of authors are calling for further inquiry into the specification of variables with which to define service quality in the financial sector [3,12,13]. In this study we use the definition of quality from Brady and Cronin’s model [50]. This is the most recent model of service quality, in which, for the first time, service quality was considered as the sum of three types of basic quality factors when delivering services in a financial entity: outcome, servicescape and personnel qualities [3,12,13,27].
In addition to these three factors, services differ from tangible goods due to their characteristics of inseparability, heterogeneity, intangibility and perishability [10,13], with the result that consumers approach the purchase of services in a different way, establishing a stronger and more personal relationship with the provider of the service. On this point, authors such as Ha et al. [5], García et al. [33] and Sureshchandar et al., [52] consider social responsibility, understood as the firm’s ethical and sustainable behavior, to be a further component of service quality. As these authors point, a company that is considered to behave ethically instills confidence in its clients and positively affects their global perception of the service quality they receive [2,18,19,22,28,53]. The recent literature has paid particular attention to this circumstance in relation to the banking sector, due to its influential intermediary role and the impact it has on many other industries. Because of this influential role, the sector is a vital agent for achieving social and sustainable development goals, through an approach tackling diverse forms of ecological and environmental challenges [30,32].
This particular view, in line with findings from recent studies [12], highlights the need to analyze the individual influence of the different dimensions associated with service quality, since each one may present a wide diversity of potential relational results according to the other antecedent variables considered and the contextual conditions of the research [54]. To this end, this study considers the explanatory-predictive value of the four general dimensions of service quality identified, within a comprehensive conceptualization that includes each of the variables associated with these principal dimensions.

2.1. Outcome Quality

Outcome quality is related to the fact that the services offered by the bank to its customers are provided effectively (3). In 1984, Grönroos defined outcome quality as “what the customer is left with when the production process is finished” [47]. In a similar statement, Czepiel et al., [55] referred to this outcome as the “actual” service and indicated that it contributes to the determination of the quality derived from a service encounter. In our review of these outcome qualities we identified four types of conditions: (1) service conditions, related to the outcome obtained from the service compared to the expected outcome and its correct reception [56]; (2) product conditions, associated with the variety and convenience of the products offered [57]; (3) price conditions, covering both price perceptions and price fairness [6,11,56,57]; and (4) access conditions, related to the perception of the waiting time during the service provision [56,57].

2.2. Personnel Quality

Personnel quality is related to the competencies and abilities employees bring to the job. Unlike manufacturing firms, service firms interact directly with their customers, meaning that service quality can be perceived immediately in situ from the interactive process and the activities and actions occurring between the customers and those providing the service [7,10,14,23,24,27].
Our extensive literature review revealed four types of conditions associated with personnel quality: (1) conditions of image, concerning the perception of the physical attractiveness of the staff [1,11,58,59,60]; (2) technical conditions, related to the expertise and knowledge of service personnel, enabling them to provide a good service objectively [1,11,56,57,58,60]; (3) conditions of reliability, regarding the perception of trust and competence in the staff [11,57,58,60]; and (4) conditions of empathy, an employee’s predisposition or tendency to satisfy customers’ needs in a work context [1,11,57,58,60].

2.3. Servicescape Quality

Booms and Bitner [61] defined servicescape as the environment where service is constructed for clients, where they and the service provider interact, thus acknowledging the importance of a physical place in the management and marketing of the service [3,5,27,62].
Recent research on servicescapes has taken a multidimensional approach [59,63]. A review of the literature revealed a series of common and generic conditions that can be applied to a wide range of service sectors: (1) environmental conditions, comprised of intangible elements, such as temperature, lighting, smell and sound [5,10,60,62,64,65,66]; (2) conditions of cleanliness, defined as the existence of cleanliness, including the absence of odors, dust and stains [10,57,59,60,62,63,64,65,66]; and (3) conditions of design, including functional or aesthetic elements, and aspects such as architectural design, materials and colors used in the decoration, arrangement of equipment and furnishings, and the spatial layout among them [1,5,10,11,57,59,60,62,63,65,66].

2.4. Social Quality

Social quality refers to the social obligations manifested in the delivery of a service to the customer [53,67]. While this is a commonly accepted definition, the nature and scope of these obligations are vague and lack consensus [33,68].
One seminal thread, following Carroll [69], holds that a company’s social initiatives and obligations are associated with philanthropic, ethical, economic and legal responsibilities [33,67]. However, the same author [70], and subsequently, other researchers [33] have demonstrated the limitations of this proposal, alleging that some of these dimensions cannot easily be differentiated.
On the other hand, some authors expressly favor the theory of sustainable development to justify considering three components: economic, environmental and social [71]. In this model the environmental dimension is already highlighted. However, this proposal mainly focuses on productive contexts, meaning that these forms of definition and measurement are more appropriate for studies in sectors with a greater environmental impact, and are not so easily applied in the service sector in general, and the financial sector in particular [2,18].
In an attempt to resolve the problems deriving from these two perspectives, the stakeholder approach appeared at the beginning of this century [26]. According to this proposal, social responsibility actions should ideally be defined based on the stakeholder, who benefits more from them [2,18]. On this premise, on the one hand some authors [67,68] defend that firms only have to be concerned about firm stakeholders (such as customers). On the other hand, others authors hold that this responsibility should extend to society as a whole [72]. Based on the stakeholder approach, and looking at its most sustainable aspect, this new social quality dimension can be said to cover the strategic search of environmental integrity, economic prosperity and social justice for both the firm and its main stakeholders [32,73,74]; namely, the customer and society. We, therefore, adopt a conciliatory position in this study by considering both types of initiative: those conceived mainly to benefit customers, and those designed to provide greater benefits for society as a whole [75].
On the one hand, social quality focuses on the firm’s central stakeholder––the customer––and is expressed through a relational orientation in the service designed to implement initiatives providing benefits and assistance that are grounded on customers’ needs, understood in a broad sense that goes beyond the strictly commercial [5,28,29,76]. Deshpande et al. stressed that the determining characteristic of firms with a customer relationship orientation lies in adopting an organizational culture in which a “set of beliefs puts customer interests first” [77] (p. 27).
On the other hand, social quality covers initiatives related to the environment [78] and society as a whole [79]. Environmental social activities include preventing pollution, saving energy and providing environmentally friendly services. Societal activities include philanthropy, contributions to public welfare, community outreach and development, promoting culture and sustainable development. The central value in all these social quality categories is to do what is right and fair, rather than simply pursuing the profit motive [21].
In summary, with regard to both stakeholders––the customer and the environment––the firm aspires to satisfy the needs of its present customers, but without affecting its capacity to serve them in the future, which in operational terms reflects a high level of commitment to promoting its economic and social progress, while at the same time respecting its environment [80,81].

3. Service Quality and Loyalty in a Negative Context

Loyalty may be considered as the committed intention of the client to carry on an existing relationship with the firm, essentially manifested in repeat purchase behavior in spite of any circumstantial marketing actions and influences from competitors [82]. Loyalty is, therefore, related to the likelihood that the customer will generate positive word-of-mouth and have repurchasing intentions [5,83].
In a services sector, such as banking, creating a positive service experience grounded on different facets of quality leads to a reduction in the perception of the risk associated with the result of the service, and increases customers’ barriers to other offers from competitors. In consequence, it contributes to maintain customer loyalty to the firm in the short, medium and long term by strengthening the idea that opportunism is not the reason on which the relationship between the parties has been generated [3,6,13]. Service quality elements are, therefore, crucial in exchange situations and can be considered influential factors in the likelihood that the customer will repurchase or reuse a service, and recommend the firm to others (3). Therefore, taking a general perspective we propose that:
HG: Service quality perceived by customer positively influences loyalty.
Starting from this general overall assumption, it is important to take into account that the perception of the service quality offered by banks and its effect on loyalty is not only determined by the firm’s positive intentions, but also on its ability to implement these promises and intentions effectively [13,24]. Thus, following a period of steady worsening in the strength of the relational link between banks and clients, in which many assets have been removed (closed branches, staff restructuring, mergers, obligatory use of ATMs for some operations, etc.), and the honesty of many of the main entities of the sector has been questioned (reduced availability of loans and mortgages, commissions and abusive clauses) and a loss of benevolence (obstructing dation in payment, evictions, etc.), an in-depth analysis of the particular effects on loyalty of service quality variables is an urgent challenge for scholars and managers [3,65]. In this vein, and considering the four service quality variables identified in this study (outcome, personnel, servicescape and social qualities), the following sections explore the hypotheses derived from the general proposal.

3.1. Outcome Quality and Loyalty

The variable outcome quality is not bound to the market context, and regardless of whether the market is more stable or more turbulent, all customers base their future relationship with the firm on one minimum condition: that the product or service is of optimal quality [3]. The implication of this premise is that outcome quality is seen as the central quality of the service. Specifically, outcome quality will be linked to the conditions of service, product, price and access.
Regarding the first of these conditions, namely service, Amin and Isa [84] noted that client positive relational experience in the financial sector depends on the efficiency of service provision, which should fall within suitable limits of what customers want and what they perceive as adequate. When these conditions of service are met, certain internal barriers to change are generated in customers. Then they see their relational bond with the bank as sustainable over time [83].
Turning to conditions of the product, the more extensive the portfolio offered, the greater the opportunities to offer packages of services tailored to the customer’s individual needs [85,86,87], which has positive repercussions in their relational behavior with the bank [10].
As for conditions of price, although they are relevant to customers’ overall satisfaction, they seem to take on greater importance in the case of services, since they are understood to be a clear indication of intrinsic quality [6,11]. In the banking sector, where price structuring is complex and difficult to understand, transparency and fairness in setting prices favors the development of positive feelings towards the service provider [10,85,88], which in turn evolve into behavioral intentions and then impact customer loyalty [6,89].
Finally, regarding conditions of access, Amin and Isa [84] found a direct impact on customer satisfaction from the speed of commercial transactions in the banking sector. Onkvisit and Shaw [90] consider services to be “time dependent” and “time important.” If a service is delivered efficiently and quickly, it will meet or even go beyond the customer’s expectations, leading to long-lasting relational bonds between the provider of the service and the client [13]. Therefore:
Hypothesis 1 (H1).
Outcome quality perceived by the customer positively influences loyalty.

3.2. Personnel Quality and Loyalty

There is a widespread consensus in the traditional literature on the importance of employees’ attitudes, behaviors and skills in shaping customers’ evaluations of service quality [13,27,55]. However, this influence––determined by the conditions of image, techniques, reliability and empathy––has usually been analyzed in positive relational contexts.
It has traditionally been held that personnel appearance transmits a hidden information to customers [91], thus helping them form judgments about the service before and after it has been consumed. As a result, an attractive physical demeanor conveyed through smart clothing and good personal grooming will improve customer satisfaction, retention and loyalty [92,93].
With regard to technical conditions, authors such as Hill et al. [94] and Berry and Parasuraman [95] found these to be the most relevant criteria identified by customers in returning to service providers, since the intangibility associated with the services delivered heightens customers’ dependence on personnel to solve their problems [1,86,87,88,96].
Confidence is conditional, being linked to the projection of credibility by the service provider, which is designed to influence customers’ attitudes and purchase intentions [1,97].
Conditions of empathy have been associated with employees’ emotional competence in personalizing and putting themselves ‘in the customer’s shoes’ as a successful antecedent to this relationship [11,12,98]. Empathetic employees express familiarity with the personal situation of clients, make them feel recognized and treat them as individuals [43], thereby developing the mutual trust essential to strengthening relationships built over time with the customer [11].
In light of these assumptions, Monferrer et al. [3] and Monserrat [99] recently questioned the sign with which these influences would occur in a turbulent market context that has negative connotations for the relationship. The notion underlying the arguments in the traditional literature is that consolidation of the customer-firm relationship should be grounded on the customer’s acceptance that when the employee attempts to sell the bank’s products, he or she is also serving the interests of the bank, so long as it is conducted in a way that is personalized, responsible, professional and honest [3,10,100]. However, the present post-crisis context could jeopardize perceptions of employees’ honesty, since customers’ recent experiences during the crisis may have lead them to consider that the genuine concern of bank staff to provide the service in recent years––in principle oriented to satisfy their interests [88,98]––has actually brought about a profound economic and social crisis with marked negative consequences that directly affect the large majority of customers to a one extent or another.
This assertion falls in line with the works of Lee et al. [101], Moschis [102], Obal and Kunz [103] and Wang [104]. These authors argue that the thoughts and actions of consumers can vary according to their life circumstances. These circumstances include events occurring in the physical and social environment experienced during a relatively long period (period effect), such as periods of economic prosperity or crisis. These events will, therefore, affect a person’s mentality and their usual behavior and consumption patterns. The long-standing abusive practices implemented by financial institutions (abusive fees, sale of preferred stock, etc.) challenged the credibility of the whole sector, and, therefore, of its employees. The customer, who it should be remembered suffered greatly during this period (evictions, unemployment, a paralyzed credit system, frozen salaries, etc.), sought a scapegoat to blame for all their ills, and found it in the banking system, and hence, its employees. Indeed, it is an innate condition of human nature to personify the causes associated with one’s individual problems. For this reason we might suppose that, in the current post-crisis climate, customers may be suspicious and mistrustful of personnel quality as a result of recent events, to the point that its relational effect is reversed. We, therefore, propose that:
Hypothesis 2 (H2).
Personnel quality perceived by the customer negatively influences loyalty.

3.3. Servicescape Quality and Loyalty

Servicescape has always been associated with the analysis of its impact on purchasing behavior [1,60,66] and with establishing a long-term relational link between the client and the firm [62]. When customers visit commercial premises, the setting is the first aspect of the service they perceive and in this initial moment they build an impression of the service quality they will receive [66].
First, elements of the environmental conditions, such as sound, are not only able to stimulate emotions and moods during the service delivery [105], but can also induce purchasing behavior [1,62]. A pleasant aroma also invites customers to spend more time on the premises and may also modify their purchasing behavior [1,62].
Regarding conditions of cleanliness, customers are aware that optimal levels of hygiene and cleanliness are easy to control and inexpensive to maintain, and if these standards are not strictly met they constitute one of the most serious service deficiencies reported by customers [1,65,66,106].
Finally, design conditions, including the materials used in the construction, artwork, floor coverings and technological aspects are an implicit element of communication that customers use as ‘informational clues’ to the norms of appropriate behavior in the service delivery setting and the levels of service they should expect to receive [3,5,10,27,62,65,66,92]. In the banking context these conditions have an additional function related to the confidentiality the setting affords, which is central to the customer’s perception of privacy [84].
In summary, the common thread running through the literature on the relational effects of servicescape quality is that while it is a necessary factor, it is not sufficient to generate relational behaviors. In other words, if the environmental conditions are considered to be satisfactory they will not directly motivate purchase, but if they do not meet the acceptable standards they will have a negative effect on customer behavior [107]. This aspect is, therefore, central to understanding the effects of servicescape quality in negative relational contexts. As argued earlier in the paper, in such contexts, customers focus their demands on basic service quality dimensions, such as outcome quality, and place relatively less importance on other complementary dimensions like servicescape quality. Thus, as a result of the crisis, customers’ behavior patterns may have been affected by a change in their mentality [101,102,103,104], making them more cognitive, more practical and outcome-driven, more focused on what they are being offered (interest rate, investment security, etc.) and pushing into the background certain elements of service quality that were previously determinant in the evaluation of relationship quality in the economic boom period. In this study we, therefore, propose that the effects of servicescape quality and loyalty will not be significant if a direct causal relationship is considered, although their presence will be relevant when their effect is considered in combination with the other quality dimensions in predictions scenarios. Our next hypothesis is therefore:
Hypothesis 3 (H3).
Servicescape quality perceived by customer has no direct impact on loyalty.

3.4. Social Quality and Loyalty

The relationship between firms’ socially, ethically and sustainably responsible initiatives and customer behavior has been the subject of ongoing debate in recent years. While some studies find this is not always a direct relationship and that it is only understood to have a marginal effect [33,53,108], there seems to be a wider consensus on the positive effects that firms’ social and sustainable programs have on relationship quality [5,18,22,28,29,32,109,110,111].
The present study proposes that, regardless of the central role of outcome quality, the positive role of social quality will be considerably strengthened in this new context of analysis, compared to the other complementary qualities. Thus, following an emotionally negative period, such as that of the recent crisis––which has had serious social consequences and caused widespread negative public opinion about the banking sector in particular––social, ethical and sustainable activities instigated by banks should be rewarded by their customers through improved relational behaviors and attitudes [18,22,32,35].
In terms of customer quality, Boles et al. [109] suggest that the dominant culture in organizations with a high positive orientation to relational services is based on a clearly proactive concern for the customer. For this to materialize, firms must understand their function in relation to the customer without focusing strictly on the clearly commercial perspective [28,29,76]. Today’s customer is an emotional being with a sharp awareness of sustainability and social issues. This obliges firms to nurture their relationships with customers not only by offering them a specific service, optimally and commercially tailored to their particular needs, but by also paying close attention to the form and the context in which this service is delivered. This helps to increase the benefits customers receive through a high level of service quality, and significantly contributes to fostering their positive relational attitudes [5,110].
Turning to societal quality, some studies have demonstrated the influence of social actions in advancing sustainable development, such as corporate donations to social causes, participation in community activities, sponsoring local social and cultural events or concern for the environment, finding a positive effect on consumers’ appraisals and contingent effects on their purchasing intentions [21,22,67,111,112]. Therefore:
Hypothesis 4 (H4).
Social quality perceived by customer positively influences loyalty.
The model of effects derived from this theoretical development is shown in Figure 1.

4. Method

4.1. Sampling and Data Collection

The researchers signed a collaboration agreement with one of the top five Spanish financial entities in terms of resources according to Moody’s international rating agency. Thanks to this agreement, interviews with clients from the branches of four different Spanish territories could be carried out: Baleares, Murcia, Valencia and Catalonia.
At the end of 2015 a pretest was carried out on the designed questionnaire, which was reviewed in a double sample composed of 25 clients, and 10 experts from the banking sector. Thanks to this, the wording of certain indicators was modified, ensuring a correct final design (in form, structure and length) and understanding. The final version of the questionnaire was used by a group of hired researchers to interview clients between January and March 2016. As recommended by Hox [113], Kish’s intraclass correlation coefficient (ICC) was used to verify the absence of a significant influence from the interviewer that could affect the results obtained [114]. The values obtained in the ICC, close to 0.031, correspond to what was agreed in the literature for personal interviews [115,116].
Only regular clients were interviewed while they were waiting to be served at branches. Specifically, a total of 5 clients were interviewed for each one of the branches. The result was a final sample of 1524 clients from a total of 305 branches (43.27% of the total existing branches in the analyzed territories). In order to ensure the correct interpretation of the questionnaire, the interview was chosen instead of self-completion.

4.2. Measurement Instruments

We followed the recommendations of Ye et al., [117] in the questionnaire design, to counteract “self-generated validity”. For this, an understandable vocabulary for the interviewees was used, and a thorough structuring of the questions was carried out, guaranteeing that the variables studied were not presented in the same order as the contemplated in the hypothesis proposal (antecedents → consequence). Moreover the back-translation method [118] was followed in order to ensure a rigorous translation of the items from English into Spanish.
All the scales considered to measure the four types of service quality (outcome, personnel, servicescape and social qualities) correspond exactly to their conceptualizations. We used adaptations of attitudinal five-point Likert measurement instruments (1 represented completely disagree, and 5 completely agree) that had been previously tested by other authors, adapted to the banking sector and from a branch level. The same applies to the attitudinal loyalty construct.
Table 1 Includes the sources of the scales employed in this research, which are presented in Table 2.

5. Results

Compared to the maximum-likelihood approach of SEM (ML-SEM) [122], partial least squares (PLS) methodology is a recent relevant alternative to structural equation modeling. Hair et al. [40] and Squillacciotti [123] highlight the considerable advantages of this methodology: (1) PLS overcomes the limitations of structural equation modeling (SEM) caused by the assumption that all the units on which the model is estimated are homogenous, a false assumption in many cases; (2) PLS is preferable to ML-SEM as it is a more robust method with fewer identification problems; (3) these conditions are even more important when a small sample is used, when data are not multinormal and when the complexity of the model can lead to non-convergent results; (4) PLS overcomes the limitations of ML-SEM in statistical comparison tests; (5) PLS is the most suitable method when the purpose of the study is to predict key constructs and when latent variable scores must be used. In light of the above, in marketing studies where data are highly multinormal, PLS is the most appropriate technique, since it allows scores to be calculated for the latent variables which serve as indexes for the latent construct [123].
In our study, we followed Shmueli et al.’s guide [124] based on the methodological contributions from predictive PLS to combine partial least squares (PLS) and fuzzy-set qualitative comparative analysis (fsQCA). First, Gigerenzer and Brighton [125] reported that a good fit from a PLS model (R2) does not necessarily mean the model will predict well, and even the best fit of R2 will possibly present a poor prediction. A second step is, therefore, necessary: to examine the significant paths for the outcome variables from the PLS result using fuzzy-set qualitative comparative analysis (fsQCA), given the importance of testing for causal asymmetry [126]. To this end, we used a cross-validation of the divided sample with the estimated model to predict the scores of the two parts of the sample (formative and holdout sample) to confirm predict validity. Additionally, we used fsQCA in the current study to extend knowledge about different configurations of conditions (composites of service quality) that predict the outcome (loyalty); in this case we tested presence/absence of loyalty and also the differences between the levels of loyalty (high/low). Third, we used out-of-sample measures of predictive analytics: root mean squared error (RMSE) and mean absolute error (MAE), aggregating in this way case-wise prediction errors from a set of out-of-sample data to benchmark the predictive quality of the configurations detected in the previous step.

5.1. Validity of the Measurement Model

PLS path models differentiate between two methods of construction measurement: a composite model and a factor model [127]. The composite model places no restrictions on the covariances between the items of the same factor, and therefore, the covariation between a set of items is not determined by a common variable. In contrast, in the factor model the variance of a set of items is determined because there is a latent factor (the common variable) and a particular random error. PLS can also differentiate when measuring formative and reflective measurement models; we, therefore, used a composite model with reflective indicators.
We performed the study of the results of the proposed model centering on variance (PLS) with SmartPLS 3.0 [128], hence we first considered the measurement model, and second, the structural model. We used five criteria to analyze the measurement model. First, we checked individual reliability (IR) for each factor, loading associated with its respective construct [129], where the threshold was 0.707 [130], and used a bootstrap resampling procedure. Second, we assessed internal consistency through Cronbach’s alpha, with a threshold of 0.7 [40]. Third, we tested composite reliability (CR), for which the threshold was 0.7 [131]. Fourth, we confirmed convergent validity, with a threshold average variance extracted (AVE) of 0.5 [132]. According to Hair et al. [133] some factor loadings between 0.600 and 0.707 are considered acceptable because they do not assume a decrease in the suggested AVE threshold. Table 2 reports the values of individual reliability, AVE and composite reliability.
For the fifth criterion, results for discriminant validity tested using the heterotrait–monotrait (HTMT) ratio in the measurement model, a new indicator for assessing in PLS [134], are reported in Table 3. Although two of the values were above 0.9, we verified that, in all cases, none of the upper confidence intervals were beyond 1.

5.2. Structural Model Hypotheses Test with PLS

We performed a nonparametric bootstrap resampling procedure using SmartPLS to evaluate the structural model, confirming all the hypotheses proposed (Table 4). Path coefficients related to H1 and H4 are statistically significant and positive at the 95% confidence level according to the t-test and the confidence intervals, since they do not include the value zero [135]. The path coefficient related to H2 was also significant, but reflected a direct negative effect of personnel quality on loyalty. In turn, the direct causal influence of servicescape quality on loyalty (H3) was not significant. We evaluated the predictive power of the structural model by the R2 of the dependent factors (loyalty) and the SRMR indicator. Both presented adequate values above 0.6 and below 0.08, respectively [136].

5.3. Test Using a Fuzzy-Set Qualitative Comparative Analysis (fsQCA)

We used qualitative comparative analysis (QCA) to complete the data analysis because this theoretical method with sets, explicitly conceptualizes cases as configurations of specific attributes [137]. The application of QCA, and particularly fsQCA, is a relatively new approach in the social sciences and has currently become very popular in management and business research [138], as it contemplates both quantitative (oriented to variables) and qualitative (oriented to cases) strategies. While regression-based analyses or structural equation models only provide a single solution to achieve a result, QCA aims to find combinations of necessary and/or sufficient conditions that lead to a specific result [139,140]. This is because other regression-based statistical techniques, such as SEM or multiple regression tests, assume causal symmetry, uniformity, linearity and additive effects [126,139]. However, these assumptions are relaxed in QCA, and fsQCA has at least four advantages over regression-based methods [141]; namely: (a) equifinality—a particular result can be obtained from various combinations of terms; (b) multifinality—similar combinations of terms can lead to distinct results; (c) asymmetric causality—a combination of terms determined as an definition for a particular result which is not the logical opposite of the combination for the absence of this result; (d) and conjunctural causality—a combination of terms rather than a single term may be sufficient or necessary to obtain a particular result.
In fsQCA, we transformed the raw data into established membership scores that varied between 0 and 1 (fuzzy fixed values) and then calibrated the data to construct the truth table (see Table 5). Next, we performed the standard analysis.
We determined the fsQCA fit with two main measures. Coverage index and coefficient of determination, and consistency index and a correlation, are respectively analogous [126]. The consistency index is sufficient to achieve the outcome when the result is equal or higher than 0.75. In addition, we calculated the values of consistency for each configuration and two further indicators. When raw coverage is between 0.25 and 0.65, then sufficiency conditions or combinations are adequate [142]. When the unique coverage of each combination is greater than 0, this solution helps to explain the result, otherwise it should be removed [143]. We use these criteria in Table 6, Table 7 and Table 8.
Following Shmueli et al.,’s guide [124], first we analyzed the predictive validity of the PLS model, and second, we checked asymmetric causality by fsQCA (a combination of terms determined for a particular result that is not the logical opposite of the combination for the absence of this result). The concept of asymmetric causality determines that equifinality may vary according to a result’s levels; as one changes across result levels, distinct sets of other effective configurations could be found [144]. Table 6 shows the configurations found from a holdout sample of the questionnaires with odd numbers versus those with even numbers.
The findings obtained up to this point reveal different configurations to achieve loyalty (A, B, C, D and E). However, only three configurations (A, B and E) coincide with the configurations of the two samples. Notably, one of them (E: F1*~F2*~F3*~F4) contains all the factors or dimensions of the construct service quality, which implies the predictive validity of the model estimated with SmartPLS. The properties of fsQCA analysis (conjunctural causation, equifinality, etc.) allow us to affirm some assumptions of PLS, such as unifinality, additive effects, linearity and causal symmetry [126,139].
Woodside [126] interpreted visualizations of findings. As can be seen in Figure 2 the XY plot for the model of membership in the result (Y) and the bottom right quarter of the plot is almost empty. These circumstances, even though they do not indicate a necessary requirement for loyalty, surpass sufficiency.
Once the predictive validity had been verified, we studied the configurations of the presence or absence of loyalty for the entire data sample in order to generalize the research results. Table 7 shows four configurations that determine the presence of loyalty in banks; only good complex solutions according to Table 6 (prediction validity) are denoted in gray. Although two of these configurations determine the absence of loyalty, raw coverages are not between 0.25 and 0.65 [142], so we cannot consider them as predictor configurations.
The final advantage offered by the fsQCA technique is presented in Table 8, which compares cases of high loyalty (mean values > 3) and cases of low loyalty (mean values < 3). Table 8 shows that levels of service quality variables result from different configurations of factors usually cited as relevant antecedents of loyalty. While the symmetric logic underlying multiple regression models assumes a “more of x implies more/less of y and vice versa” relationship between an outcome and its predictors, the configurational logic adopted in this research shows that the relationship between a factor and an outcome can be more subtle. Hence, different levels in a predictor variable can lead to the same outcome if present in specific configurations. Such findings endorse the concept of equifinality, whereby “a system can reach the same final state from different initial conditions and by a variety of different paths” [145] (p. 30).
Although a new configuration F was found for the prediction of high loyalty, and configuration G for the prediction of low loyalty, according to Table 6, configurations F and G are not recognized as predicting the validity of the PLS structural model; only good complex solutions are, therefore, denoted in gray. That is: configuration E for the prediction of high loyalty, that collects all the factors or dimensions of quality; and configuration A to predict low loyalty.
Table 9 summarizes the results from the previous sequential process associated with Table 6 and Table 7 (validity configurations) and 8 (dimensions that predict high or low loyalty). We report the configurations with necessary and sufficient conditions (marked in gray) because the degrees of membership in a set are established with the purpose of analyzing the data in the conditions of belonging to this set [140]. The most important configuration resulting in high loyalty is a unique configuration, labeled E, with all dimensions. High loyalty requires high membership in servicescape quality (F1) and the presence, even if it is low, of a low membership in the rest of the dimensions: personal quality (F2), outcome quality (F3) and social quality (F4). However, low loyalty based on configuration A requires high membership in two dimensions: outcome quality (F3) and social quality (F4).

5.4. Prediction for the manifest variable (MV) of SmartPLS: Quality Prediction

Additionally, we propose the contributions of the methodology from PLS models according to the guide in [124]. We first obtained a good fit (R2 and SRMR), and second, we used a cross-validation of the divided sample with the estimated model to predict the scores of the two parts of the sample (Table 6). Third, we concluded with out-of-sample measures in predictive analytics: root mean squared error (RMSE) and mean absolute error (MAE) in which case-wise prediction errors were aggregated from a set of out-of-sample data (Table 10).
A comparison of the predictive quality of the different models shows that the model with the lowest RMSE has the highest predictive quality. There are no acceptable scores or thresholds for these values. MAE and the RMSE produces absolute values. RMSE is too conservative and another is too liberal. The results indicate the following order of quality predictions: configurations A, E and B. SmartPLS also indicates predictive capability of the model by Geisser’s Stone-Q2 [146]. According to [135], all of values of the cross-validation (CV-redundancy) are greater than the threshold (zero).

6. Discussion

The main purpose of this study was to analyze the explanatory power of service quality for predicting customer loyalty in the banking industry context, the sector that was most deeply and directly impacted by the recent economic crisis, with serious consequences for its customer relations. For this reason, at a key moment in which firms are recovering their competitive capacity in a sector characterized by great similarity across its services [6,13], identifying the factors that determine the continuation of satisfactory and long-lasting relationships with customers has spawned great interest in both the academic community and managerial circles [3,4,5,7,10,13,14,23,24,25]. In this line of inquiry, the use of traditional structural equation models (ML-SEM) to estimate and explain loyalty establishes causal relationships among variables, but is limited when latent variables are used. These limitations can be overcome with prediction-oriented modeling (PLS), enriching the interpretation of results. In the present study we were able to incorporate a large amount of information into the model by considering four main dimensions associated with service quality (servicescape, personnel, outcome and social) conceptualized through the elements associated with them in the literature. To this end, two prediction-oriented methodologies––partial least squares (PLS) and qualitative comparative analysis (QCA)––were combined, yielding different configurations of the service quality dimensions that determine different customer loyalty scenarios, which enabled us to analyze the power, validity and quality of the predictions, following guidelines in [124].
The paper’s first conclusion is the confirmation of the implicit hypothesis of the direct relationship between service quality and customer loyalty using prediction-oriented modeling (PLS). In the proposed model, service quality accounts for 61% of the variance of customer loyalty. These results demonstrate that high levels of service quality project high customer loyalty, and low levels of service quality project low customer loyalty. Although this is not a new general conclusion [3,13,25], the novelty of the study lies in the use of holdout samples and the focus on the predictive validity of service quality when its different dimensions are taken into account.
The second conclusion drawn is that when we explored the direct effects on loyalty of each of the four dimensions, we find that in a post-crisis context, such as the present, two service quality variables are central to determining customer loyalty: outcome quality and social quality.
On the one hand, we found that outcome quality (directly associated with the service provided to the customer) is the only one of the three traditionally used service qualities (outcome, servicescape and personnel) that influences loyalty. This finding allows us to confirm that negative relational contexts––exemplified by the present situation following the damaging effects of the profound economic and financial crisis on the public’s opinion of the financial sector––considerably alter the behavioral determinants of banks’ customers, who now place much more importance on the outcomes of the service they receive [3]. Today’s customers pay attention to the efficiency with which the bank provides its services, modifying the role of servicescape quality and personnel quality, which are related to elements that complement the main services provided by the bank but no longer have a positive direct influence on customer loyalty in this context.
The result for the effect of personnel quality on loyalty, now shown to be negative, is particularly important. In line with the findings of Monferrer et al. [3] and Bennett and Kottasz [147], negative emotions tend to characterize individuals’ perceptions of the way financial sector personnel behave during a crisis period. Thus, in negative relational contexts, customers tend to personify the problem and channel their negative emotions through specific individuals. These emotions result in negative and biased judgments that help to generate negative stereotypes of bank personnel to the point that, in the wake of recent events, they may even regard employees’ greater capacities as suspicious or untrustworthy, thus weakening the relational bond.
These results tie in with the postulate of the life-course paradigm; namely, in the way that consumers’ behaviors and attitudes will vary depending on their life experiences [3,147]. Variables from the social or physical environment experienced over specific periods, which may be periods of prosperity or economic crisis, are included among these conditions [101,104]. There is no doubt that the global crisis affected consumers’ attitudes and behaviors. Indeed, authors such as [147] anticipated a substantial change in public attitudes to financial institutions following the crisis. The present study sheds some light on the specific form this change has taken.
On the other hand, the direct effect of social quality on loyalty was verified, allowing us to surmise that in the current context where deep emotional scars are still raw, customers expressly reward firms with a social, ethical and sustainable commitments—not only to their customers, but to society at large. This finding has far-reaching implications for scholarship and business [2,5,18]. In the academic context, it confirms that social quality should be considered as an additional element associated with service quality––traditionally defined in terms of the three other qualities considered in this study––but which has only recently attracted academic attention, particularly in terms of the services sector [18,19,21,22,28,29,32]. From the managerial perspective, this finding lends empirical support to the social, ethical and sustainable strategies and actions recently undertaken by the banking sector to the extent that it is now one of the most proactive industries in this field [18,30,31,32,34,35,36,37,38].
Society itself is now conscious of the intermediary role that financial services can play by either encouraging or hampering the (non-)sustainable behaviors of governments, firms and individuals, and may even help to bring about structural changes in society [30,32]. This means that given its direct or indirect impacts, the bank plays a crucial role in meeting sustainable development targets by increasingly tackling social and environmental challenges and participating in numerous sustainable practices [31,32,34]. We are entering a new era in which the customer, aware of these shifts, regards banking as a “transformative service” [148], and makes demands of and rewards banks that take a clearly committed position.
In line with this idea, banks should strive to introduce substantive strategies that help move toward the United Nations’ Sustainable Development Goals, and should aim to have a real impact in the social commitments linked to their own environment. Customers’ perceptions of this responsible business awareness demonstrated through the bank’s activities will help to strengthen the relationship between the two parties [18,35].
These results are grounded in the micro-level analysis approach focused on the customers’ perception. This approach complements the macro-level and organizational perspective approach of recent studies that have shown the positive influence of specific practices, such as impact investing [149,150], environmental credit risk management [151,152] and sustainable project finance [153] on variables like reputation [36] or banks’ results [37,38,154].
In general terms, our study makes a significant contribution to the specific implications of each dimension by examining them together and holistically. The paper, therefore, responds to the limitations recently noted in the literature regarding the possible biases in results from studies that examine each quality individually and in isolation [3,5,33]. These studies present an incomplete picture of customers’ overall evaluations of the service, thus highlighting the need to consider simultaneously, all the elements of quality that customer service delivery implies, as the present study set out to do.
In addition to these contributions from our analysis of the direct effects analyzed, the use of prediction techniques substantially enriched the study through other complementary techniques. A third conclusion, therefore, concerns the various configurations of service quality that predict loyalty yielded by the QCA technique.
First, the configuration with outcome quality and social quality (labeled A in the QCA tables) allowed a low customer loyalty scenario to be projected. Both these dimensions are, therefore, necessary and sufficient conditions to confirm low-intensity loyalty, or in other words, when those two service quality dimensions exist, the servicescape and personnel quality dimensions do not determine a prediction of loyalty, since its intensity is low. These results coincide with those arising from the comparison of direct effects, showing that for more conservative customers, commercial conditions associated with outcome and social qualities must be strengthened in combination to guaranteed minimum levels of loyalty.
The second identifier allowed us to predict customer loyalty with all the dimensions of service quality (labeled E in the QCA tables). Thus, the necessary and sufficient condition to attain high intensity loyalty is a combination of the four service quality dimensions, where in addition, a significant number of customers affirm that the main causal influence derives from servicescape quality. On that point, although the relationship between servicespace and loyalty was not significant in the single linear solution for the total sample in a structural model estimated with SmartPLS, this dimension is crucial in combination with the rest of the dimensions to achieve a high level of loyalty when the fuzzy-QCA technique is used. In summary, customers who most value outcome quality, social quality, servicescape quality and personnel quality are those that demonstrate the highest levels of loyalty to their bank branch.
These results are central to a comprehensive understanding of how each quality contributes to determining customer loyalty. Although in the market context analyzed, only outcome quality and social quality show direct effects on loyalty, the role of the other two complementary qualities is also relevant, since the combined presence of the four service quality dimensions improves the capability to predict high levels of customer loyalty. The results, therefore, point to outcome quality as a central determinant in the service offered to the client, together with the new social quality that has appeared in the current relational context. Servicescape and personnel qualities act to strengthen the predictive capacity of the two other qualities. This is related to the assumptions put forward by Monferrer et al. [3], who advocate differentiating between two service quality typologies: those associated with ‘what’ (is offered) and those with ‘how’ (it is offered). On this basis, banks should not sacrifice personnel and servicescape quality for the sake of maximizing profitability. Although, following the recent crisis, customers now prioritize the most essential aspects of service quality, this should not be used as a reason to cut back on quality in the bank’s facilities, staff professionalism and training, and so on, as this will have serious repercussions on customers’ final perceptions of the bank’s quality, and by extension, on its endeavors to strengthen high customer loyalty.
Furthermore, given the importance customers attribute to finance companies’ social, ethical and sustainable behaviors, banks could improve and strengthen their customers’ perceptions of their other service qualities––especially those affecting servicescape and personnel qualities––by ensuring they embody this awareness of responsibilities. Authors such as Pérez and Rodríguez [18], Chen [22] and Williams and Adams [28] show that efforts to provide a socially responsible, ethical and sustainable service should affect all the company’s areas of interest, and that it is the responsibility of management to make sure this is the case. Along those lines, interest in the sustainability of banks must be grounded in a determined, credible business philosophy that is extended, as far as possible, to all other service qualities. In the case of outcome quality, for example, this would involve setting sustainable prices, removing the abusive clauses banks have imposed in recent contexts, offering green credit funds, or working with suppliers that adhere to social, ethical and sustainable principles [3,155]. As regards servicescape, actions would include using environmentally clean and efficient lighting on the premises; controlling noise and temperature; installing sustainable furniture and infrastructure that is accessible for people with disabilities; or resource preservation [22,32]. Finally, with regard to personnel quality, this new form of management requires investment in new professional profiles, along with retraining existing employees in ethics, and social and sustainable responsibility efforts, adopting selection criteria that combine quality criteria with gender equality and diversity criteria, guaranteeing a healthy work-life balance, and considering the possibility of encouraging employees to adopt certain internal, personal behaviors that exemplify social and sustainable awareness, such as using public transport and so forth [32,155].
Third, we found a configuration with servicescape quality, personnel quality and outcome quality (labeled B in the QCA tables) that, although it determines the validity of the prediction through the holdout sample, does not determine the prediction of high or low loyalty in the banking sector.
The above results show that as well as the contribution entailed by equifinality, the paper presents an additional innovation, as the service quality configurations predicting various customer loyalty scenarios are in congruence with the prediction that loyalty is present in the whole sample, as none of the configurations predict an absence of loyalty. This result allows us to confirm through QCA that there are no configurations of the service quality dimensions that do not lead us to predict loyalty, and only three configurations (A, E and B) with predictive validity allow loyalty to be predicted, of which configurations A and E are noteworthy; the former because it predicts low loyalty, and the latter because it predicts high loyalty. This reaffirms the importance of conceptualizing overall service quality because it is a necessary and sufficient condition to achieve customer loyalty.
In fact, when those three predictions are compared, the results show that configuration A has the best predictive quality, followed by E and then B. This result confirms that the two value dimensions (outcome quality and social quality) have a higher predictive quality when determining low loyalty among banks, compared to a general model of all the service quality dimensions that predicts loyalty. In consequence, and with very similar RMSE indexes, we can state that the differences in the predictive quality of each model depend on the different configurations of the four dimensions (outcome quality, personnel quality, servicescape quality and social quality) in QCA.
In conclusion, although the relationship between service quality and customer loyalty has previously been analyzed in the marketing literature using ML-SEM, prediction-oriented modeling offers a much deeper interpretation of the relationship and provides more robust conclusions.

7. Limitations and Further Research

The main limitation of this research is related to the sample, which covers a particular industry and country; we, therefore, propose the extension of the analysis to other territories and industries. Likewise, the study focuses on a single entity, thus precluding the incorporation of multi-group comparison techniques among entities, which would enhance the generalizability of the results.
Additional suggestions for future research include studies based on multi-agent approaches, undertaking combined analyses with dyads of a simultaneous, dual branch and customer view of the determining factors examined in the proposed model. Second, the predictive study described here, under linear effects, could be complemented by new studies that explore the possible direct interrelationship between the service quality dimensions considered. Finally, the overall view of service quality adopted in our study may be complemented by adopting a similar perspective on service quality: incorporating other variables into the model, such as satisfaction, trust, engagement or advocacy.

Author Contributions

Conceptualization, D.M., M.E. and M.A.M.; methodology, D.M. and J.R.S.; validation, D.M. and J.R.S.; formal analysis, J.R.S.; writing—original draft preparation, D.M., J.R.S., M.E. and M.A.M.; project administration, D.M. and M.A.M.; funding acquisition, D.M. and M.A.M.

Funding

This research was funded by Spanish Ministry of Economy and Competitiveness, grant number “ECO2013-47134-P” by the via the research project “La confianza del consumidor respecto a la calidad de la relación y la orientación al mercado de las entidades financieras: los efectos de la crisis.”

Conflicts of Interest

The authors declare no conflict of interest.

References

  1. Harris, L.C.; Ezeh, C. Servicescape and loyalty intentions: An empirical investigation. Eur. J. Mark. 2008, 42, 390–422. [Google Scholar] [CrossRef]
  2. Pérez, A.; Rodríguez, I. La imagen de la Responsabilidad Social Corporativa en un contexto de crisis económica. El caso del sector financiero en España. Universia Bus. Rev. 2012, 33, 14–29. [Google Scholar]
  3. Monferrer, D.; Estrada, M.; Fandos, J.C.; Moliner, M.A.; Sánchez, J. Service quality in bank during an economic crisis. Int. J. Bank Mark. 2016, 34, 235–259. [Google Scholar] [CrossRef]
  4. Moliner, M.A.; Fandos, J.C.; Estrada, M.; Monferrer, D. Younger and older trust in a crisis situation. Int. J. Bank Mark. 2018, 36, 456–481. [Google Scholar] [CrossRef]
  5. Ha, H.-Y.; Akamavi, R.K.; Kitchen, P.J.; Janda, S. Exploring key antecedents of purchase intentions within different services. J. Serv. Mark. 2014, 28, 595–606. [Google Scholar] [CrossRef]
  6. Kaura, V.; Prasad, C.S.D.; Sharma, S. Service quality, service convenience, price and fairness, customer loyalty, and the mediating role of customer satisfaction. Int. J. Bank Mark. 2015, 33, 404–422. [Google Scholar] [CrossRef]
  7. Estrada, M.; Monferrer, D.; Moliner, M.A. Improving relationship quality during the crisis. Serv. Ind. J. 2019, in press. [Google Scholar]
  8. Pritchard, M.P.; Havitz, M.E.; Howard, D.R. Analyzing the Commitment-Loyalty Link in Service Contexts. J. Acad. Mark. Sci. 1999, 27, 333–348. [Google Scholar] [CrossRef]
  9. Paparoidamis, N.G.; Caceres, R.C. Service quality, relationship satisfaction, trust, commitment and business-to-business loyalty. Eur. J. Mark. 2007, 41, 836–867. [Google Scholar]
  10. Strandberg, C.; Wahlberg, O.; Öhman, P. Challenges in serving the mass affluent segment: Bank customer perceptions of service quality. Manag. Serv. Qual. Int. J. 2012, 22, 359–385. [Google Scholar] [CrossRef]
  11. Kaura, V. Antecedents of customer satisfaction: A study of Indian public and private sector banks. Int. J. Bank Mark. 2013, 31, 167–186. [Google Scholar] [CrossRef]
  12. Fatima, J.K.; Razzaque, M.A. Service quality and satisfaction in the banking sector. Int. J. Qual. Reliab. Manag. 2014, 31, 367–379. [Google Scholar] [CrossRef]
  13. Sayani, H. Customer satisfaction and loyalty in the United Arab Emirates banking industry. Int. J. Bank Mark. 2015, 33, 351–375. [Google Scholar] [CrossRef]
  14. Moliner, M.A.; Monferrer-Tirado, D.; Estrada-Guillén, M.; Monferrer, D.; Estrada, M. Consequences of customer engagement and customer self-brand connection. J. Serv. Mark. 2018, 32, 387–399. [Google Scholar] [CrossRef]
  15. CIS 2013, GRADO de Confianza en las Instituciones y Grupos Sociales: Los Bancos. Available online: http://datosbd.cis.es/ciswebconsultas/serieFichaView.htm?idSerie=A102060070&from=serieList (accessed on 5 December 2013).
  16. Edelman 2015, Trust Barometer. Available online: https://www.edelman.com/research/2015-edelman-trust-barometer (accessed on 20 August 2019).
  17. EMO Insights 2019, Estudio de las Emociones en Banca. Available online: https://emoinsights.com/wp-content/uploads/2019/04/190403_NdP_Emociones-en-Banca-2019.pdf (accessed on 20 August 2019).
  18. Pérez, A.; Rodríguez, I. The formation of customer CSR perceptions in the banking sector: The role of coherence, altruism, expertise and trustworthiness. Int. J. Bus. Soc. 2015, 16, 75–94. [Google Scholar] [CrossRef]
  19. Jones, P.; Hillier, D.; Confort, D. Sustainability in the hotel. Int. J. Contemp. Hosp. Manag. 2014, 26, 5–17. [Google Scholar] [CrossRef]
  20. Sanchis, J.R. La Banca Que Necesitamos; PUV Universidad de Valencia: Valencia, Spain, 2013. [Google Scholar]
  21. Liu, M.T.; Wong, I.A.; Shi, G.; Chu, R.; Brock, J.L. The impact of corporate social responsibility (CSR) performance and perceived brand quality on customer-based brand preference. J. Serv. Mark. 2014, 28, 181–194. [Google Scholar]
  22. Chen, R.J.C. From sustainability to customer loyalty: A case of full service hotels´guests. J. Retail. Consum. Serv. 2015, 22, 261–265. [Google Scholar] [CrossRef]
  23. Marinkovic, V.; Obradovic, V. Customers’ emotional reactions in the banking industry. Int. J. Bank Mark. 2015, 33, 243–260. [Google Scholar] [CrossRef]
  24. Zameer, H.; Tara, A.; Kausar, U.; Mohsin, A. Impact of service quality, corporate image and customer satisfaction towards customers’ perceived value in the banking sector in Pakistan. Int. J. Bank Mark. 2015, 33, 442–456. [Google Scholar] [CrossRef]
  25. Pansari, A.; Kumar, V. Customer engagement: The construct, antecedents, and consequences. J. Acad. Mark. Sci. 2017, 45, 294–311. [Google Scholar] [CrossRef]
  26. Decker, O.S. Corporate social responsibility and structural change in financial services. Manag. Audit. J. 2004, 19, 712–728. [Google Scholar] [CrossRef]
  27. Wang, H.; Kim, K.H.; Ko, E.; Liu, H. Relationship between service quality and customer equity in traditional markets. J. Bus. Res. 2016, 69, 3827–3834. [Google Scholar] [CrossRef]
  28. Williams, S.J.; Adams, C.A. Moral accounting? Employee disclousers from a satakeholder accountability perspective. Account. Audit Account. J. 2013, 26, 449–495. [Google Scholar]
  29. Martínez, P.; Pérez, A.; Del Bosque, I.R. CSR influence on hotel brand image and loyalty. Acad. Rev. Latinoam. Adm. 2014, 27, 267–283. [Google Scholar] [CrossRef]
  30. Louche, C.; Busch, T.; Crifo, P.; Marcus, A. Financial Markets and the Transition to a Low-Carbon Economy: Challenging the Dominant Logics. Organ. Environ. 2019, 32, 3–17. [Google Scholar] [CrossRef]
  31. Shrivastava, P.; Zsolnai, L.; Wasieleski, D.; Stafford-Smith, M.; Walker, T.; Weber, O.; Krosinsky, C.; Oram, D. Finance and Management for the Anthropocene. Organ. Environ. 2019, 32, 26–40. [Google Scholar] [CrossRef]
  32. Zimmermann, S. Same Same but Different: How and Why Banks Approach Sustainability. Sustainability 2019, 11, 2267. [Google Scholar] [CrossRef]
  33. García, M.M.; Herrero, A.; Rodríguez, I. Influence of corporate social responsibility on loyalty and valuation of services. J. Bus. Ethics 2005, 61, 369–385. [Google Scholar]
  34. Busch, T.; Bauer, R.; Orlitzky, M. Sustainable development and financial markets: Old paths and new avenues. Bus. Soc. 2016, 55, 303–329. [Google Scholar] [CrossRef]
  35. Fatma, M.; Rahman, Z. The CSR’s influence on customer responses in Indian banking sector. J. Retail. Consum. Serv. 2016, 29, 49–57. [Google Scholar] [CrossRef]
  36. Dell’Atti, S.; Trotta, A.; Iannuzzi, A.P.; DeMaria, F. Corporate Social Responsibility Engagement as a Determinant of Bank Reputation: An Empirical Analysis. Corp. Soc. Responsib. Environ. Manag. 2017, 24, 589–605. [Google Scholar] [CrossRef] [Green Version]
  37. Esteban, P.; de la Cuesta, M.; Paredes, J.D. Corporate social performance and its relation with corporate financial performance: International evidence in the banking industry. J. Clean. Prod. 2017, 162, 1102–1110. [Google Scholar] [CrossRef]
  38. Gangi, F.; Meles, A.; D’Angelo, E.; Daniele, L.M. Sustainable development and corporate governance in the financial system: Are environmentally friendly banks less risky? Corp. Soc. Responsib. Environ. Manag. 2018, 26, 529–547. [Google Scholar] [CrossRef]
  39. Carrión, G.C.; Henseler, J.; Ringle, C.M.; Roldán, J.L. Prediction-oriented modeling in business research by means of PLS path modeling: Introduction to a JBR special section. J. Bus. Res. 2016, 69, 4545–4551. [Google Scholar] [CrossRef]
  40. Hair, J.F.; Sarstedt, M.; Ringle, C.M.; Mena, J.A. An assessment of the use of partial least squares structural equation modeling in marketing research. J. Acad. Mark. Sci. 2012, 40, 414–433. [Google Scholar] [CrossRef]
  41. Juran, J.M.; Godfrey, A.B. Juran’s Quality Handbook, 5th ed.; McGraw-Hill: New York, NY, USA, 1999. [Google Scholar]
  42. Urban, W. Perceived quality versus quality of processes: A meta concept of service quality measurement. Serv. Ind. J. 2013, 33, 200–217. [Google Scholar] [CrossRef]
  43. Vassiliadis, C.; Priporas, C.-V.; Bellou, V.; Andronikidis, A. Customers’ cognitive patterns of assurance: A dual approach. Serv. Ind. J. 2013, 33, 1242–1259. [Google Scholar] [CrossRef]
  44. Seth, N.; Deshmukh, S.G.; Vrat, P. Service quality models: A review. Int. J. Qual. Reliab. Manag. 2005, 22, 913–949. [Google Scholar] [CrossRef]
  45. Ladhari, R. Alternative measures of service quality: A review. Manag. Serv. Qual. Int. J. 2008, 18, 65–86. [Google Scholar] [CrossRef]
  46. Goplani, R.M. Empirical investigation of service quality in retail banking: Comparison of state bank of India and ICICI bank, Ahmedabad. Int. J. Res. Commer. Manag. 2013, 4, 93–96. [Google Scholar]
  47. Grönroos, C. A service quality model and its management implications. Eur. J. Mark. 1984, 18, 36–44. [Google Scholar] [CrossRef]
  48. Rust, R.T.; Oliver, R.L. Service Quality: Insights and managerial implications from the frontier. In Service Quality: New Directions in Theory and Practice; Rust, R.T., Oliver, R.L., Eds.; Sage Publications: Thousand Oaks, CA, USA, 1994. [Google Scholar]
  49. Dabholkar, P.; Thorpe, D.I.; Rentz, J.O. A measure of service quality for retail stores. J. Acad. Mark. Sci. 1996, 24, 3–16. [Google Scholar] [CrossRef]
  50. Brady, M.K.; Cronin, J.J. Some New Thoughts on Conceptualizing Perceived Service Quality: A Hierarchical Approach. J. Mark. 2001, 65, 34–49. [Google Scholar] [CrossRef] [Green Version]
  51. Parasuraman, A.; Zeithaml, V.; Berry, L. SERVQUAL: A multiple-item scale for measuring consumer perceptions of service quality. J. Retail. 1988, 64, 12–40. [Google Scholar]
  52. Sureshchandar, G.; Rajendran, C.; Anantharaman, R. The relationship between service quality and customer satisfaction—A factor specific approach. J. Serv. Mark. 2002, 16, 363–379. [Google Scholar] [CrossRef]
  53. McDonald, L.M.; Rundle, S. Corporate social responsibility and bank customer satisfaction: A research agenda. Int. J. Bank Mark. 2008, 26, 170–182. [Google Scholar] [CrossRef]
  54. Jamal, A.; Naser, K. Customer satisfaction and retail banking: An assessment of some of the key antecedents of customer satisfaction in retail banking. Int. J. Bank Mark. 2002, 20, 146–160. [Google Scholar] [CrossRef]
  55. Czepiel, J.A.; Solomon, M.R.; Surprenant, C.F. The Service Encounter: Managing Employee/Customer Interaction in Service Businesses; Lexington Books: Lexington, MA, USA, 1985. [Google Scholar]
  56. Sanchez, J.; Callarisa, L.; Rodríguez, R.M.; Moliner, M.A. Perceived value of the purchase of a tourism product. Tour. Manag. 2006, 27, 394–409. [Google Scholar] [CrossRef]
  57. Wang, Y.; Hui, Y.V.; Lo, H.-P.; Lo, H. The antecedents of service quality and product quality and their influences on bank reputation: Evidence from the banking industry in China. Manag. Serv. Qual. Int. J. 2003, 13, 72–83. [Google Scholar] [CrossRef]
  58. Parasuraman, A. Alternative scales for measuring service quality: A comparative assessment based on psychometric and diagnostic criteria. J. Retail. 1994, 70, 193–194. [Google Scholar] [CrossRef] [Green Version]
  59. Wakefield, K.L.; Blodgett, J. The effects of the servicescape on customers’ behavioural intentions in leisure service settings. J. Serv. Mark. 1996, 10, 66–76. [Google Scholar] [CrossRef]
  60. Reimer, A.; Kuehn, R. The impact of servicescape on quality perception. Eur. J. Mark. 2005, 39, 785–808. [Google Scholar] [CrossRef]
  61. Booms, B.H.; Bitner, M.J. Marketing strategies and organization structures for service firms. In Marketing of Services; Donnelly, J.H., George, W.R., Eds.; American Marketing Association: Chicago, IL, USA, 1981; pp. 47–51. [Google Scholar]
  62. Nilsson, E.; Ballantyne, D. Reexamining the place of servicescape in marketing: A service-dominant logic perspective. J. Serv. Mark. 2014, 28, 374–379. [Google Scholar] [CrossRef]
  63. Wakefield, K.L.; Blodgett, J.G. Customer response to intangible and tangible service factors. Psychol. Mark. 1999, 16, 51–68. [Google Scholar] [CrossRef]
  64. Turley, L.W.; Milliman, R.E. Atmospheric effects on shopping behavior: A review of the experimental evidence. J. Bus. Res. 2000, 49, 193–211. [Google Scholar] [CrossRef]
  65. Miles, P.; Miles, G.; Cannon, A. Linking servicescape to customer satisfaction: Exploring the role of competitive strategy. Int. J. Oper. Prod. Manag. 2012, 32, 772–795. [Google Scholar] [CrossRef]
  66. Hooper, D.; Coughlan, J.; Mullen, M.R. The servicescape as an antecedent to service quality and behavioral intentions. J. Serv. Mark. 2013, 27, 271–280. [Google Scholar] [CrossRef] [Green Version]
  67. Maignan, I.; Ferrell, O.C. Corporate Social Responsibility and Marketing: An Integrative Framework. J. Acad. Mark. Sci. 2004, 32, 3–19. [Google Scholar] [CrossRef]
  68. Smith, N.C. Corporate Social Responsibility: Whether or How? Calif. Manag. Rev. 2003, 45, 52–76. [Google Scholar] [CrossRef]
  69. Carroll, A.B. The pyramid of corporate social responsibility: Toward the moral management of organizational stakeholders. Bus. Horiz. 1991, 34, 39–48. [Google Scholar] [CrossRef]
  70. Schwartz, M.S.; Carroll, A.B. Corporate Social Responsibility: A Three-Domain Approach. Bus. Ethic Q. 2003, 13, 503–530. [Google Scholar] [CrossRef]
  71. Bigné, E.; Chumpitaz, R.; Andreu, L.; Swaen, V. Percepción de la responsabilidad social corporativa: Un análisis cross-cultural. Universia Bus. Rev. 2005, 5, 14–27. [Google Scholar]
  72. Kotler, P.; Nancy, L. Corporate Social Responsibility: Doing the Most Good for Your Company and Your Cause; Wiley: Hoboken, NJ, USA, 2005. [Google Scholar]
  73. Strand, R. Strategic Leadership of Corporate Sustainability. J. Bus. Ethic 2014, 123, 687–706. [Google Scholar] [CrossRef]
  74. Engert, S.; Baumgartner, R.J. Corporate sustainability strategy—Bridging the gap between formulation and implementation. J. Clean. Prod. 2016, 113, 822–834. [Google Scholar] [CrossRef]
  75. Pomering, A.; Dolnicar, S. Customers’ sensitivity to different measures of corporate social responsibility in the Australian banking sector. In Proceedings of the Australia and New Zealand Marketing Academy Conference (ANZMAC), Brisbane, Australia, 4–6 December 2006. [Google Scholar]
  76. Wheeler, D.; Fabig, H.; Boele, R. Paradoxes and Dilemmas for Stakeholder Responsive Firms in the Extractive Sector: Lessons from the Case of Shell and the Ogoni. J. Bus. Ethic 2002, 39, 297–318. [Google Scholar] [CrossRef]
  77. Deshpande, R.; Farley, J.U.; Webster, F.E. Corporate Culture, Customer Orientation, and Innovativeness in Japanese Firms: A Quadrad Analysis. J. Mark. 1993, 57, 23. [Google Scholar] [CrossRef]
  78. Pedersen, E.R. Modelling CSR: How managers understand the responsibilities of business towards society. J. Bus. Ethics 2010, 91, 155–166. [Google Scholar] [CrossRef]
  79. Turker, D. Measuring corporate social responsibility: A scale development study. J. Bus. Ethics 2009, 85, 411–427. [Google Scholar] [CrossRef]
  80. Komiyama, H.; Takeuchi, K. Sustainability science: Building a new discipline. Sustain. Sci. 2006, 1, 1–6. [Google Scholar] [CrossRef]
  81. Loorbach, D. Governance for Sustainability. Sustain. Sci. Pract. Policy 2007, 3, 1–4. [Google Scholar] [CrossRef]
  82. Oliver, R. Whence customer loyalty? J. Mark. 1999, 63, 33–44. [Google Scholar] [CrossRef]
  83. Zeithaml, V.A.; Parasuraman, A.; Berry, L.L. Delivering Quality Service: Balancing Customer Perceptions and Expectations; Free Press (Macmillan): New York, NY, USA, 1996. [Google Scholar]
  84. Amin, M.; Isa, Z. An examination of the relationship between service quality perception and customer satisfaction: A SEM approach towards Malaysian Islamic banking. Int. J. Islamic Middle East. Financ. Manag. 2008, 1, 191–209. [Google Scholar] [CrossRef]
  85. Lassar, W.M.; Manolis, C.; Winsor, R.D. Service quality perspectives and satisfaction in private banking. J. Serv. Mark. 2000, 14, 244–271. [Google Scholar] [CrossRef]
  86. Korda, A.P.; Snoj, B. Development, validity and reliability of perceived service quality in retail banking and its relationship with perceived value and customer satisfaction. Manag. Glob. Transit. 2010, 8, 187–205. [Google Scholar]
  87. Tsoukatos, E.; Mastrojianni, E. Key determinants of service quality in retail banking. EuroMed J. Bus. 2010, 5, 85–100. [Google Scholar] [CrossRef]
  88. Rahman, Z. Developing customer oriented service: A case study. Manag. Serv. Qual. Int. J. 2004, 14, 426–435. [Google Scholar] [CrossRef]
  89. Yieh, K.; Chiao, Y.-C.; Chiu, Y.-K. Understanding the Antecedents to Customer Loyalty by Applying Structural Equation Modeling. Total Qual. Manag. Bus. Excel. 2007, 18, 267–284. [Google Scholar] [CrossRef]
  90. Onkvisit, S.; Shaw, J. Is services marketing “really” different? Serv. Mark. Q. 1991, 7, 3–17. [Google Scholar] [CrossRef]
  91. Hall, E.T.; Ruesch, J.; Kees, W. Nonverbal Communication: Notes on the Visual Perception of Human Relations. Am. Sociol. Rev. 1956, 21, 809. [Google Scholar] [CrossRef]
  92. Bitner, M.J. Services capes: The impact of physical surroundings on customers and employees. J. Mark. 1992, 56, 57–71. [Google Scholar] [CrossRef]
  93. Kassim, N.M.; Souiden, N. Customer retention measurement in the UAE (United Arab Emirates) banking sector. J. Financ. Serv. Mark. 2007, 11, 217–228. [Google Scholar] [CrossRef]
  94. Garner, S.; Hanna, M.E.; Hill, C.J. Selection criteria for professional service providers. J. Serv. Mark. 1989, 3, 61–69. [Google Scholar]
  95. Berry, L.; Parasuraman, A. Marketing Services: Competing through Quality; The Free Press: New York, NY, USA, 1991. [Google Scholar]
  96. Sharma, A.; Stafford, T.F. The effect of retail atmospherics on customers’ perceptions of salespeople and customer persuasion: An empirical investigation. J. Bus. Res. 2000, 49, 183–191. [Google Scholar] [CrossRef]
  97. Goldsmith, R.E.; Lafferty, B.A.; Newell, S.J. The Influence of Corporate Credibility on Consumer Attitudes and Purchase Intent. Corp. Reput. Rev. 2000, 3, 304–318. [Google Scholar] [CrossRef]
  98. Rajaobelina, L.; Bergeron, J. Antecedents and consequences of buyer-seller relationship quality in the financial services industry. Int. J. Bank Mark. 2009, 27, 359–380. [Google Scholar] [CrossRef]
  99. Monserrat, P.A. La Banca Culpable; La Esfera de los Libros: Madrid, Spain, 2013. [Google Scholar]
  100. Güneş, E.D.; Akşin, O.Z.; Örmeci, E.L.; Özden, S.H. Modeling Customer Reactions to Sales Attempts: If Cross-Selling Backfires. J. Serv. Res. 2010, 13, 168–183. [Google Scholar] [CrossRef] [Green Version]
  101. Lee, E.; Mathur, A.; Fatt, C.K.; Moschis, G.P. The timing and context of consumer decisions. Mark. Lett. 2012, 23, 793–805. [Google Scholar] [CrossRef]
  102. Moschis, G.P. Consumer Behavior in Later Life: Current Knowledge, Issues, and New Directions for Research. Psychol. Mark. 2012, 29, 57–75. [Google Scholar] [CrossRef]
  103. Obal, M.W.; Kunz, W.H. Trust Development in E-Services: A Cohort Analysis of Millennials and Baby Boomers. SSRN Electron. J. 2013, 24, 45–63. [Google Scholar]
  104. Wang, Y.S. The impact of crisis events on the stock returns volatility of international airlines. Serv. Ind. J. 2013, 33, 1206–1217. [Google Scholar] [CrossRef]
  105. Yalch, R.F.; Spangenberg, E.R. The Effects of Music in a Retail Setting on Real and Perceived Shopping Times. J. Bus. Res. 2000, 49, 139–147. [Google Scholar] [CrossRef]
  106. Rosenquist, L.E.D. A psychosocial analysis of the human-sanitation nexus. J. Environ. Psychol. 2005, 25, 335–346. [Google Scholar] [CrossRef]
  107. Hightower, R.; Brady, M.K.; Baker, T.L. Investigating the role of the physical environment in hedonic service consumption: An exploratory study of sporting events. J. Bus. Res. 2002, 55, 697–707. [Google Scholar] [CrossRef]
  108. Luo, X.; Bhattacharya, C. Corporate Social Responsibility, Customer Satisfaction, and Market Value. J. Mark. 2006, 70, 1–18. [Google Scholar] [CrossRef]
  109. Boles, J.S.; Babin, B.J.; Brashear, T.G.; Brooks, C. An Examination of the Relationships between Retail Work Environments, Salesperson Selling Orientation-Customer Orientation and Job Performance. J. Mark. Theory Pract. 2001, 9, 1–13. [Google Scholar] [CrossRef]
  110. Krepapa, A.; Berthon, P.; Webb, D.; Pitt, L. Mind the gap: An analysis of service provider versus customer perceptions of market orientation and impact on satisfaction. Eur. J. Mark. 2003, 37, 197–218. [Google Scholar] [CrossRef]
  111. Mandhachitara, R.; Poolthong, Y. A model of customer loyalty and corporate social responsibility. J. Serv. Mark. 2011, 25, 122–133. [Google Scholar] [CrossRef]
  112. Maignan, I.; Ferrell, O.C.; Hult, G.T.M.; Hult, G.T.M. Corporate Citizenship: Cultural Antecedents and Business Benefits. J. Acad. Mark. Sci. 1999, 27, 455–469. [Google Scholar] [CrossRef]
  113. Hox, J.J. Hierarchical Regression Models for Interviewer and Respondent Effects. Sociol. Methods Res. 1994, 22, 300–318. [Google Scholar] [CrossRef]
  114. Kish, L. Studies of Interviewer Variance for Attitudinal Variables. J. Am. Stat. Assoc. 1962, 57, 92–115. [Google Scholar] [CrossRef]
  115. Groves, R.M. Survey Errors and Survey Costs; John Wiley & Sons: Hoboken, NJ, USA, 2004. [Google Scholar]
  116. Davis, R.E.; Couper, M.P.; Janz, N.K.; Caldwell, C.H.; Resnicow, K. Interviewer effects in public health surveys. Health Educ. Res. 2010, 25, 14–26. [Google Scholar] [CrossRef] [PubMed]
  117. Ye, J.; Marinova, D.; Singh, J. Strategic Change Implementation and Performance Loss in the Front Lines. J. Mark. 2007, 71, 156–171. [Google Scholar] [CrossRef]
  118. Brislin, R.W. Back translation for the cross-cultural research. J. Cross-Cult. Psychol. 1970, 1, 185–216. [Google Scholar] [CrossRef]
  119. Mercer, J. Corporate Social Responsibility and Its Importance to Consumers. Ph.D. Thesis, Claremont Graduate University, Claremont, CA, USA, 2003. [Google Scholar]
  120. Caruana, A. The impact of switching costs on consumer loyalty: A study among corporate customers of mobile telephony. J. Target. Meas. Anal. Mark. 2004, 12, 256–268. [Google Scholar] [CrossRef]
  121. Camarero, M.C.; Gutiérrez, J.; San Martín, S. The impact of customer relationship marketing on the firm performance: A Spanish case. J. Serv. Mark. 2005, 19, 234–244. [Google Scholar] [CrossRef]
  122. Joreskog, K.G. A General Method for Analysis of Covariance Structures. Biometrika 1970, 57, 239. [Google Scholar] [CrossRef]
  123. Squillacciotti, S. Prediction oriented classification in PLS path modelling. In Handbook of Partial Least Squares; Springer: Berlin, Germany, 2010; pp. 219–233. [Google Scholar]
  124. Shmueli, G.; Ray, S.; Estrada, J.M.V.; Chatla, S.B. The elephant in the room: Predictive performance of PLS models. J. Bus. Res. 2016, 69, 4552–4564. [Google Scholar] [CrossRef]
  125. Gigerenzer, G.; Brighton, H. Homo Heuristicus: Why Biased Minds Make Better Inferences. Top. Cogn. Sci. 2009, 1, 107–143. [Google Scholar] [CrossRef] [Green Version]
  126. Woodside, A.G. Moving beyond multiple regression analysis to algorithms: Calling for adoption of a paradigm shift from symmetric to asymmetric thinking in data analysis and crafting theory. J. Bus. Res. 2013, 66, 463–472. [Google Scholar] [CrossRef]
  127. Henseler, J.; Hubona, G.; Ray, P.A. Using PLS path modeling in new technology research: Updated guidelines. Ind. Manag. Data Syst. 2016, 116, 2–20. [Google Scholar] [CrossRef]
  128. Ringle, C.M.; Wende, S.; Becker, J.M. SmartPLS 3 (version 3.1.9). Boenningstedt: SmartPLS GmbH. Available online: www.smartpls.de (accessed on 10 April 2015).
  129. Carmines, E.G.; Zeller, R.A. Reliability and Validity Assessment; Sage Publications: Beverly Hills, CA, USA, 1979. [Google Scholar]
  130. Barclays, D.; Higgins, C.; Thompson, R. The Partial Least Squares (PLS) approach to casual modeling, personal computer and use as an illustration (Special Issue on Research Methodology). J. Technol. Stud. 1995, 2, 285–309. [Google Scholar]
  131. Bagozzi, R.P.; Yi, Y. On the evaluation of structural equation models. J. Acad. Mark. Sci. 1988, 16, 74–94. [Google Scholar] [CrossRef]
  132. Larcker, D.F.; Fornell, C. Evaluating Structural Equation Models with Unobservable Variables and Measurement Error. J. Mark. Res. 1981, 18, 39. [Google Scholar]
  133. Hair, J.F.; Sarstedt, M.; Hopkins, L.; Kuppelwieser, V.G. Partial least squares structural equation modeling (PLS-SEM). Eur. Bus. Rev. 2014, 26, 106–121. [Google Scholar] [CrossRef]
  134. Henseler, J.; Ringle, C.M.; Sarstedt, M. A new criterion for assessing discriminant validity in variance-based structural equation modeling. J. Acad. Mark. Sci. 2015, 43, 115–135. [Google Scholar] [CrossRef]
  135. Henseler, J.; Ringle, C.M.; Sinkovics, R.R. The use of partial least squares path modeling in international marketing. Adv. Int. Mark. 2009, 20, 277–319. [Google Scholar]
  136. Henseler, J.; Dijkstra, T.K.; Sarstedt, M.; Ringle, C.M.; Diamantopoulos, A.; Straub, D.W.; Calantone, R.J. Common beliefs and reality about PLS: Comments on Rönkkö & Evermann 2013. Organ. Res. Methods 2014, 17, 182–209. [Google Scholar]
  137. Ragin, C.C. The Comparative Method. Moving Beyond Qualitative and Quantitative Strategies; University of California Press: Berkeley, CA, USA, 1987. [Google Scholar]
  138. Seny Kan, K.A.; Adegbite, E.; El Omari, S.; Abdellatif, M. On the use of qualitative comparative analysis in management. J. Bus. Res. 2016, 69, 1458–1463. [Google Scholar] [CrossRef] [Green Version]
  139. Fiss, C. A set-theoretic approach to organizational configurations. Acad. Manag. Rev. 2007, 32, 1180–1198. [Google Scholar] [CrossRef]
  140. Ragin, C.C. Redesigning Social Inquiry: Fuzzy Sets and Beyond; University of Chicago Press: Chicago, IL, USA, 2008. [Google Scholar]
  141. Rihoux, B.; Ragin, C. Configurational Comparative Methods: Qualitative Comparative Analysis (QCA) and Related Techniques; SAGE Publications: Thousand Oaks, CA, USA, 2009. [Google Scholar]
  142. Eng, S.; Woodside, A.G. Configural analysis of the drinking man: Fuzzy-set qualitative comparative analyses. Addict. Behav. 2012, 37, 541–543. [Google Scholar] [CrossRef] [PubMed]
  143. Ragin, C.C. Set Relations in Social Research: Evaluating Their Consistency and Coverage. Politi Anal. 2006, 14, 291–310. [Google Scholar] [CrossRef]
  144. Fiss, C. Building better causal theories: A fuzzy set approach to typologies in organization research. Acad. Manag. Res. 2011, 54, 393–420. [Google Scholar] [CrossRef]
  145. Katz, D.; Kahn, R.L. The Social Psychology of Organizations, 2nd ed.; Wiley: New York, NY, USA, 1978. [Google Scholar]
  146. Chin, W.W. How to write up and report PLS analyses. In Handbook of Partial Least Squares: Concepts, Methods and Applications in Marketing and Related Fields Berlin; Esposito, V.V., Chin, W.W., Henseler, J., Wang, H., Eds.; Springer: Berlin, Germany, 2010; pp. 655–690. [Google Scholar]
  147. Bennett, R.; Kottasz, R. Public attitudes towards the UK banking industry following the global financial crisis. Int. J. Bank Mark. 2012, 30, 128–147. [Google Scholar] [CrossRef]
  148. Anderson, L.; Ostrom, A.L.; Corus, C.; Fisk, R.P.; Gallan, A.S.; Giraldo, M.; Mende, M.; Mulder, M.; Rayburn, S.W.; Rosenbaum, M.S.; et al. Transformative service research: An agenda for the future. J. Bus. Res. 2013, 66, 1203–1210. [Google Scholar] [CrossRef]
  149. Nikolakis, W.; Nelson, H.W.; Cohen, D.H. Who Pays Attention to Indigenous Peoples in Sustainable Development and Why? Evidence from Socially Responsible Investment Mutual Funds in North America. Organ. Environ. 2014, 27, 368–382. [Google Scholar] [CrossRef]
  150. Risi, D. Time and Business Sustainability: Socially Responsible Investing in Swiss Banks and Insurance Companies. Bus. Soc. 2018. Available online: https://journals.sagepub.com/doi/abs/10.1177/0007650318777721?journalCode=basa (accessed on 9 September 2019). [CrossRef]
  151. Weber, O.; Scholz, R.W.; Michalik, G. Incorporating sustainability criteria into credit risk management. Bus. Strategy Environ. 2010, 19, 3–50. [Google Scholar] [CrossRef]
  152. Weber, O. Environmental credit risk management in banks and financial service institutions. Bus. Strategy Environ. 2012, 21, 248–263. [Google Scholar] [CrossRef]
  153. Eisenbach, S.; Schiereck, D.; Trillig, J.; von Flotow, P. Sustainable project finance, the adoption of the equator principles and shareholder value effects. Bus. Strategy Environ. 2014, 23, 375–394. [Google Scholar] [CrossRef]
  154. Wu, M.-W.; Shen, C.-H. Corporate social responsibility in the banking industry: Motives and financial performance. J. Bank. Financ. 2013, 37, 3529–3547. [Google Scholar] [CrossRef]
  155. Weber, O. Sustainability benchmarking of European banks and financial service organizations. Corp. Soc. Responsib. Environ. Manag. 2005, 12, 73–87. [Google Scholar] [CrossRef] [Green Version]
Figure 1. Model of effects.
Sustainability 11 04930 g001
Figure 2. Plot of fsQCA results.
Sustainability 11 04930 g002
Table 1. Measurement instruments.
FactorReferencesItems
Outcome quality[11,56,57]14
Personnel quality[1,11,57,60]16
Servicescape quality[11,57,60,65]12
Social quality[2,5,21,33,119]6
Loyalty[120,121]5
Table 2. Validity, reliability and factor analyses.
ItemsIR
SERVICESCAPE QUALITY (α= 0.942; CR=0.947; AVE=0.600)
Environmental conditions
SERV1: The lighting is appropriate.0.705
SERV2: The level of noise is acceptable.0.785
SERV3: There is a pleasant ambient temperature.0.784
SERV4: The aroma is agreeable.0.802
Conditions of cleanliness
SERV5: The entrance and waiting area are clean.0.757
SERV6: The branch seems to be tidy and organized.0.722
SERV7: This branch is generally kept clean.0.804
Conditions of design
SERV8: Privacy is facilitated by the design.0.719
SERV9: The premises are large and spacious.0.849
SERV10: The branch is attractively decorated.0.845
SERV11: The building’s architecture is attractive.0.786
SERV12: It has modern equipment.0.720
PERSONNEL QUALITY (α = 0.976; CR = 0.976; AVE = 0.720)
Conditions of image
PERS1: The employees look clean and tidy.0.766
PERS2: The employees have a good appearance.0.773
PERS3: The employees dress smartly.0.821
Technical conditions
PERS4: The employees provide valuable and useful information.0.874
PERS5: They are familiar with the services the bank offers.0.880
PERS6: They provide a fast service.0.886
PERS7: They are able to solve my problems.0.825
PERS8: They attend to me without making mistakes.0.890
Conditions of confidence
PERS9: The employees’ behavior conveys trust.0.873
PERS10: The transactions undertaken with the staff inspire me with confidence.0.885
PERS11: The employees are always polite.0.848
PERS12: They have the necessary knowledge to answer my questions.0.867
Conditions of empathy
PERS13: Opening times are convenient for all the bank’s customers.0.840
PERS14: They understand the customer’s specific needs.0.818
PERS15: They have the customer’s best interests at heart.0.850
PERS16: They give personal attention to customers.0.868
OUTCOME QUALITY (α = 0.941; CR = 0.946; AVE = 0.561)
Service conditions
OUTC1: On the whole, the service I have received is fitting.0.817
OUTC2: Compared with other banks the level of quality here is acceptable.0.829
OUTC3: I received the service I expected.0.686
OUTC4: I am happy with the outcome I obtained.0.609
Product conditions
OUTC5: The employees have a thorough knowledge of their job.0.781
OUTC6: They are well qualified.0.795
OUTC7: They provide me with valuable and useful information.0.776
Price conditions
OUTC8: Interest or commission payments are justified.0.782
OUTC9: The charges I have to pay are normal for the quality of service offered.0.812
OUTC10: Information is provided about any modifications to charges.0.712
OUTC11: Charges are transparent.0.671
Access conditions
OUTC12: In general I do not have to wait long in line.0.849
OUTC13: I do not have to go far to visit my bank branch.0.670
OUTC14: The number of tellers attending the public is sufficient.0.640
SOCIAL QUALITY (α = 0.874; CR = 0.899; AVE = 0.603)
Conditions regarding customers
SOCI1: They are honest with their customers and meet their contractual obligations with them.0.646
SOCI2: Mechanisms are in place to resolve customer complaints.0.814
SOCI3: They strive to know my needs in a broad sense (commercial and social).0.809
Conditions regarding society
SOCI4: They are committed to ethical principles and social issues. 0.879
SOCI5: They are committed to improving welfare in the neighborhood/city where they operate.0.603
SOCI6: They incorporate measures to protect the general environment.0.864
CUSTOMER ATTITUDINAL LOYALTY (α = 0.918; CR = 0.941; AVE = 0.762)
LOY1: I try to visit my usual branch every time I need financial services.0.876
LOY2: I will try to continue with my usual branch in the coming years.0.927
LOY3: I will encourage my relatives and friends to become customers at this branch.0.666
LOY4: If I continue to be treated in the same way I do not expect I will change my branch.0.932
LOY5: When I need a financial service I will come to this branch.0.934
Note: AVE = average variance extracted; CR= composite reliability; IR= individual reliability.
Table 3. Heterotrait–monotrait (HTMT) ratio in the measurement model.
12345
1. Loyalty
2. Outcome quality0.790
3. Social quality0.8340.921
4. Servicescape quality0.5790.7120.726
5. Personnel quality0.7080.8560.9230.758
Table 4. Summary of the results of hypotheses test.
Hyp.PathBeta2.5%97.5%t-testp-valueR2SRMR
H1Outcome quality ≥ loyalty0.3970.3170.47710.1010.0000.6100.069
H2Personnel quality ≥ loyalty−0.106−0.188−0.0192.4790.013
H3Servicescape quality ≥ loyalty0.018−0.0340.0730.6800.497
H4Social quality ≥ loyalty0.4970.4110.58011.3410.000
Table 5. Study of variables and their calibration.
VariableServicescape Quality (F1)Personnel Quality (F2)Outcome Quality (F3)Social Quality (F4)Loyalty
Mean4.074.143.583.633.77
Std. Dev0.840.931.0190.921.06
Minimum11111
Maximum55555
N Cases15241514152215021524
Missing0102220
Calibrates Values at
95%55555
50%33333
5%11111
Table 6. Findings from fsQCA of predictive validity in SmartPLS model.
Even Numbers (762 cases)Odd Numbers (Holdout Sample) (762 cases)
Complex solutionRaw CoverageUnique CoverageConsistencyRaw CoverageUnique CoverageConsistency
AF3*F40.5609940.0300120.9010680.5690410.0163040.923669
B~F1*~F2*F30.5452030.0218850.8801430.5391500.0184230.907442
C ~F1*F2*F40.3881710.0100190.962450
D F2*F4 0.4060900.0088430.961820
EF1*~F2*~F3*~F40.3666090.0274260.8979860.3376940.0240880.893928
Frequency cutoff11
Consistency cutoff0.880.89
Solution coverage0.630.63
Solution consistency0.850.87
Note: the symbol (~) preceding the explanatory variables indicates that a necessary and sufficient condition is there in at least low scores in the explanatory variable.
Table 7. Findings from fsQCA of the presence and absence of loyalty (1524 cases).
Presence of LoyaltyAbsence of Loyalty
Complex SolutionRaw CoverageUnique CoverageConsistencyRaw CoverageUnique CoverageConsistency
A F3*F40.5650230.0168320.9123240.1960.00020.771
B ~F1*~F2*F30.5421730.0201520.893525
D F2*F40.4049130.0106750.9602470.1390.0010.805
E F1*~F2*~F3*~F40.3521340.0257540.896036
Frequency cutoff11
Consistency cutoff0.8960.83
Solution coverage0.630.98
Solution consistency0.860.81
Table 8. Findings from fsQCA of comparisons between levels of loyalty.
Presence of Loyalty >3 (1159 cases)Presence of Loyalty ≤3 (364 cases)
Complex SolutionRaw CoverageUnique CoverageConsistencyRaw CoverageUnique CoverageConsistency
F F2*~F3*F40.5043220.0080860.930513
E F1*~F2*~F3*~F40.548790.0471870.848810
A F3*F4 0.5032790.0524220.991594
G ~F2*~F3*~F4 0.4992100.0030810.949151
Frequency cutoff11
Consistency cutoff0.840.95
Solution coverage0.710.91
Solution consistency0.780.83
Table 9. Analysis from fsQCA of comparison between levels of loyalty.
Loyalty (P17)Validity Configuration According to Table 6 and Table 7Servicescape Quality (F1)Personal Quality (F2)Outcome Quality (F3)Social Quality (F4)
HighE+---
LowA ++
Table 10. Prediction MV of Loyalty by SmartPLS.
ConfigurationRMSEMAEQ2
A0.5280.3910.540
B0.5410.3860.455
E0.5370.3840.490

