Crop Production Pushes up Greenhouse Gases Emissions in China: Evidence from Carbon Footprint Analysis Based on National Statistics Data


Abstract
1. Introduction
2. Methods
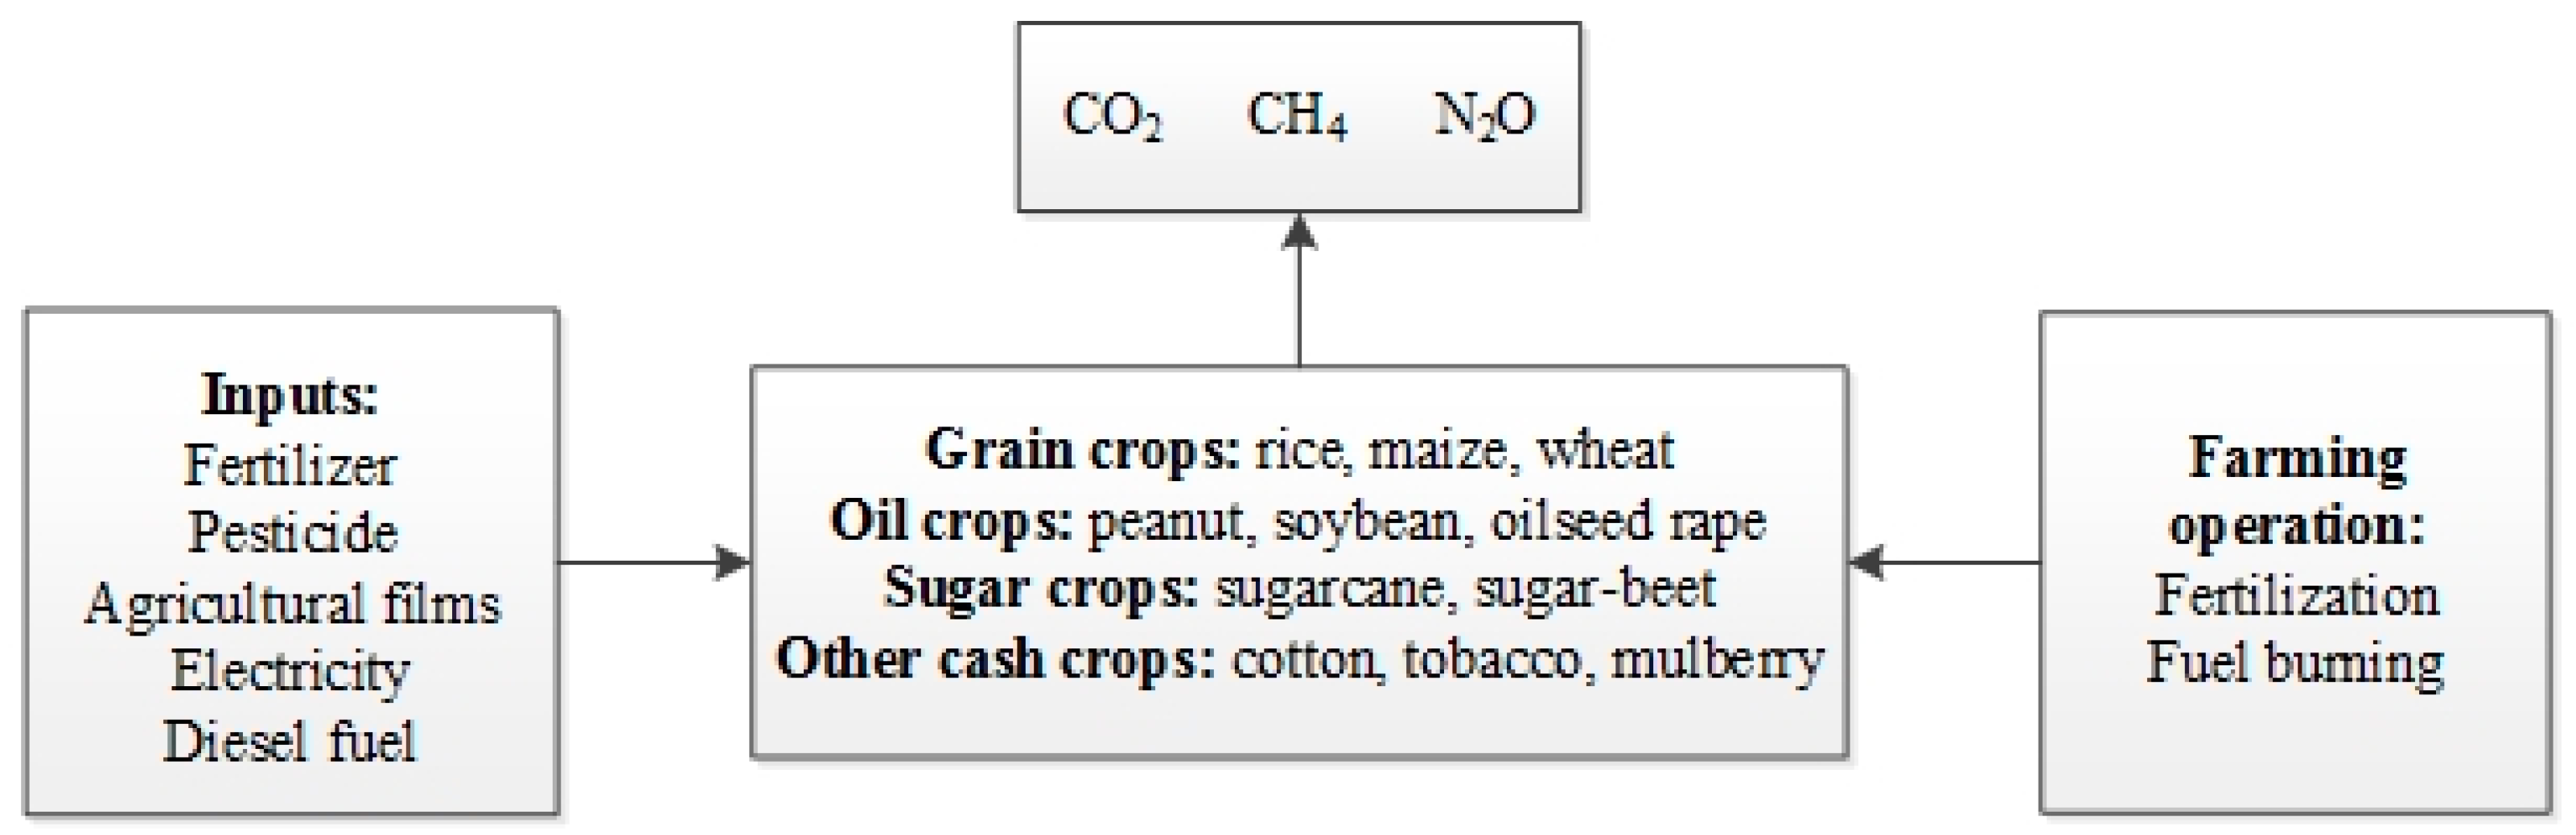
2.1. Research Boundary
2.2. Carbon Footprint Calculation
2.2.1. CFinputs Estimation
2.2.2. CFon-field Estimation
2.3. CF Indices
2.4. Total GHGs Emission Estimation of Cropping System in China
2.5. Scenario Analysis
2.5.1. Scenario A: Population Change
2.5.2. Scenario B: Improved Crops Structure
2.5.3. Scenario C: Reduced Fertilizer Input
2.5.4. Scenario D: Integrated Livestock-Cropping Approach
2.5.5. Scenario E: Increase Biodiversity
2.6. Raw Data Sources
3. Results
3.1. Total GHG Emissions of Cropping System in China
3.2. CFs of Different Crops in China During 2000–2016
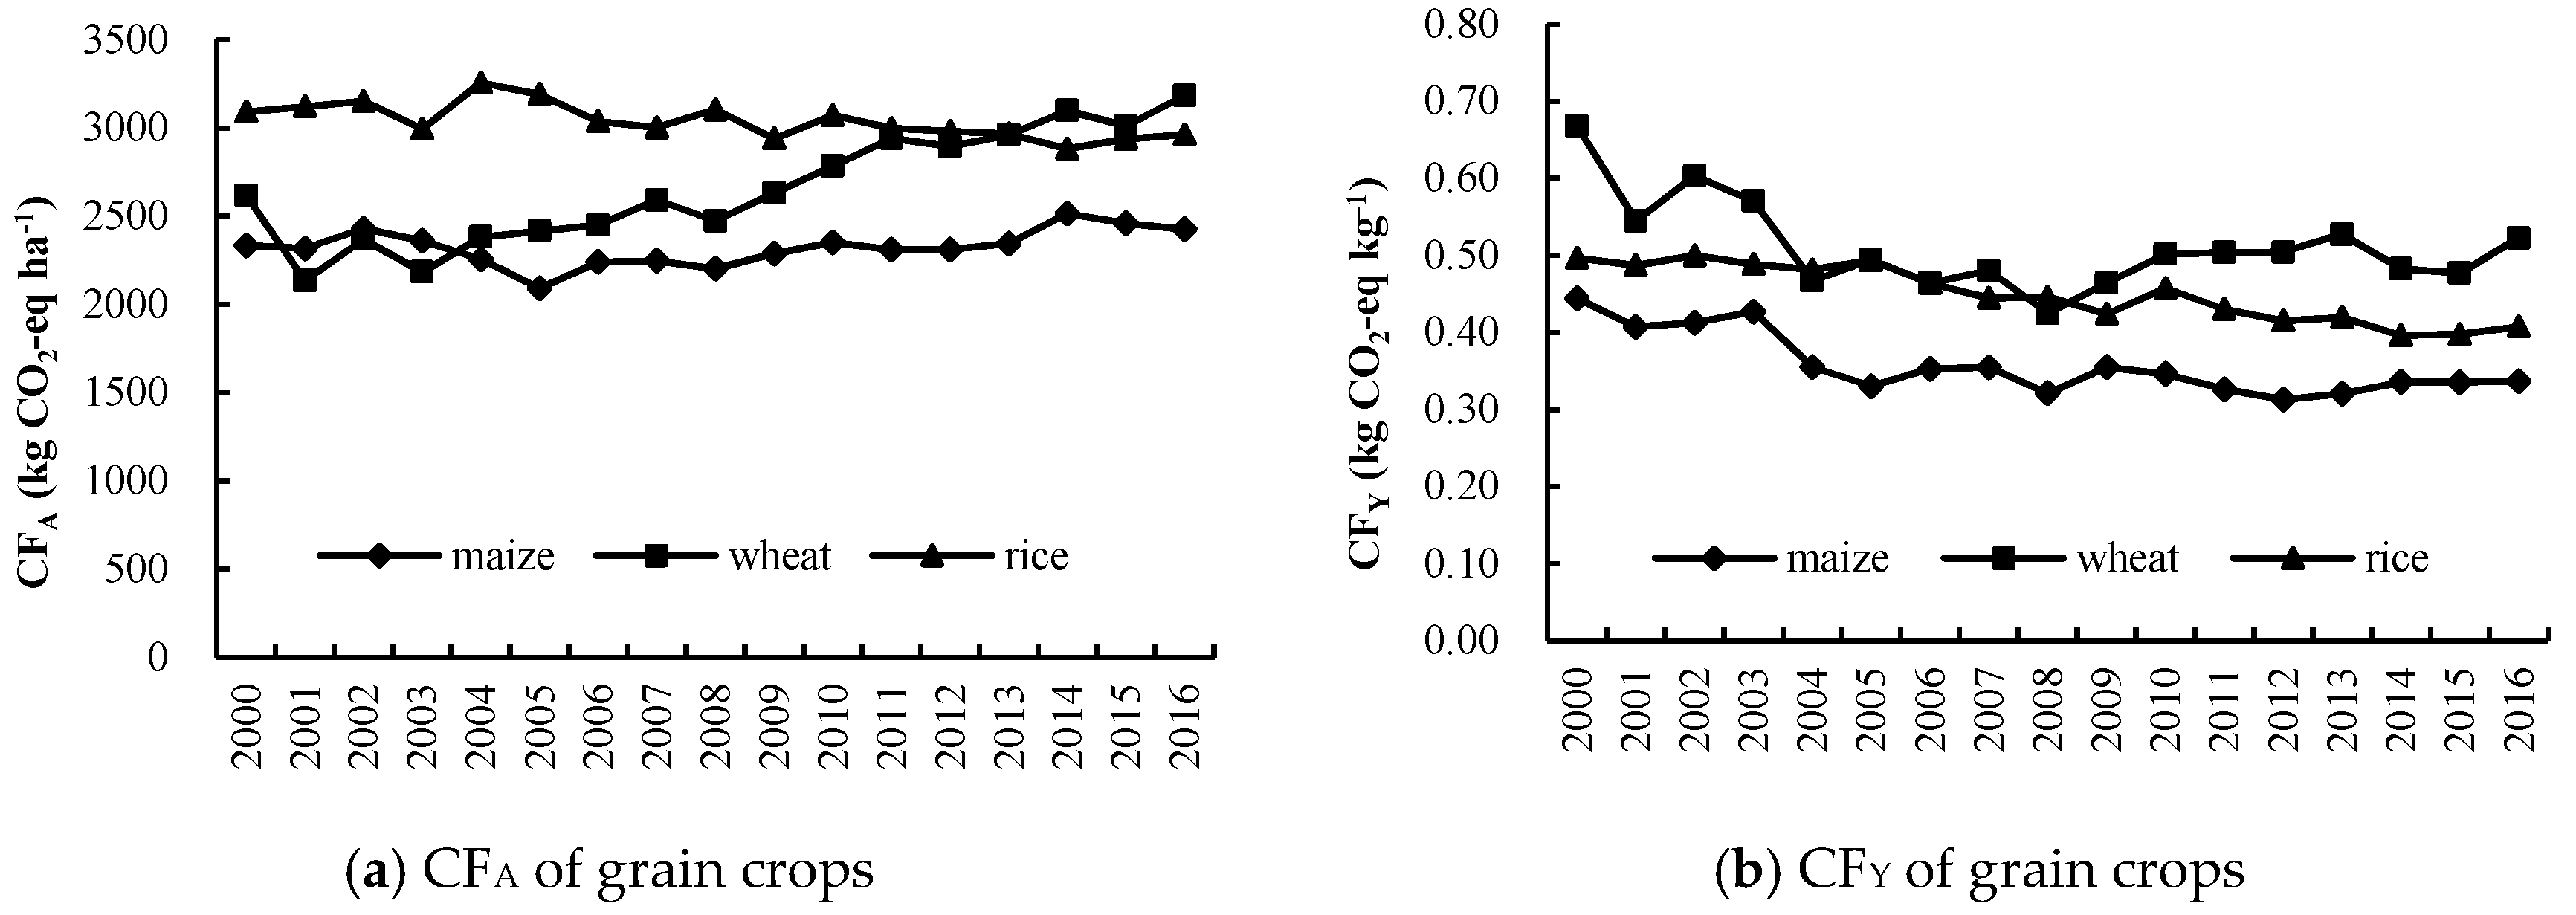
3.2.1. Grain Crops
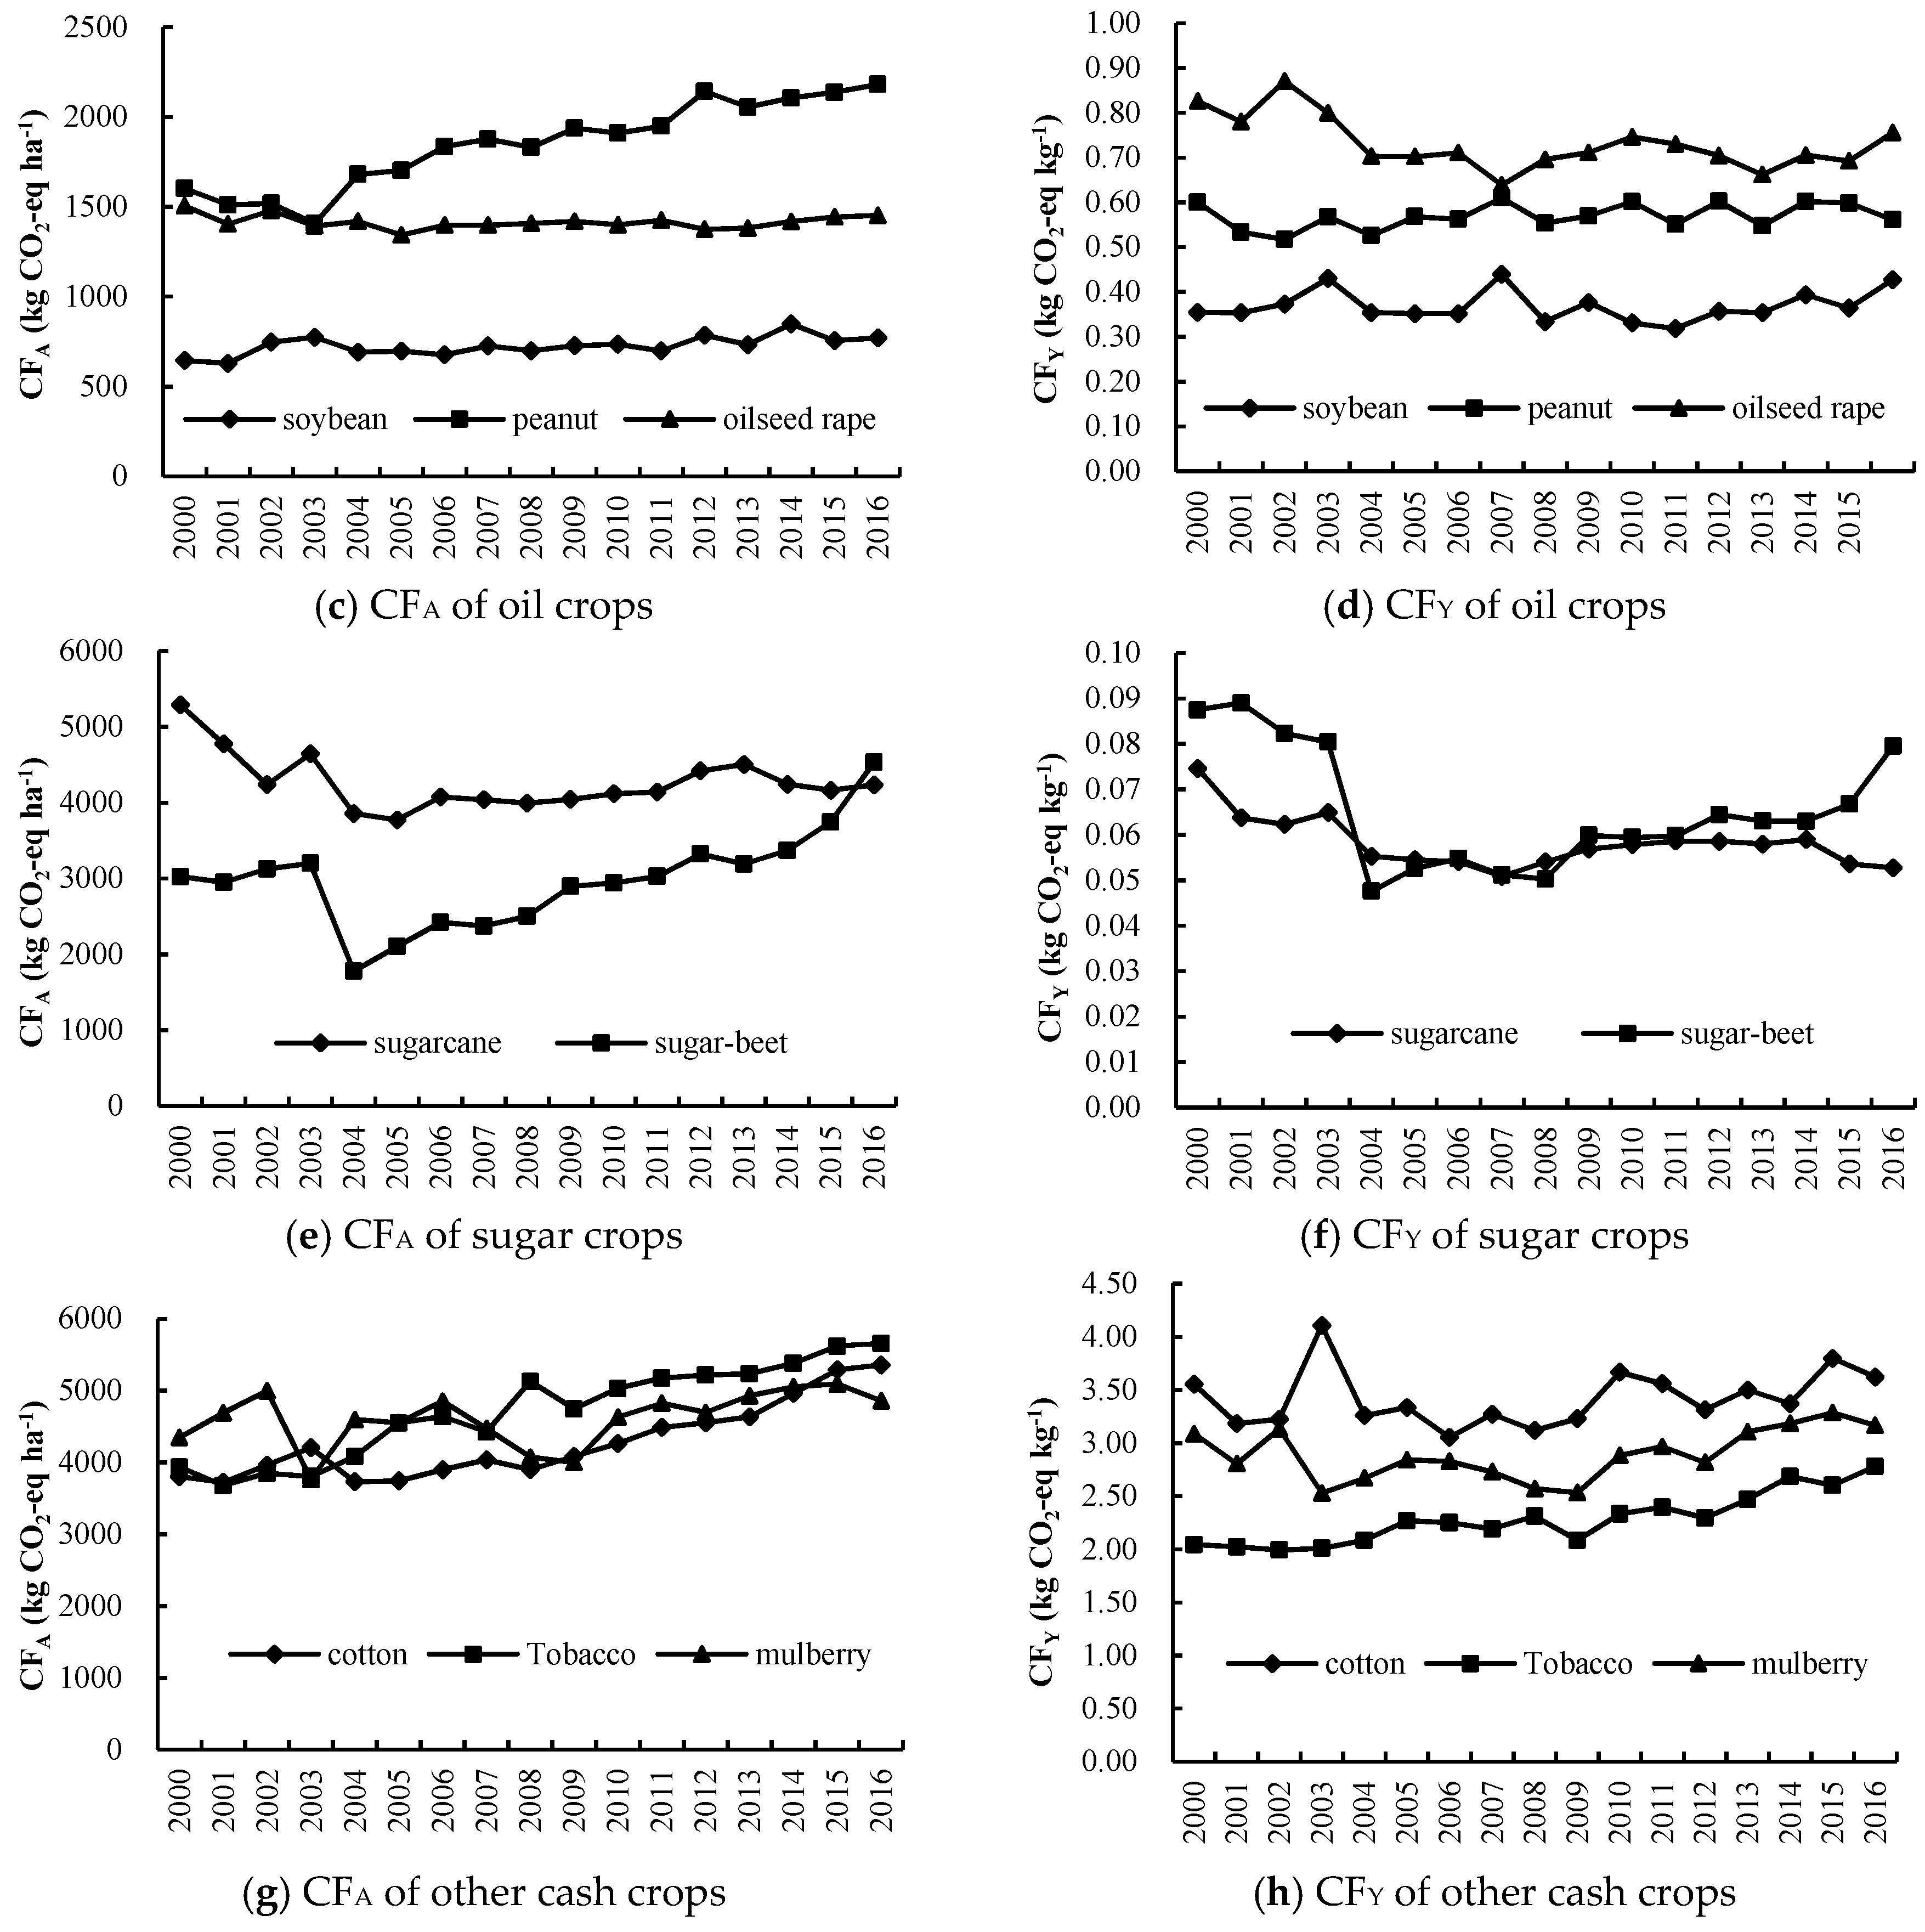
3.2.2. Oil Crops
3.2.3. Sugar Crops
3.2.4. Other Cash Crops
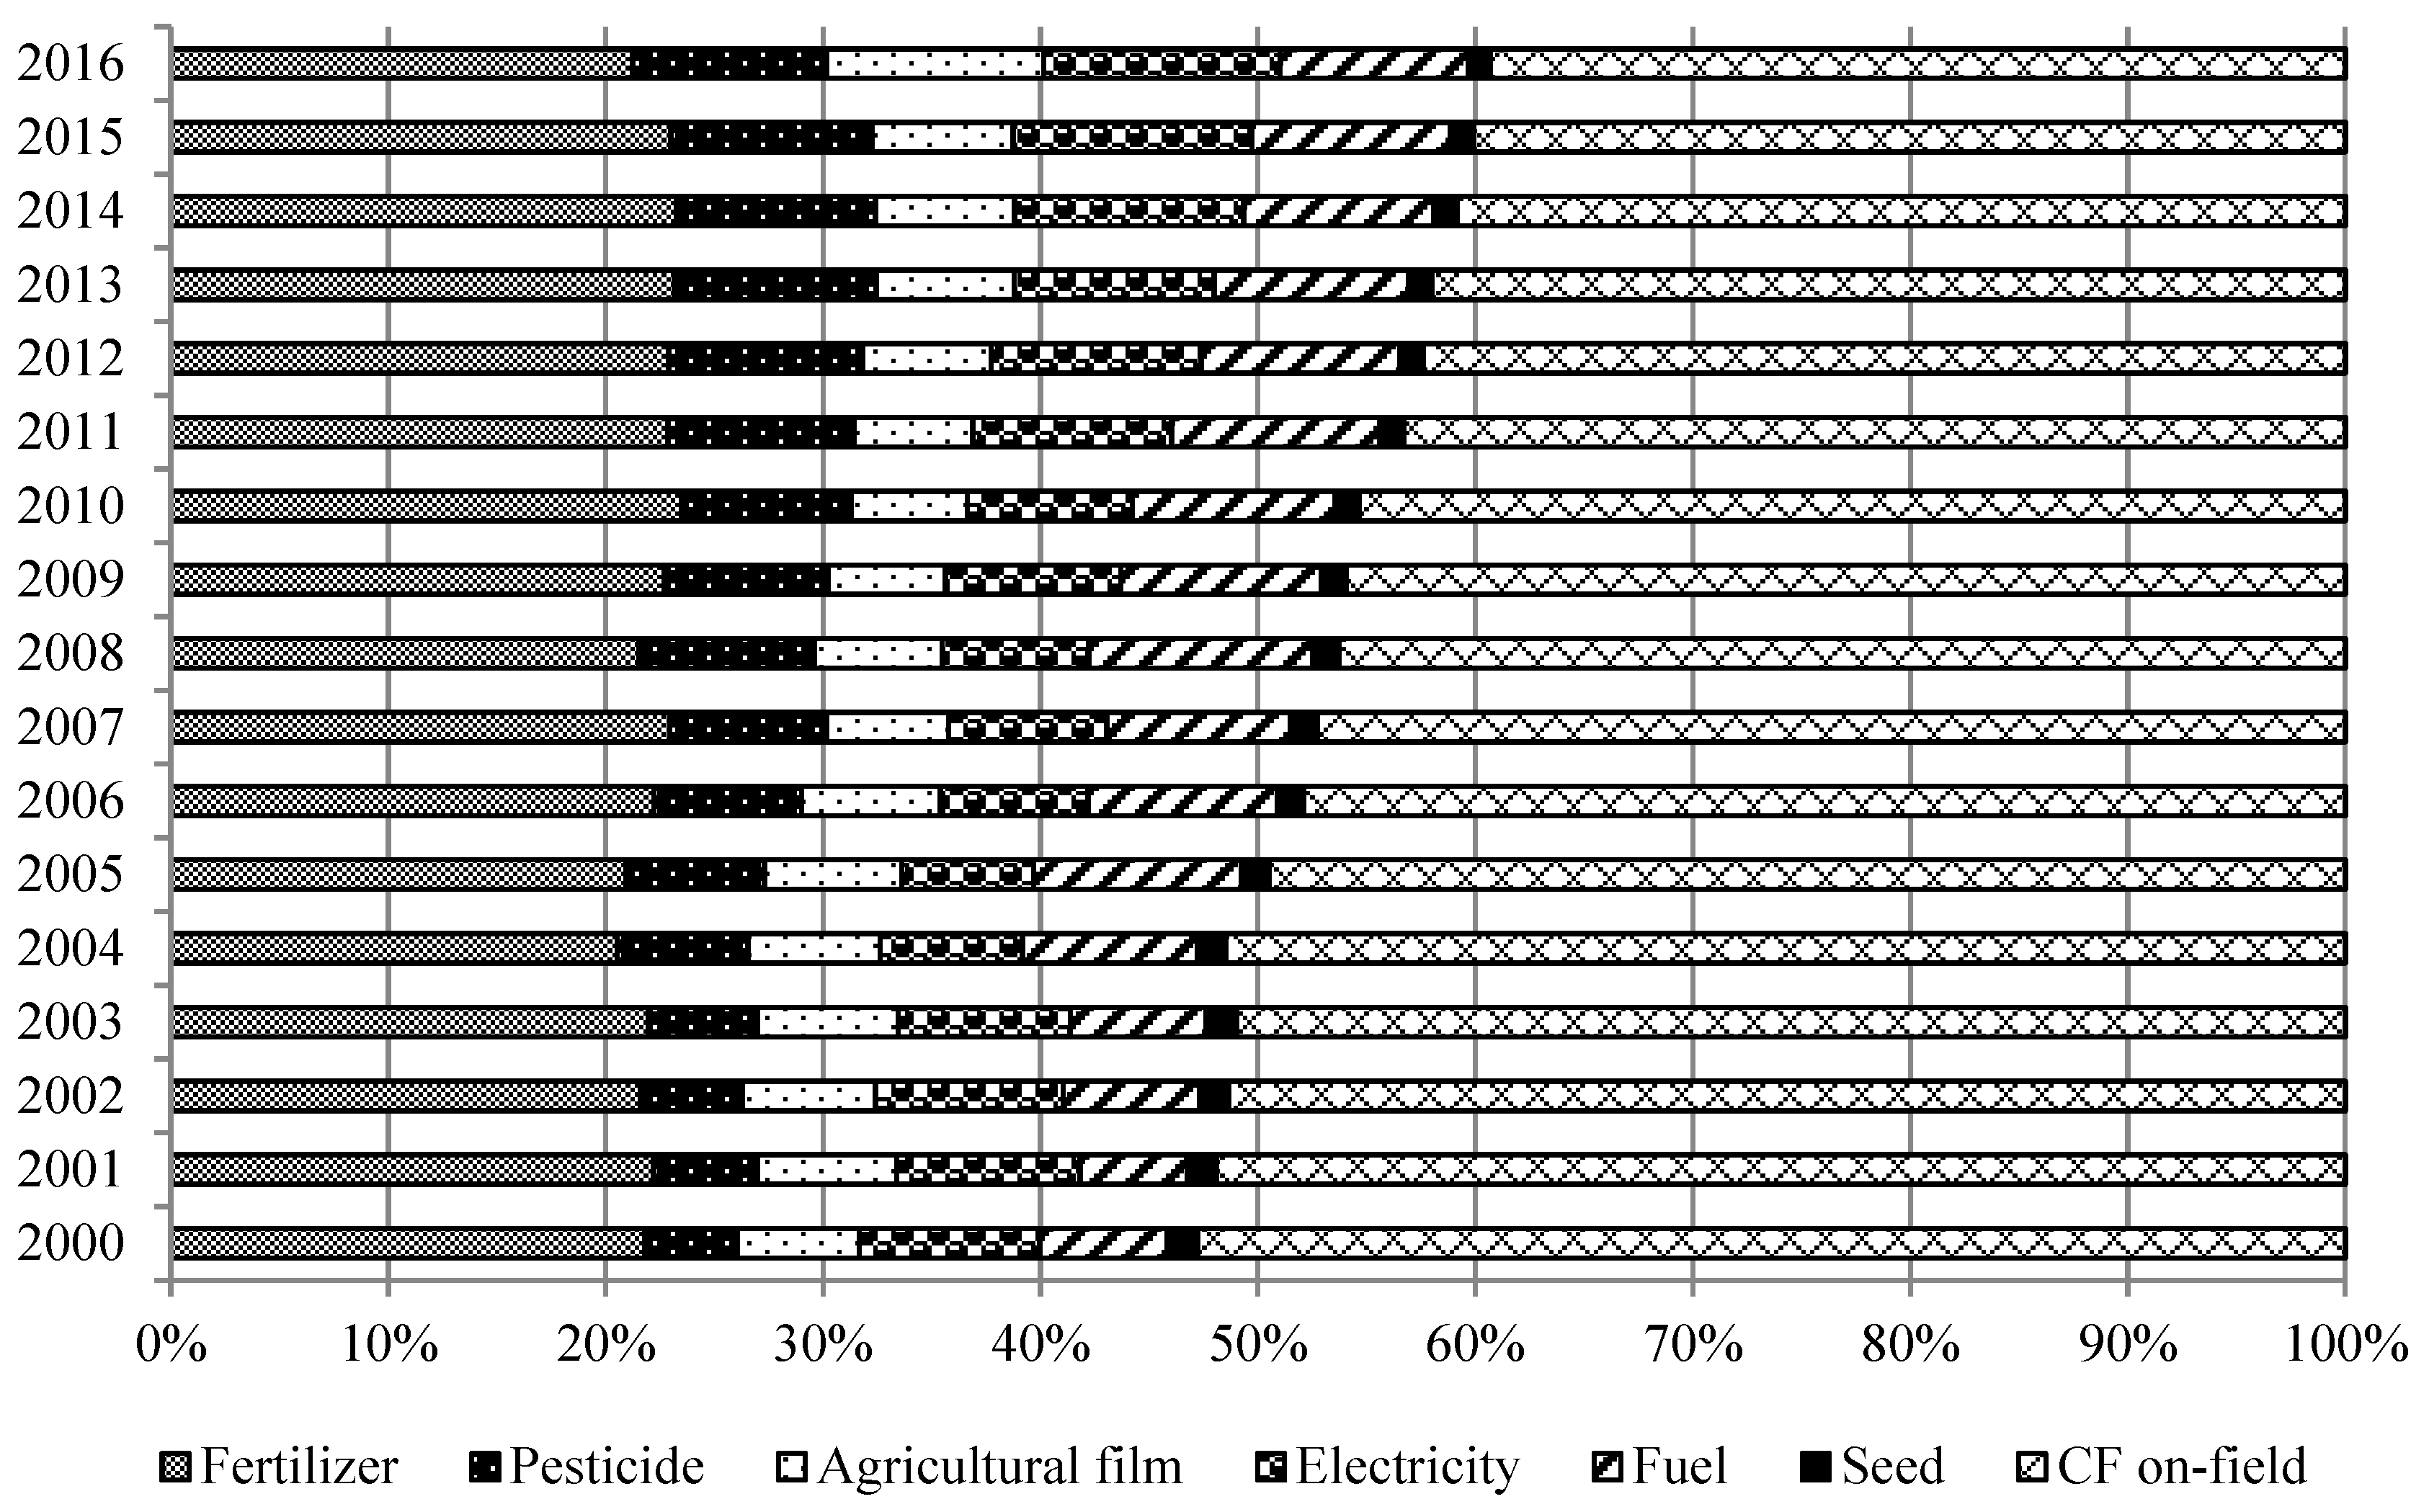
3.3. Contributions Analysis
3.4. Scenario Analysis
4. Discussion
4.1. Historical Dynamics of GHG Emissions from the Cropping System in China
4.2. Comparison of Crops’ CFs in Different Nations
4.3. Future Estimation of GHGs from Cropping System in China
4.4. Mitigation Measures
4.5. Limitations in the Study
5. Conclusions
Author Contributions
Funding
Acknowledgments
Conflicts of Interest
References
- The Intergovernmental Panel on Climate Change (IPCC). Climate Change 2013: The Physical Science Basis. Available online: https://www.ipcc.ch/site/assets/uploads/2018/02/WG1AR5_all_final. pdf (accessed on 30 August 2019).
- The Intergovernmental Panel on Climate Change (IPCC). 2018 Global Warming of 1.5 °C. Available online: http://report.ipcc.ch/sr15/pdf/sr15_spm_final.pdf (accessed on 30 August 2019).
- Lal, R. Agricultural activities and the global carbon cycle. Nutr. Cycl. Agroecosyst. 2004, 70, 103–116. [Google Scholar] [CrossRef]
- van Groenigen, K.J.; van Kessel, C.; Hungate, B.A. Increased greenhouse-gas intensity of rice production under future atmospheric conditions. Nat. Clim. Chang. 2013, 3, 288–291. [Google Scholar] [CrossRef]
- The Intergovernmental Panel on Climate Change (IPCC). 2014AR5 Synthesis Report: Climate Change 2014. Available online: https://www.ipcc.ch/report/ar5/syr/ (accessed on 30 August 2019).
- FAO. Global Database of GHG Emissions Related to Feed Crops: Methodology. Version 1. Livestock Environmental Assessment and Performance Partnership; FAO: Rome, Italy, 2017.
- Smith, P.; Bustamante, M. Agriculture, Forestry and Other Land Use (AFOLU). In Climate Change 2014: Mitigation of Climate Change. Contribution of Working Group III to the Fifth Assessment Report of the Intergovernmental Panel on Climate Change; Cambridge University Press: Cambridge, UK; New York, NY, USA, 2014. [Google Scholar]
- Gan, Y.; Liang, C.; Hamel, C.; Cutforth, H.; Wang, H. Strategies for reducing the carbon footprint of field crops for semiarid areas. A review. Agron. Sustain. Dev. 2011, 31, 643–656. [Google Scholar] [CrossRef]
- Webb, J.; Audsley, E.; Williams, A.; Pearn, K.; Chatterton, J. Can UK livestock production be configured to maintain production while meeting targets to reduce emissions of greenhouse gases and ammonia? J. Clean. Prod. 2014, 83, 204–211. [Google Scholar] [CrossRef]
- Edenhofer, O. Climate policy: Reforming emissions trading. Nat. Clim. Chang. 2014, 4, 663–664. [Google Scholar] [CrossRef]
- Yan, M.; Cheng, K.; Luo, T.; Yan, Y.; Rees, R.M. Carbon Footprint of Grain Crop Production in China-Based on Farm Survey Data. J. Clean. Prod. 2015, 104, 130–138. [Google Scholar] [CrossRef]
- National Bureau of Statistic of China (NBSC). National Bureau of Statistics Database. Available online: http://www.stats.gov.cn/tjsj/ndsj/ (accessed on 30 August 2019).
- Zhang, D.; Shen, J.; Zhang, F.; Li, Y.E.; Zhang, W. Carbon footprint of grain production in China. Sci. Rep.-UK 2017, 7, 4126. [Google Scholar] [CrossRef] [PubMed]
- International Organization for Standardization (ISO). TS-EN ISO 14067 Greenhouse Gases—Carbon Footprint of Products—Requirements and Guidelines for Quantification and Communication; International Organization for Standardization: Geneva, Switzerland, 2013.
- Gan, Y.; Liang, C.; Wang, X.; McConkey, B. Lowering carbon footprint of durum wheat by diversifying cropping systems. Field Crop Res. 2011, 122, 199–206. [Google Scholar] [CrossRef]
- Wan, Y.L.; Zelm, R.V.; Benítez-López, A.; Kulak, M.; Huijbregts, M.A.J. Variability of greenhouse gas footprints of field tomatoes grown for processing: Inter-year and inter-country assessment. Environ. Sci. Technol. 2018, 52, 135–144. [Google Scholar]
- Arrieta, E.M.; Cuchietti, A.; Cabrol, D.; González, A.D. Greenhouse gas emissions and energy efficiencies for soybeans and maize cultivated in different agronomic zones: A case study of Argentina. Sci. Total Environ. 2018, 625, 199. [Google Scholar] [CrossRef]
- Huang, X.M.; Chen, C.Q.; Chen, M.Z.; Song, Z.W.; Zhang, W.J. Carbon footprints of major staple grain crops production in three provinces of Northeast China during 2004–2013. Chin. J. Appl. Ecol. 2016, 27, 3307–3315. [Google Scholar]
- Huang, X.; Chen, C.; Qian, H.; Chen, M.; Deng, A.; Zhang, J.; Zhang, W. Quantification for carbon footprint of agricultural inputs of grains cultivation in China since 1978. J. Clean. Prod. 2017, 142, 1629–1637. [Google Scholar] [CrossRef]
- Wang, X.; Wang, W.; Guan, Y.; Xian, Y.; Huang, Z.; Feng, H.; Chen, Y. A joint use of emergy evaluation, carbon footprint and economic analysis for sustainability assessment of grain system in China during 2000–2015. J. Integr. Agric. 2018, 17, 226–239. [Google Scholar] [CrossRef]
- Yang, X.; Gao, W.; Zhang, M.; Chen, Y.; Sui, P. Reducing agricultural carbon footprint through diversified crop rotation systems in the North China Plain. J. Clean. Prod. 2014, 76, 131–139. [Google Scholar] [CrossRef]
- Wang, Z.; Chen, J.; Zhang, L.; Chen, F.; Sun, H.; Liu, L.; Song, W.; Li, C.D.; Li, Y. Carbon Footprint Analysis of Cotton Production in Hebei Province. Cotton Sci. 2016, 28, 594–601. (In Chinese) [Google Scholar]
- Ma, B.L.; Liang, B.C.; Biswas, D.K.; Morrison, M.J.; McLaughlin, N.B. The carbon footprint of maize production as affected by nitrogen fertilizer and maize-legume rotations. Nutr. Cycl. Agroecosyst. 2012, 94, 15–31. [Google Scholar] [CrossRef]
- Chen, S.; Lu, F.; Wang, X.K. Estimation of greenhouse gases emission factors for China’s nitrogen, phosphate, and potash fertilizers. Acta Ecol. Sin. 2015, 35, 6371–6383. (In Chinese) [Google Scholar]
- Huang, J.X.; Chen, Y.Q.; Sui, P.; Gao, W.S. Estimation of net greenhouse gas balance using crop- and soil-based approaches: Two case studies. Sci. Total Environ. 2013, 456, 299–306. [Google Scholar] [CrossRef]
- The Intergovernmental Panel on Climate Change (IPCC). 2006 IPCC Guidelines for National Greenhouse Gas Inventories (5 Volumes). Available online: https://www.ipcc-nggip.iges.or.jp/public/2006gl/index.html (accessed on 30 August 2019).
- Myhre, G.; Shindell, D.; Bréon, F.M.; Collins, W.; Fuglestvedt, J.; Huang, J.; Koch, D.; Lamarque, J.F.; Lee, D.; Mendoza, B.; et al. Anthropogenic and Natural Radiative Forcing; Cambridge University Press: Cambridge, UK; New York, NY, USA, 2013. [Google Scholar]
- United Nations (UN). World Population Prospects 2017—United Nations Population Division. 2017. Available online: https://population.un.org/wpp/DataSources/ (accessed on 30 August 2019).
- Ministry of Agriculture and Rural Affairs of the People’s Republic of China (MARA). National Plan for Adjustment of Planting Sector Structure during 2016–2020. 2016. Available online: http://www.gov.cn/xinwen/2016-04/28/content_5068722.htm (accessed on 30 August 2019).
- Ministry of Agriculture and Rural Affairs of the People’s Republic of China (MARA). Action Plan for Zero Growth in Fertilizer and Pesticide Use by 2020. 2015. Available online: http://jiuban.moa.gov.cn/zwllm/tzgg/tz/201503/P02 015031850888920671 3.ceb (accessed on 30 August 2019).
- Ju, X.T. The concept and meanings of nitrogen fertilizer availability ratio–Discussing misunderstanding of traditional nitrogen use efficiency. Acta Pedol. Sin. 2014, 51, 921–933. (In Chinese) [Google Scholar]
- Department of Price in National Development and Reform Commission of China (DPNDRC). 2000–2016 Compilation of the National Agricultural Costs and Returns; China Statistics Press: Beijing, China, 2016.
- Writing Committee for Price Yearbook of China (WC-PYC). Price Yearbook of China; China Prices Press: Beijing, China, 2011. [Google Scholar]
- Quéré, C.L.; Andrew, A.; Canadell, J.G.; Sitch, S.; Korsbakken, J.I.; Peters, P.; Manning, A.; Boden, T.A.; Tans, P.P.; Houghton, R.A. Global Carbon Budget 2016. Earth Syst. Sci. Data 2016, 7, 521–610. [Google Scholar]
- Yang, L.; Jingyun, Z.; Quansheng, G.E.; Fang, W. China’s greenhouse gas emissions in low-carbon planning and contribution to global reductions. Resour. Sci. 2017, 39, 2399–2407. (In Chinese) [Google Scholar]
- Duan, H.P.; Zhang, Y.; Zhao, J.B.; Bian, X.M. Carbon Footprint Analysis of Farmland Ecosystem in China. J. Soil Water Conserv. 2011, 25, 203–208. [Google Scholar]
- Zhen, W.; Qin, Q.; Wei, Y. Spatio-temporal patterns of energy consumption-related GHG emissions in China’s crop production systems. Energ. Policy 2017, 104, 274–284. [Google Scholar] [CrossRef]
- Zhang, W.; Yu, Y.; Huang, Y.; Li, T.; Wang, P. Modeling methane emissions from irrigated rice cultivation in China from 1960 to 2050. Glob. Chang. Biol. 2011, 17, 3511–3523. [Google Scholar] [CrossRef]
- Xu, X.; Ying, L. A Comparative Study on Carbon Footprints between Plant- and Animal-based Foods in China. J. Clean. Prod. 2016, 112, 2581–2592. [Google Scholar] [CrossRef]
- Günther, J.; Thevs, N.; Gusovius, H.R.; Sigmund, I.; Brückner, T.; Beckmann, V.; Abdusalik, N. Carbon and phosphorus footprint of the cotton production in Xinjiang, China, in comparison to an alternative fibre (Apocynum) from Central Asia. J. Clean. Prod. 2017, 148, 490–497. [Google Scholar] [CrossRef]
- Liu, C.; Yao, Z.; Wang, K.; Zheng, X.; Li, B. Net ecosystem carbon and greenhouse gas budgets in fiber and cereal cropping systems. Sci. Total Environ. 2019, 647, 895–904. [Google Scholar] [CrossRef]
- Cheng, K.; Yan, M.; Nayak, D.; Pan, G.X.; Smith, P.; Zheng, J.F.; Zheng, J.W. Carbon footprint of crop production in China: An analysis of National Statistics data. J. Agric. Sci.-Camb. 2015, 153, 422–431. [Google Scholar] [CrossRef]
- Zou, X.X.; Zhang, X.J.; Wang, Y.F.; Wang, M.L. Carbon footprint of wheat-summer direct-seeding peanut planting system in Shandong Pro-vince, China. Chin. J. Appl. Ecol. 2018, 29, 850–856. (In Chinese) [Google Scholar]
- Casolani, N.; Pattara, C.; Liberatore, L. Water and Carbon footprint perspective in Italian durum wheat production. Land Use Policy 2016, 58, 394–402. [Google Scholar] [CrossRef]
- Pittelkow, C.M.; Zorrilla, G.; Terra, J.; Riccetto, S.; Macedo, I.; Bonilla, C.; Roel, A. Sustainability of rice intensification in Uruguay from 1993 to 2013. Glob. Food Secur. 2016, 9, 10–18. [Google Scholar] [CrossRef]
- Vetter, S.H.; Sapkota, T.B.; Hillier, J.; Stirling, C.M.; Macdiarmid, J.I.; Aleksandrowicz, L.; Green, R.; Joy, E.J.M.; Dangour, A.D.; Smith, P. Greenhouse gas emissions from agricultural food production to supply Indian diets: Implications for climate change mitigation. Agric. Ecosyst. Environ. 2017, 237, 234–241. [Google Scholar] [CrossRef] [PubMed]
- Singh, R.J.; Ahlawat, I.P.S. Energy budgeting and carbon footprint of transgenic cotton–wheat production system through peanut intercropping and FYM addition. Environ. Monit. Assess. 2015, 187, 282. [Google Scholar] [CrossRef] [PubMed]
- García, C.A.; García-Treviño, E.S.; Aguilar-Rivera, N.; Armendáriz, C. Carbon footprint of sugar production in Mexico. J. Clean. Prod. 2016, 112, 2632–2641. [Google Scholar] [CrossRef]
- Forleo, M.B.; Palmieri, N.; Suardi, A.; Coaloa, D.; Pari, L. The eco-efficiency of rapeseed and sunflower cultivation in Italy. Joining environmental and economic assessment. J. Clean. Prod. 2018, 172, 3138–3153. [Google Scholar] [CrossRef]
- Bai, X.; Dawson, R.J.; Urge-Vorsatz, D.; Delgado, G.C.; Barau, A.S.; Dhakal, S.; Dodman, D.; Leonardsen, L.; Masson-Delmotte, V.; Roberts, D.; et al. Six research priorities for cities and climate change. Nature 2018, 555, 19–21. [Google Scholar] [CrossRef]
- Martinez-Melendez, L.A.; Bennett, E.M. Trade in the US and Mexico helps reduce environmental costs of agriculture. Environ. Res. Lett. 2016, 11, 55004. [Google Scholar] [CrossRef]
- Zhou, Y.; Bao, M.; Chen, X.; Xu, X. Co-op advertising and emission reduction cost sharing contracts and coordination in low-carbon supply chain based on fairness concerns. J. Clean. Prod. 2016, 133, S1991410654. [Google Scholar] [CrossRef]
- China Agricultural Outlook Conference (CAOC). China Agricultural Outlook Report (2016–2025). 2016. Available online: http://www.agri-outlook.cn/aoc/2016aoc/cn/aocreport.html (accessed on 30 August 2019).
- Wang, Z.B.; Wang, M.; Yin, X.G.; Zhang, H.L.; Chu, Q.Q.; Wen, X.Y.; Chen, F. Spatiotemporal change characteristics of heat and rainfall during the growth period of winter wheat in North China Plain from 1961 to 2010. China Agric. Univ. Sci. 2015, 20, 16–23. [Google Scholar]
- Smith, P.; Martino, D.; Cai, Z.; Gwary, D.; Janzen, H.; Kumar, P.; McCarl, B.; Ogle, S.; Mara, F.O.; Rice, C.; et al. Sustainable Agriculture II Greenhouse Gas Mitigation in Agriculture. Philos. Trans. Biol. Sci. 2008, 369, 789–813. [Google Scholar] [CrossRef]
- Carrillo Cobo, M.T.; Camacho Poyato, E.; Montesinos, P.; Rodríguez Díaz, J.A. New model for sustainable management of pressurized irrigation networks. Application to Bembézar MD irrigation district (Spain). Sci. Total Environ. 2014, 473–474, 1–8. [Google Scholar] [CrossRef] [PubMed]
- Chai, Q.; Qin, A.; Gan, Y.; Yu, A. Higher yield and lower carbon emission by intercropping maize with rape, pea, and wheat in arid irrigation areas. Agron. Sustain. Dev. 2014, 34, 535–543. [Google Scholar] [CrossRef]
- Gan, Y.; Liang, C.; Chai, Q.; Lemke, R.L.; Campbell, C.A.; Zentner, R.P. Improving farming practices reduces the carbon footprint of spring wheat production. Nat. Commun. 2014, 5, 5012. [Google Scholar] [CrossRef] [PubMed]
- Samarappuli, D.; Berti, M.T. Intercropping forage sorghum with maize is a promising alternative to maize silage for biogas production. J. Clean. Prod. 2018, 194, 515–524. [Google Scholar] [CrossRef]
- Chen, X.; Cui, Z.; Fan, M.; Vitousek, P.; Zhao, M.; Ma, W.; Wang, Z.; Zhang, W.; Yan, X.; Yang, J.; et al. Producing more grain with lower environmental costs. Nature 2019, 514, 486–489. [Google Scholar] [CrossRef] [PubMed]
- Gao, B.; Huang, T.; Ju, X.; Gu, B.; Huang, W.; Xu, L.; Rees, R.M.; Powlson, D.S.; Smith, P.; Cui, S. Chinese cropping systems are a net source of greenhouse gases despite soil carbon sequestration. Glob. Chang. Biol. 2018, 24, 5590–5606. [Google Scholar] [CrossRef] [PubMed]


| Agricultural Inputs | Units | Coefficient | Reference |
|---|---|---|---|
| N fertilizer (N) | kg CO2-eq kg−1 | 2.12 | Chen et al. [24] |
| P fertilizer (P2O5) | kg CO2-eq kg−1 | 0.64 | Chen et al. [24] |
| K fertilizer (K2O) | kg CO2-eq kg−1 | 0.18 | Chen et al. [24] |
| Compound fertilizer | kg CO2-eq kg−1 | 1.77 | Huang et al. [19] |
| Animal manure | kg CO2-eq kg−1 | 0.19 | Zhang et al. [13] |
| Diesel 1 | kg CO2-eq kg−1 | 3.93 | Huang et al. [25] |
| Pesticide | kg CO2-eq kg−1 | 13.7 | Huang et al. [19] |
| Electricity | kg CO2 kwh−1 | 1.23 | Huang et al. [19] |
| Agricultural film | kg CO2-eq kg−1 | 22.70 | Huang et al. [19] |
| Order | Scenarios | Description |
|---|---|---|
| A | Population change | Total population in China would be 1.44 billion in 2020 [28]. |
| B | Improved crops structure | Rice 30.0 million ha, wheat 24.0 million ha, maize, 33.3 million ha, soybean 9.3 million ha, peanut 4.7 million ha, oilseed rape 6.7 million ha, sugarcane 1.4 million ha, sugar-beet 20.0 thousand ha, cotton 3.3 million ha, tobacco 858.3 thousand ha, data unavailable for mulberry [12,29]. |
| C | Reduced fertilizer input | Use efficiency of mineral fertilizer reaches to more than 40% [30]. |
| D | Integrated livestock-cropping approach | Nutrient returning rate of animal manure increases by 10% [30]. |
| E | Increase biodiversity | Utilization rate of pesticides increases by about 5% [30]. |
| Crop Category | 2000 | 2005 | 2010 | 2016 | Change 1 | Proportion 2 | |
|---|---|---|---|---|---|---|---|
| 2000 | 2016 | ||||||
| Grain crop | 216.29 | 202.29 | 242.87 | 277.01 | 28.07% | 79.41% | 83.32% |
| Oil crop | 25.07 | 24.40 | 25.00 | 25.18 | 0.43% | 9.20% | 7.57% |
| Sugar crop | 5.80 | 6.03 | 7.86 | 6.63 | 14.27% | 2.13% | 1.99% |
| Other cash crop | 25.21 | 21.71 | 21.54 | 23.67 | −6.11% | 9.25% | 7.12% |
| Total | 272.37 | 254.44 | 297.27 | 332.48 | 20.07% | 100.00% | 100.00% |
| Scenario | Grain Crop | Oil Crop | Sugar Crop | Other Cash Crop | Total |
|---|---|---|---|---|---|
| A | 288.47 | 26.22 | 6.90 | 24.64 | 346.19 |
| B | 246.19 | 27.15 | 6.02 | 22.54 | 301.90 |
| C | 257.73 | 23.49 | 6.09 | 22.67 | 309.98 |
| D | 275.68 | 25.03 | 6.61 | 23.58 | 330.90 |
| E | 275.92 | 25.03 | 6.60 | 23.56 | 331.11 |
| A×B | 256.34 | 28.27 | 6.27 | 23.47 | 314.34 |
| A×C | 268.35 | 24.46 | 6.34 | 23.60 | 322.76 |
| A×D | 287.05 | 26.06 | 6.88 | 24.55 | 344.54 |
| A×E | 287.29 | 26.06 | 6.87 | 24.53 | 344.75 |
| A×B×C | 255.29 | 28.10 | 6.23 | 23.36 | 312.99 |
| A×B×D | 255.12 | 28.10 | 6.25 | 23.39 | 312.86 |
| A×B×E | 238.57 | 26.39 | 5.75 | 22.45 | 293.15 |
| A×B×C×D×E | 236.47 | 26.08 | 5.70 | 22.26 | 290.51 |
| 2016 | 277.01 | 25.18 | 6.63 | 23.67 | 332.48 |
| Crops | Value | Unit | Country | References |
|---|---|---|---|---|
| Wheat | 2.34 | t CO2-eq ha−1 | Italy | [44] |
| 1.06 | t CO2-eq ha−1 | Uruguay | [45] | |
| 1.03 | t CO2-eq ha−1 | India | [46] | |
| 2.66 | t CO2-eq ha−1 | China | This study 1 | |
| Maize | 5.41 | t CO2-eq ha−1 | Argentine | [17] |
| 2.32 | t CO2-eq ha−1 | China | This study 1 | |
| Rice | 3.04 | t CO2-eq ha−1 | China | This study 1 |
| Peanut | 1.06 | t CO2-eq ha−1 | India | [47] |
| 3.93 | t CO2-eq ha−1 | China | [43] | |
| 1.85 | t CO2-eq ha−1 | China | This study 1 | |
| Soybean | 2.18 | t CO2-eq ha−1 | Argentine | [17] |
| 0.22 | t CO2-eq ha−1 | China | [42] | |
| 0.73 | t CO2-eq ha−1 | China | This study 1 | |
| Oilseed rape | 1.42 | t CO2-eq ha−1 | Italy | [49] |
| 1.45 | t CO2-eq ha−1 | China | This study 1 | |
| Sugarcane | 3.44 | t CO2-eq ha−1 | Mexico | [48] |
| 4.27 | t CO2-eq ha−1 | China | This study 1 | |
| Sugar-beet | 2.97 | t CO2-eq ha−1 | China | This study 1 |
| Cotton | 1.30 | t CO2-eq ha−1 | India | [47] |
| 3.27 | t CO2-eq ha−1 | China | [22] | |
| 4.60 | t CO2-eq ha−1 | China | [41] | |
| 4.27 | t CO2-eq ha−1 | China | This study 1 | |
| Tobacco | 4.72 | t CO2-eq ha−1 | China | This study 1 |
| Mulberry | 4.62 | t CO2-eq ha−1 | China | This study 1 |
© 2019 by the authors. Licensee MDPI, Basel, Switzerland. This article is an open access article distributed under the terms and conditions of the Creative Commons Attribution (CC BY) license (http://creativecommons.org/licenses/by/4.0/).
Share and Cite
Wang, X.; Chen, Y.; Chen, X.; He, R.; Guan, Y.; Gu, Y.; Chen, Y. Crop Production Pushes up Greenhouse Gases Emissions in China: Evidence from Carbon Footprint Analysis Based on National Statistics Data. Sustainability 2019, 11, 4931. https://doi.org/10.3390/su11184931
Wang X, Chen Y, Chen X, He R, Guan Y, Gu Y, Chen Y. Crop Production Pushes up Greenhouse Gases Emissions in China: Evidence from Carbon Footprint Analysis Based on National Statistics Data. Sustainability. 2019; 11(18):4931. https://doi.org/10.3390/su11184931
Chicago/Turabian StyleWang, Xiaolong, Yun Chen, Xiaowei Chen, Rongrong He, Yueshan Guan, Yawen Gu, and Yong Chen. 2019. "Crop Production Pushes up Greenhouse Gases Emissions in China: Evidence from Carbon Footprint Analysis Based on National Statistics Data" Sustainability 11, no. 18: 4931. https://doi.org/10.3390/su11184931
APA StyleWang, X., Chen, Y., Chen, X., He, R., Guan, Y., Gu, Y., & Chen, Y. (2019). Crop Production Pushes up Greenhouse Gases Emissions in China: Evidence from Carbon Footprint Analysis Based on National Statistics Data. Sustainability, 11(18), 4931. https://doi.org/10.3390/su11184931