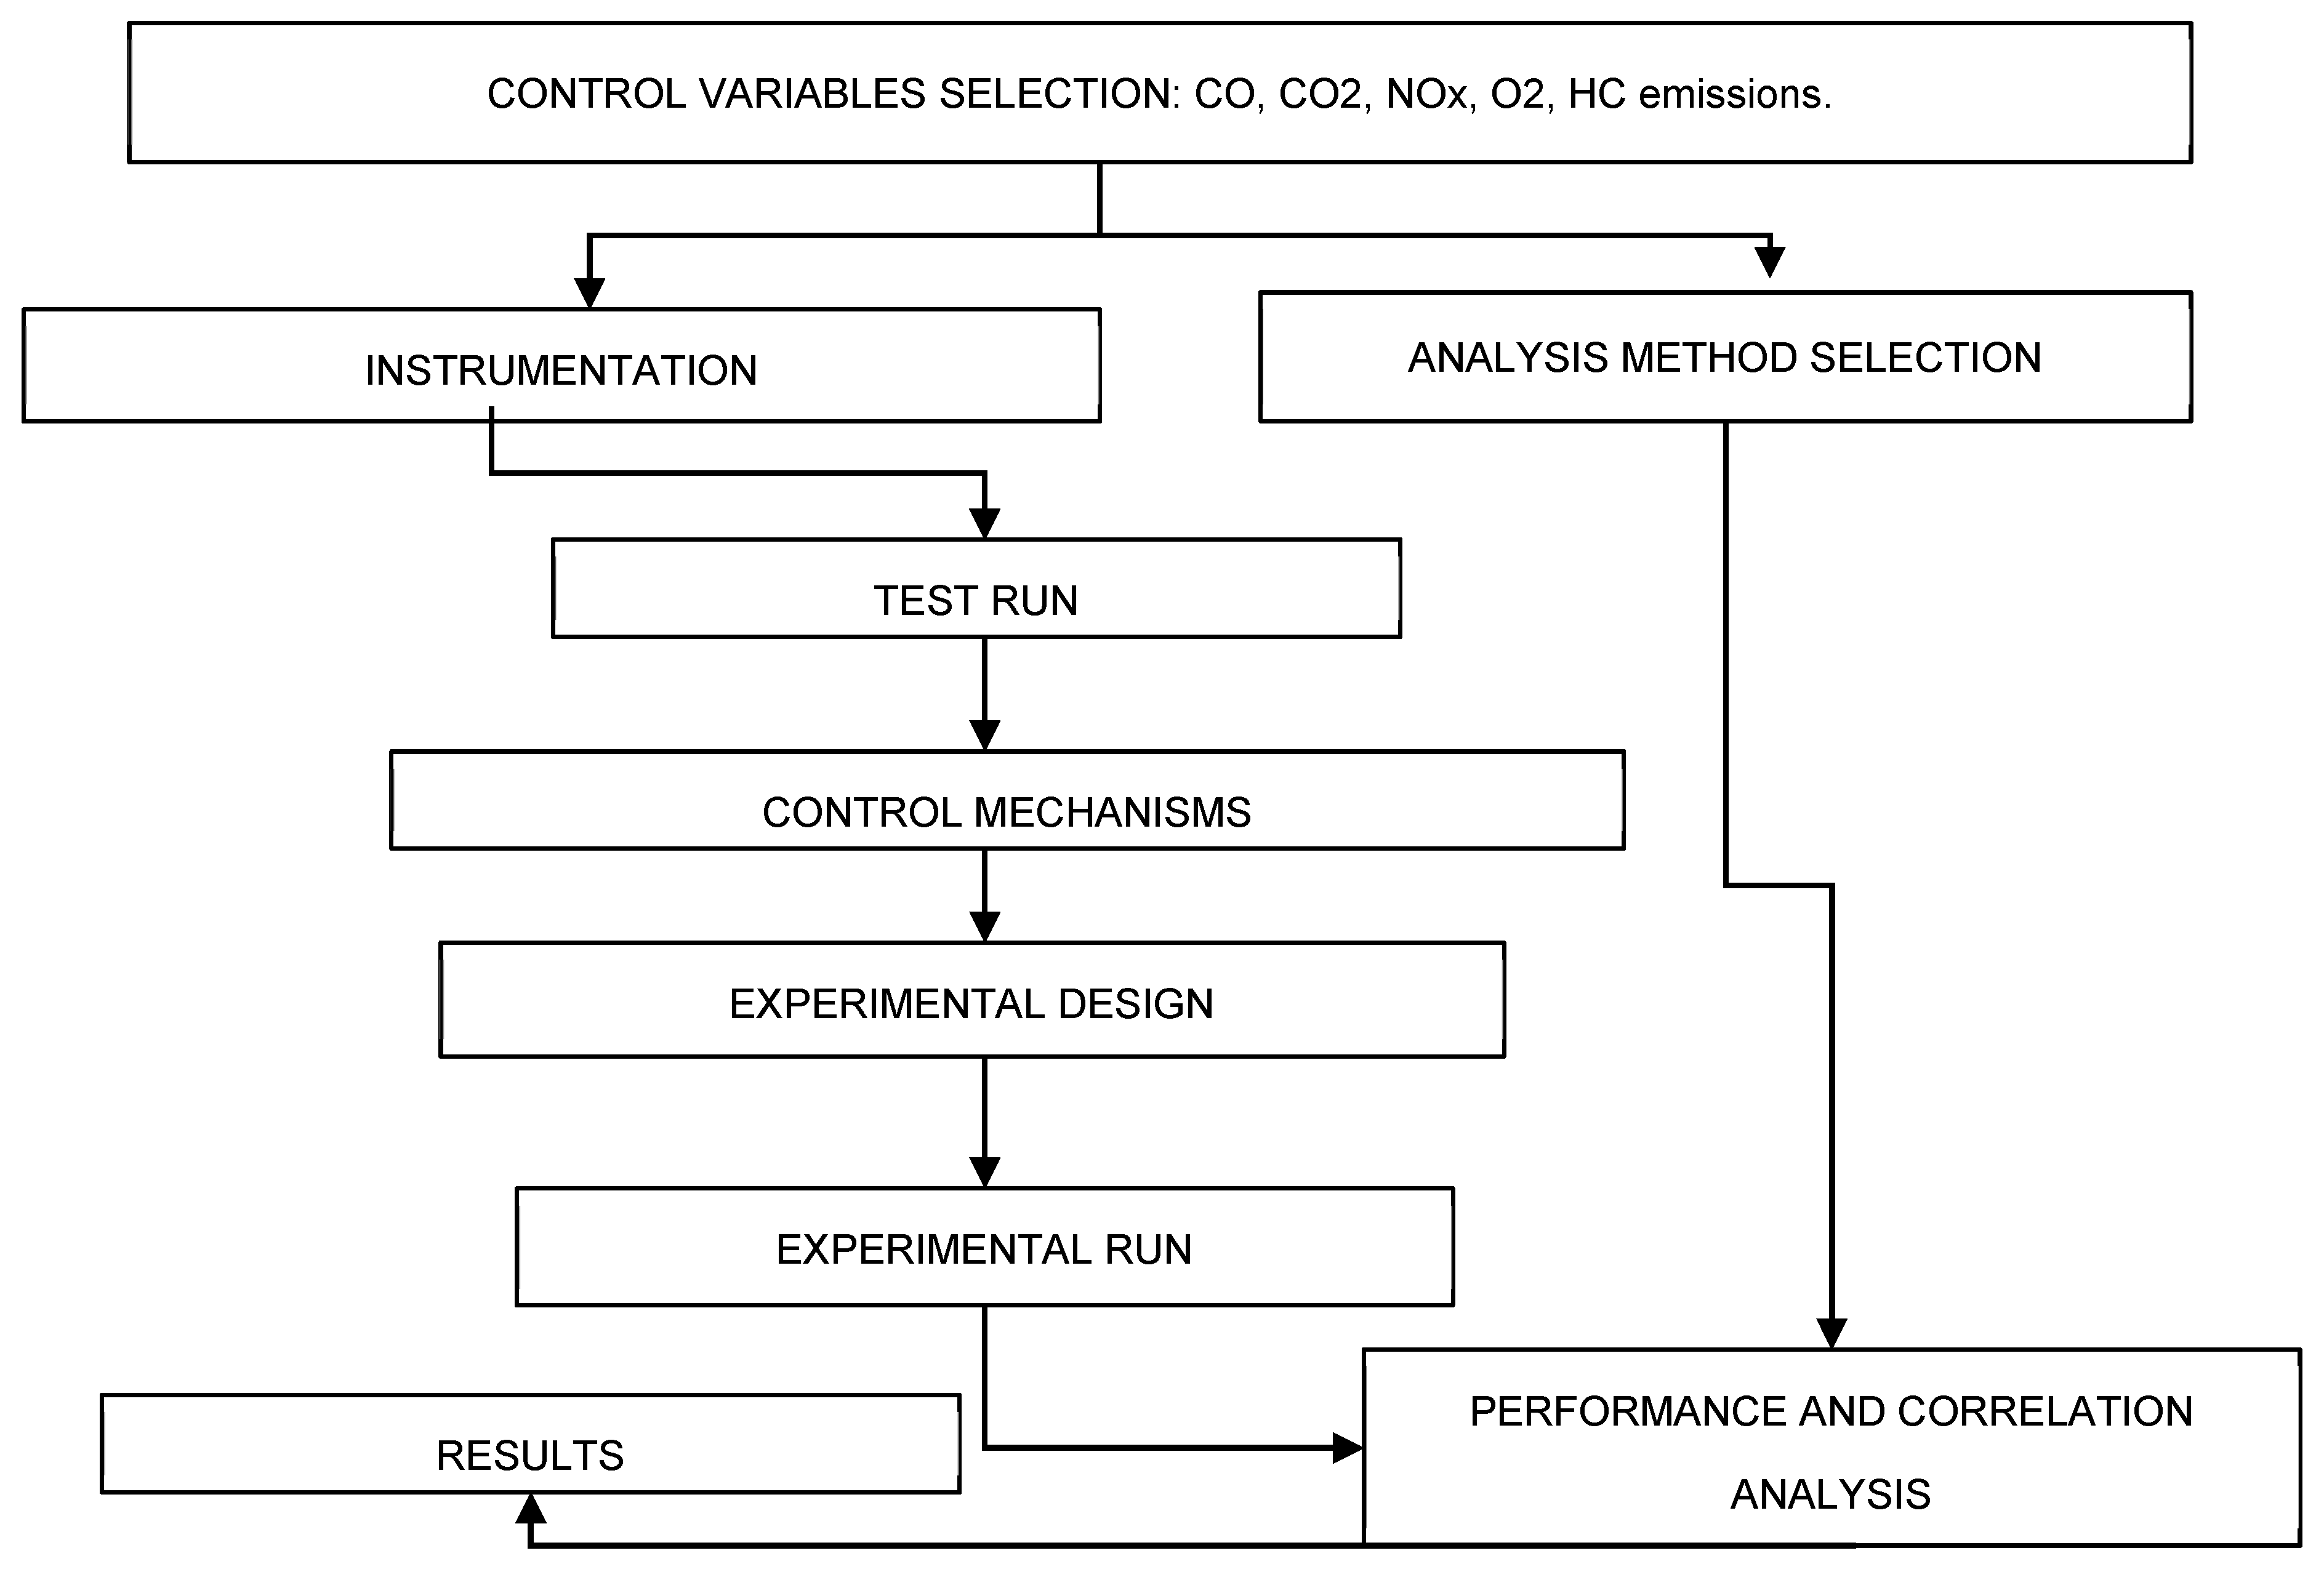
Article

Performance Analysis of a Compression Ignition Engine Using Mixture Biodiesel Palm and Diesel

by
Fabián Vargas
1,
Armando Pérez
2,*,
Rene Delgado
2,
Emilio Hernández
2 and
José Alejandro Suástegui
3
1
Facultad de Ingeniería, Departamento de Mecánica, Institución Universitaria Pascual Bravo, Apartado Aéreo, 6564 calle 73 No.73A- 226, Medellín, Colombia
2
Escuela de Ciencias de la Ingeniería y Tecnología, Universidad Autónoma de Baja California, Blvd, Universitario #1000, Unidad Valle de las Palmas, Baja California CP. 21500, Tijuana, Mexico
3
Facultad de Ingeniería, Universidad Autónoma de Baja California, Calle de la Normal s/n, Col. Insurgentes Este C.P. 21280, Mexicali, Mexico
*
Author to whom correspondence should be addressed.
Sustainability 2019, 11(18), 4918; https://doi.org/10.3390/su11184918
Submission received: 14 May 2019 / Revised: 30 June 2019 / Accepted: 5 July 2019 / Published: 9 September 2019
(This article belongs to the Special Issue Advances in Renewable Energy Technologies for Sustainability)

Abstract

:
The present investigation analyzes the performance of a Hatz diesel engine that has 912 cubic centimeters (cc), stationary type, two cylinders, an air cooled feature and B10 (90% diesel and 10% palm biodiesel), using a test bench to improve statistically the repeatability and reproducibility of the runs. The experimental reference tests were carried out under defined conditions at a fixed speed of 1800 revolutions per minute (rpm) and four load levels: 35%, 50%, 65% and 80%. The repeatability analysis was based on the technical standard NTC-ISO / IEC17025. The variables of torque, fuel consumption (FC), air consumption (AC) and exhaust gas temperatures (EGT) showed an increase related with the load increase, showing a lower variation of AC and emissions. With the mechanism’s implementation of attenuator of air blows, adjustment mechanism for rpm and preheating air chamber for intake manifold, it was observed that the rpm presented the lowest statistical variability. The variables that presented the highest Pearson correlation with respect to the FC are the CO2, NOX and O2, this is because the engine does not have the Common Rail system, which causes the fuel supply to not be injected accurately and uniformly, therefore the evaluation of performance of the engine could not be repeatable.

Graphical Abstract

1. Introduction

Nowadays, energy usage is prodigious, and is a significant key factor for the advancement of a nation. At the same time, the scarcity of energy has become an economic threat for the development of nations around the world [1]. The demand for energy has been ever increasing since the establishment of human society. In recent years, the demand for energy has been steadily increasing due to growth of population and industrial development. At present, fossil fuels (coal, petroleum, and natural gas) are the main sources of energy because of their high calorific values, good anti-knocking properties, and high heating values; meanwhile, reserves are limited. Therefore, the development of renewable and new energies resources can lower the depletion of fossil fuel by reducing their consumption [1,2]. On the other hand, the world’s warming condition is increasing every day. Atmospheric CO2 has already exceeded the dangerous level 10 years earlier than had previously been predicted [3]. Furthermore, the depletion of fossil fuels and extreme change of climate have driven the search for alternative energies and renewable energy sources that can meet the world’s energy demand, reduce greenhouse gas emissions, curb pollution, and maintain the planet’s temperature at a stable level [4].
In the literature, there is broad consensus that biodiesels and their blends have a direct application in internal combustion engines. Studies conducted on stationary diesel engines show that biodiesels can replace conventional diesel fuel and achieve similar engine performance, as an alternative, without major engine modification [5]. As an alternative fuel biodiesel is the better choice because of the capability of reducing greenhouse gas emissions. Biodiesel is biodegradable, renewable and non-toxic which have huge potential to be a part of a sustainable energy mixes in the future [2]. Globally, annual biodiesel production increased from 7.5 billion liters in 2006 to 35 billion liters in 2016 and biodiesel consumption is projected to increase from 32,000 million liters in 2016 to 41,000 million liters in 2019 [6].
When we experiment with diesel engines in controlled environments, several situations arise, which must be considered when analyzing the parameters and the variables of the results obtained to make sure that the tests results can be treated in a reliable way. A scientific and statistical way to identify such situations or factors is through the analysis of repeatability and reproducibility results [7]. Repeatability allows us to determine whether the statistical variation of the measurements is attributable to the measurement instrument itself, to the observer, to the place and the conditions, is insignificant or negligible. Therefore, the data obtained will be practically identical [8]. In other words, it lets us perform the experiment and obtain similar results, minimizing the error attributable to the mentioned factors.
Reproducibility implies that if the methods, measurement instruments, place and conditions of the test change, similar measured values will be obtained, since said values should depend solely on the control or handling of the intrinsic variable to the device, which in this case, are parameters of a biodiesel engine [9]. The above is relevant to determining the reliability of the instrumentation used, as well as the results obtained, depending on the conditions under which each of the tests is carried out [10]. Under identical circumstances, an experiment is expected to present identical, or at least very similar, results. However, sometimes, when conditions change, results are presented with significant differences, some attributable to controllable factors, while others may be uncontrolled, either because they are inherent to the process itself, or due to unavoidable errors because of the resolution, or the quality of the equipment used. It is at this initial point of experimentation, where the preliminary analysis of the data obtained must be carried out, with statistical tools, to make the necessary corrections in the instrumentation, and minimize the significant differences that are present in the results [11].
Regarding to the interpretation of the information obtained as a result of the experiments allowing to determine the level of reliability of the results, that is, determine if the data are within the accepted range statically. If there is variation in the information obtained, this can be attributed to factors such as: the operator’s equipment, the used equipment, the calibration method equipment, environmental conditions such as relative humidity, ambient temperature and air composition, among others [12] The analysis of the results obtained with the instruments of measurement and control, in an experimental design, allows us to determine the relevance or contribution of the different factors in the variation of the results. That lets us establish better controls on the factors that cause such changes or variations.
Among the methods for the analysis of repeatability, there is the method of averages and ranges, which is the method used by the technical standard NTC-ISO / IEC 17025 [13] to ensure the quality of the results obtained are applicable for laboratory tests, calibration and the degree of equipment uncertainty. In terms of accuracy, the results of the tests must show values close to the reference value, in this way, the accuracy of a test method can be determined, expressing it in terms of repeatability of the experiment. To achieve greater accuracy, and therefore, the repeatability of the test, it is necessary to maintain the conditions of the factors reasonably constant and controlled, so the contribution of these variations is minimized, and is not significant for the results variability [14]. Therefore, the objective is to achieve the setup process reproducible, even if factors like the observer, the measuring instrument, standard reference, place, time, principle or methods are changed [15].
Given these conditions, if the variability is not significant in the results, then we will have a repeatable and reproducible experiment, for the parameters of interest. For the repeatability and reproducibility analysis, experimentation was carried out with a 912 cc HATZ direct injection diesel engine, without a stationary Common-Rail system, that is air-cooled and operated under defined and controlled conditions, in order to determine the variability of the data, and define the level of reliability of the results. To achieve this, the ANOVA method and the average and range method were used [16,17,18,19], which showed significant statistical variability of the results obtained in the SPSS software [20].

2. Materials and Methods

The use of biodiesel had showed an increased specific fuel consumption (SFC) when compared with diesel, and as exceptions some biodiesels feedstock like soybean, sunflower and beef tallow have shown smaller specific fuel consumption than the diesel. In general, biodiesel used in an engine generator can replace the diesel without significant losses and provides engine efficiency gains of 2%–4%, while other results have shown that an engine generator that uses soybean and sunflower biodiesels is more efficient than one that uses diesel oil [21]. The effects of using a biodiesel on engines like generators and its components is important due to the performance and lifetime of the engine. Biodiesel can be aggressive when some soft metals like Cu and Pb are included in them as components, also the buildup of deposits on pistons can be a problem without appropriate maintenance. The use of B5-B50 can reduce the disadvantages of biodiesels and its negative effects, while increasing advantages and benefits like lubrication that occur because dilution didn´t impose significant effects on the engine and its components [22]. Biodiesel presents some disadvantages compared with diesel, like engine oxidation in some parts, when B100 is greater than the diesel. Also biodiesel has solvent properties which help to wash out deposits and dissolved materials. For small engines that have prolonged use in hard conditions, palm oil biodiesel B100 can be efficiently and effectively used as an alternate fuel for small engines used in mechanical work or as a generator, considering that maintenance is very important in the long term [23]. Due the negative aspects of using biodiesel in compression engines, it is necessary to improve the characteristics and physico-chemical properties of these alternative fuels to reduce their negative effects in engine components [24].
There are several oilseeds such as palm, hazelnut, sunflower, jatropha and castor oil that can be used to produce biodiesel [25,26]. Palm oil is one of the most commonly used oils worldwide to produce biodiesel [27]. Due to the geographical areas where the palm grows, we obtained specific types of palm oil and biodiesel, see Table 1 [28]. Palm oil has demonstrated a viability performance for combustion engines in diesel-biodiesel mixtures and reasonable results with palm oil [29]. Table 2 shows the properties and composition of the material used for conversion into B10 [30,31]. The fuel used for the tests was B10 (90% diesel and 10% palm biodiesel) and was acquired from the Texaco Company in Colombia, where all diesel contains 10% palm biodiesel [32]. The B10 mixture was characterized by the Laboratory of Petrols of the National University, Medellin, Colombia, obtaining the physical properties of fuel showed in Table 2, which presents the chemical composition of C15.037 H29.410 O 0.197, 1.2% oxygen weight, and a low calorific power (LCP) of 42.9 (kJ/kg).
Figure 1 shows the methodology used in the development of the work that was carried out. This proposal considering that the setup and instrumentation of the engine has not yet been determined to comply with the requirements of the norm NTC-ISO / IEC 17025 [13]. The methodology was proposed with a reference test stage to observe the behavior of the measured variables and the mounted system. Subsequently, the setup phase was established to improve the measurement of the variables of interest, and finally the validation phase of the improved setup using the statistical method for repeatability and reproducibility.

2.1. Selection of Control Variables

A stationary diesel engine brand HATZ of 912 cc, of two cylinders, direct injection and normal aspiration, coupled to a hydraulic dynamometer brake made by GO-POWER SYSTEM, was used as experimental test equipment, the working variables are shown in Table 3.
The variables used to evaluate the performance were the exhaust gas temperature, engine coolant temperature, torque measured with the brake, emissions and the engine speed in rpm. The data obtained with the instrumentation correspond to an engine located in the thermal machine laboratory of the University of Antioquia, Colombia. The above with the purpose of evaluating the energy performance of the engine in operation, using biodiesel fuel, and measuring the emissions resulting from the combustion of the engine. In the combustion process of a diesel engine, there are operating variables that may or may not be controllable such as engine size, compression ratio, speed, torque, and fuel type. The regime, torque and type of fuel were controlled as fixed operating conditions, while the environmental conditions are non-controlled variables, such as temperature and relative humidity [33].
The use of biodiesel in studies has been reported to cause a decrease in CO emissions; the U.S. Environmental Protection Agency (EPA) showed a nearly 50% reduction of CO emissions for pure biodiesel [34]. Compared with the petro-diesel, the average reduction of CO emissions was reported to be 43%, depending on operating conditions [29]. Out of the factors that influence the NOx emissions, the biodiesel composition is the most remarkable, as well as others such as the flame temperature, oxygen availability, fuel spray characteristics and engine design. According to a study developed in Colombia in 2011 by the Colombian-Swiss consortium CUE and financed by the Inter-American Development Bank (IDB) and the Ministries of Mines and Energy, Agriculture and Rural Development, as well as the Environment and Sustainable Development (MADS), based in a life cycle analysis, the Greenhouse Gas (GHG) reduction caused by Colombian palm biodiesel is between 83% and 108% of emissions compared to fossil fuel, while with the use of current blends, biofuels are contributing to reduce carbon emissions by 2.5 million tons/year. Between 1990 and 2010, the global transport sector has emitted 165 million tons to 220 million of GHG, constituting 32.6% of such emissions [35]. It is necessary to consider the importance of biofuels in a country’s energy matrix, since it contributes to improving the quality of the fuels consumed in the country when using a higher octane number of ethanol and cetane palm, which in turn contributes to energy security and the development of the agricultural sector [36]. The use of biofuels has contributed to the expansion of the agricultural frontier in the last 15 years, with 165,000 new hectares of crops being used as the raw material for the processing plants [35].

2.2. Selection of Analysis Method

In order to evaluate the experiment’s repeatability, tests analysis was performed with the stationary diesel engine while considering analysis of variance (ANOVA). Given that the method must be appropriate for the type of experiment and the level of precision desired, ANOVA method and the Pearson correlation were selected, which are suitable to determining the performance, repeatability and reproducibility (R&R) of an experiment [37].
For ANOVA analysis, a regression model was used, as shown in Table 4. Before improvement, there were three samples for each of the load cases (35%, 50%, 65% and 80%). After that, the ANOVA was performed for the data after improvement in the engine set up, that consisted in twelve experiments and three samples. The regression ANOVA analysis let us analyze data for each separate variable and determine the effect of the improvement on each variable [38]. The sum of squares is shown in Equation (1).
S S T = S S R + S S
For the evaluation of the variance (ANOVA) the statistical program SPSS was used, which allows us to obtain the average values and range of the processed data, and the analysis of variance [39]. For each variable the p VALUE was obtained, and the R&R (repeatability and reproducibility) variability was determined through the ANOVA, where those p values greater than 0.05 represent the Statistically Not Significant Difference for a confidence level of 95%, while the p values less than 0.05 represent the Statistically Significant Difference of the measured values for each variable given a confidence level of 95% [40].
The Pearson correlation analysis allows us to identify the effect of an input variable on an output. In the case of the Pearson correlation, such a variable can be between −1 and 1; if the data have a downward trend it has a negative value and if the data have an ascending behavior, the value is positive [20]. Pearson’s escalation allows the correlation between the variables to be identified, with values closer to 1/−1 being an indicator of greater correlation and values close to 0 being those with the lowest correlation.

2.3. Instrumentation

The variables of interest in the experiment were instrumented with the following equipment: for the consumption of fuel, an electronic balance with precision of 0.1g was used, so that the fuel consumption was determined by the given period of operation of the engine. To determine the mass flow of air consumed by the engine for the combustion process, a Thermatel TA2 Mass Flow hot wire sensor was used [41], as shown in Table 5.
For the measurement of NOx gases, the portable model Horiba EXSA 240cl was used using hot chemiluminescence as the operating method [42]. This equipment also provides the reading of oxygen (O2), present in the exhaust stream using an electrochemical cell. The Table 6 show the parameters of equipment.
To quantify the CO, CO2, O2 and NO gases, the VL Dicom 400 equipment was used, basically with two methods: infrared for the detection of CO and CO2 gases, and electrochemical methods for the O2 and NO gases. Table 7 shows the specific parameters of the equipment [43].
To measure the engine revolutions, a 60-tooth disc was used, which is coupled to the hydraulic brake and a Hall Effect electronic sensor with digital screen and resolution of 5 RPM, see Table 8.
The measurements were acquired using the TONE tool V1.1, which is a virtual instrument programmed in LABVIEW version 10.0 by the GIMEL Group of the University of Antioquia, as shown in Figure 2.
For the initial test of the experimental setting, the conditions of temperature and humidity (uncontrolled) oscillated between 23–30 °C and 43%–85% humidity respectively. To start the testing bench, a motor heating period of 30–40 min was established in order to have thermal stability of the motor and brake components [44]. The tests were carried out randomly with respect to the days in which the measurements were carried out, and in the same way the schedule for the tests was carried out at different hours of the day. This was done in order to determine the variability of the measured data under different conditions and achieve the reproducibility of the testing bench [45].

3. Run Test

The test run of the motor, had the objective of showing variables sensitive to uncontrolled conditions by the testing bench settled up. Table 9 shows the values of the measurements made in the test run from which we start to adjust the controls of the variables. The test was carried out for load conditions of 35%, 50%, 65% and 80%, to establish adequate measures to control the factors that affect the variables. Three measurements were taken using 15 min intervals to identify the factors that affect the measurements. In Table 7, a direct relationship is observed between the increase in the load and its effect on the temperature of the combustion gases, torque and fuel consumption.
In Figure 3a–d, the distributions of the data of the initial test with the HATZ engine are shown, where a relatively small variability is observed given the magnitude that was measured and the scale of the measured data. Given the ANOVA statistical test, it was obtained that for the set of 12 measured data, the probability value p = 0.47 , therefore p > 0.05 and p < F c r i t where F = 0.92 and F c r i t = 4.06 . This meant that statistically the difference between the measured values was significant, so in terms of the testing bench, the measurement of the RPM variable is not reliable. There is a direct relationship between the load that the submitted engine, and the fuel consumption and air flow, as seen in Figure 4.
Given the initial test conditions in Figure 4, it was observed that there is a direct and proportional correlation between the fuel consumption of the engine and the exhaust temperature of the combustion gases, as well as the load effect which the engine tested has a direct impact on diesel consumption and therefore on combustion gases temperatures. It was also observed that the air consumption below 50% load is relatively high and higher compared to the consumption given a load of 80%, with the optimum range of lower air consumption between 50% and 65% load. The increase in air consumption for 80% of the load is due to the demand for energy generated by the load to which the engine is subjected. The high air consumption for the load of 35% is because the engine is below the efficiency zone (power vs. fuel consumption).
Figure 5 shows the comparison of the measured values against the desired value of the torque, however the measurements made show a variability with respect to the reference value, which is not significant if it is the measurements taken in the same test. The exhaust gas temperature increase in relation with the load increase and its value is greater than the reported diesel temperature, at about 302 °C [28].
In Figure 6a–d, it can be observed that for the behavior of the measured values in each test, the resulting torque is close to the desired torque for each case (17.5, 25, 32 and 40 Nm respectively). As for the statistical analysis of the torque variable, we determined that p = 9 × 10 13 so, since this value is much lower than the value 0.05, it is determined that the variations in the data in general are significant differences, which agrees with the variation of the load to which the engine is subjected, confirming the change of the torque variable according to the loads applied to the engine of 35%, 50%, 65% and 80% respectively.
Figure 7 shows a trend of increase in NOx and HC emissions, with respect to the increase in motor power demand. The NOx emissions are more than 1500 ppm for 80% load, which means that these emissions are greater than conventional diesel [28].
The Figure 8 indicates an increase in the emission of CO and CO2 when operating the engine under a constant regime and increases the loads, the O2 decreases due the increasing of power demand and the greater demand of fuel necessary to release the required power, the chemical balance shows that the combustion process requires a greater amount of O2.

Control Mechanisms

The improvement that was implemented the measurement of the variables in the test bench, was to evaluate and analyze the performance of the engine working under a constant regime of 2200 rpm and torque of 25 Nm. Based on the results of the initial test, the control of the engine cooling regime, load and air variables was improved, through the incorporation of control and adjustment mechanisms. In the measurement of air consumption for combustion, an attenuator of air blows was implemented, which were caused by the combustion process shown in Figure 9. A manual mechanism was also implemented to regulate the increase in the regime as shown in Figure 10, the feed air temperature of the inlet manifold was controlled in a preheating chamber by means of a regulated electric resistance at 30 °C as shown in Figure 11, to control the intake air temperature, due to the ambient temperature and relative humidity being relevant for the engine performance determination [46].
The air feeder attenuator chamber has the function of providing a constant velocity air supply, avoiding the acceleration of the air inlet-outlet due to the vacuum caused by the piston in the combustion chamber [47,48]. The throttle speed adjustment mechanism consists of a threading axle with fine pitch that provides more precise manual control of the throttle advance because it moves the position of the throttle with respect to the pitch of the thread. The air preheating chamber has the function of heating and maintaining the air entering the engine intake manifold at a constant temperature, using an electrical resistance to achieve a stable temperature of 30 °C at the time of entering the engine combustion chamber with the purpose of improving the control and reducing the effect on the output variables [49,50].

4. Experimental Design

For the experimental design of the test bench that was improved with the control mechanisms, it was determined to work under two control parameters to make the measurements of the variables of interest: the engine speed (RPM) is the first condition to fulfill and the second is the torque, in order to obtain the measurements under these same conditions of operation for the values of 2200 RPM and 25 Nm. For each of the 12 tests performed, three measurements were taken at 15-minute intervals while maintaining the same operating conditions. For the case of ambient temperature and relative humidity, they were recorded for each experiment only as a reference, since they are factors that were not controlled. The cooling air temperature of the engine was maintained at 30 °C, thus preserving a constant temperature in the cooling air supply of the engine. The tests were performed randomly at different times and different days, in order to ensure that the experiment was repeatable and reproducible. Some variables were considered as constants and therefore repeatable as; the internal energy of the fuel, the type of fuel, the points of operation (torque and rpm). All the experiments were carried out in the same motor and with the same instrumentation, in order to establish the performance of the testing bench, from the measurements of the variables and validate these data by means of the statistical evaluation of the experiments carried out.

Experimental Test

The tests performed once the engine was improved were made looking for 2200 RPM and torque of 25 Nm, conditions that were controlled as best as possible. The factor of ambient temperature and relative humidity were not controlled, since the objective of the testing bench is to overcome the effects of these variables. Of the variables of interest, the temperature of the exhaust gases shows a direct relationship with the quantity of fuel consumed by the engine as shown in Figure 12, where the direct relationship of each of the runs and of each set of measurements made is highlighted. In most tests, the behavior of their measurement set obeys the same behavior in relation to exhaust gases temperature and fuel consumption.
In Figure 13a,b, the dispersion of the measured values was observed, in relation to the torque which was set at 25 Nm and set at 2200 RPM. Figure 13a shows a range of values between 250−425 mg/s of fuel consumption for a torque range between 24 and 26 Nm. Figure 13b shows the fuel consumption in the range of 2199−2201 RPM, limiting the variation in ± 1 RPM with respect to the desired value of 2200 RPM. In the graphs of fuel consumption (Figure 13a,b) and exhaust gas temperature (Figure 15a,b), a relatively dispersed behavior of the measured values was observed, however the precision of the control mechanisms is reflected in this variability. As a consequence of the torque and rpm variation, the fuel consumption is directly affected, due to the engine power demand that makes it difficult to maintain the rpm and torque.
Figure 14a,b show the dispersion of the measured air consumption for the torque set at 25 Nm. The air consumption observed indicated that it is not affected by the torque or rpm, and the variation is caused mainly by lacking precise control, which cannot be easily implemented.
The air consumption in Figure 14a presents a variation between 60–70 m3, which with respect to torque represents a reduced apparent variation, grouping the values to a greater extent between 24.5 and 25.5 Nm, that is, a range ± 0.5 with respect to the torque of reference of 25 Nm. In Figure 14b, a variation with respect to the RPM is grouped between 2199 and 2201 RPM. Figure 15a,b show the dispersion of the measured values, which are the temperature of exhaust gases with respect to torque and RPM. The dispersion of the combustion gas temperature values shown in Figure 15a is relevant, given that it ranges between 200–350 °C under the engine operating range between 24 and 26 Nm of torque. In Figure 15b the gases temperature dispersion with respect to the RPM is between 2199 and 2203 RPM, although most of the values are grouped between 2199 and 2201 RPM.
In Figure 16a,b, the oil temperature shows a less dispersed behavior of the measured values, due to the improvements made in the testing bench of the engine through the control mechanisms becoming more accurate, which reduces the variation in the measured data. The variation and behavior of the rpm and torque is caused by the engine operation principle itself, which was set to operate at 25 Nm and 2200 rpm, which cannot be maintained with enough accuracy.
Figure 17a,b shows the minimum dispersion of the CO data with relation to the torque, but the CO with respect to the RPM has a negligible variation. Figure 18a,b show that the dispersion of data from the CO2 graph with the torque is greater than the rpm. Figure 19a,b, show that the emission of O2 presents a moderate dispersion with respect to torque and rpm. Figure 20a,b and Figure 21a,b show that the HC and NOx are the emissions that have a greater dispersion with respect to torque and rpm.
The one factor ANOVA analysis shown in Table 10 allowed us to observe that the variability of measured data show a significant difference of the statistical means in most of the variables. A probabilistic value p > 0.05 and Fcrit < F was only obtained in the case of CO and RPM, meaning the information is statistically reliable only for those variables.

5. Results

A diesel engine was run using Diesel B10 and a biodiesel made of palm oil. Exhaust emissions were examined at different engine torques of 17.5 Nm to 40 Nm and a constant engine speed of 1800 rpm. Exhaust emissions such as CO, CO2, NOx, HC and O2 emissions were examined and compared. A comparison of fuel consumption costs was also made for each of the aforementioned tests, considering the current prices in Colombia for diesel of 2.73 USD/gal, and biodiesel prices of 3.2 USD/gal and B10 2.85 USD/gal for May 2019 [35]. Figure 22 shows that diesel presents a lower cost, followed by mixture B10. Meanwhile, CO2, CO and HC emissions were lower for the tested mixture B10 as compared to diesel fuel, but nevertheless NOX emissions from biodiesel mixture B10 increased compared with diesel fuel. The obtained results were compared with previous results of other authors [51,52,53,54], and showed accepted conformity.
For the case of independent variables; fuel consumption, exhaust gas temperature and air consumption, the performance of a combustion engine can be correlated by the behavior of fuel consumption and the emissions generated. The multivariate ANOVA analysis related the variables of emissions and the variables of fuel consumption, air consumption and exhaust gas temperature.
The correlation Table 11 shows that in relation to fuel consumption, there is a strong correlation with the variables resulting from combustion emissions, specifically for CO2, O2 and NOx greater than 0.7, while HC have a medium correlation and emissions of CO have a low correlation of 0.278. This means the amount of CO2, O2 and NOx emissions produced by the combustion of biodiesel in the engine depends on the chemical characteristics and the amount of fuel.
In relation to the significance of change in F of the change statistic (Table 12), small values are observed where the CO2 is practically zero, indicating a good adjustment. For the value of significance in the ANOVA Table 13, CO2, O2 and NOx are 0.000, which indicates that the lineal relation of the data is significant.
Figure 23 shows the relationship with fuel consumption and the emissions generated from its combustion, there is an upward trend which means a positive relationship. It is observed that the relationship and distribution of the data in the scatter plot is quite adjusted, confirming the level of correlation between the variables. The relationship with fuel consumption and the emissions generated from its combustion, has an upward trend which means a positive relationship. It is observed that the relationship and distribution of the data in the scatter plot approximates the adjustment of the linear function, confirming the level of correlation between the variables.
The correlation Table 14 of the temperature of the combustion gases obeys the same behavior observed in fuel consumption, meaning there is a strong correlation that is higher than 0.8 between emissions of CO2, O2 and NOx with the temperature of combustion gases. It is noted that the correlation with O2 is negative trend, this means that when increasing fuel consumption, there is an increase in the temperature of emission gases and consequently the O2 emitted is reduced as more is consumed for combustion.
In Table 15, a statistical change for NOx and a negligible change in F is observed, and in the ANOVA analysis shown in Table 16, the significance value is less than 0.000, which indicates a significant lineal relation of the NOx emission values.
Figure 24 shows the dispersion graph of the temperature of gases and emissions. There is a positive trend and little variability of the data with adjustment in the trend line for the case of air consumption.
The correlation between the air consumption and the emissions generated is shown in Table 17, where values lower than 0.5 means a low correlation, due to the efficiency of the combustion process which takes advantage of the excess of air depending on the constant engine speed (RPM).
The greatest correlation that is presented with 0.447 is with the HC, which is still low. In the Table 18 showing change statistics, the significance of change of F is small, while ANOVA analysis presented in Table 19 shows a significance level of 0.006, indicating significant lineal relation of the data. Therefore, the correlation of air consumption remains constant in a combustion system at constant speed, in addition to the fact that the engine itself has a good level of efficiency.
In the case of air consumption shown in Figure 25, no clear adjustment to the trend line is observed, therefore a very low correlation between the variables is confirmed due to the air consumption obeying the constant regime that the data were subjected to.

6. Conclusions

  • From the initial measurements with the test bench where the performance evaluation of the engine was performed using diesel-biodiesel mixture working under the conditions of 1800 rpm and a load percentage of 35%, 50%, 65% and 80%, it was determined that the statistical means of the data presented differences in the analysis ANOVA p = 0.47, therefore p > 0.05 and p < Fcrit where F = 0.92 and Fcrit = 4.06 establish that the measured values have no significant relationship and significative variation of the data. This is due to the increase in temperature inside the cylinder, allowing the engine to get closer to the area of lower consumption or higher performance. However, at low speed the fuel consumption increases due to the higher rate of heat transfer through the walls.
  • The implementation of the mechanisms of attenuator of air blows, adjustment mechanism for rpm and preheating air chamber for intake manifold allowed us to improve the bench of tests and improve the measurement of the variables fuel, air, oil temperature, exhaust gas temperature and torque. Emissions were statistically significant with values p < 0.05 and only the rpm with p = 0.784 showed a statistically insignificant value. These results were due to the instability in the combustion of the 912 cc HATZ engine.
  • This HATZ engine does not have the common rail system, which is an electronic system of fuel injection, which supplies diesel by using a high-pressure pump to a common duct where all the injectors are connected. Therefore, the mechanical improvements reduced the variability in the measured data. This did not guarantee the statistical reproducibility of the experiment, but did obtain repeatability in the test.
  • The ANOVA analysis of multiple linear regression and Pearson correlation allowed for identifying the emissions variables with the highest correlation in the FC, CO2 = 0.791, O2 = −0.768 and NOx = 0.72 indicating high correlation and a significant linear relationship; the air consumption with HC = 0.447 and NOx = −0.441 showed a medium correlation with CO, while showing a very low correlation with CO2 and O2 variables. For the gas temperatures with CO2 = 0.857, O2 = −0.847 and NOx = 0.870, NOx is the only variable that has a significant linear relationship with the temperature of the gases.
  • The elements used in the improvement of the test bench allow better control over the variables of interest to determine the performance of the engine. Humidity and temperature were only partially controlled, which affects the statistical result. These experiments were conducted order to determine the performance of diesel-biodiesel engines reliably and accurately in Colombia, where palm oil is produced as an energy product.

Author Contributions

The investigation and presentation of the results was carried out by F.V. and A.P.; The validation of the results, as well as the supervision and management of the research were carried out by R.D. and E.H. They are also grateful to S.M. for their support in the data collection.

Funding

This research received no external funding.

Acknowledgments

In The authors thank the Universidad de Antioquia, Medellin Colombia, National Council on Science and Technology (CONACYT) and the School of Engineering and Technology Sciences (ECITEC) of the Autonomous University of Baja California for its support in the development of this work.

Conflicts of Interest

The authors declare no conflict of interest.

References

  1. Thapa, S.; Natarianto, I.; Prakashbhai, R. An Overview on Fuel Properties and Prospects of Jatropha Biodiesel as Fuel for Engines. Environ. Technol. Innov. 2018, 9, 210–219. [Google Scholar] [CrossRef]
  2. Uddin, M.; Techato, K.; Taweekun, J.; Rahman, M.; Rasul, M.; Mahlia, T.; Ashrafur, S. An Overview of Recent Developments in Biomass Pyrolysis Technologies. Energies 2018, 11, 3115. [Google Scholar] [CrossRef]
  3. Jahirul, M.; Mohammad, R.; Ashfaque, C.; Nanjappa, A.; Mohammad, I.; Mohammad, G.; Ashfaque, A.; Nanjappa, A. Biofuels Production through Biomass Pyrolysis—A Technological Review. Energies 2012, 5, 4952–5001. [Google Scholar] [CrossRef]
  4. Damanik, N.; Hwai, C.; Chong, W.; Teuku, M.; Susan, S. A Review on the Engine Performance and Exhaust Emission Characteristics of Diesel Engines Fueled with Biodiesel Blends. Environ. Sci. Pollut. Res. 2018, 25, 15307–15325. [Google Scholar] [CrossRef]
  5. Somorin, T.; Athanasios, J. Prospects of Deployment of Jatropha Biodiesel-Fired Plants in Nigeria’s Power Sector. Energy 2017, 135, 726–739. [Google Scholar] [CrossRef]
  6. Naylor, R.; Matthew, M. The Rise in Global Biodiesel Production: Implications for Food Security. Glob. Food Secur. 2018, 16, 75–84. [Google Scholar] [CrossRef]
  7. Knothe, G.; Gerpen, J.; Krahl, J. The Biodiesel Handbook; Academic Press: New York, NY, USA; AOCS Press: Urbana, IL, USA, 2010. [Google Scholar]
  8. Slezák, P.; Waczulíková, I. Reproducibility and Repeatability; Slovak Standard Institute: Bratislava, Slovak Republic, 2010. [Google Scholar]
  9. Bielaczyc, P.; Woodburn, J.; Szczotka, A. A comparison of Carbon Dioxide exhaust emissions and fuel consumption for vehicles tested over the NEDC, FTP-75 and WLTC chassis dynamometer test cycles. SAE Technical Paper 2015. [Google Scholar] [CrossRef]
  10. Andersson, J.; May, J.; Favre, C.; Bosteels, D.; De Vries, S.; Heaney, M.; Keenan, M.; Mansell, J. On-Road and Chassis Dynamometer Evaluations of Emissions from Two Euro 6 Diesel Vehicles. Sae Int. 2014, 7, 919–934. [Google Scholar] [CrossRef]
  11. Jaworski, A.; Kuszewski, H.; Ustrzycki, A.; Balawender, K.; Lejda, K.; Woś, P. Analysis of the Repeatability of the Exhaust Pollutants Emission Research Results for Cold and Hot Starts Under Controlled Driving Cycle Conditions; Springer: Berlin/Heidelberg, Germany, 2018. [Google Scholar] [CrossRef]
  12. Giechaskiel, B.; Dilara, P.; Andersson, J. Particle Measurement Programme (PMP) Light-Duty Inter-Laboratory Exercise: Repeatability and Reproducibility of the Particle Number Method. Aerosol Sci. Technol. 2008, 42, 528–543. [Google Scholar] [CrossRef]
  13. Instituto Colombiano de Normas Técnicas y Certificación (ICONTEC). Norma técnica NTC-ISO/IEC Colombiana 17025: Requisitos Generales Para la Competencia de Los Laboratorios de Ensayo y Calibración. ISO-International Organization for Standardization. Available online: https://www.invima.gov.co/images/pdf/red-nal-laboratorios/resoluciones/NTC-ISO-IEC_17025-2005.pdf (accessed on 2 January 2017).
  14. Balawender, K.; Jaworski, A.; Kuszewski, H.; Lejda, K.; Ustrzycki, A. An assessment of consistence of exhaust gas emission test results obtained under controlled NEDC conditions. IOP Conf. Ser. Mater. Sci. Eng. 2016, 148, 012059. [Google Scholar] [CrossRef] [Green Version]
  15. Chłopek, Z.; Szczepański, T. Rating causes the non-repeatability of an internal combustion engine operating states in the sets of his work conditions. Combust Engines 2015, 62, 708–711. [Google Scholar]
  16. Terradez, M.; Angel, A. Análisis de Varianza (ANOVA). UOC. Available online: https://uoc.edu 2010 (accessed on 12 January 2017).
  17. Kuti, O.A.; Xiangang, W.G.; Zhang, W.; Nishida, K.; Huang, Z.H. Characteristics of the ignition and combustion of biodiesel fuel spray injected by a common-rail injection system for a direct-injection diesel engine. SAGE J. 2010, 224, 1581–1596. [Google Scholar] [CrossRef]
  18. Suh, H.K.; Roh, G.H.; Lee, C.S. Spray and combustion characteristics of biodiesel/diesel blended fuel in a direct injection common-rail diesel engine. ASME J. Eng. Gas Turbines Power 2008, 30, 032807. [Google Scholar] [CrossRef]
  19. Agarwal, A.K.; Dhar, A.; Gupta, J.G.; Kim, W.; Lee, C.S.; Park, S. Effect of fuel injection pressure and injection timing on spray characteristics and particulate size-number distribution in a biodiesel fueled common rail direct injection diesel engine. Appl. Energy 2014, 130, 212–221. [Google Scholar] [CrossRef]
  20. IBM. IBM SPSS Software. IBM SPSS Predictiv. Analitycs. 2019. Available online: https://www.ibm.com/mx-es/analytics/spss-statistics-software (accessed on 12 March 2017).
  21. Da Silva, M.J.; de Souza, S.N.M.; Chaves, L.I.; Rosa, H.A.; Secco, D.; Santos, R.F.; Baricatti, R.A.; Nogueira, C.E.C. Comparative Analysis of Engine Generator Performance Using Diesel Oil and Biodiesels Available in Paraná State, Brazil. Renew. Sustain. Energy Rev. 2013, 17, 278–282. [Google Scholar] [CrossRef]
  22. Haryono, I.; Suryantoro, M.T. Effects of Using Biodiesel on Engine Generator Components. Int. J. Eng. Technol. 2014, 4. Available online: http://iet-journals.org/archive/2014/may_vol_4_no_5/529713944656.pdf (accessed on 26 March 2017).
  23. Suthisripok, T.; Semsamran, P. The Impact of Biodiesel B100 on a Small Agricultural Diesel Engine. Tribol. Int. 2018, 128, 397–409. [Google Scholar] [CrossRef]
  24. Niculescu, R.; Clenci, A.; Iorga-Siman, V. Review on the Use of Diesel–Biodiesel–Alcohol Blends in Compression Ignition Engines. Energies 2019, 12, 1194. [Google Scholar] [CrossRef]
  25. Gu, J.; Gao, Y.; Xu, X.; Wu, J.; Yu, L.; Xin, Z.; Sun, S. Biodiesel production from palm oil and mixed dimethyl/diethyl carbonate with controllable cold flow properties. Fuel 2018, 216, 781–786. [Google Scholar] [CrossRef]
  26. Saydut, A.; Erdogan, S.; Kafadar, A.B.; Kaya, C.; Aydin, F.; Hamamci, C. Process optimization for production of biodiesel from hazelnut oil, sunflower oil and their hybrid feedstock. Fuel 2016, 183, 512–517. [Google Scholar] [CrossRef]
  27. Pattamaprom, C.; Pakdee, W.; Ngamjaroen, S. Storage degradation of palm-derived biodiesel: Its effects on chemical properties and engine performance. Renew. Energy 2012, 37, 412–418. [Google Scholar] [CrossRef]
  28. Gad, M.S.; El-Araby, R.; Abed, K.A.; El-Ibiari, N.N.; El Morsi, A.K.; El-Diwani, G.I. Performance and emissions characteristics of C.I. engine fueled with palm oil/palm oil methyl ester blended with diesel fuel. Egypt. J. Pet. 2018, 27, 215–219. [Google Scholar] [CrossRef]
  29. Pullen, J.; Saeed, K. Factors Affecting Biodiesel Engine Performance and Exhaust Emissions–Part I: Review. Energy 2014, 72, 1–6. [Google Scholar] [CrossRef]
  30. Lapuerta, M.; Agudelo, J. Utilización De Combustibles Alternativos En Motores Térmicos. Módulo, I; Ciudad Real, España; Escuela Técnica Superior De Ingenieros Industriales: Ciudad Real, Spain, 2003. [Google Scholar]
  31. He, C.; Ge, Y.; Tan, J.; You, K.; Han, X.; Wang, J. Characteristics of polycyclic aromatic hydrocarbons emissions of diesel engine fueled with biodiesel and diesel. Fuel 2010, 89, 2040–2046. [Google Scholar] [CrossRef]
  32. RESOLUCION 9 0963 DE 2014. n.d. Available online: http://www.suin-juriscol.gov.co/clp/contenidos.dll/Resolucion/30033934?fn=document-frame.htm$f=templates$3.0 (accessed on 4 June 2018).
  33. Fontaras, G.; Samaras, Z.; Miltsios, G. Experimental evaluation of cottonseed oil- diesel blends as automotive fuels via vehicle and engine measurements. SAE Technical Paper 2007. [Google Scholar] [CrossRef]
  34. United States Environmental Protection Agency. Document Display|NEPIS|US EPA. Retrieved. Available online: https://nepis.epa.gov/Exe/ZyNET.exe/P1001ZA0.TXT?ZyActionD=ZyDocument&Client=EPA&Index=2000+Thru+2005&Docs=&Query=&Time=&EndTime=&SearchMethod=1&TocRestrict=n&Toc=&TocEntry=&QField=&QFieldYear=&QFieldMonth=&QFieldDay=&IntQFieldOp=0&ExtQFieldOp=0&XmlQuery=) (accessed on 8 March 2019).
  35. Federación Nacional de Biocombustibles de Colombia. n.d. Available online: https://fedebiocombustibles.com/nota-web-id-2852-titulo-los_biocombustibles_son_parte_de_la_solución.htm (accessed on 25 June 2019).
  36. Quantis Latin America. Simón M Gmünder. Critical Review Report. Evaluación de Resultados del Documento CONPES 3510 de 2008. n.d. Available online: https://www.fenalce.org/archivos/conpesbiocombustibles.pdf (accessed on 25 June 2019).
  37. Agarwal, A.K.; Dhar, A. Experimental Investigations of Preheated Jatropha Oil Fuelled Direct Injection Compression Ignition Engine-Part 1: Performance, Emissions and Combustion Characteristics. J. ASTM Int. 2010, 7, 1–15. [Google Scholar] [CrossRef]
  38. Shanmughasundaram, P. Performance of single cylinder CI engine using blends of rubber seed biodiesel-Taguchi method. UPB Sci. Bull. Available online: https://www.scientificbulletin.upb.ro/rev_docs_arhiva/fulla8e_628422.pdf 2014 (accessed on 19 April 2017).
  39. Nwafor, O.M.I. The effect of elevated fuel inlet temperature on performance of diesel engine running on neat vegetable oil at constant speed conditions. Renew. Energy 2003, 28, 171–181. [Google Scholar] [CrossRef]
  40. Graboski, M.S.; McCormick, R.L.; Alleman, T.L.; Herring, A.M. Effect of Biodiesel Composition on Engine Emissions from a DDC Series 60 Diesel Engine: Final Report; Report 2 in a Series of 6; Colorado Institute for Fuel and Enginne Research: Golden, CO, USA, 2003. [Google Scholar]
  41. International Business Machines Corporation. IBM SPSS Statistics Overv. Available online: https://www.ibm.com/products/spss-statistics (accessed on 8 March 2019).
  42. Magentrol Level Matters. Thermatel® TA2 Transmisor de Flujo Másico. Magnetrol. Available online: https://www.magnetrol.com/es/products/thermatel-ta2-transmisor-de-flujo-masico (accessed on 6 March 2019).
  43. Horiba, Ltd. Chemiluminescence. HORIBA. Available online: https://www.horiba.com/en_en/products/by-technique/molecular-spectroscopy/chemiluminescence/ (accessed on 6 March 2019).
  44. AVL Emission Tester Series 4000. For Petrol and Diesel Engines. AVL DiTEST. Available online: http://www.asanetwork.es/doc_equipos/avl_ditest_analizador_gases_avl-serie-4000_en.pdf (accessed on 6 March 2019).
  45. Rahman, K.A.; Ramesh, A. Studies on the Effects of Methane Fraction and Injection Strategies in a Biogas Diesel Common Rail Dual Fuel Engine. Fuel 2019, 236, 147–165. [Google Scholar] [CrossRef]
  46. Bari, S.; Yu, C.W.; Lim, T.H. Performance deterioration and durability issues while running a diesel engine with crude palm oil. SAGE J. 2002, 216, 785–792. [Google Scholar] [CrossRef]
  47. Lapuerta, M.; Armas, O.; Ballesteros, R. Diesel emissions from biofuels derived from Spanish potential vegetable oils. SAE Paper 2008. [Google Scholar] [CrossRef]
  48. Santamaría, A.F.A.; Hernández, J.R.B. Diagnóstico de la Combustión de Biocombustibles en Motores (No. LC-0117); Universidad de Antioquia: Antioquia, Colombia, 2007. [Google Scholar]
  49. Torregrosa, A.J.; Broatch, A.; Olmeda, P.; Romero, C. Assessment of the influence of different cooling system configurations on engine warm-up, emissions and fuel consumption. Int. J. Automot. Technol. 2008, 9, 447–458. [Google Scholar] [CrossRef]
  50. Suarez-Bertoa, R.; Zardini, A.A.; Lilova, V.; Meyer, D.; Nakatani, S.; Hibel, F.; Ewers, J.; Clairotte, M.; Hill, L.; Astorga, C. Intercomparison of real-time tailpipe ammonia measurements from vehicles tested over the new world-harmonized light-duty vehicle test cycle (WLTC). Environ. Sci. Pollut. Res. 2015, 22, 7450–7460. [Google Scholar] [CrossRef] [PubMed] [Green Version]
  51. Abed, K.A.; Gad, M.S.; El Morsi, A.K.; Sayed, M.M.; Abu Elyazeed, S. Effect of Biodiesel Fuels on Diesel Engine Emissions. Egypt. J. Pet. 2019, 28, 183–188. [Google Scholar] [CrossRef]
  52. Ganjehkaviri, A.; Mohd Jaafar, M.; Hosseini, S.; Musthafa, A. Performance Evaluation of Palm Oil-Based Biodiesel Combustion in an Oil Burner. Energies 2016, 9, 97. [Google Scholar] [CrossRef]
  53. Ndayishimiye, P.; Tazerout, M. Use of Palm Oil-Based Biofuel in the Internal Combustion Engines: Performance and Emissions Characteristics. Energy 2011, 36, 1790–1796. [Google Scholar] [CrossRef]
  54. Zahan, K.; Kano, M. Biodiesel Production from Palm Oil, Its By-Products, and Mill Effluent: A Review. Energies 2018, 11, 2132. [Google Scholar] [CrossRef]
Figure 1. Schematic diagram of experimental methodology.
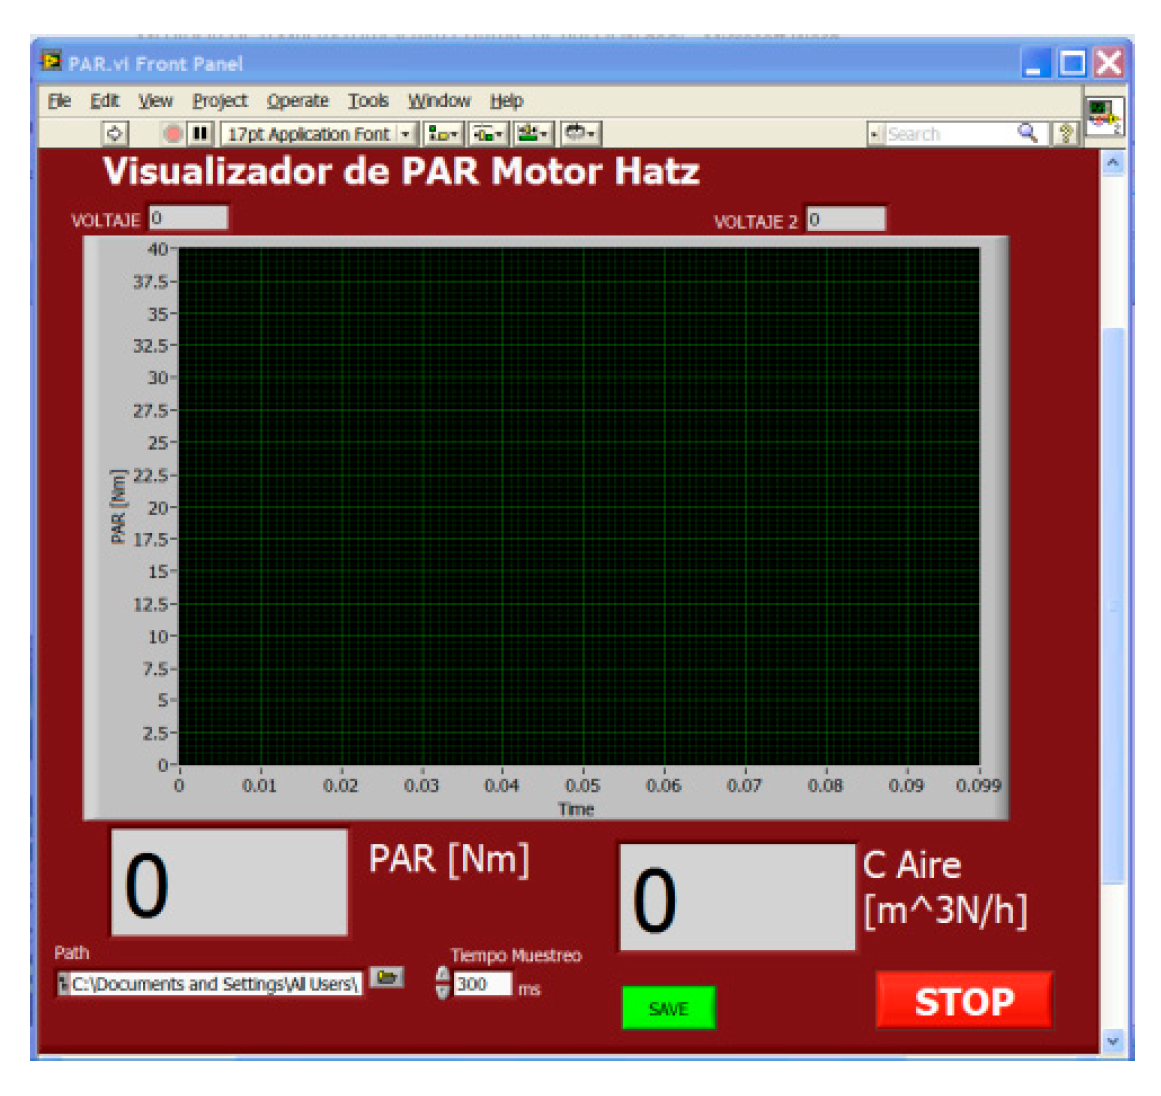
Sustainability 11 04918 g001
Figure 2. Virtual instrument TONE.
Sustainability 11 04918 g002
Figure 3. Box graphs for the test results using different load percentage and RPM fixed on 1800 rpm: (a) Test results for 35% load, (b) Test results for 50% load, (c) Test results for 65% load, (d) Test results for 80% load.
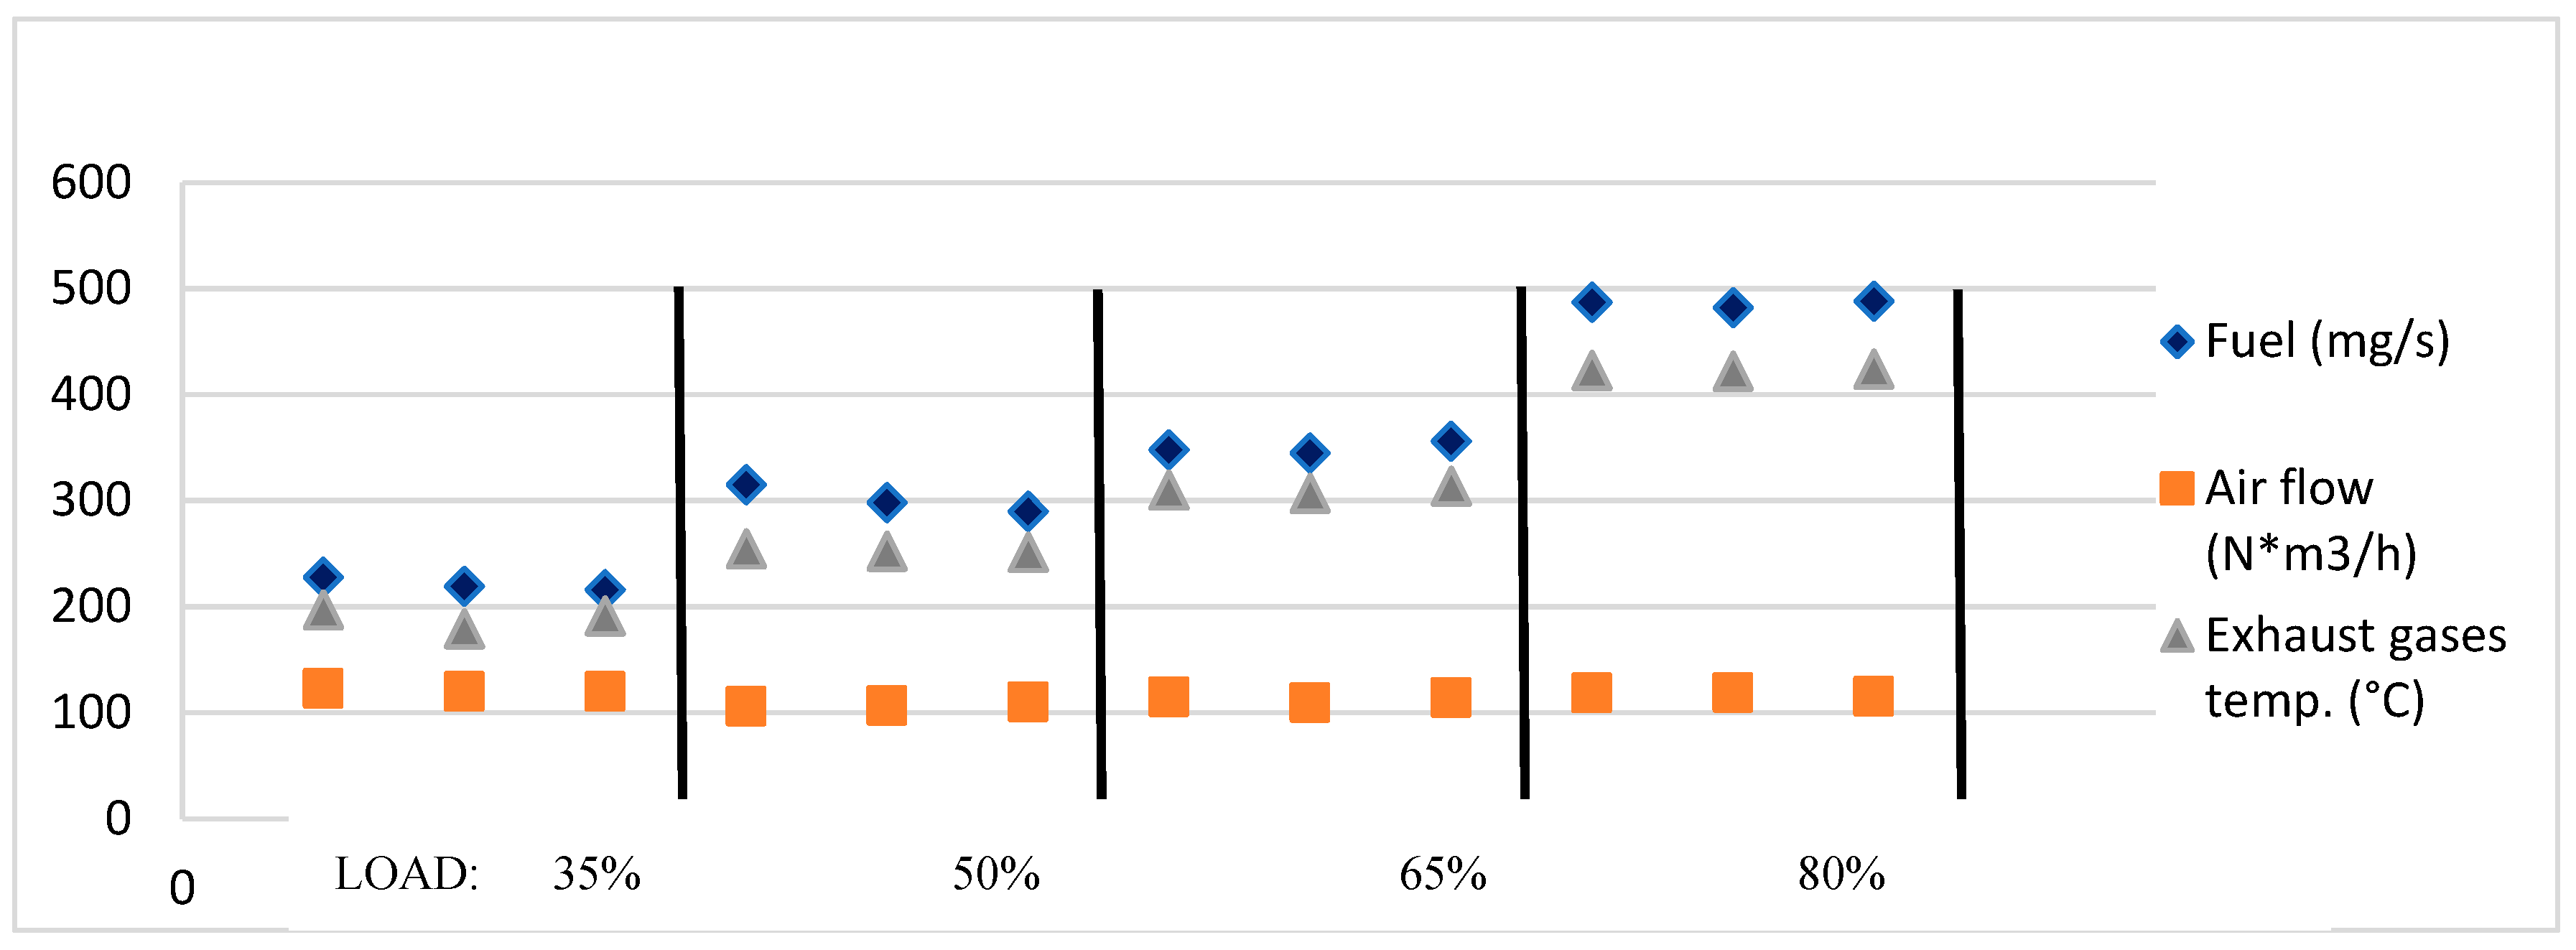
Sustainability 11 04918 g003
Figure 4. Behavior for different loads of the air consumption, fuel consumption and exhaust gases temperatures.
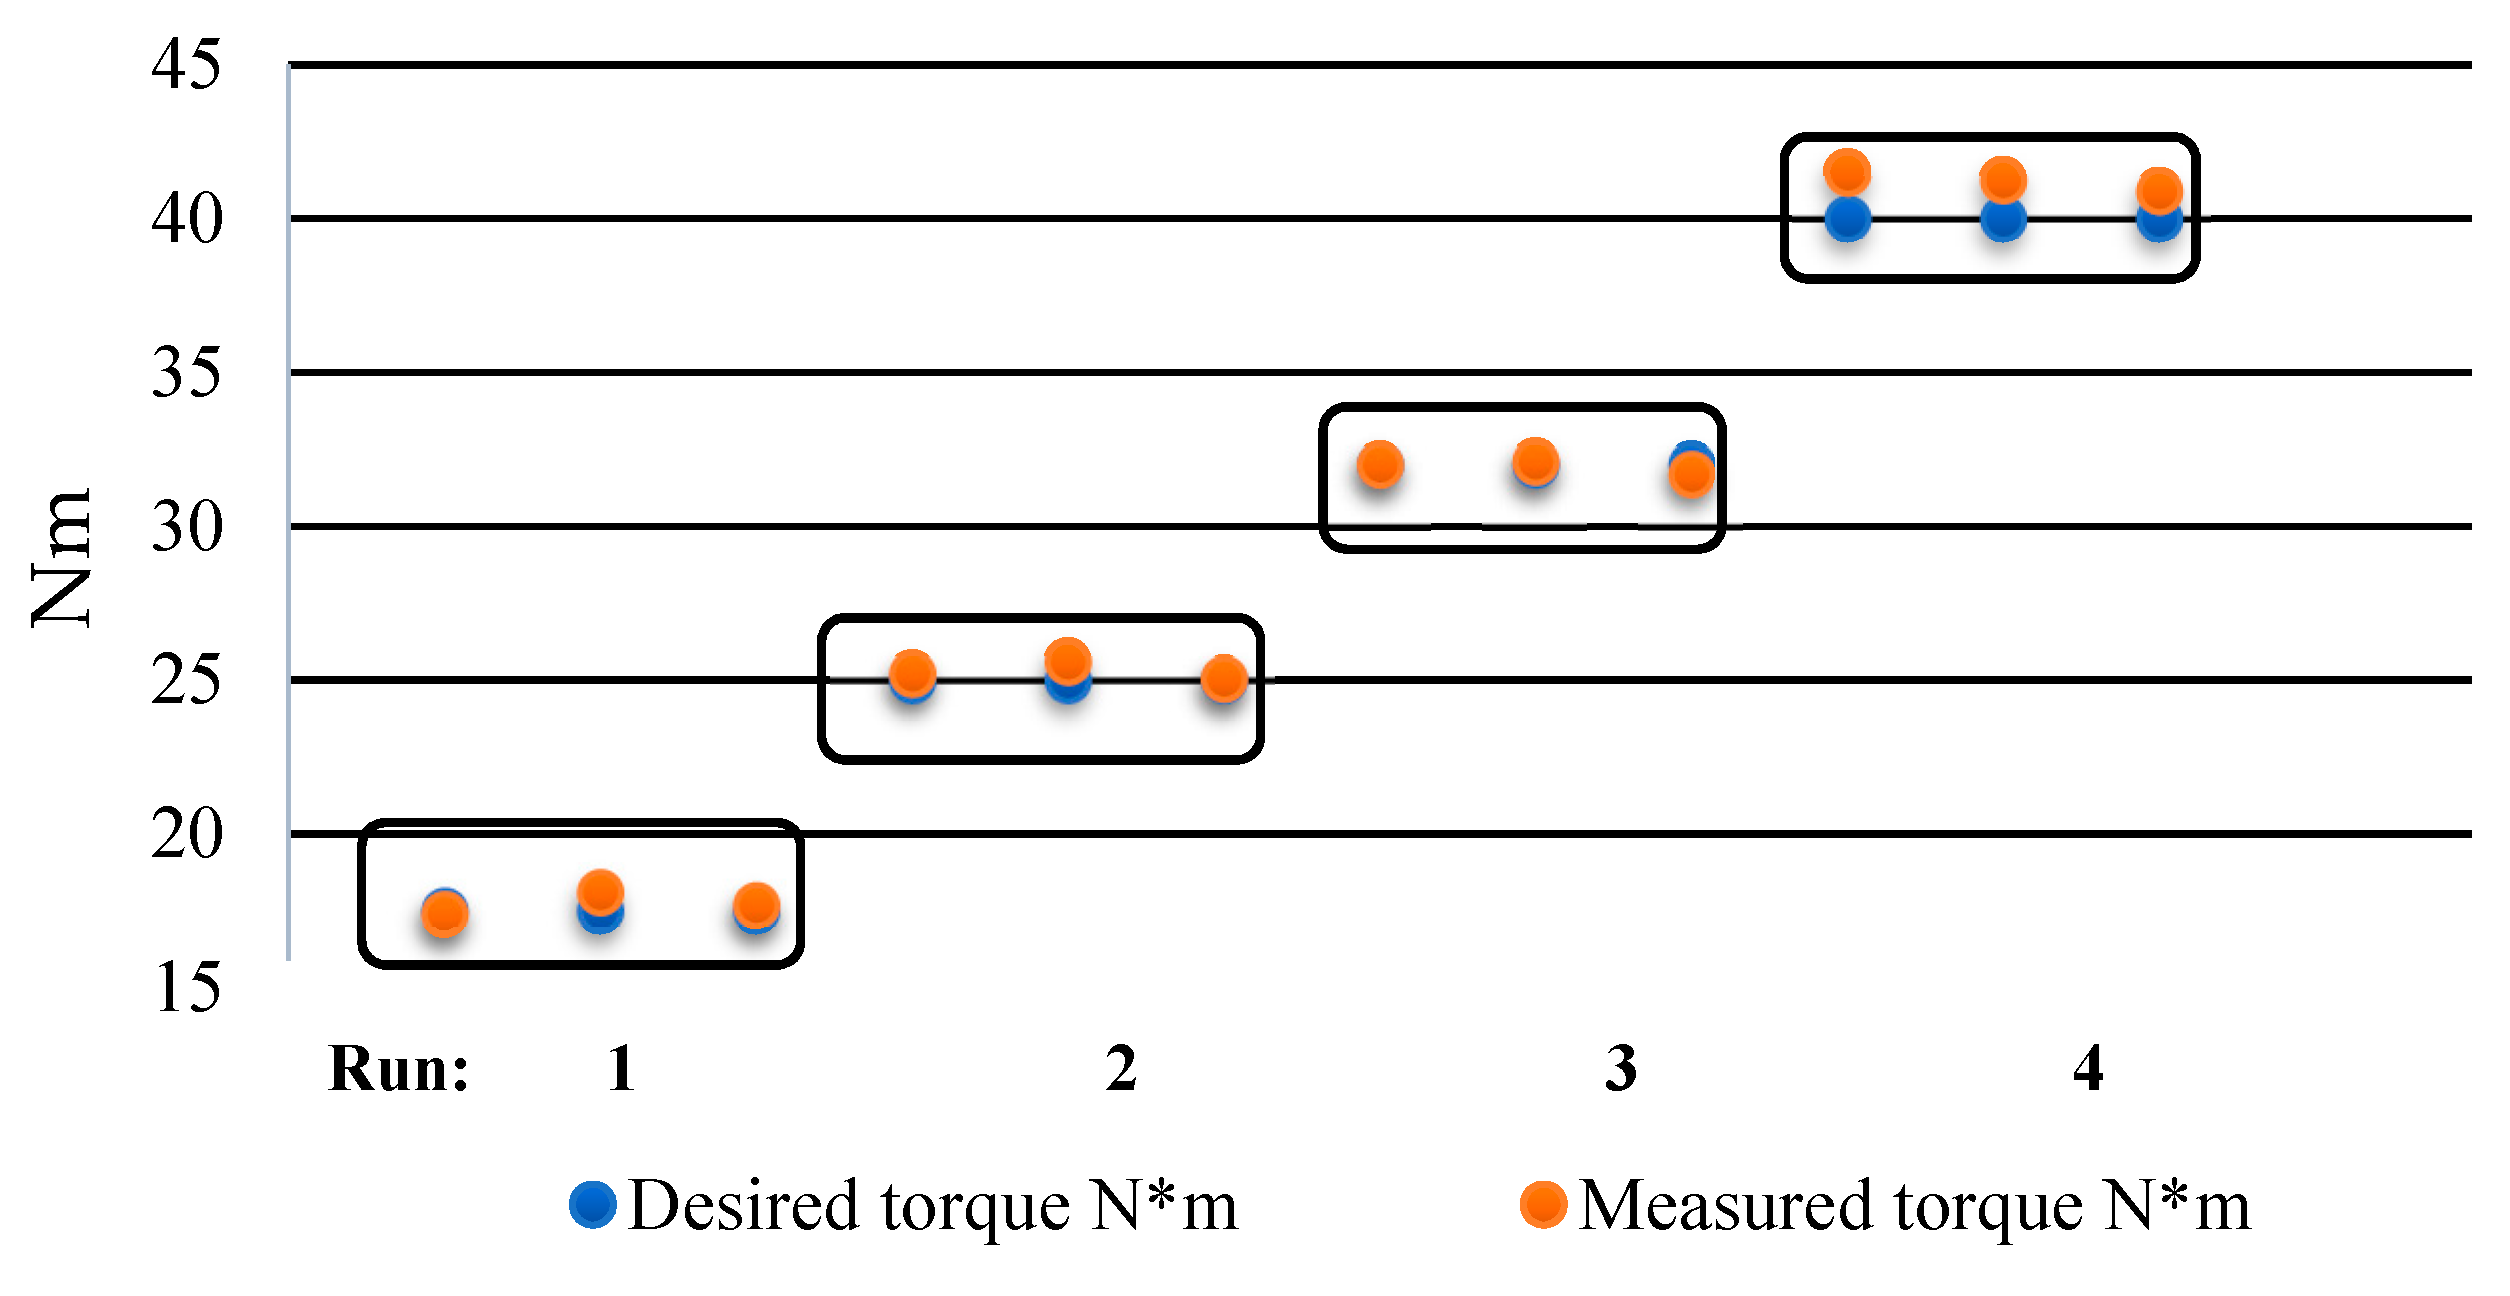
Sustainability 11 04918 g004
Figure 5. Comparative between desired and measured torque.
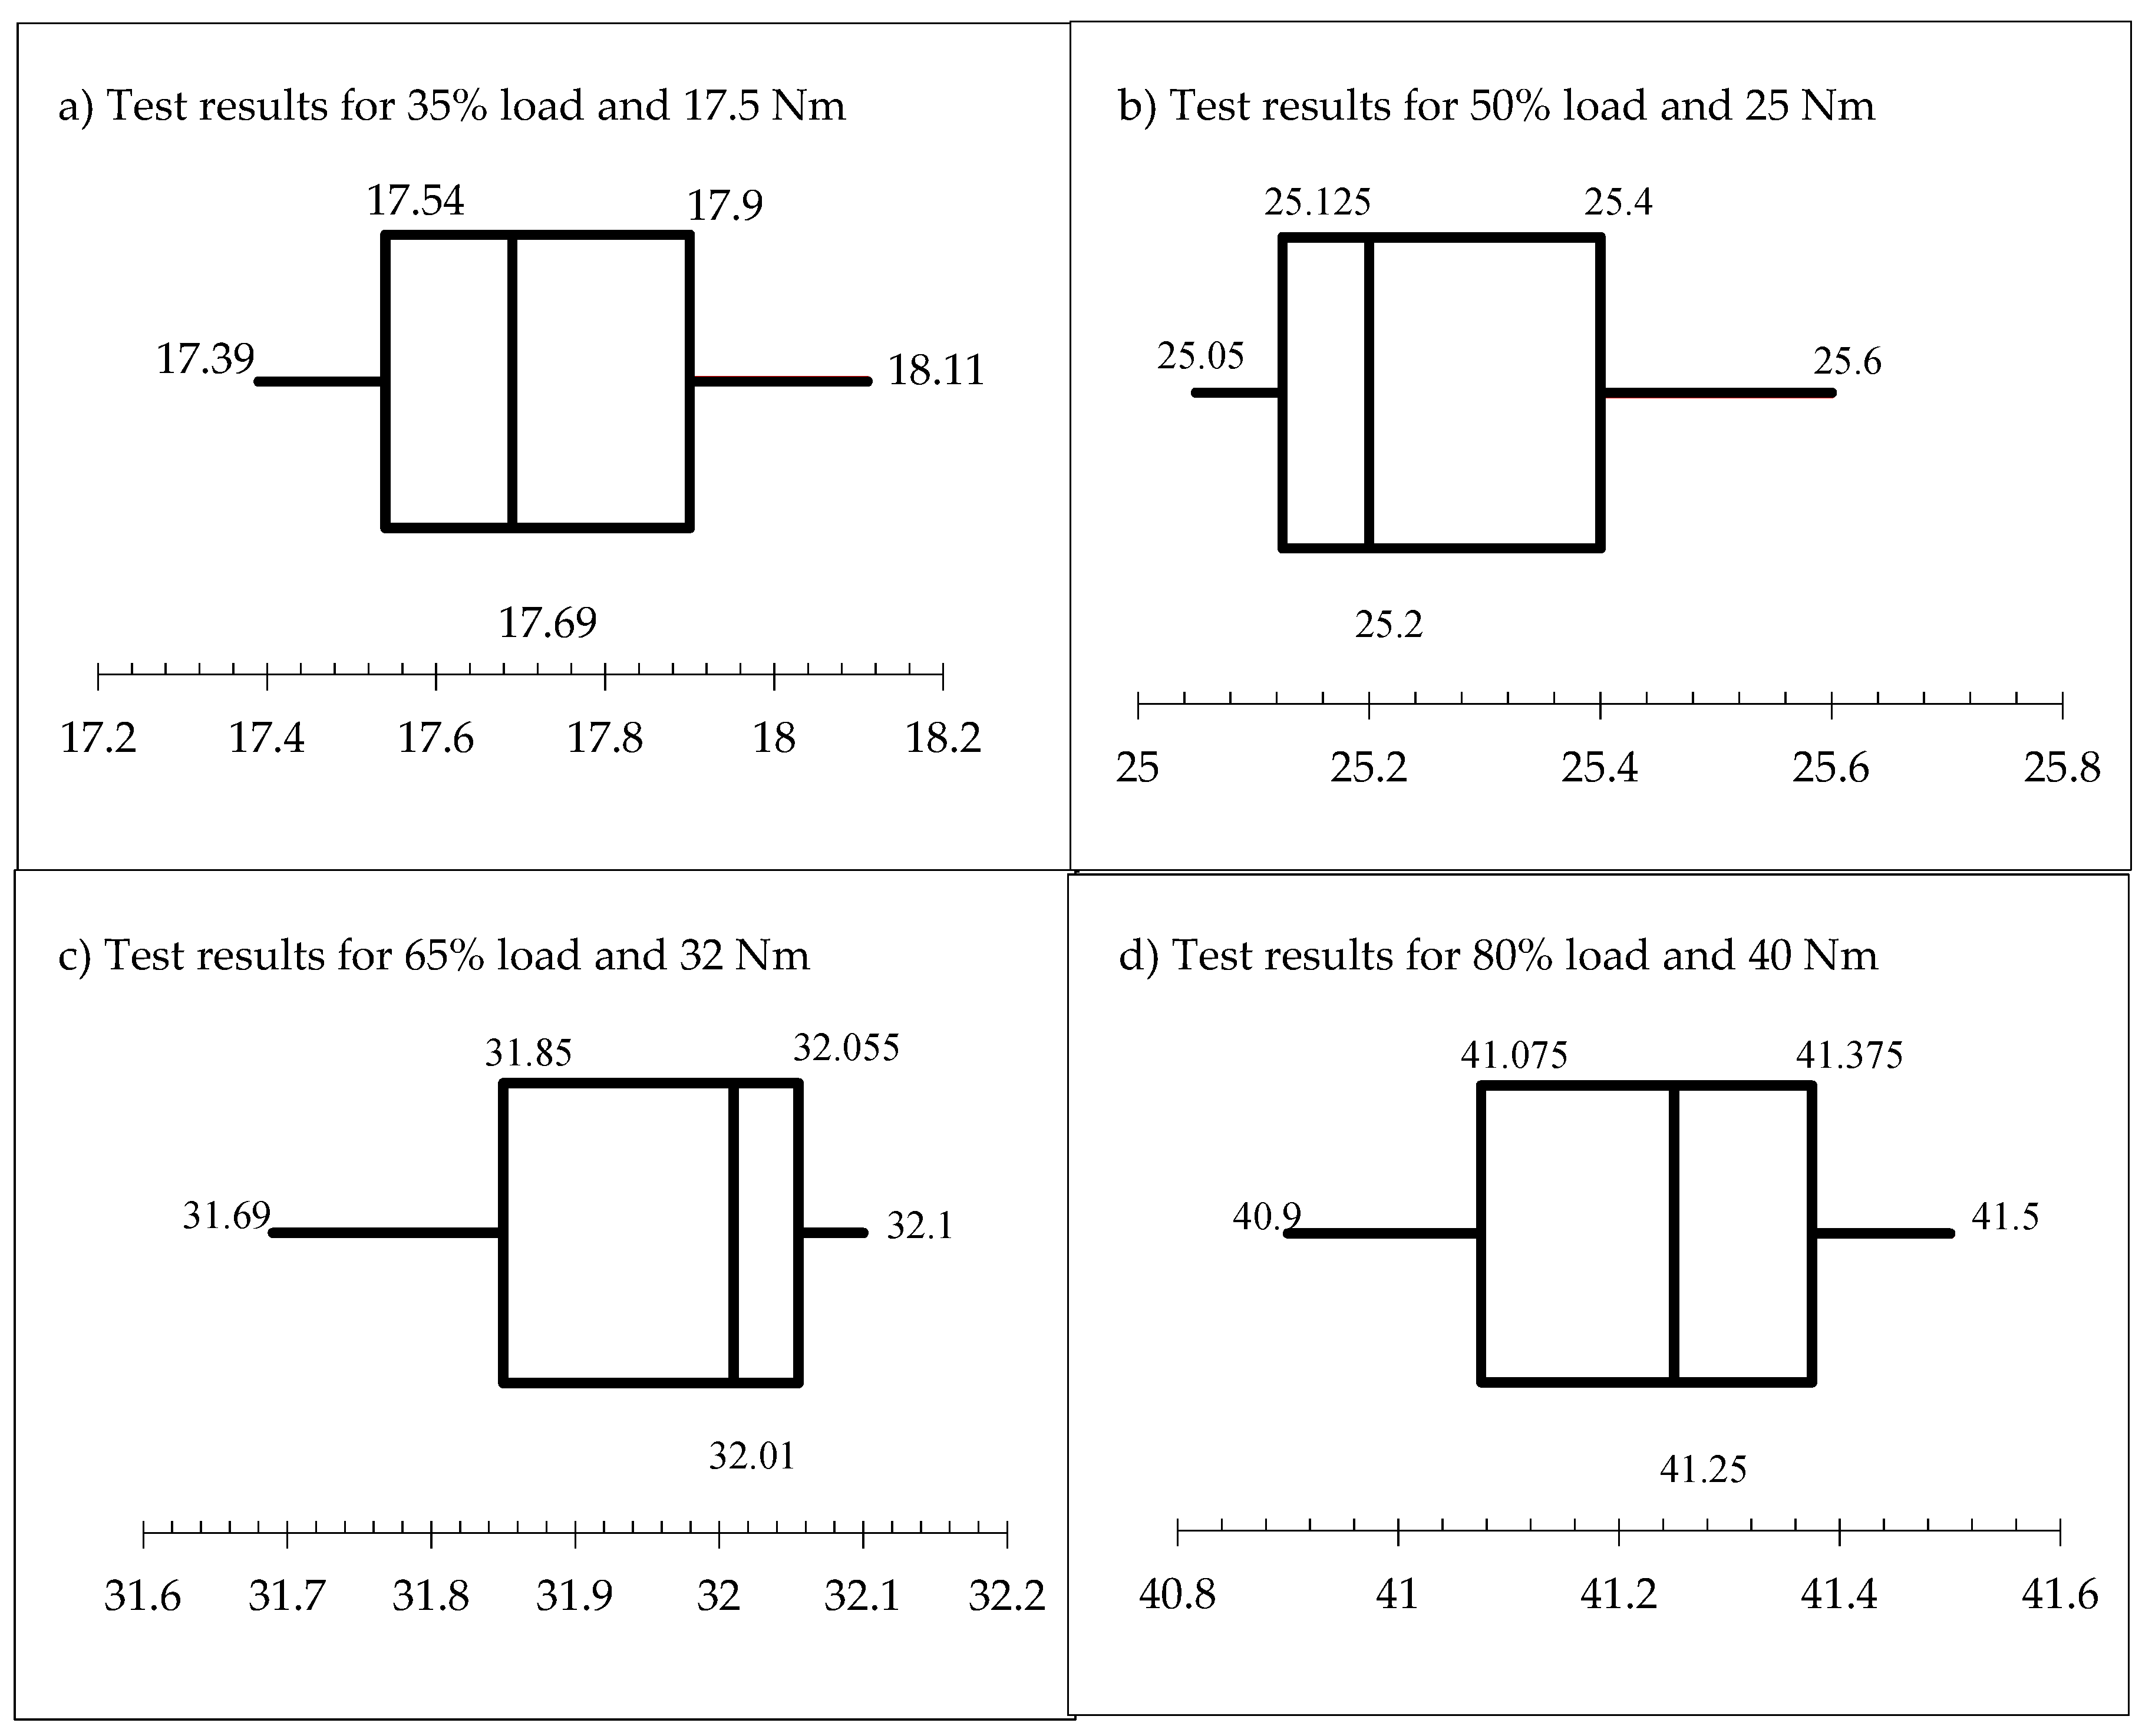
Sustainability 11 04918 g005
Figure 6. Box graphs for the test results using different load percentage and Torque: (a) Test results for 35% load and 17.5 Nm, (b) Test results for 50% load and 25 Nm, (c) Test results for 65% load and 32 Nm, (d) Test results for 80% and 40 Nm.
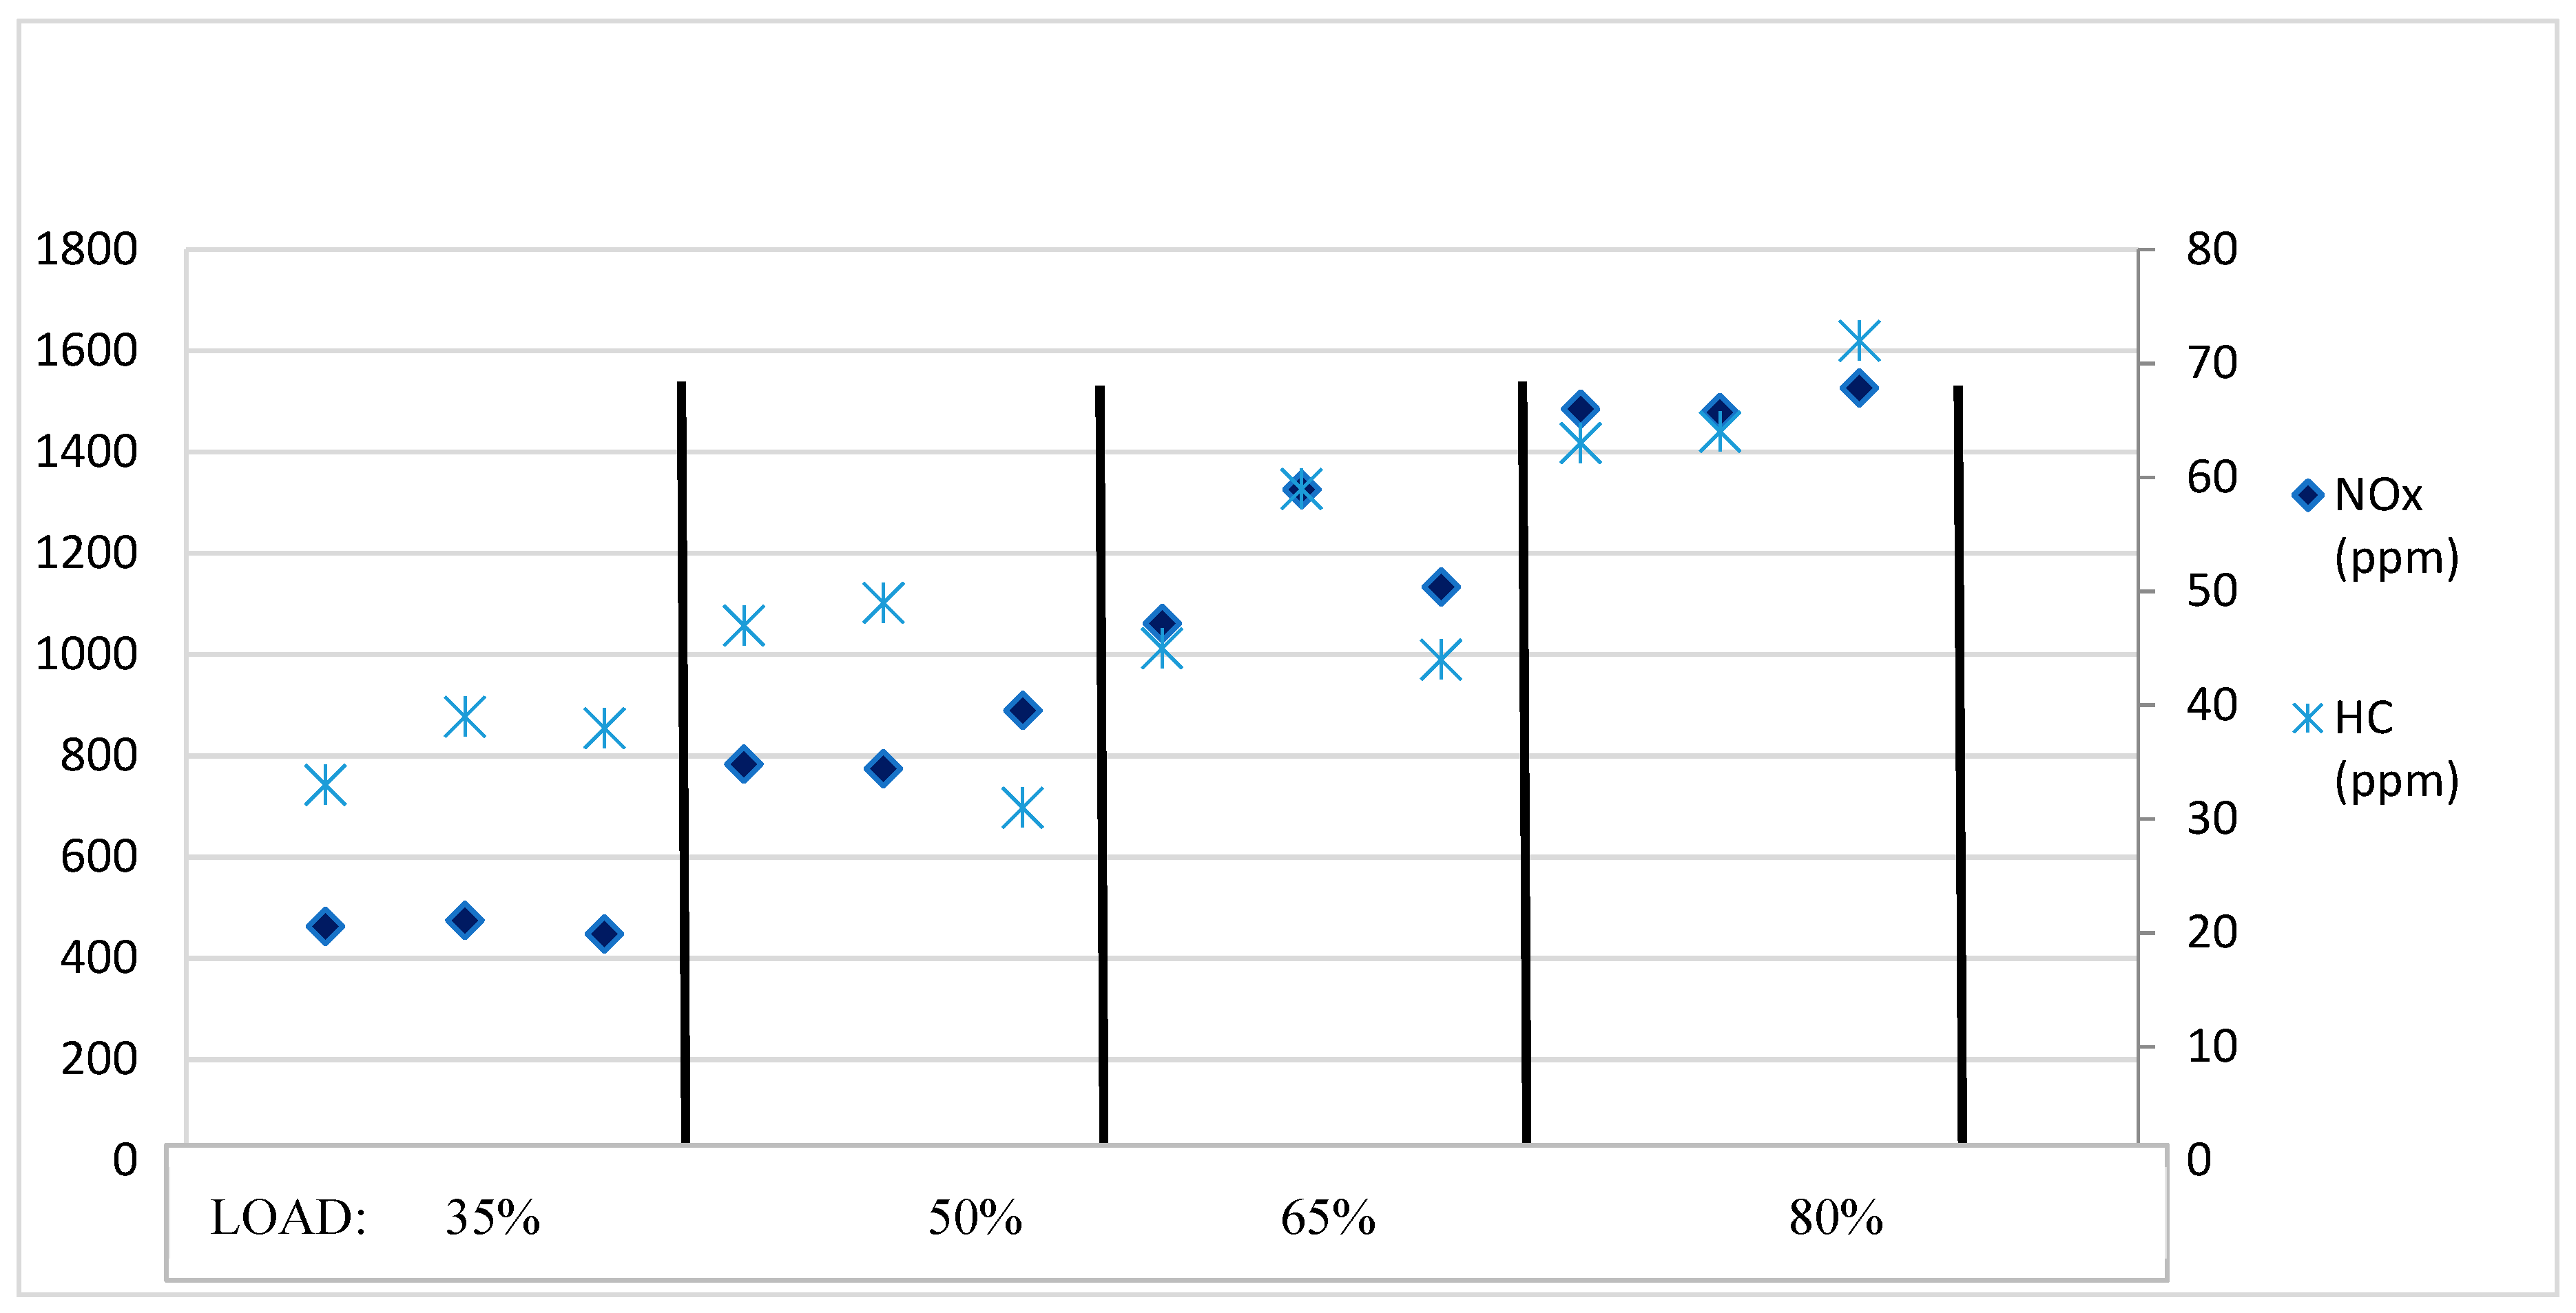
Sustainability 11 04918 g006
Figure 7. Emissions NOx and HC vs load applied.
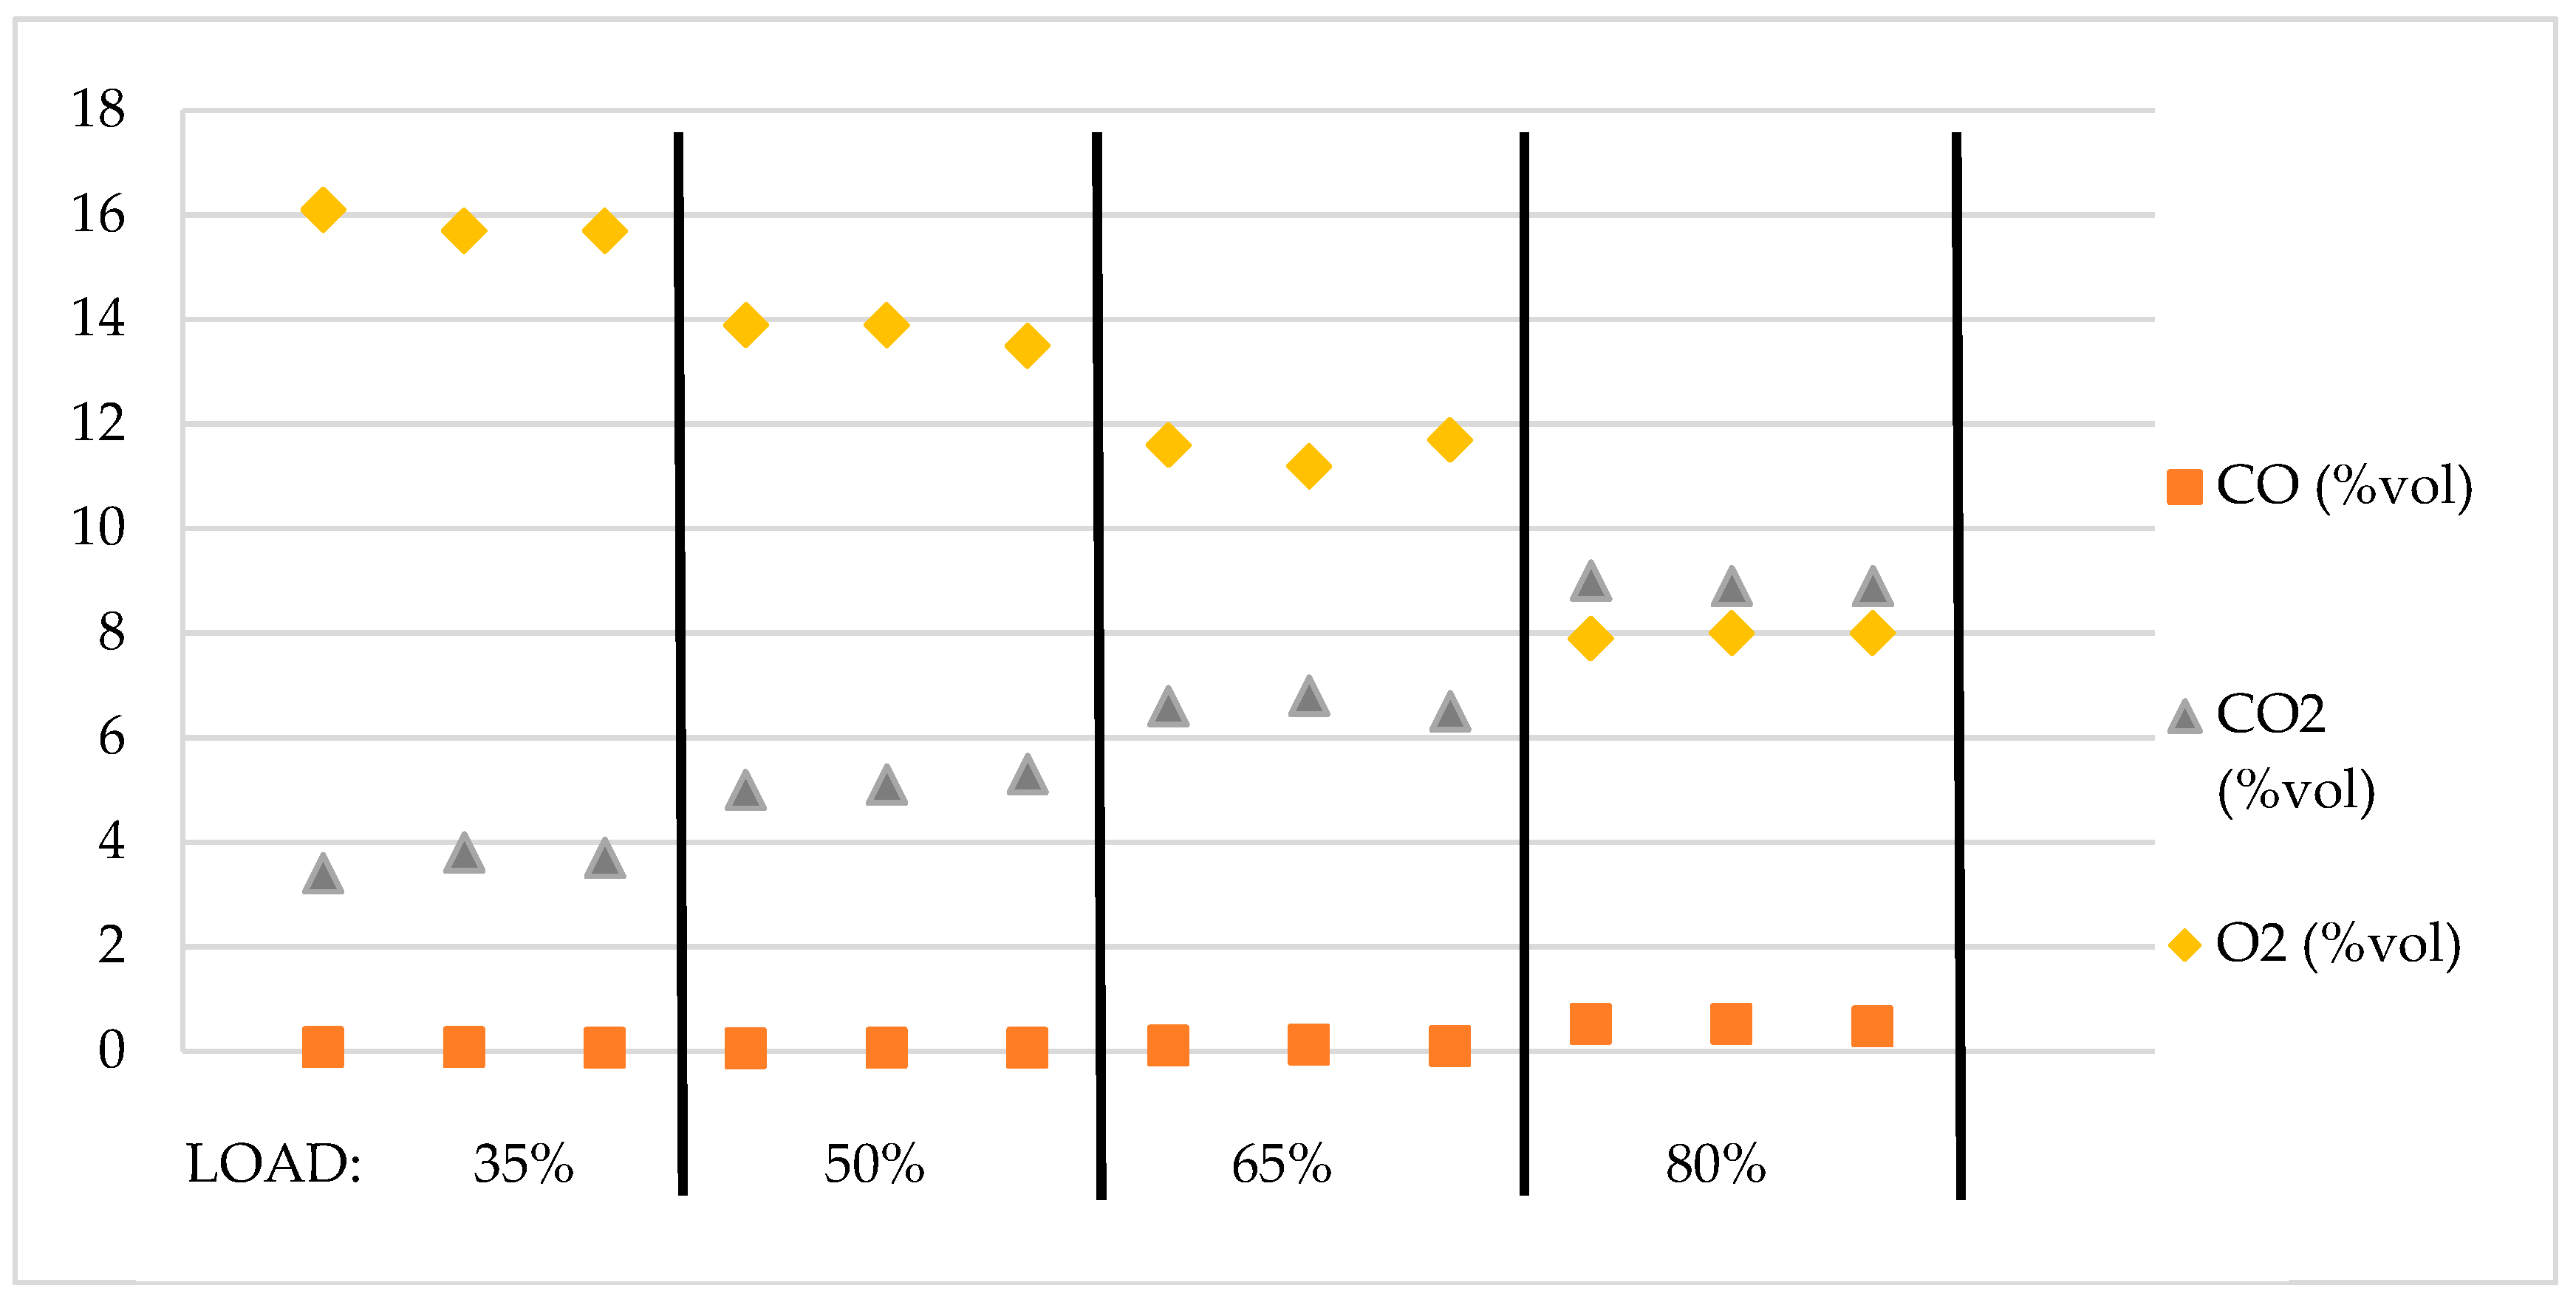
Sustainability 11 04918 g007
Figure 8. Emissions CO, CO2 and O2 Vs load.
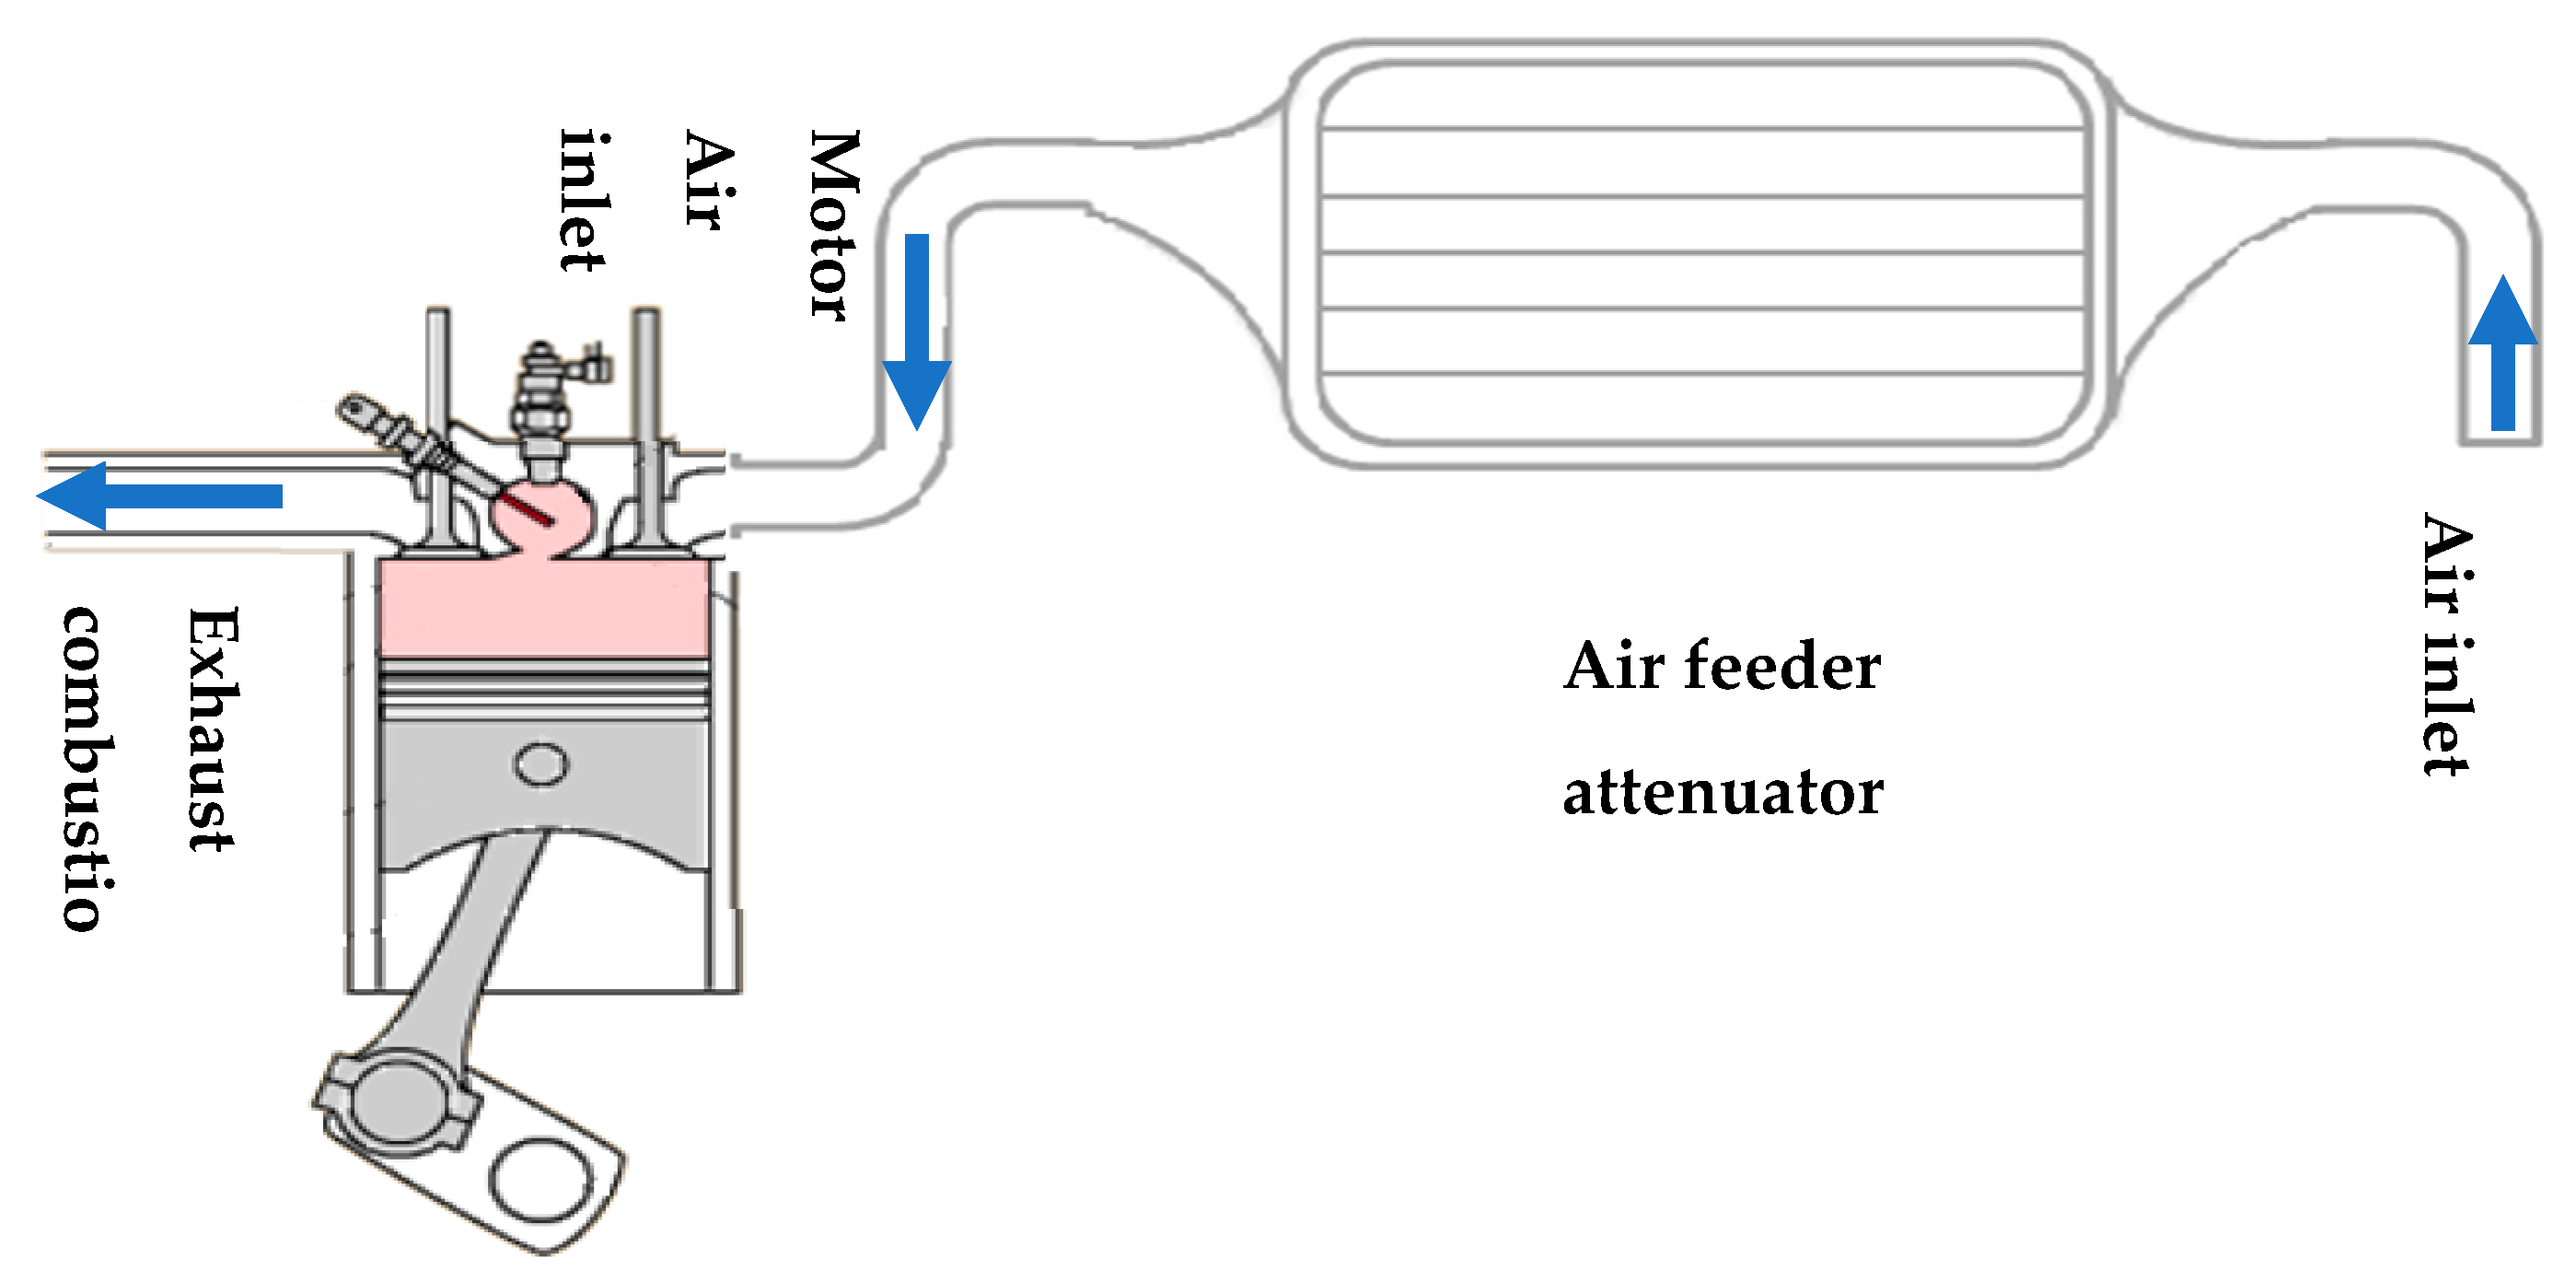
Sustainability 11 04918 g008
Figure 9. Air feeder attenuator chamber for a cooling engine.
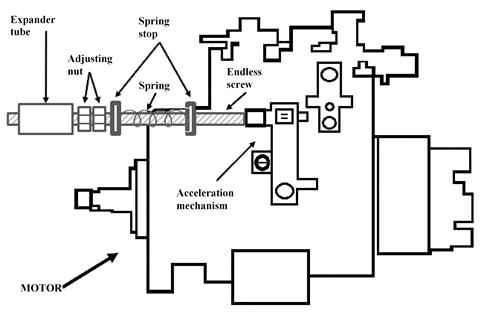
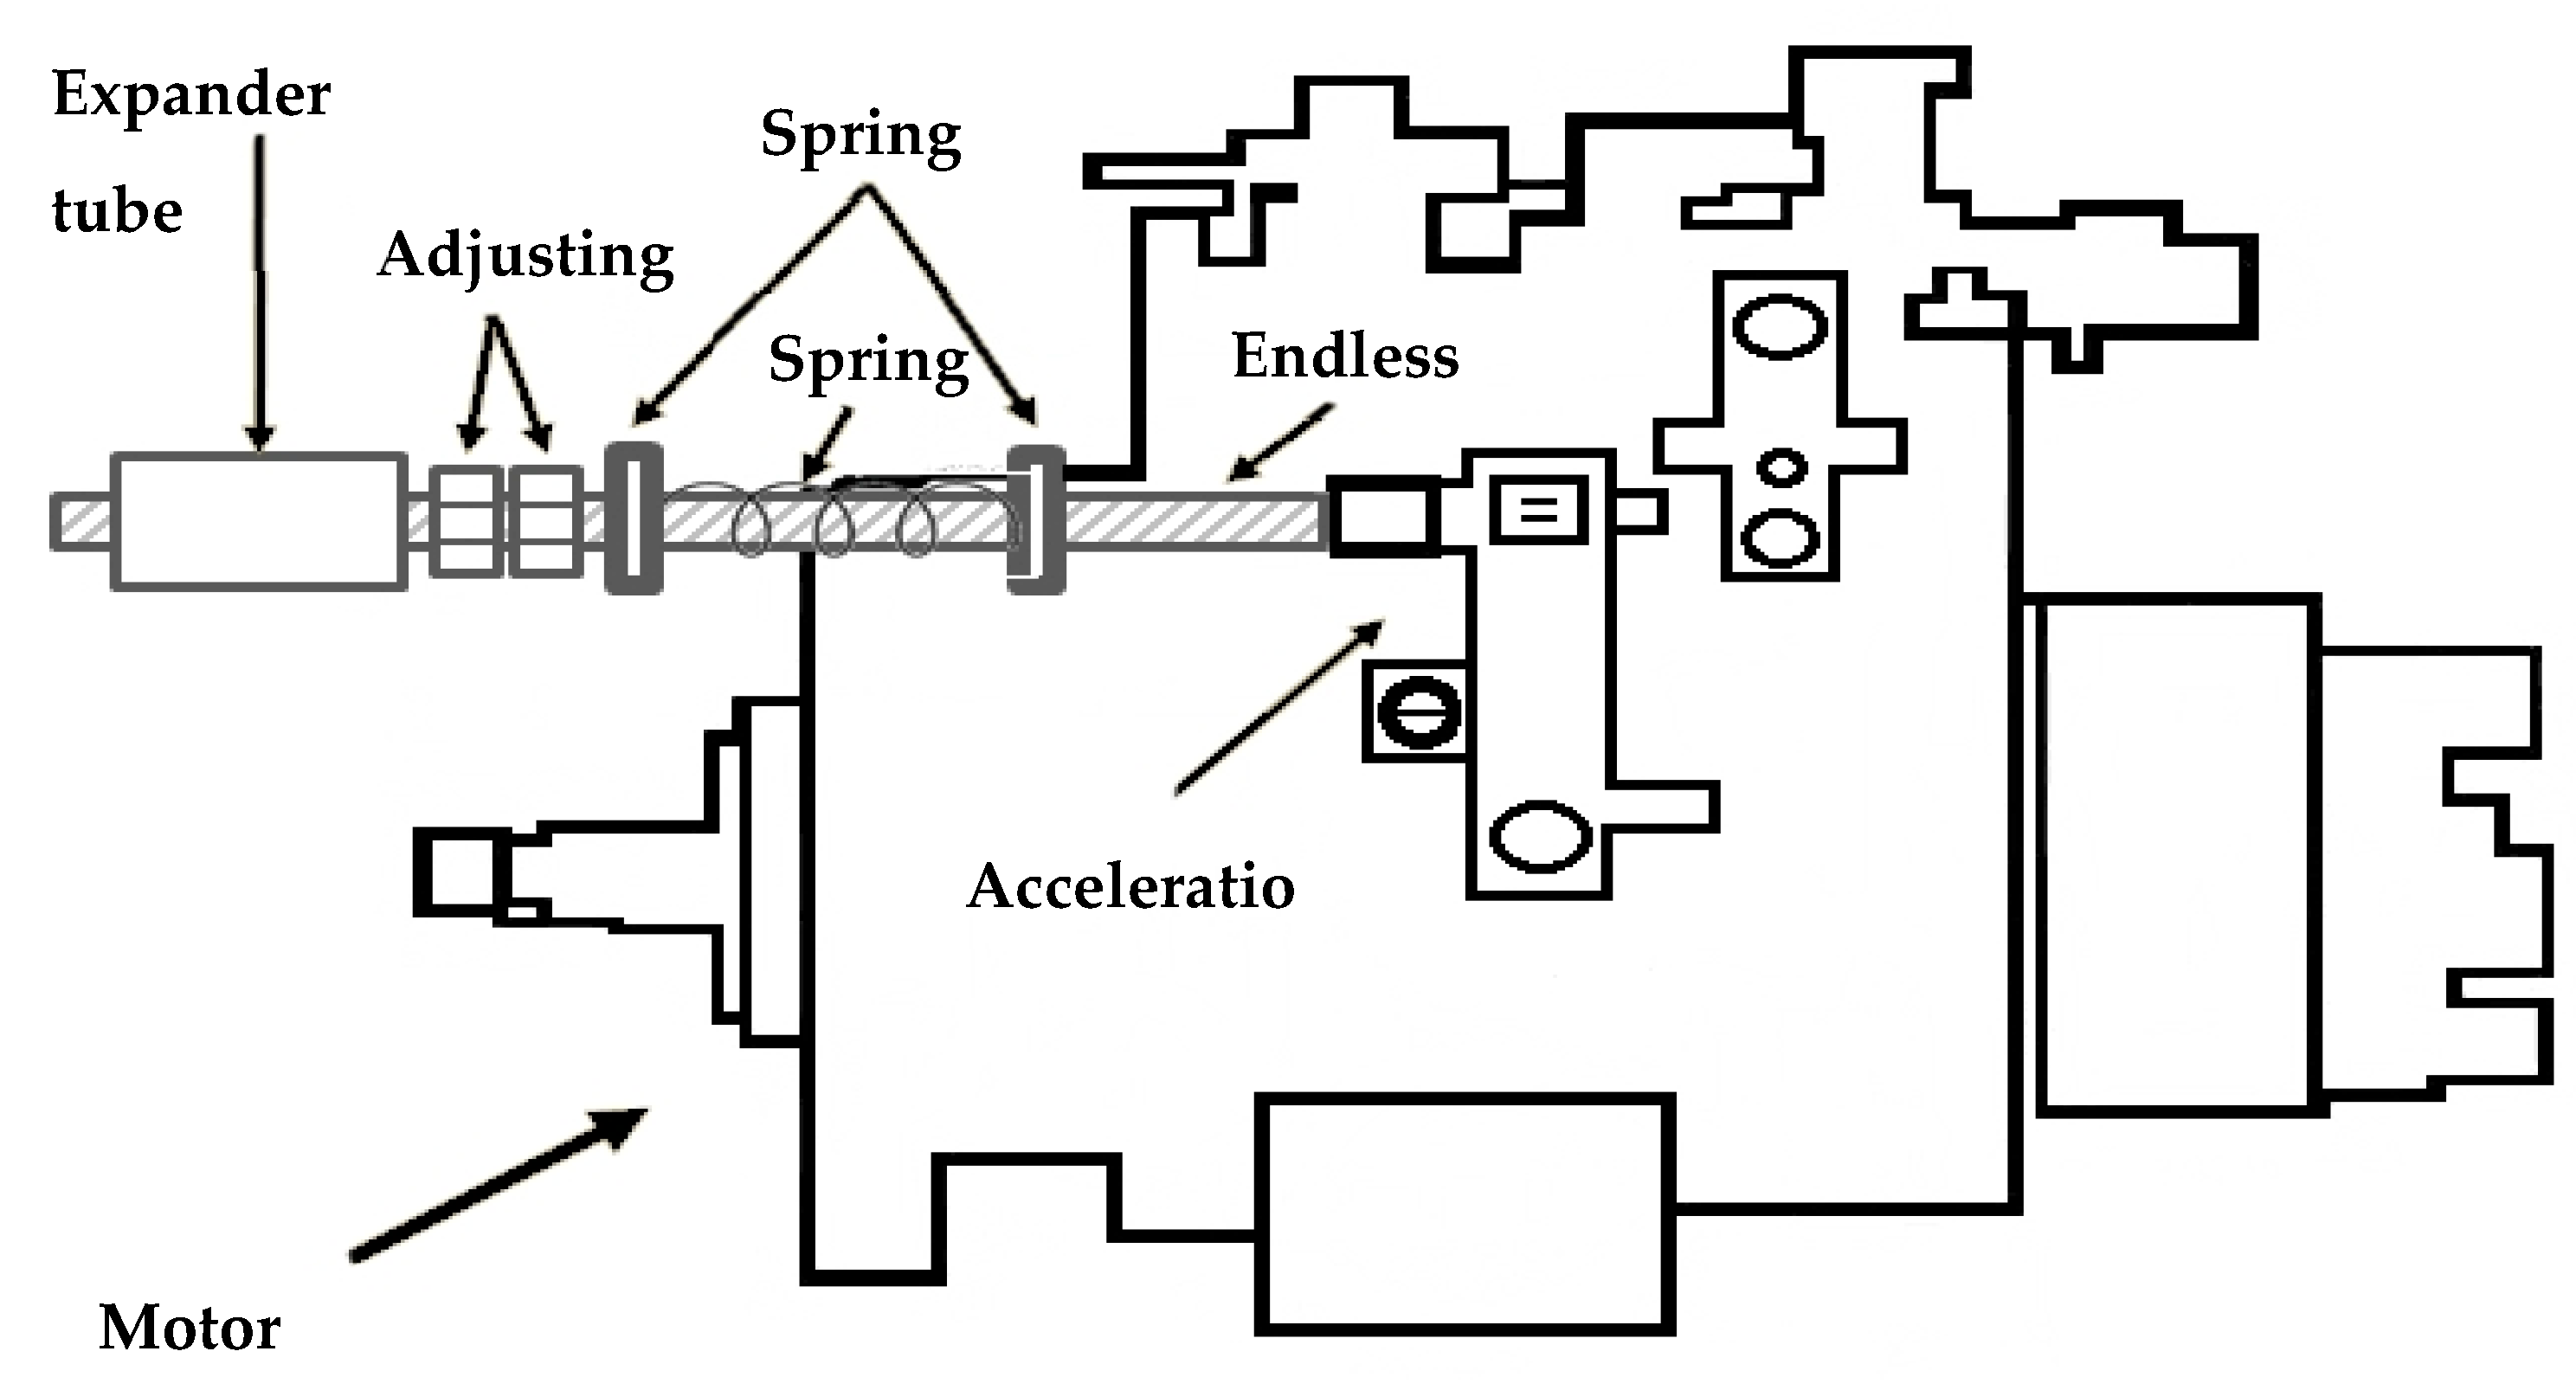
Sustainability 11 04918 g009
Figure 10. Adjustment mechanism for RPM.
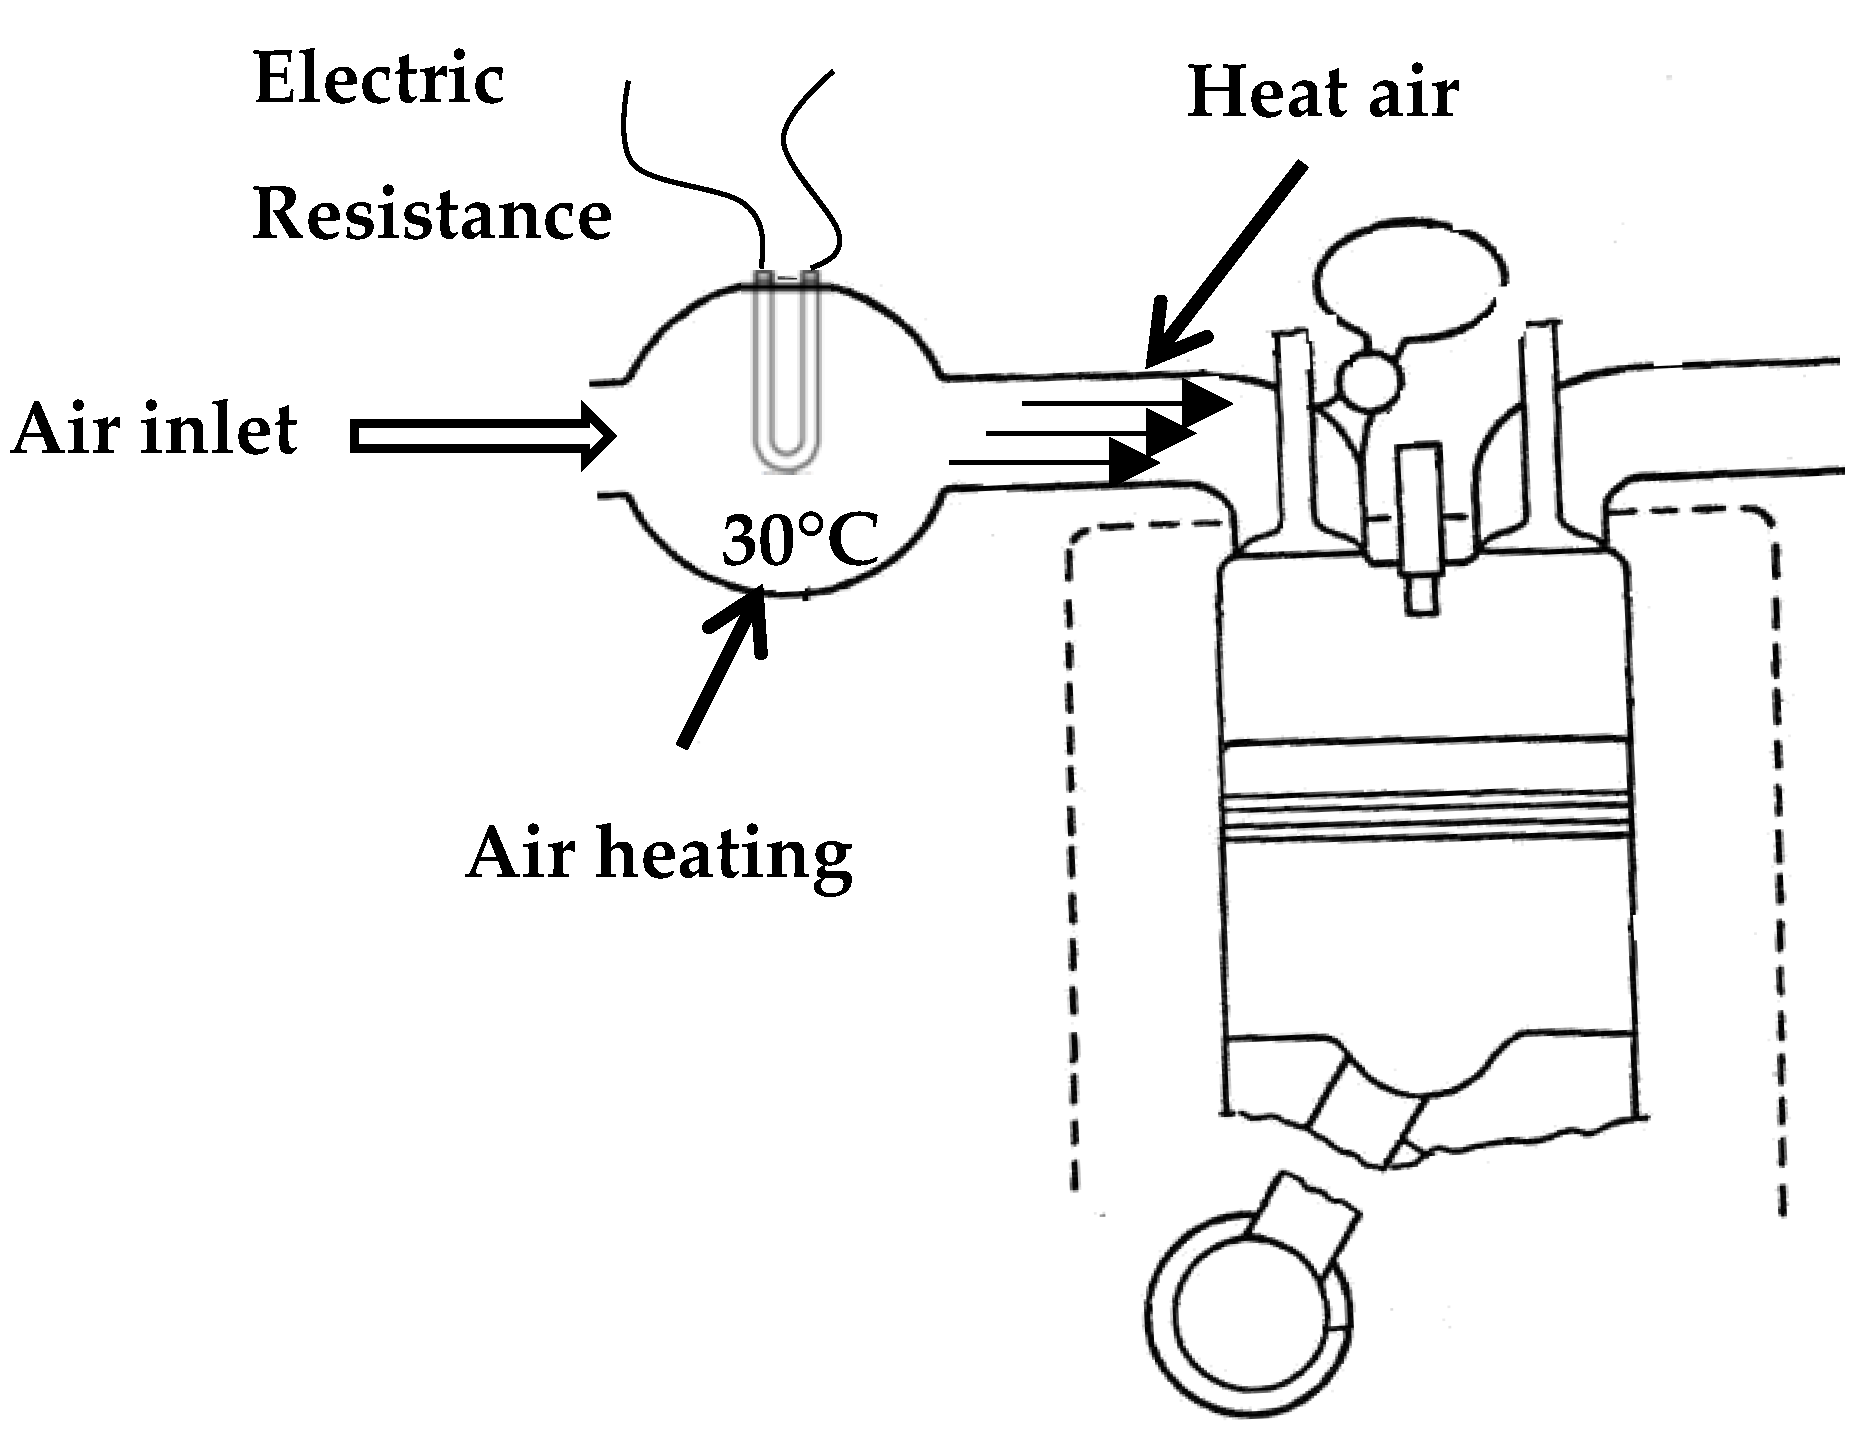
Sustainability 11 04918 g010
Figure 11. Preheating air chamber for intake manifold.
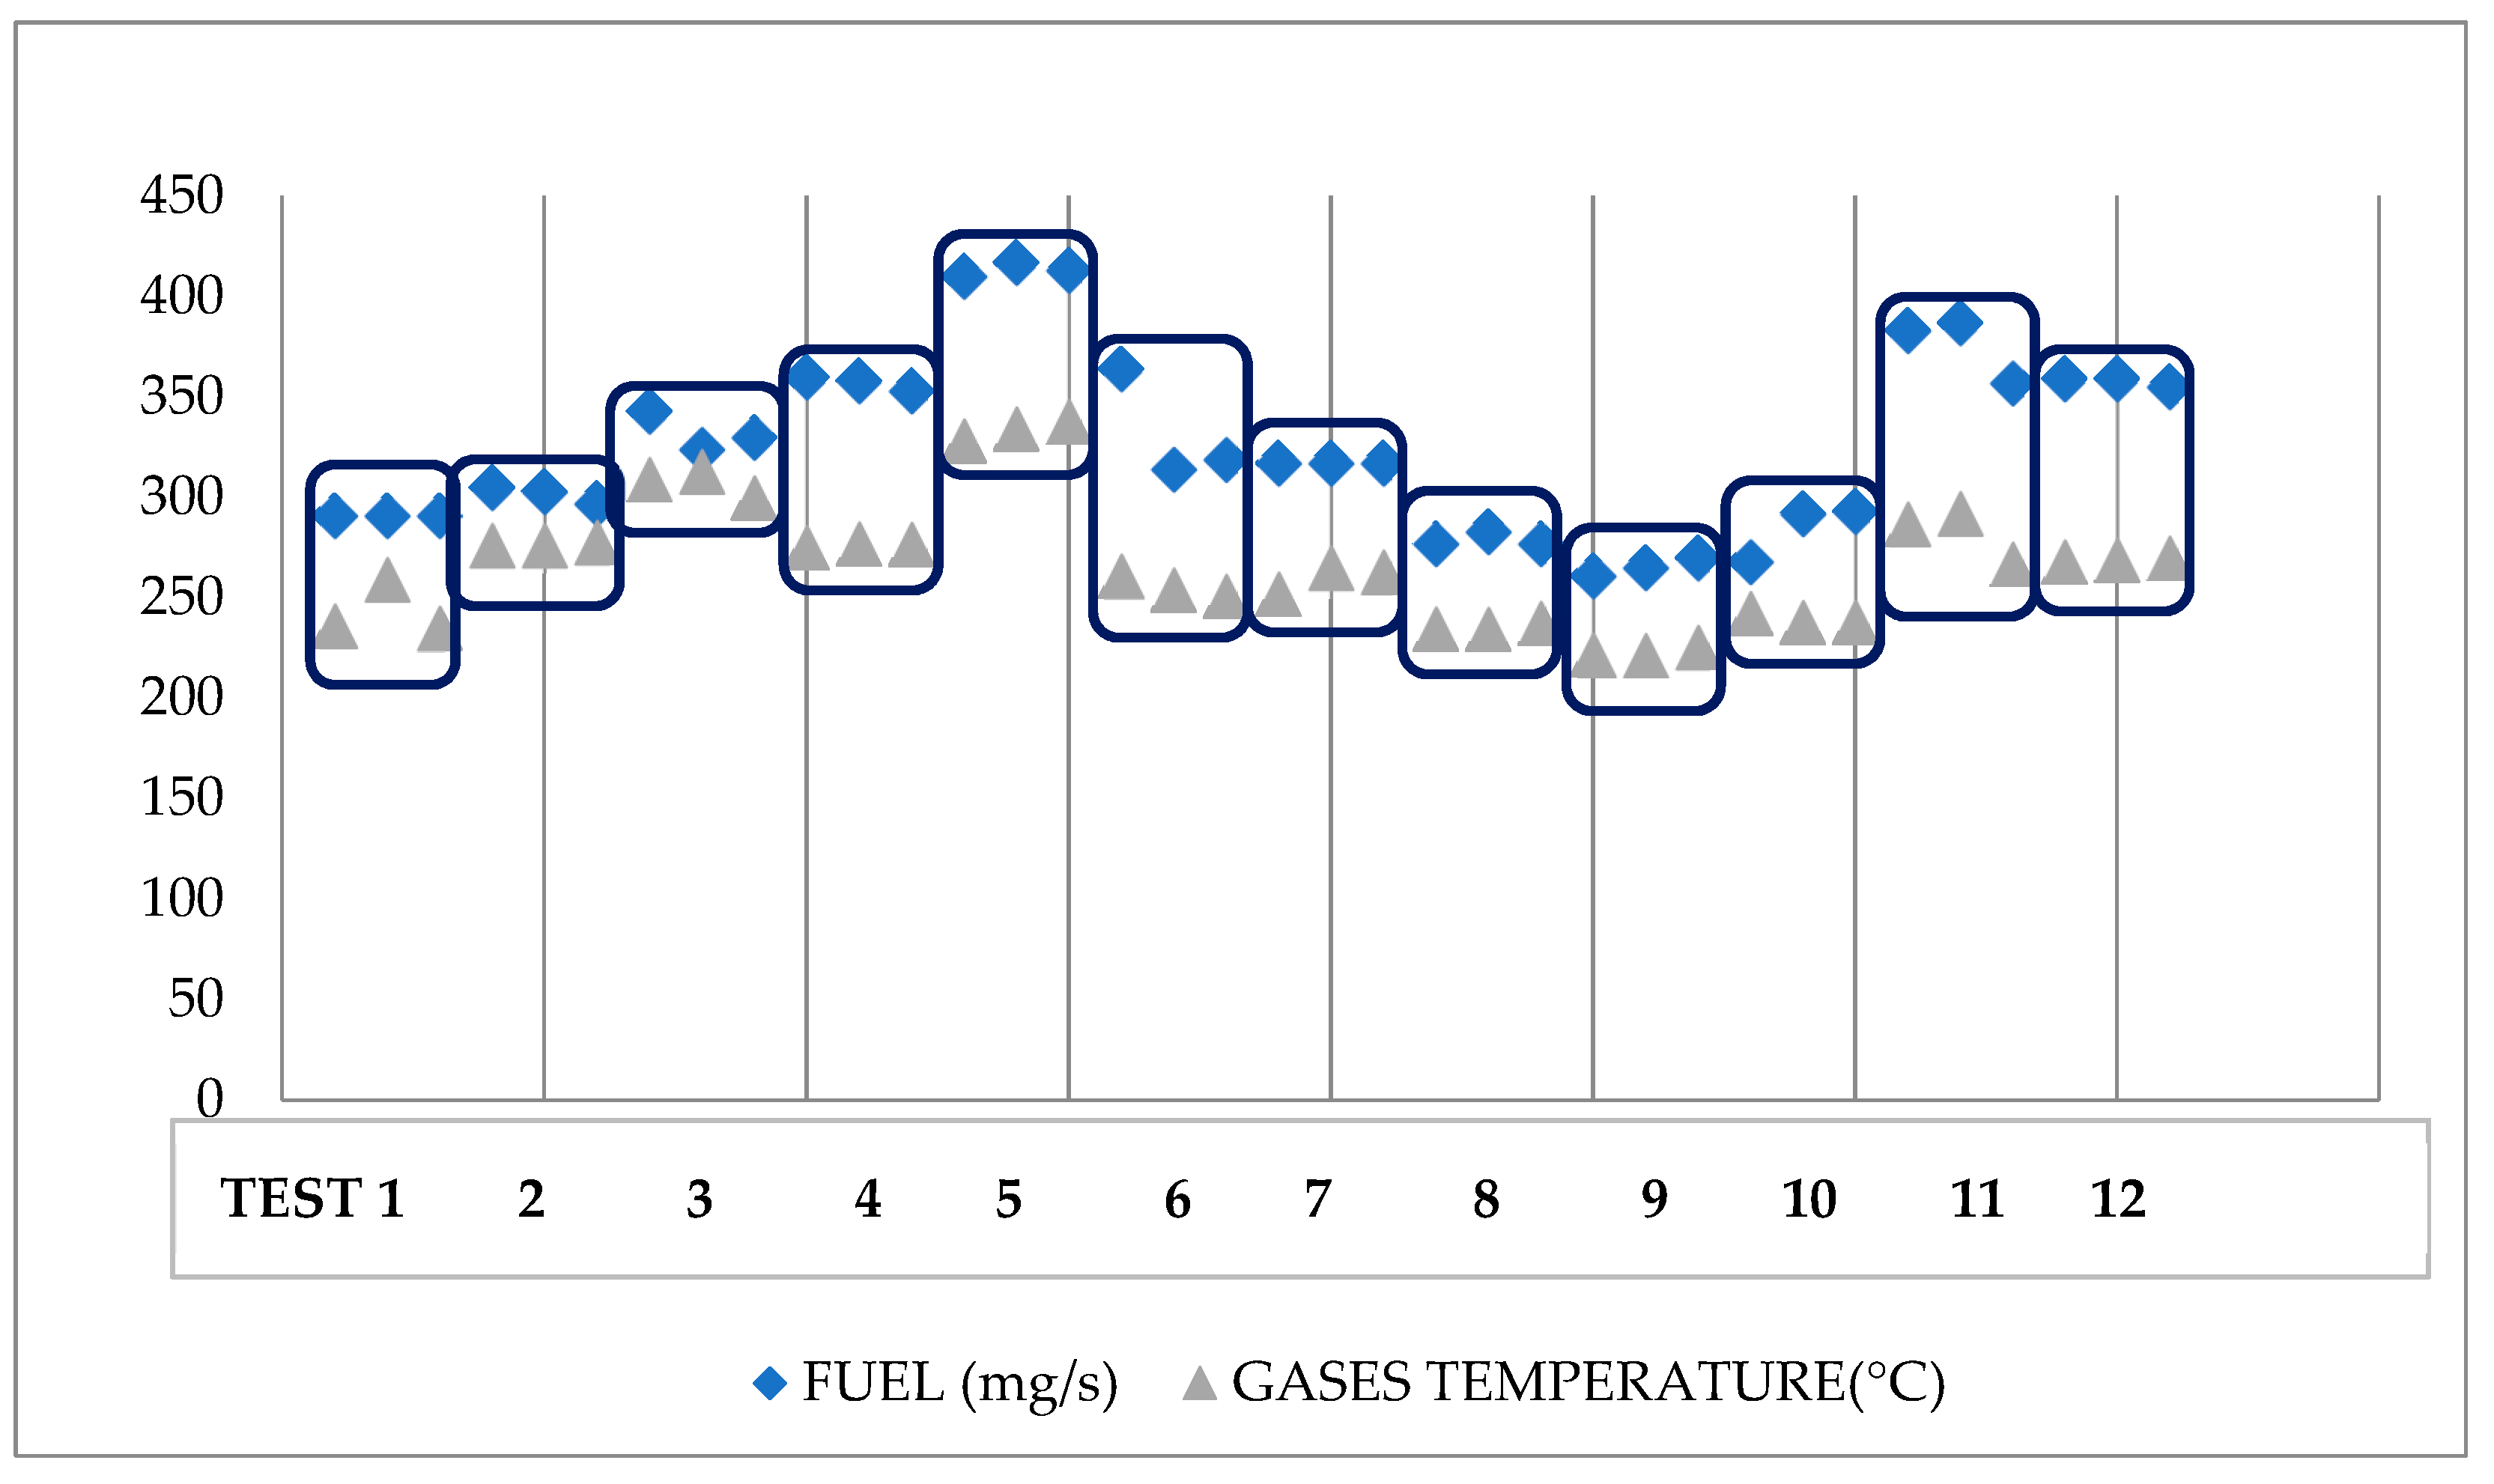
Sustainability 11 04918 g011
Figure 12. Measured values of the fuel consumption and exhaust gases temperature after the improved engine set up.
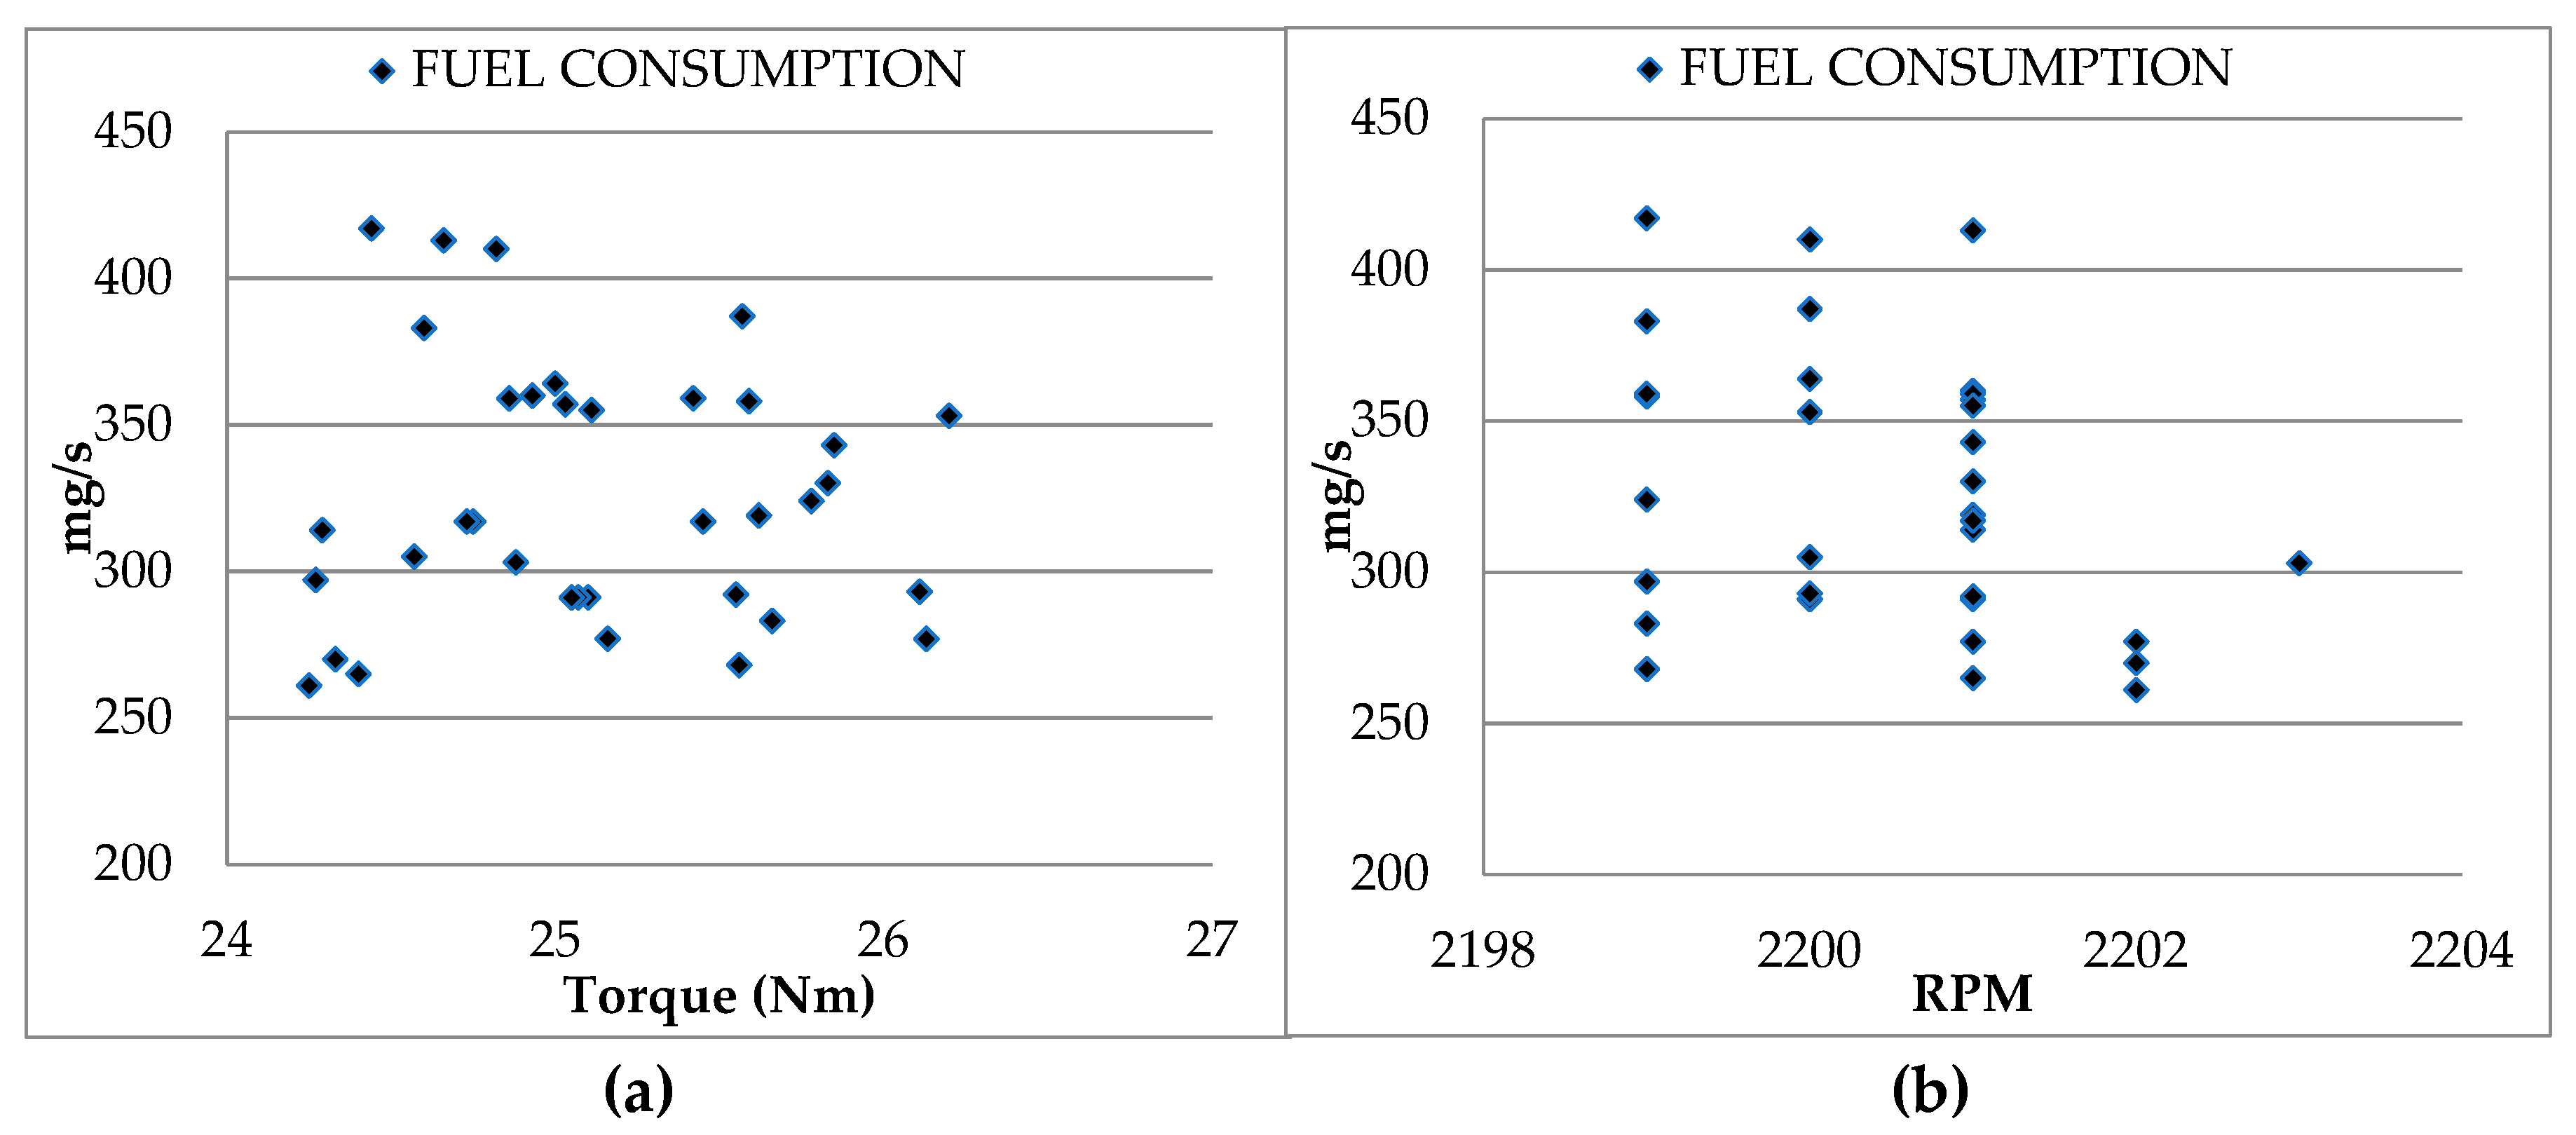
Sustainability 11 04918 g012
Figure 13. Fuel consumption behavior. (a) Fuel consumption vs torque; (b) Fuel consumption vs RPM.
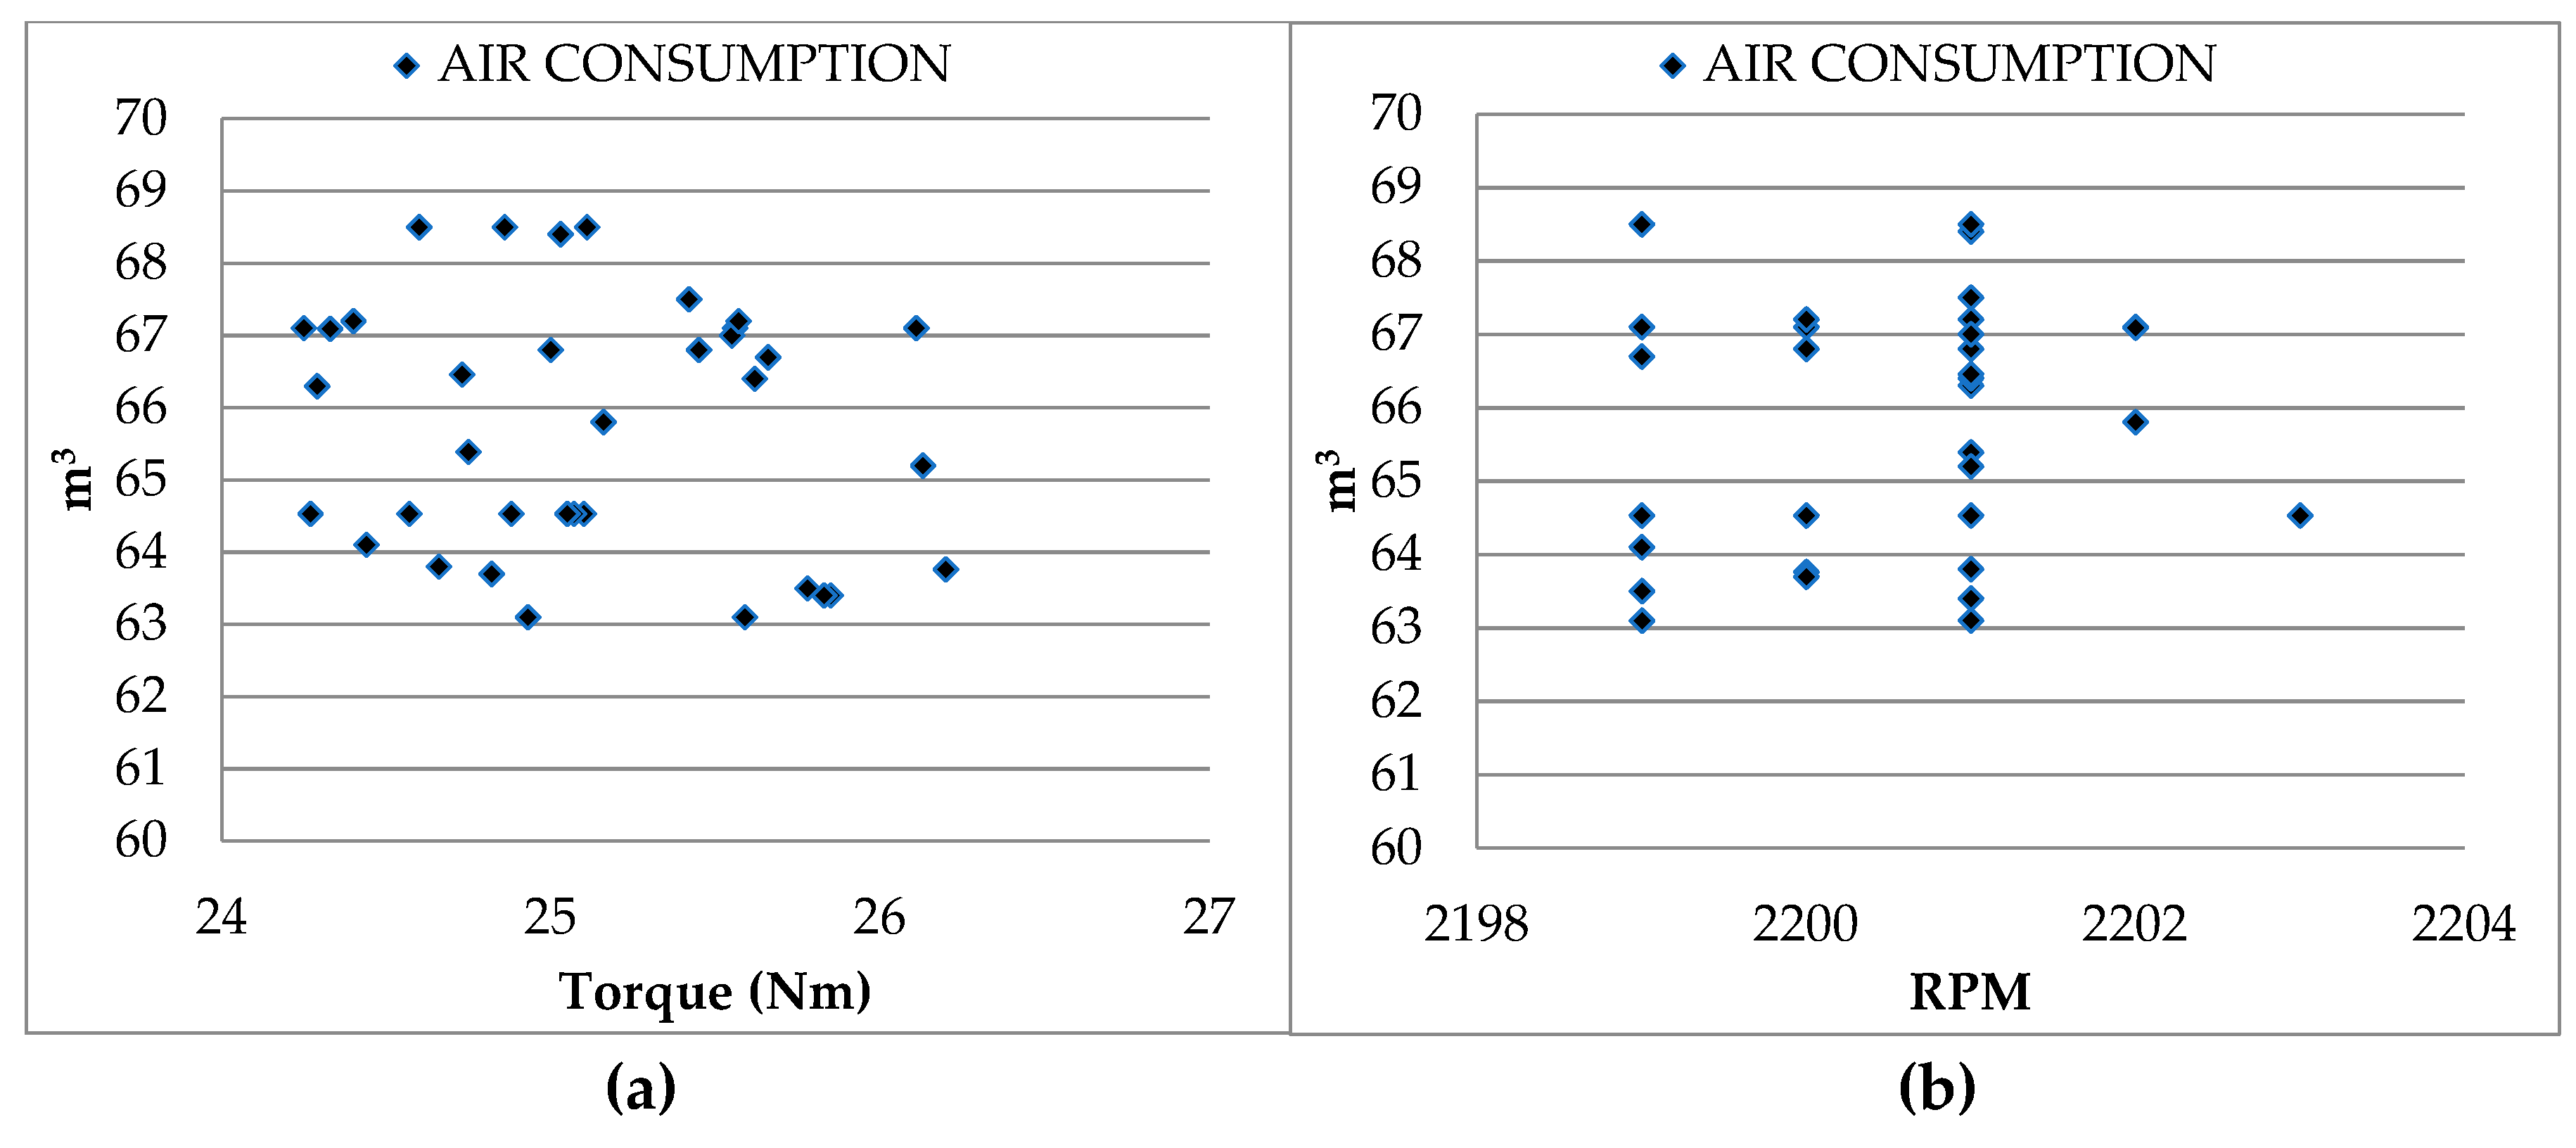
Sustainability 11 04918 g013
Figure 14. Air consumption behavior. (a) Air consumption vs torque; (b) Air consumption vs RPM.
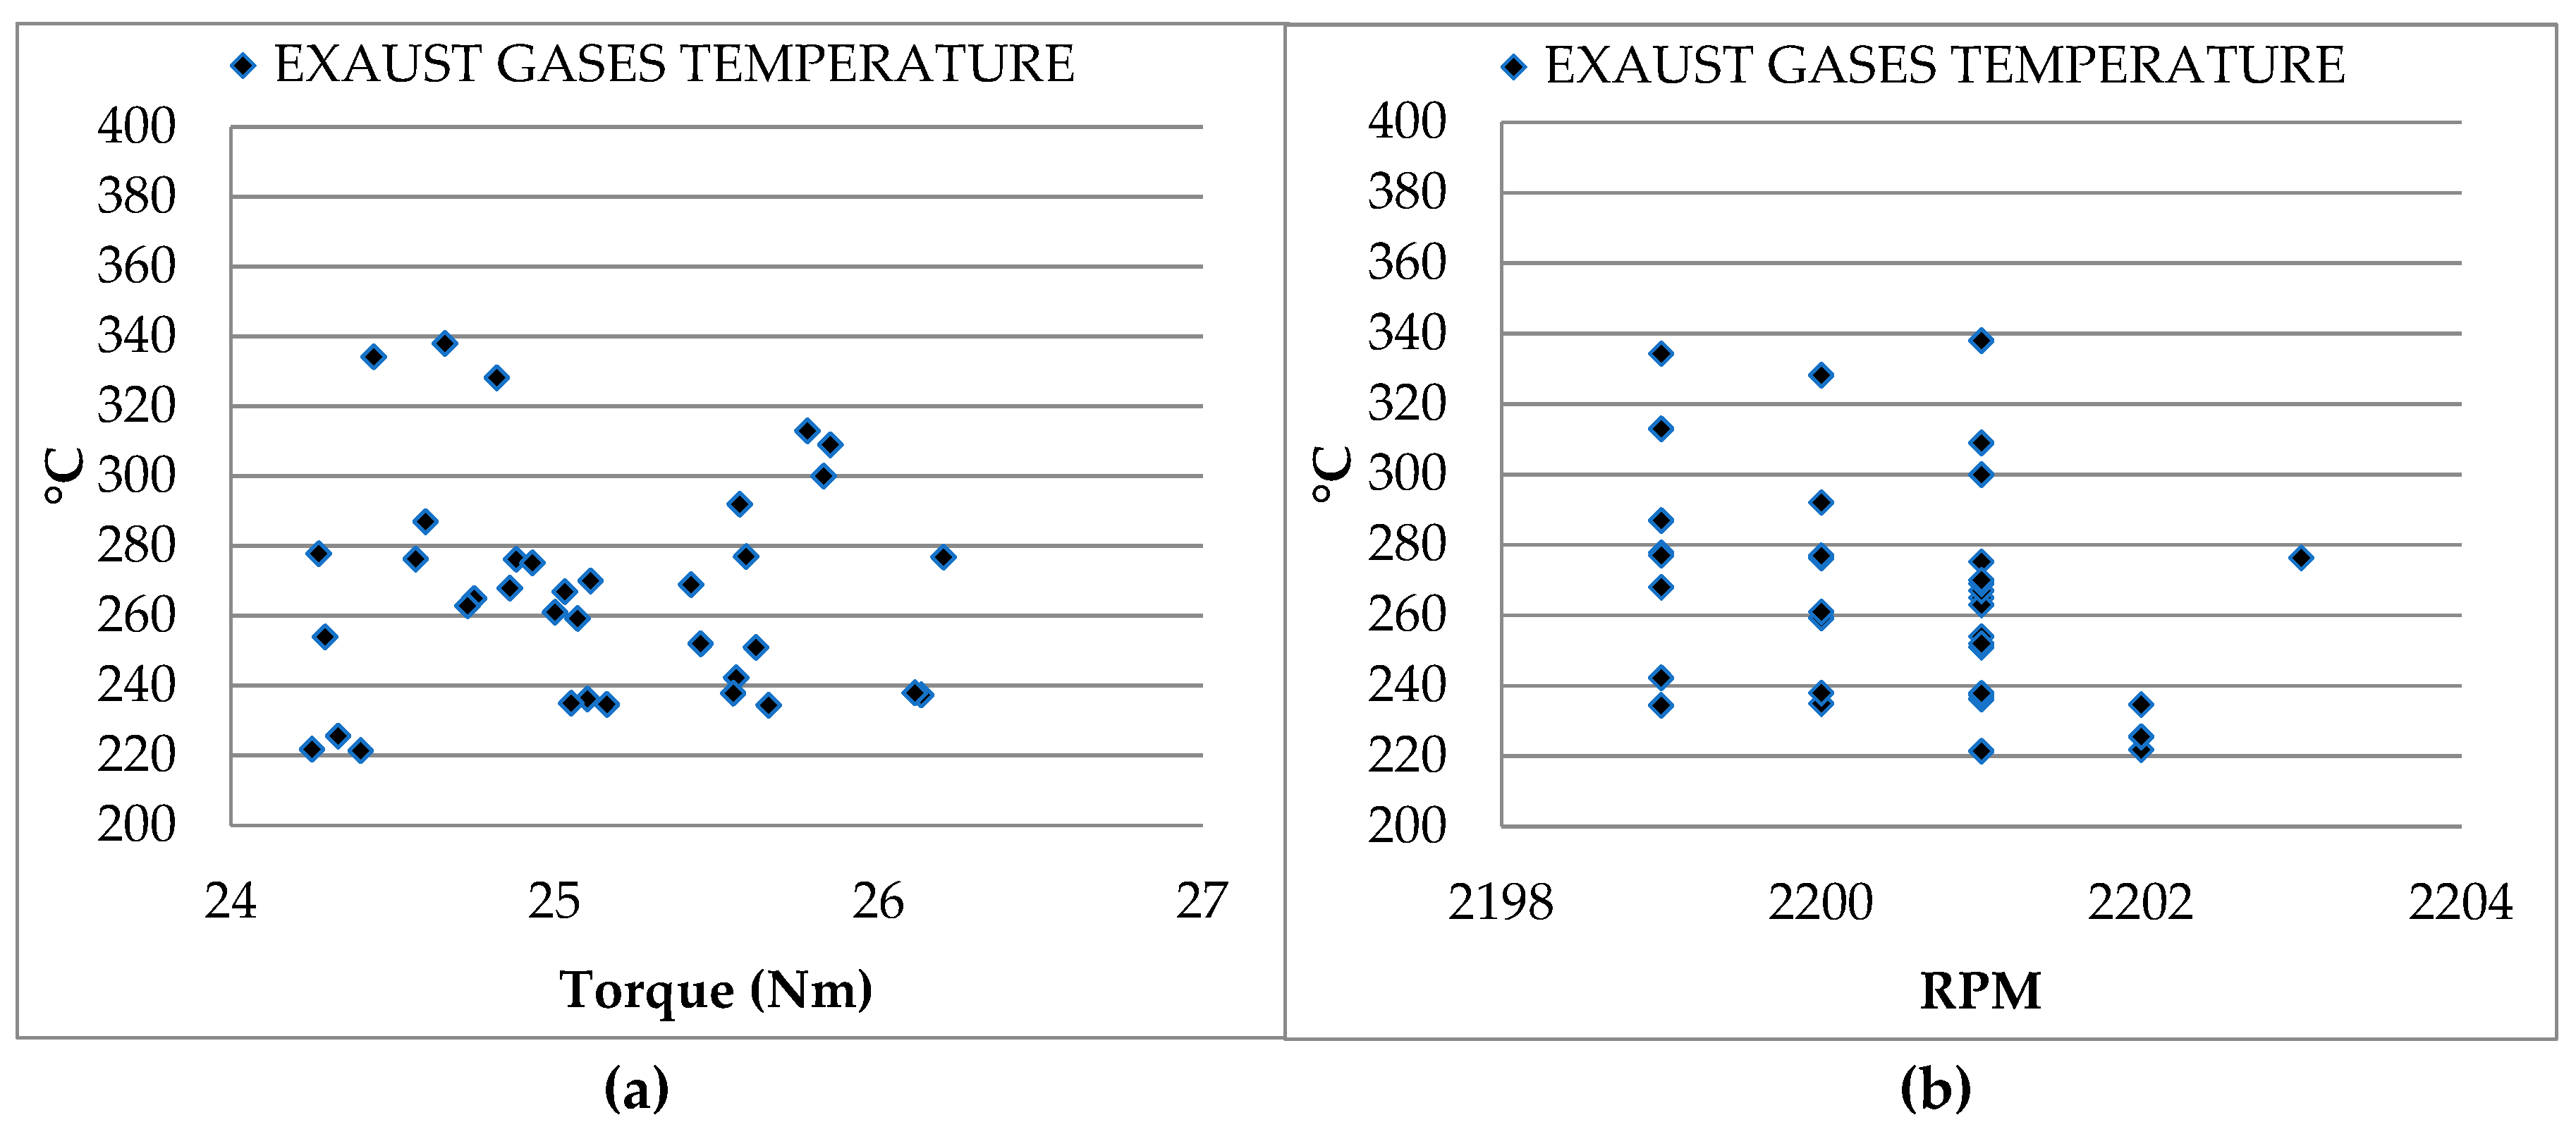
Sustainability 11 04918 g014
Figure 15. Gases temperature behavior. (a) Exhaust gases temperature vs torque; (b) Exhaust gases temperature vs RPM.
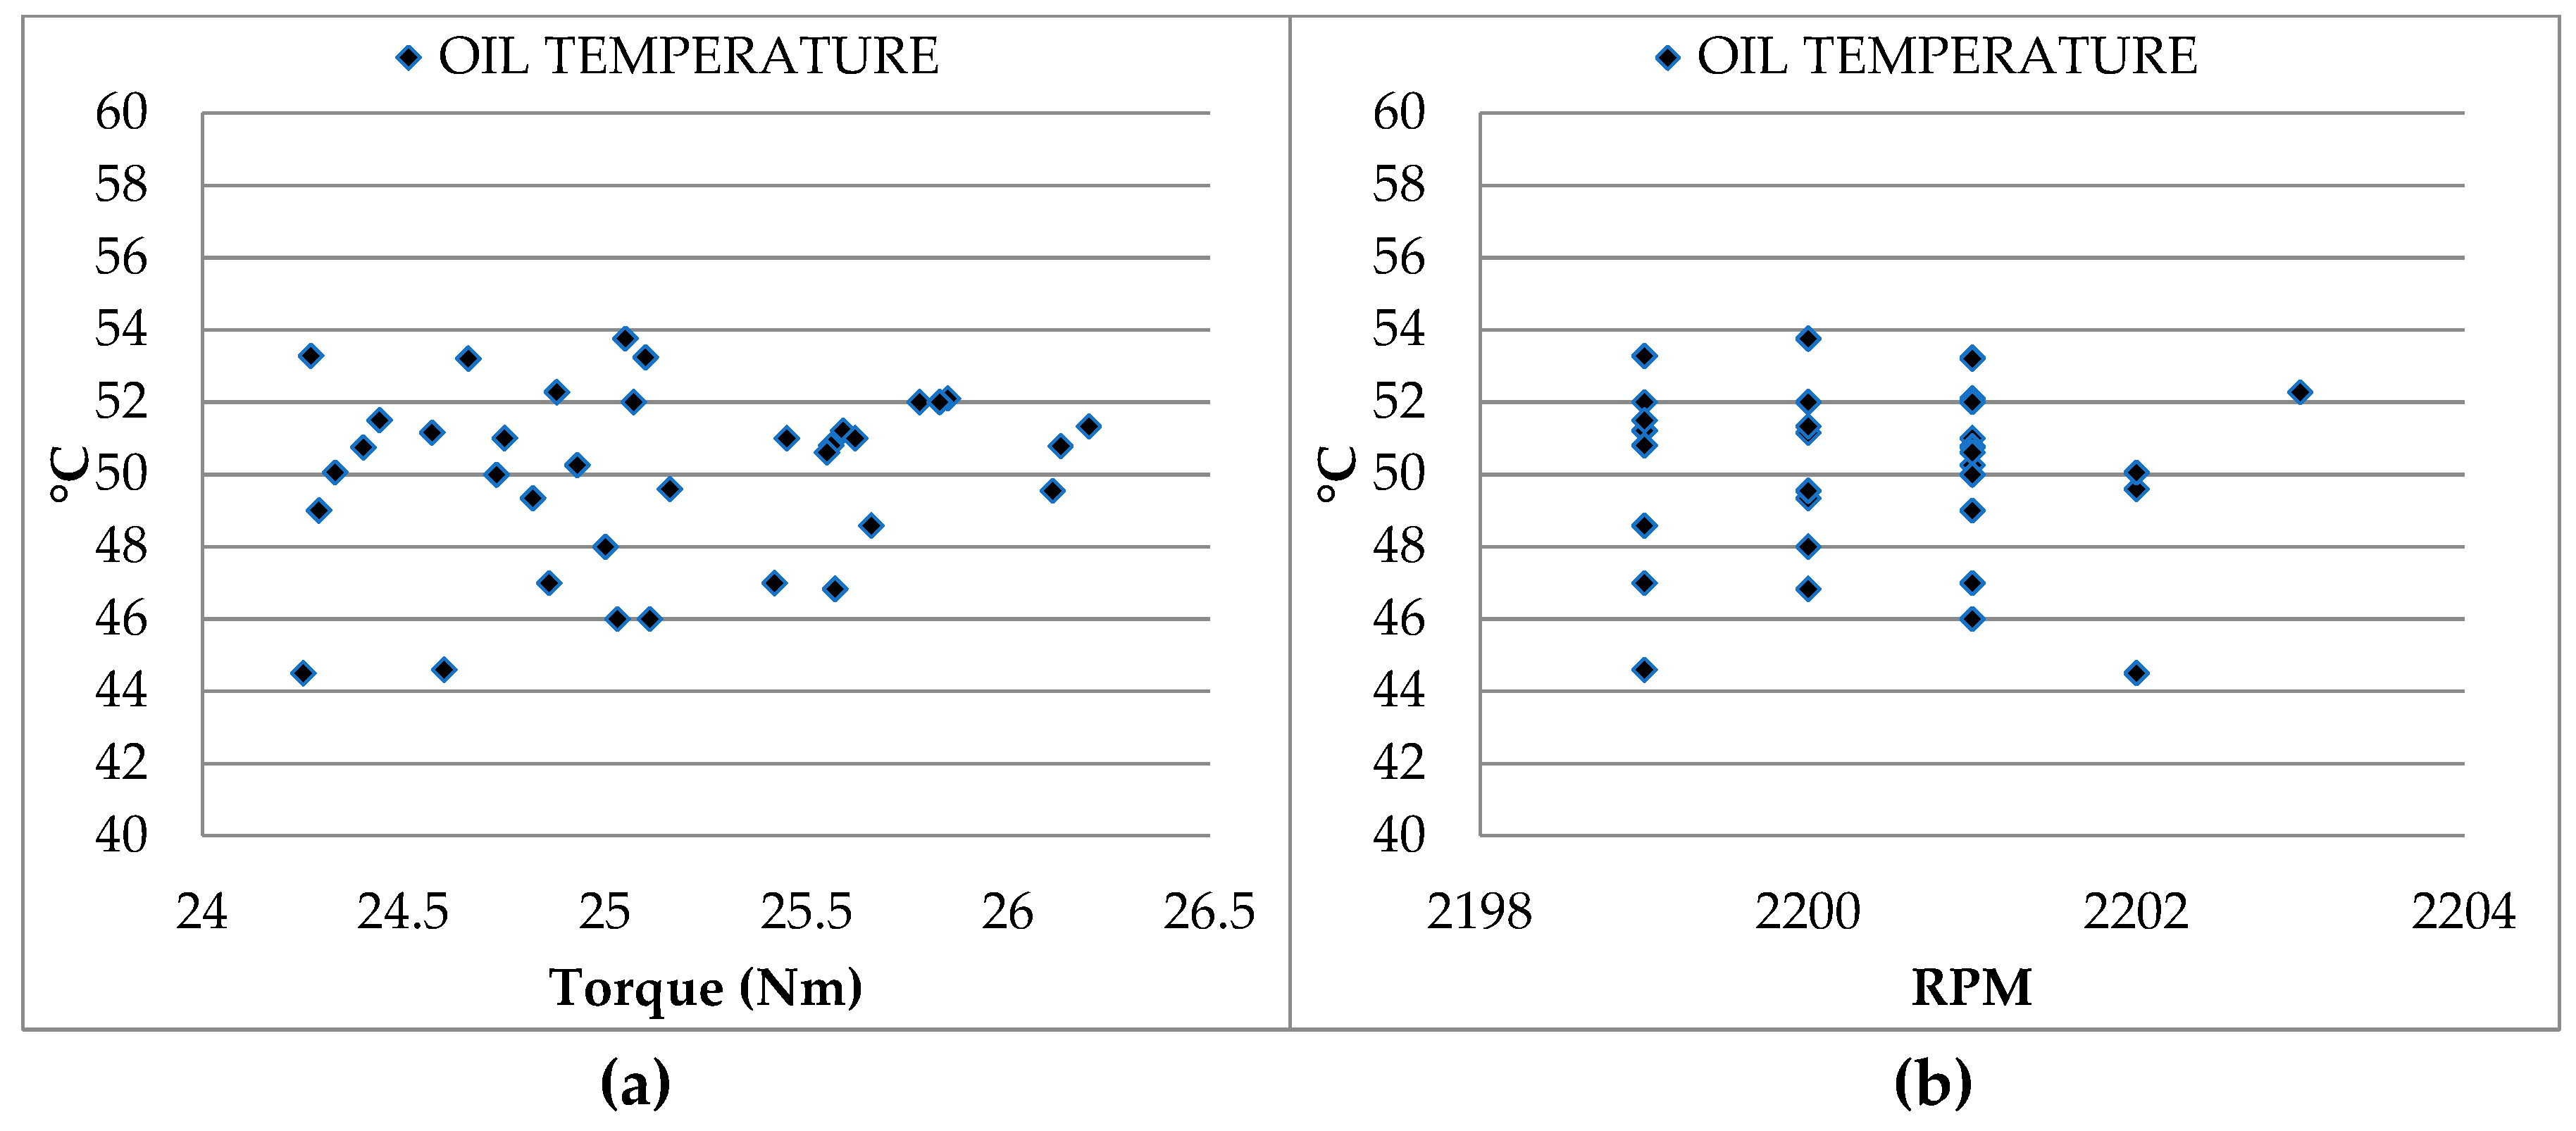
Sustainability 11 04918 g015
Figure 16. Oil temperature behavior. (a) Oil temperature vs torque; (b) Oil temperature vs RPM.
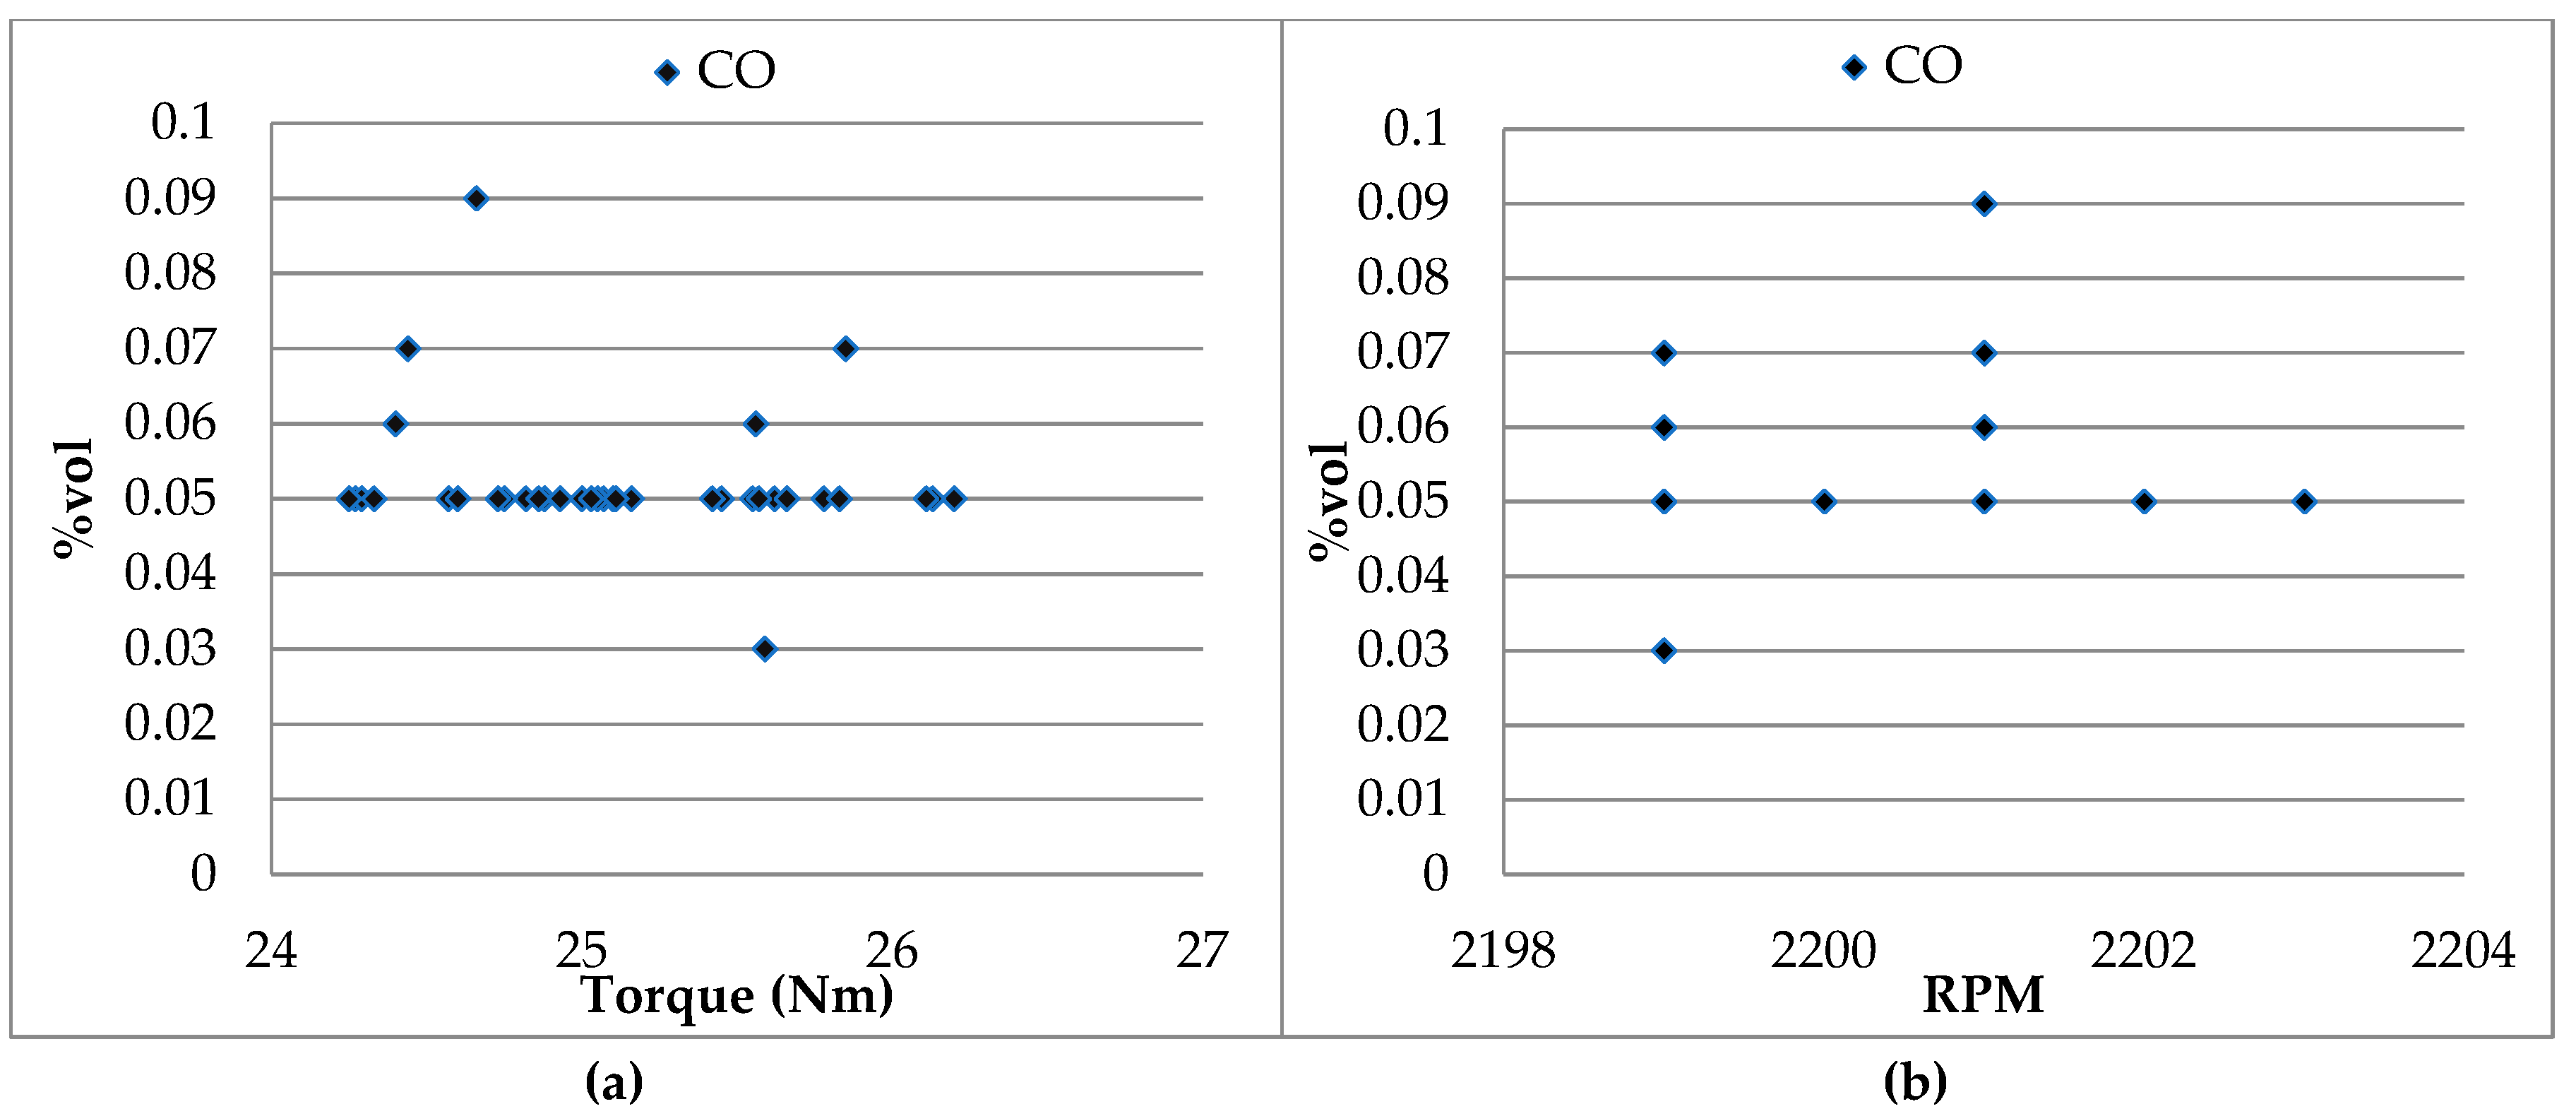
Sustainability 11 04918 g016
Figure 17. CO emissions behavior. (a) Dispersion data torque vs CO; (b) Dispersion data RPM vs CO.
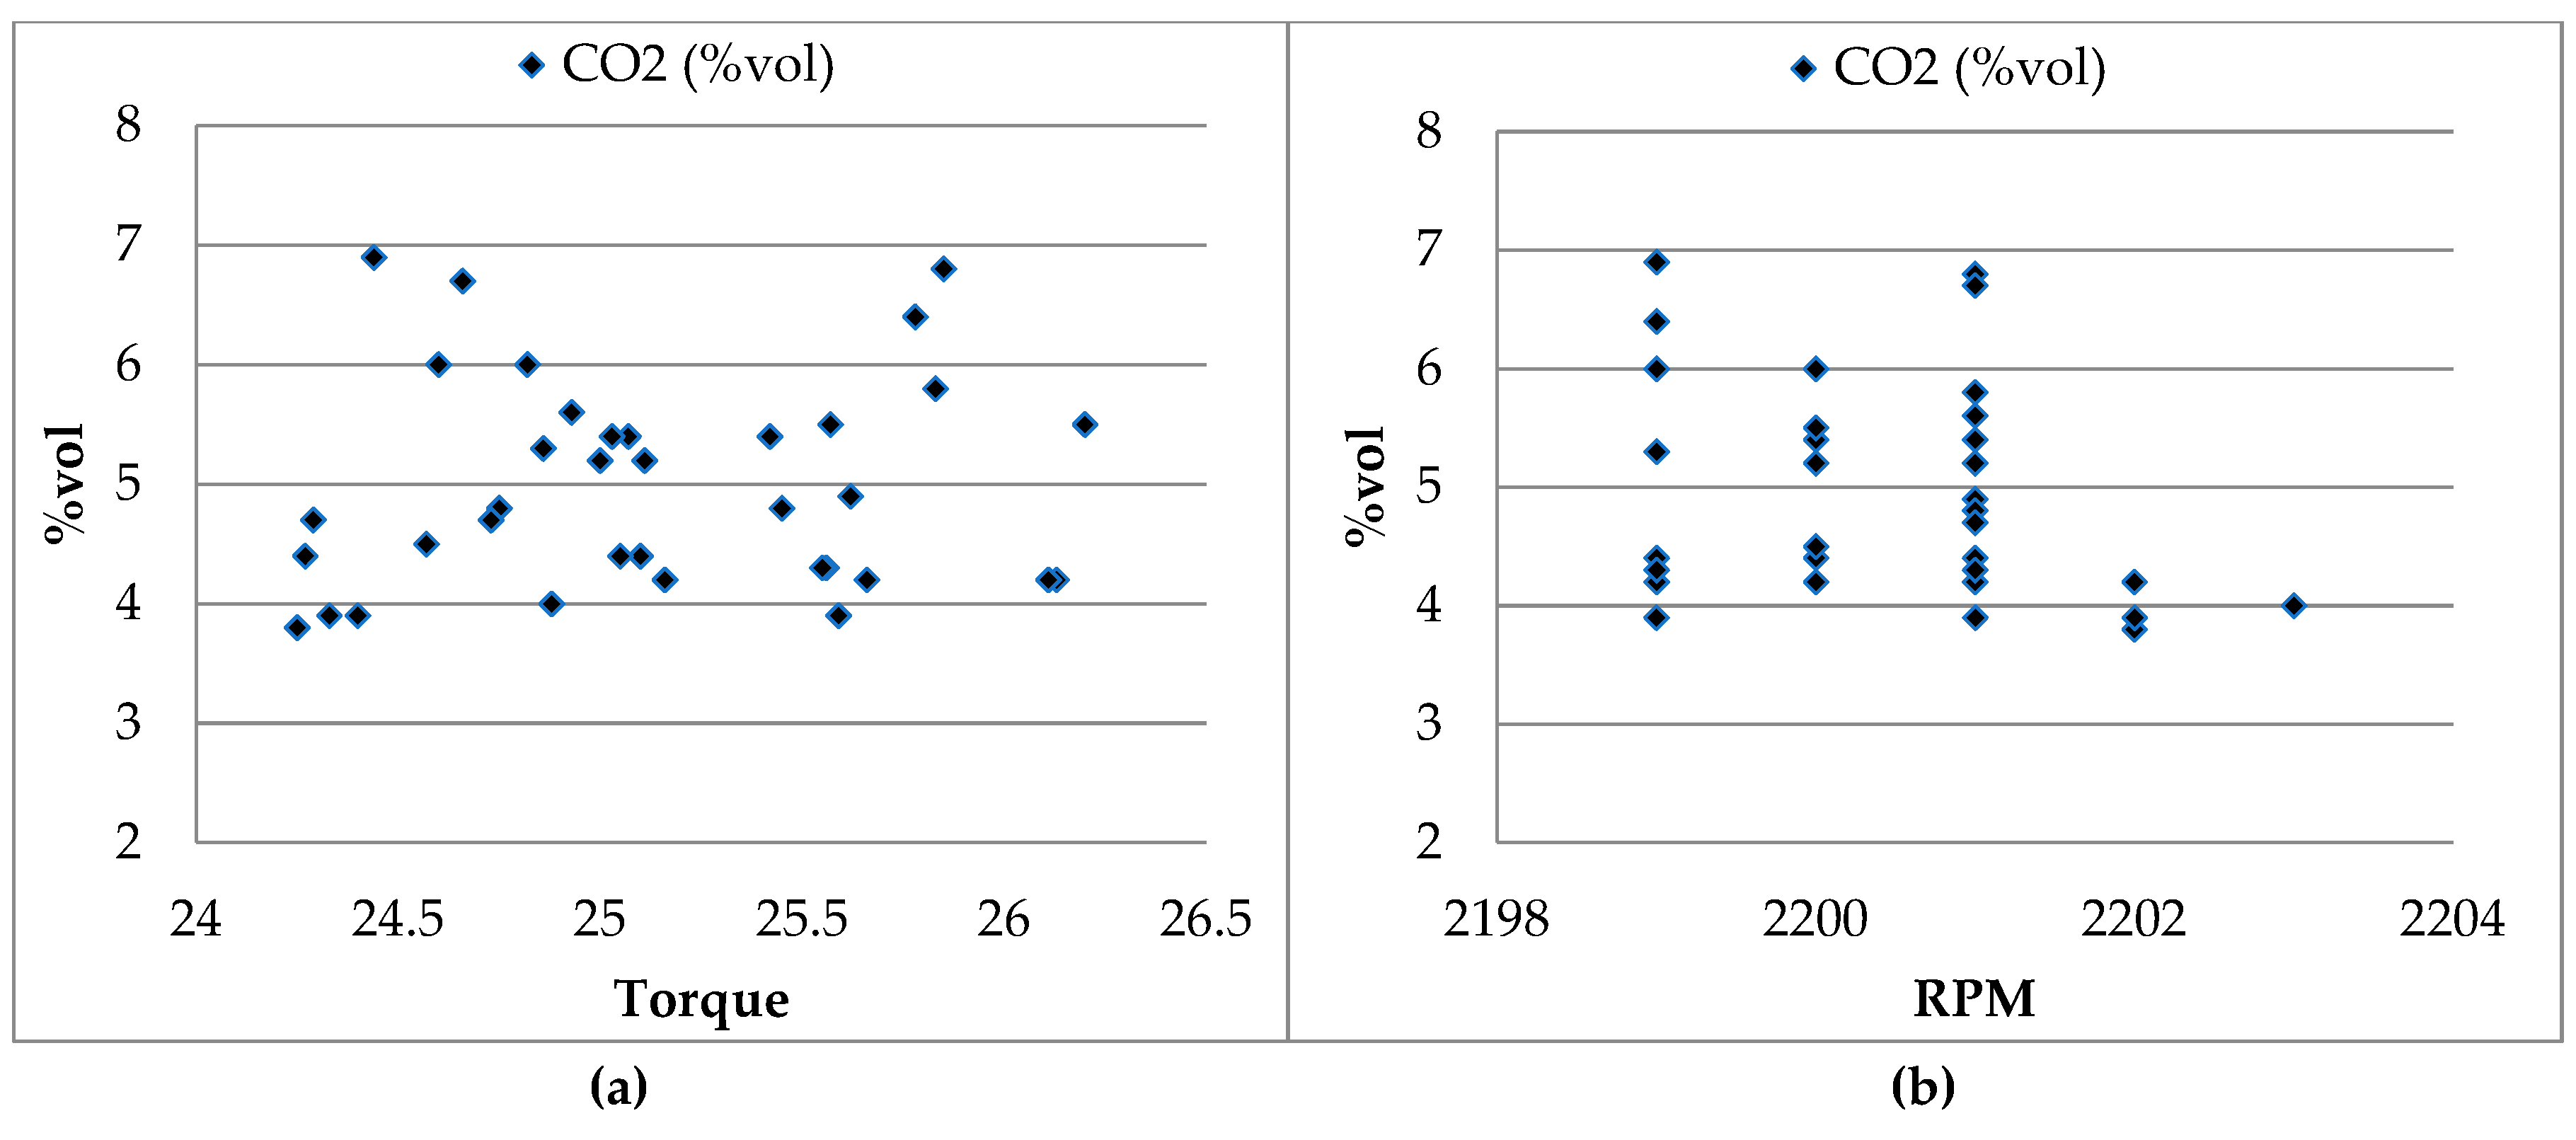
Sustainability 11 04918 g017
Figure 18. CO2 emissions behavior. (a) Dispersion data of the torque vs CO2; (b) Dispersion data of the RPM vs CO2.
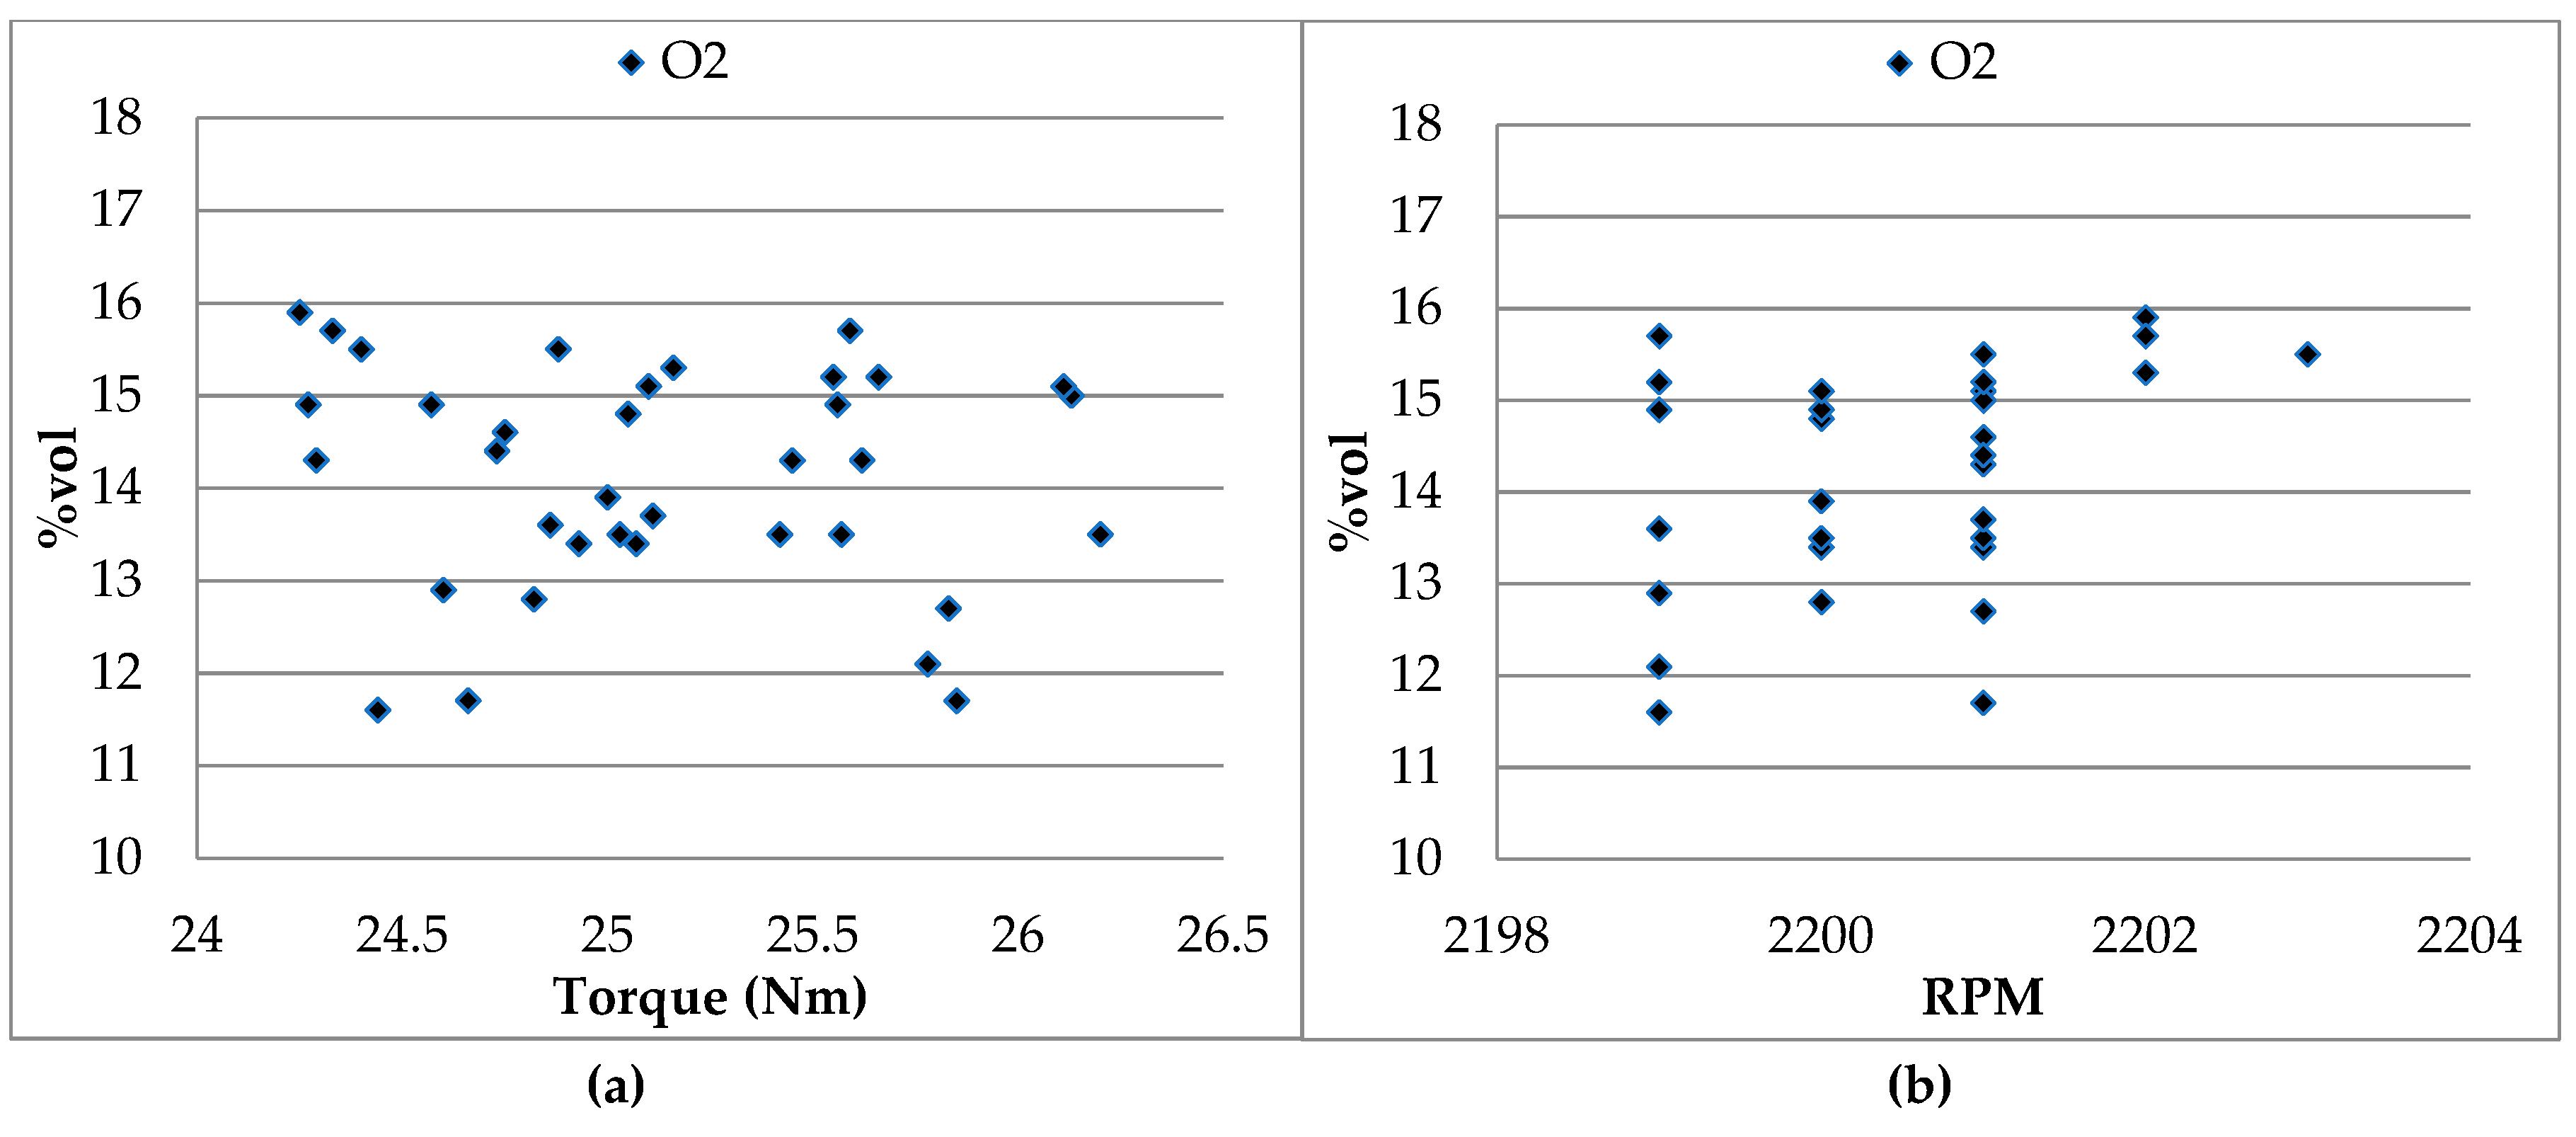
Sustainability 11 04918 g018
Figure 19. O2 Emissions behavior. (a) Dispersion data of the torque vs O2; (b) Dispersion data of the RPM vs O2.
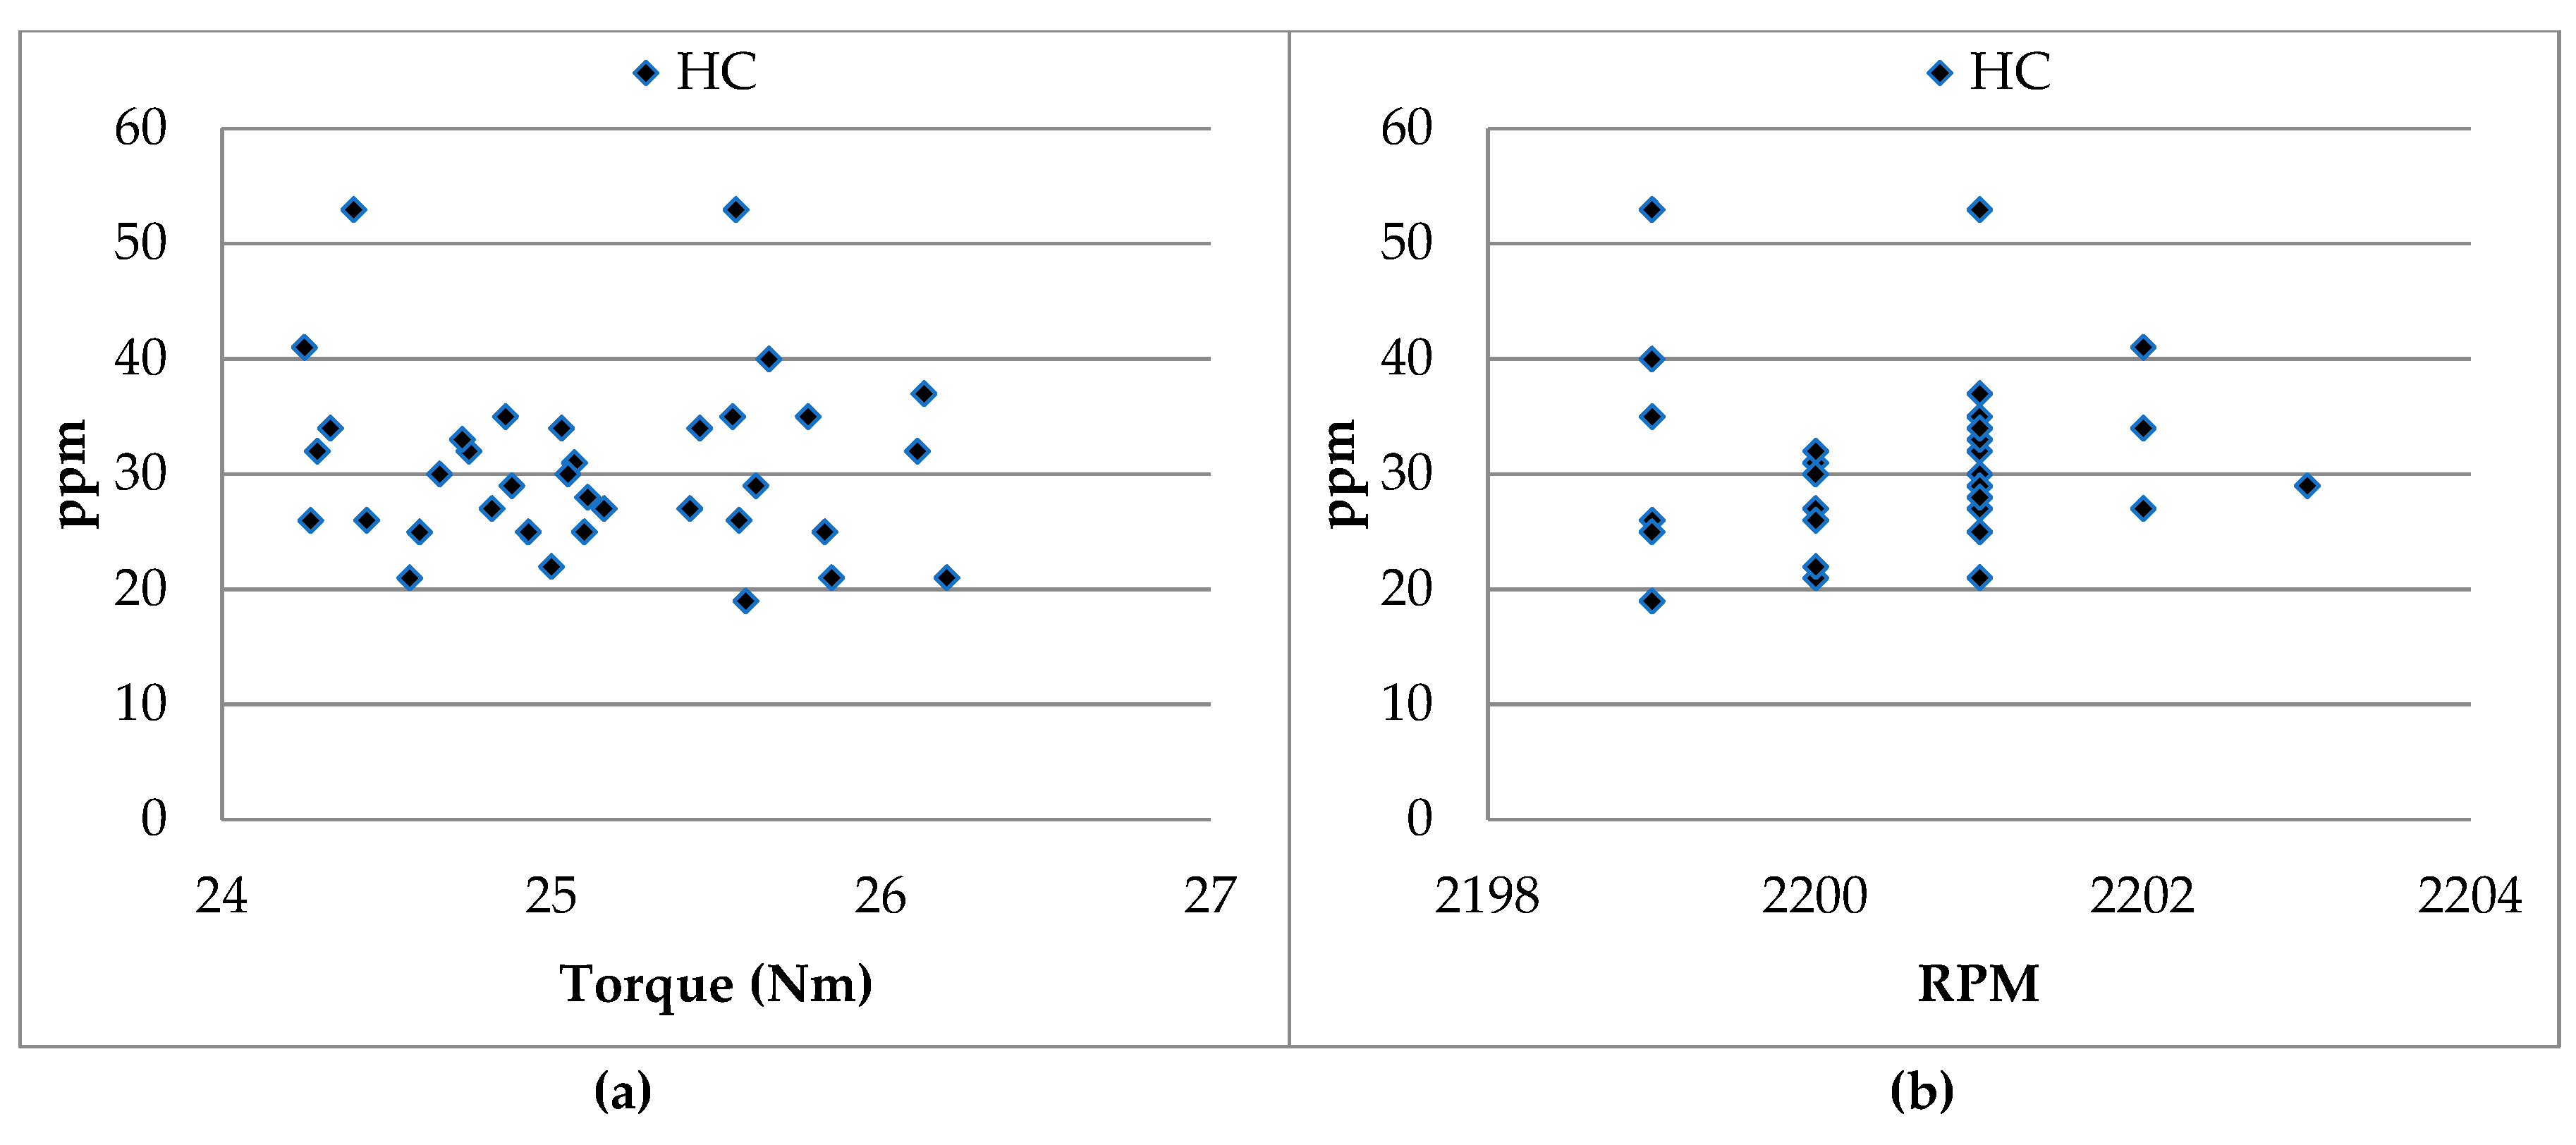
Sustainability 11 04918 g019
Figure 20. HC emissions behavior. (a) Dispersion data of the torque vs HC; (b) Dispersion data of the RPM vs HC.
Sustainability 11 04918 g020
Figure 21. NOx emissions behavior. (a) Dispersion data of the torque vs NOX; (b) Dispersion data of the RPM vs NOX.
Sustainability 11 04918 g021
Figure 22. Actuals fuels costs vs power obtain.
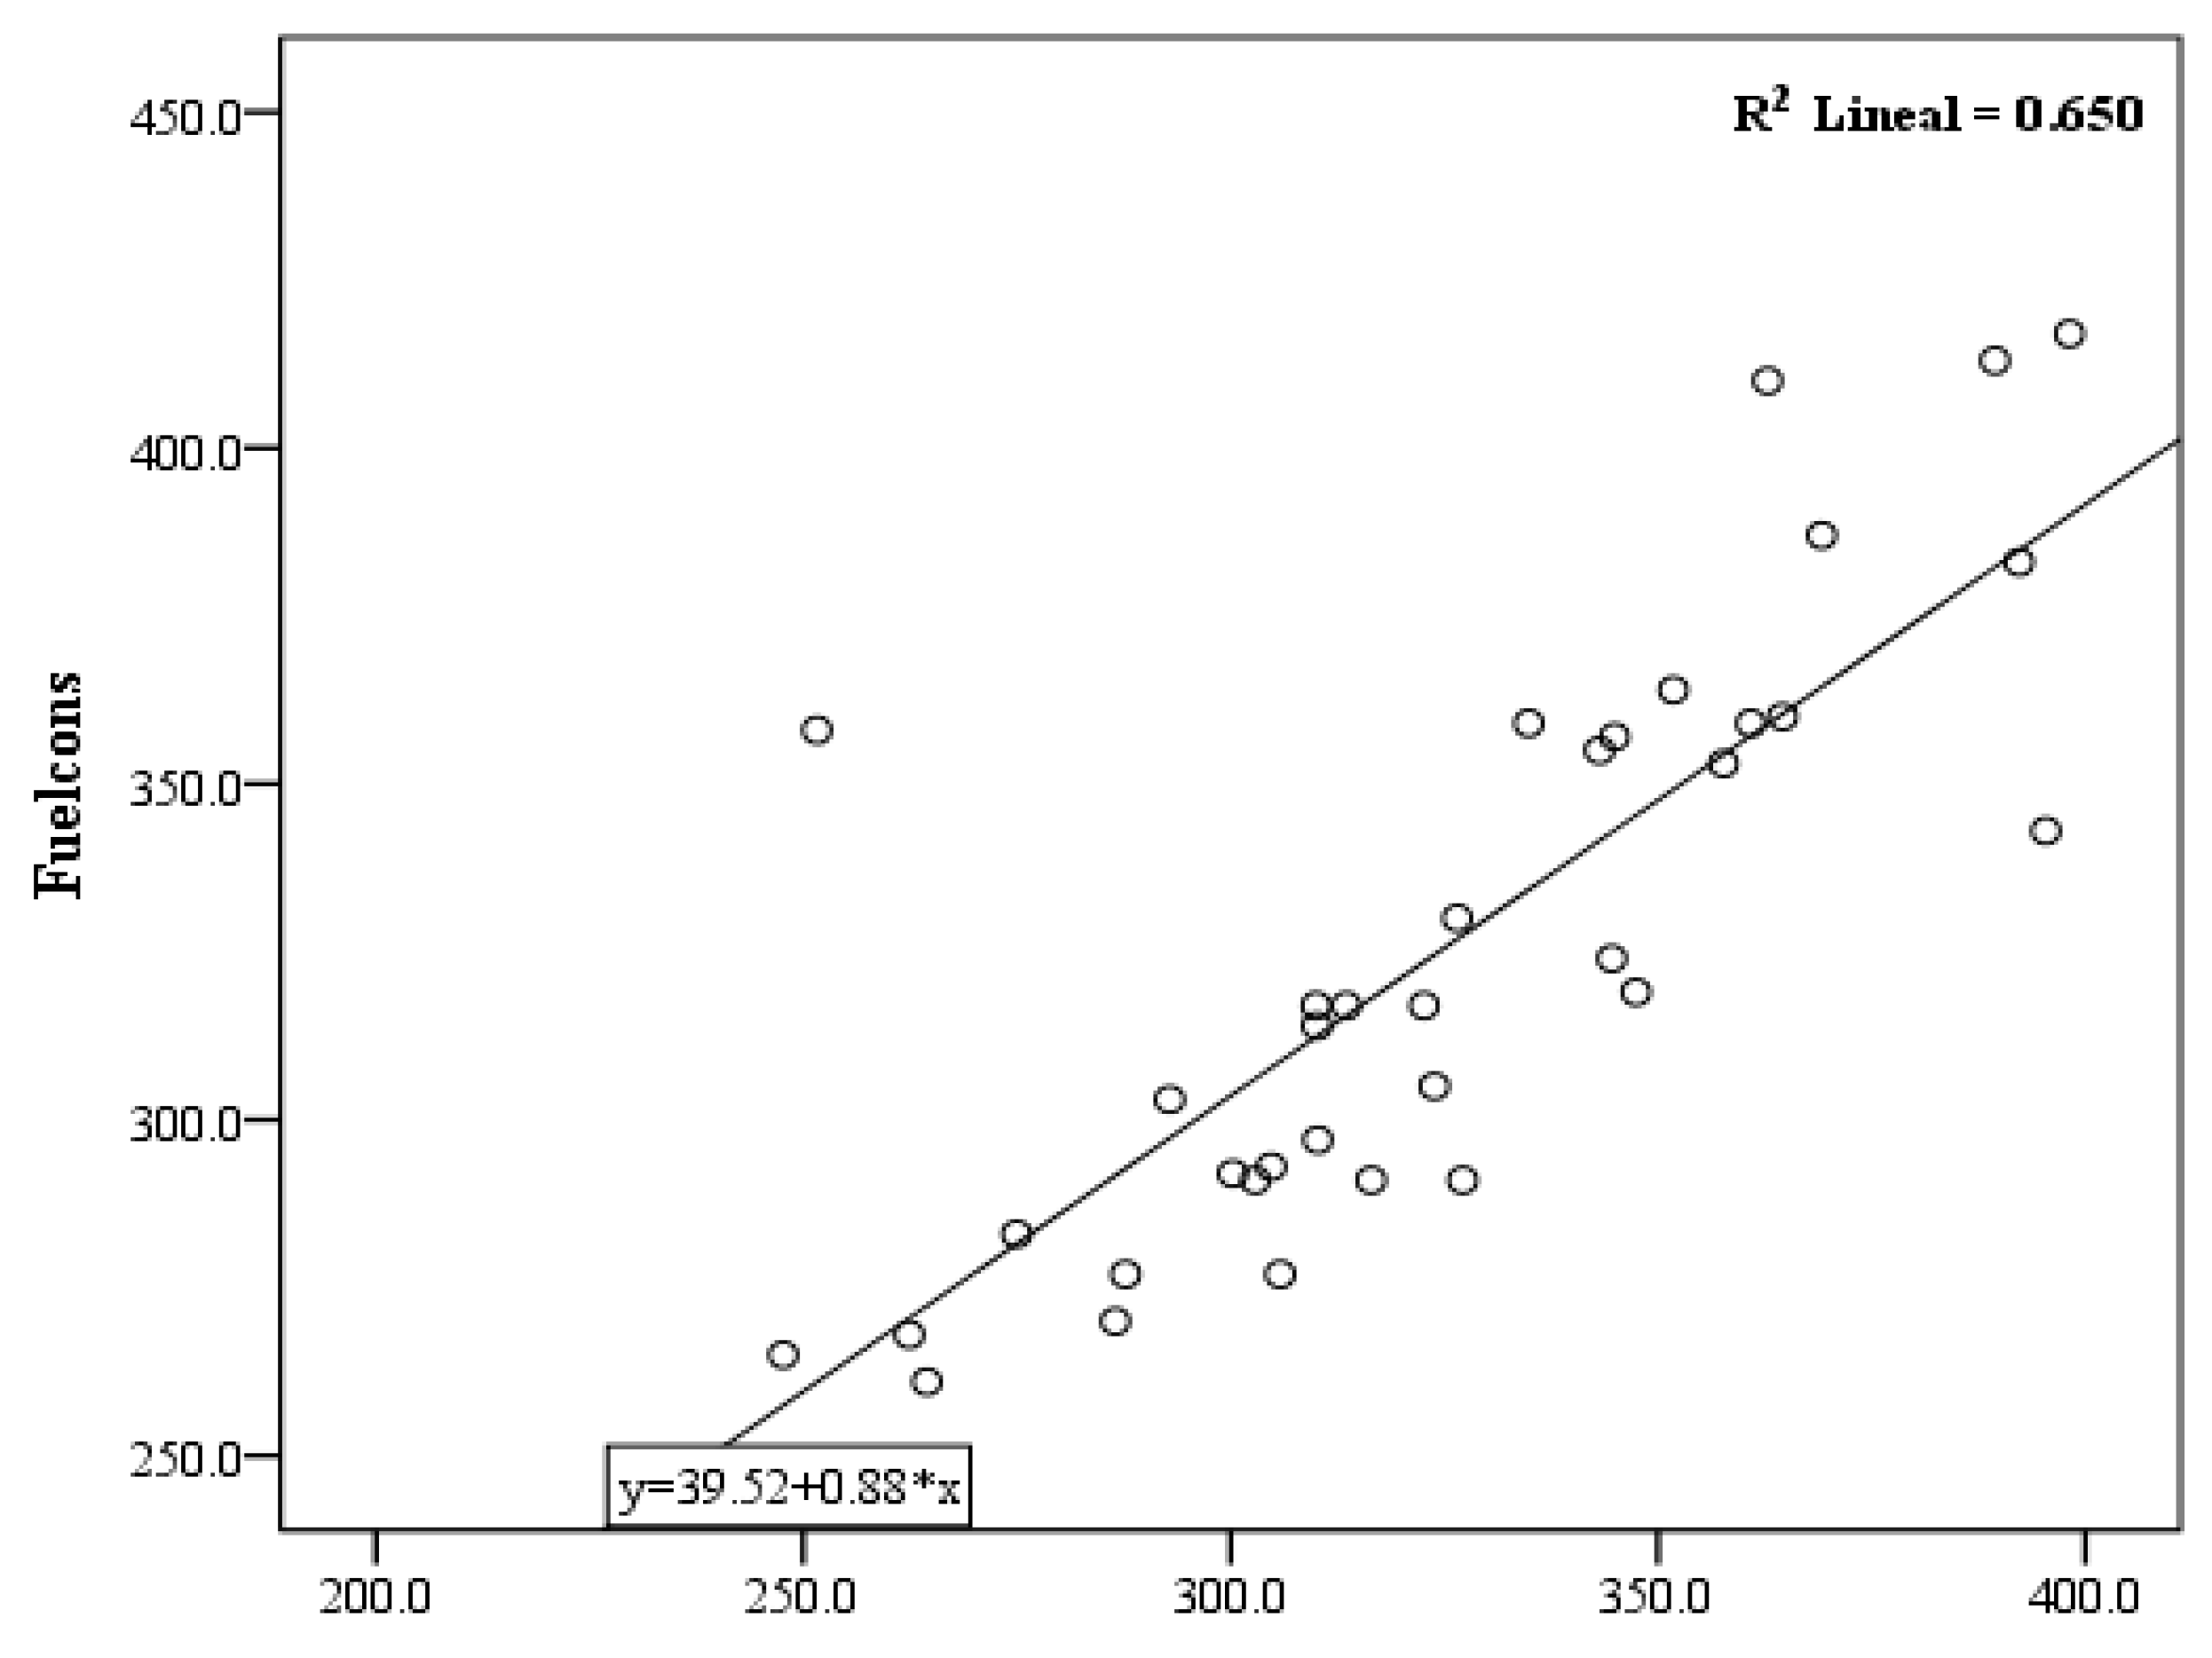
Sustainability 11 04918 g022
Figure 23. Scatter diagram, dependent variable: Fuelcons.
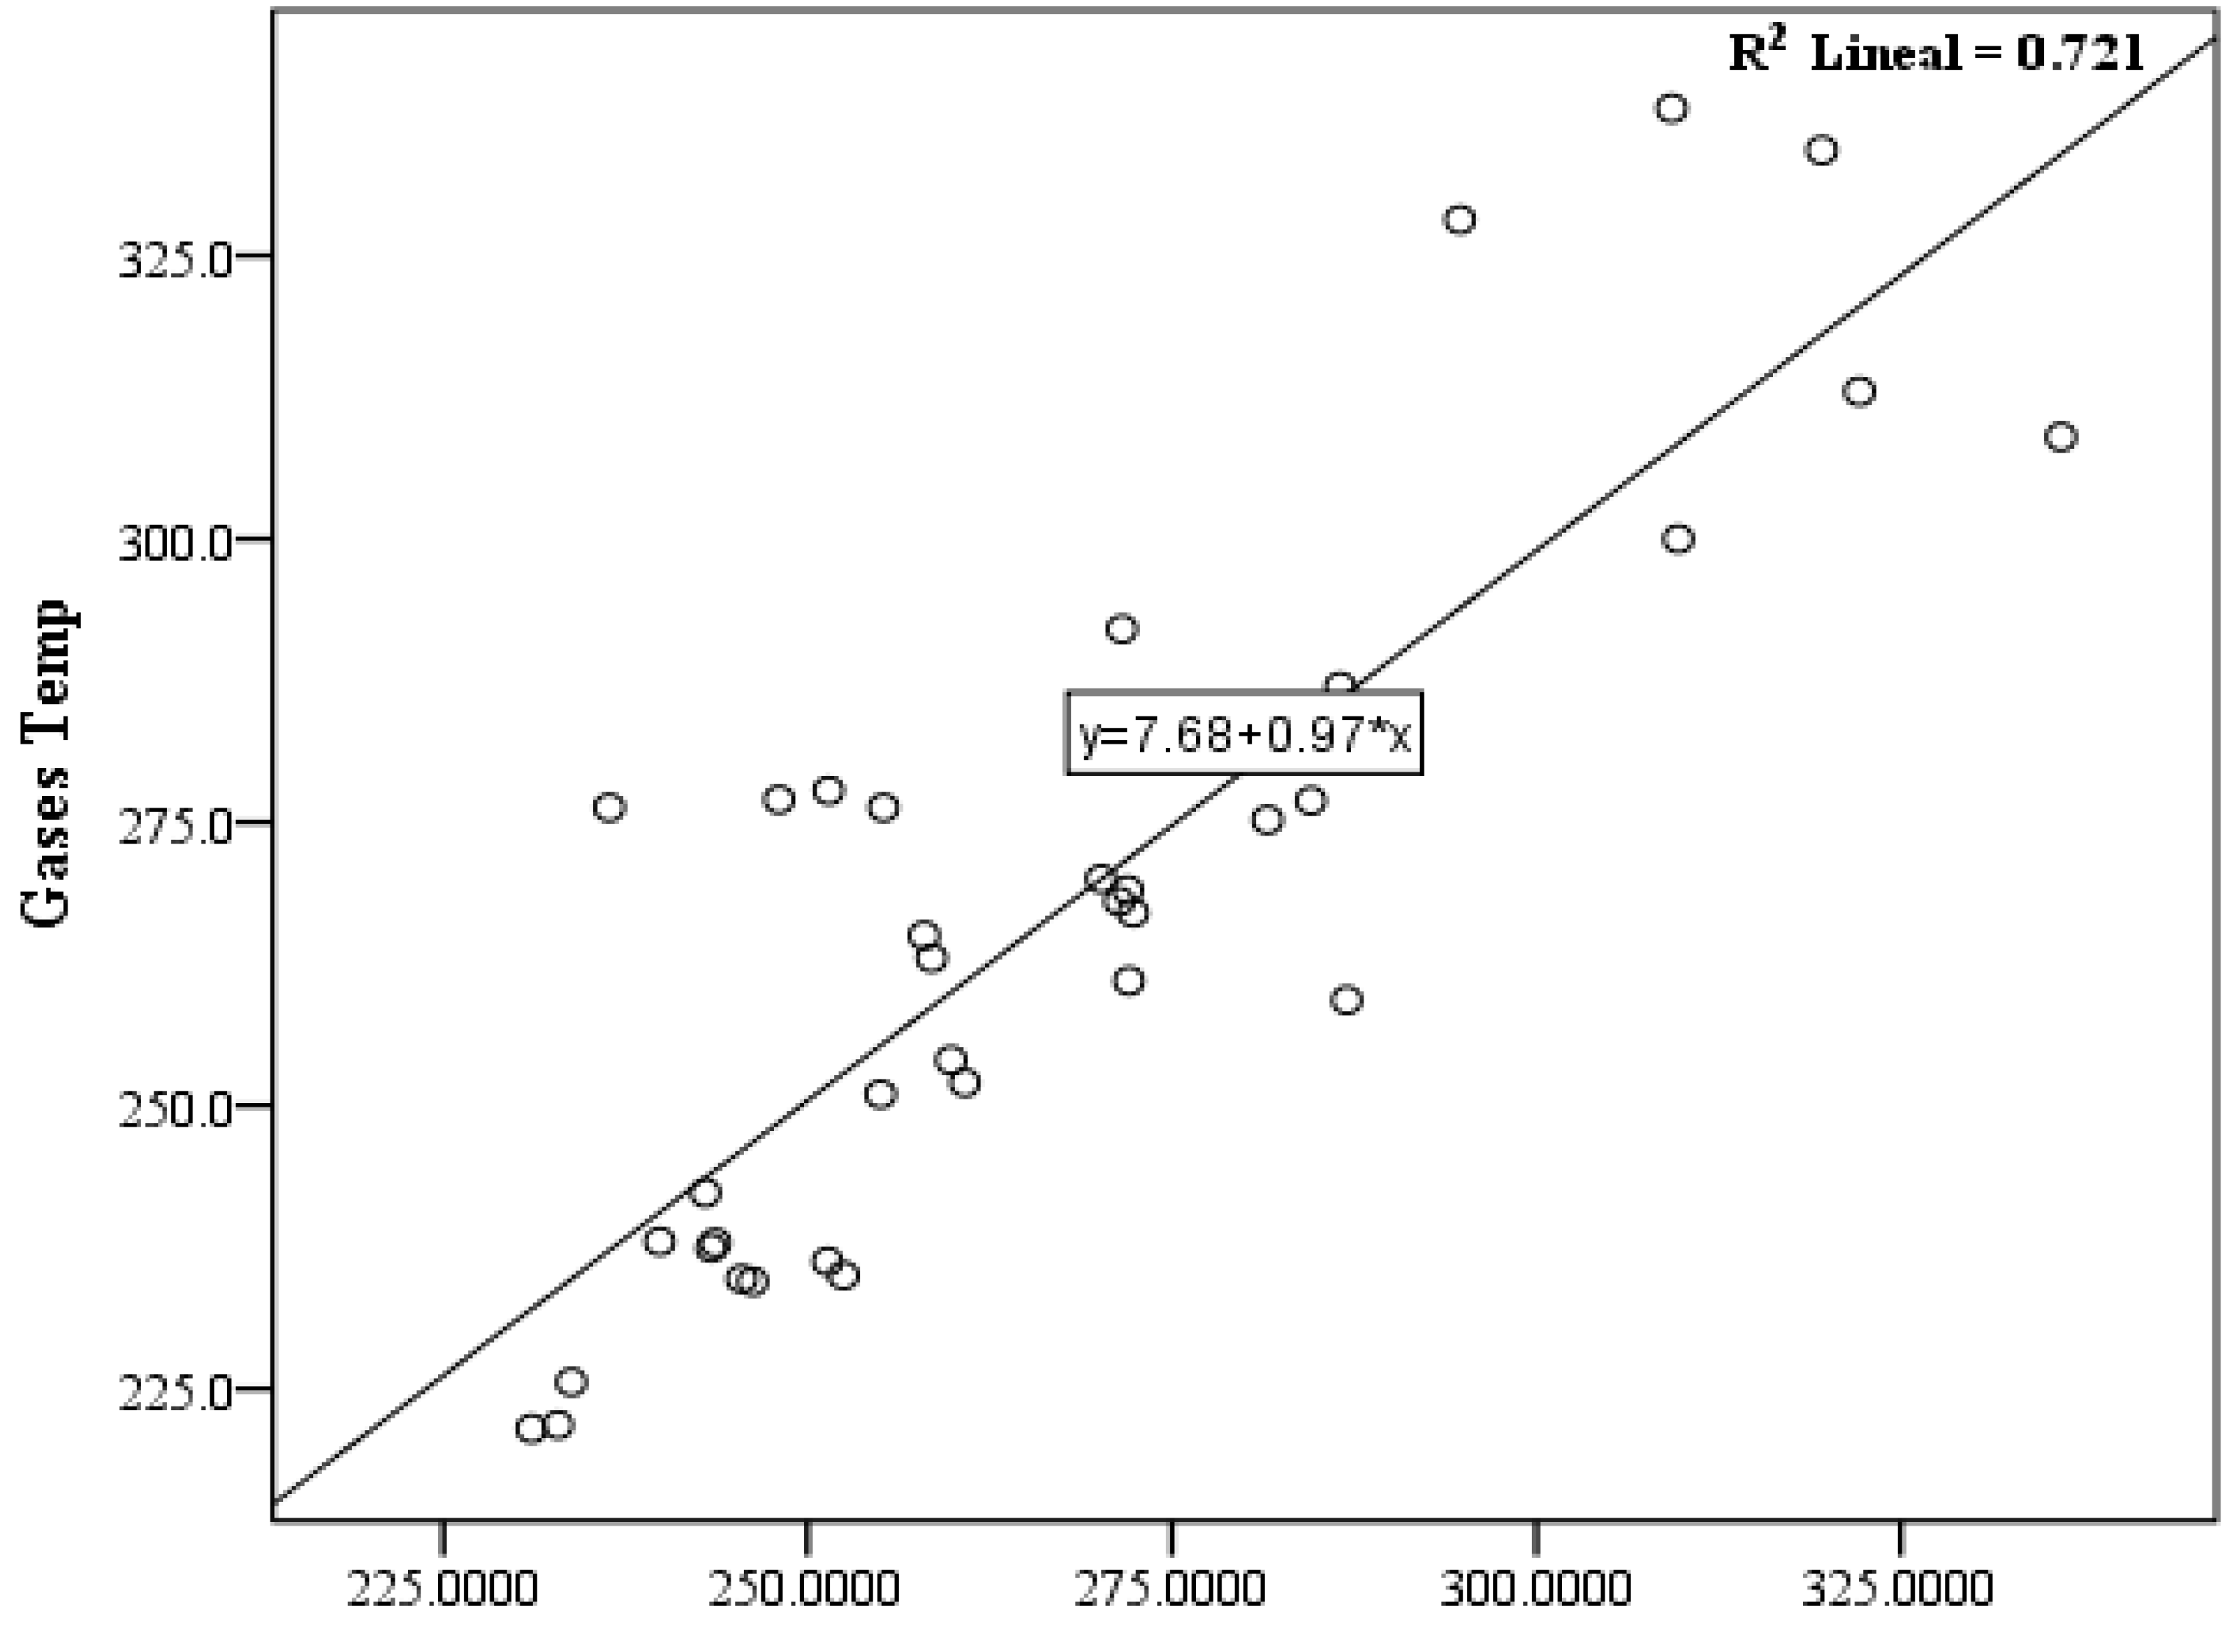
Sustainability 11 04918 g023
Figure 24. Scatter diagram, dependent variable: Gases Temp.
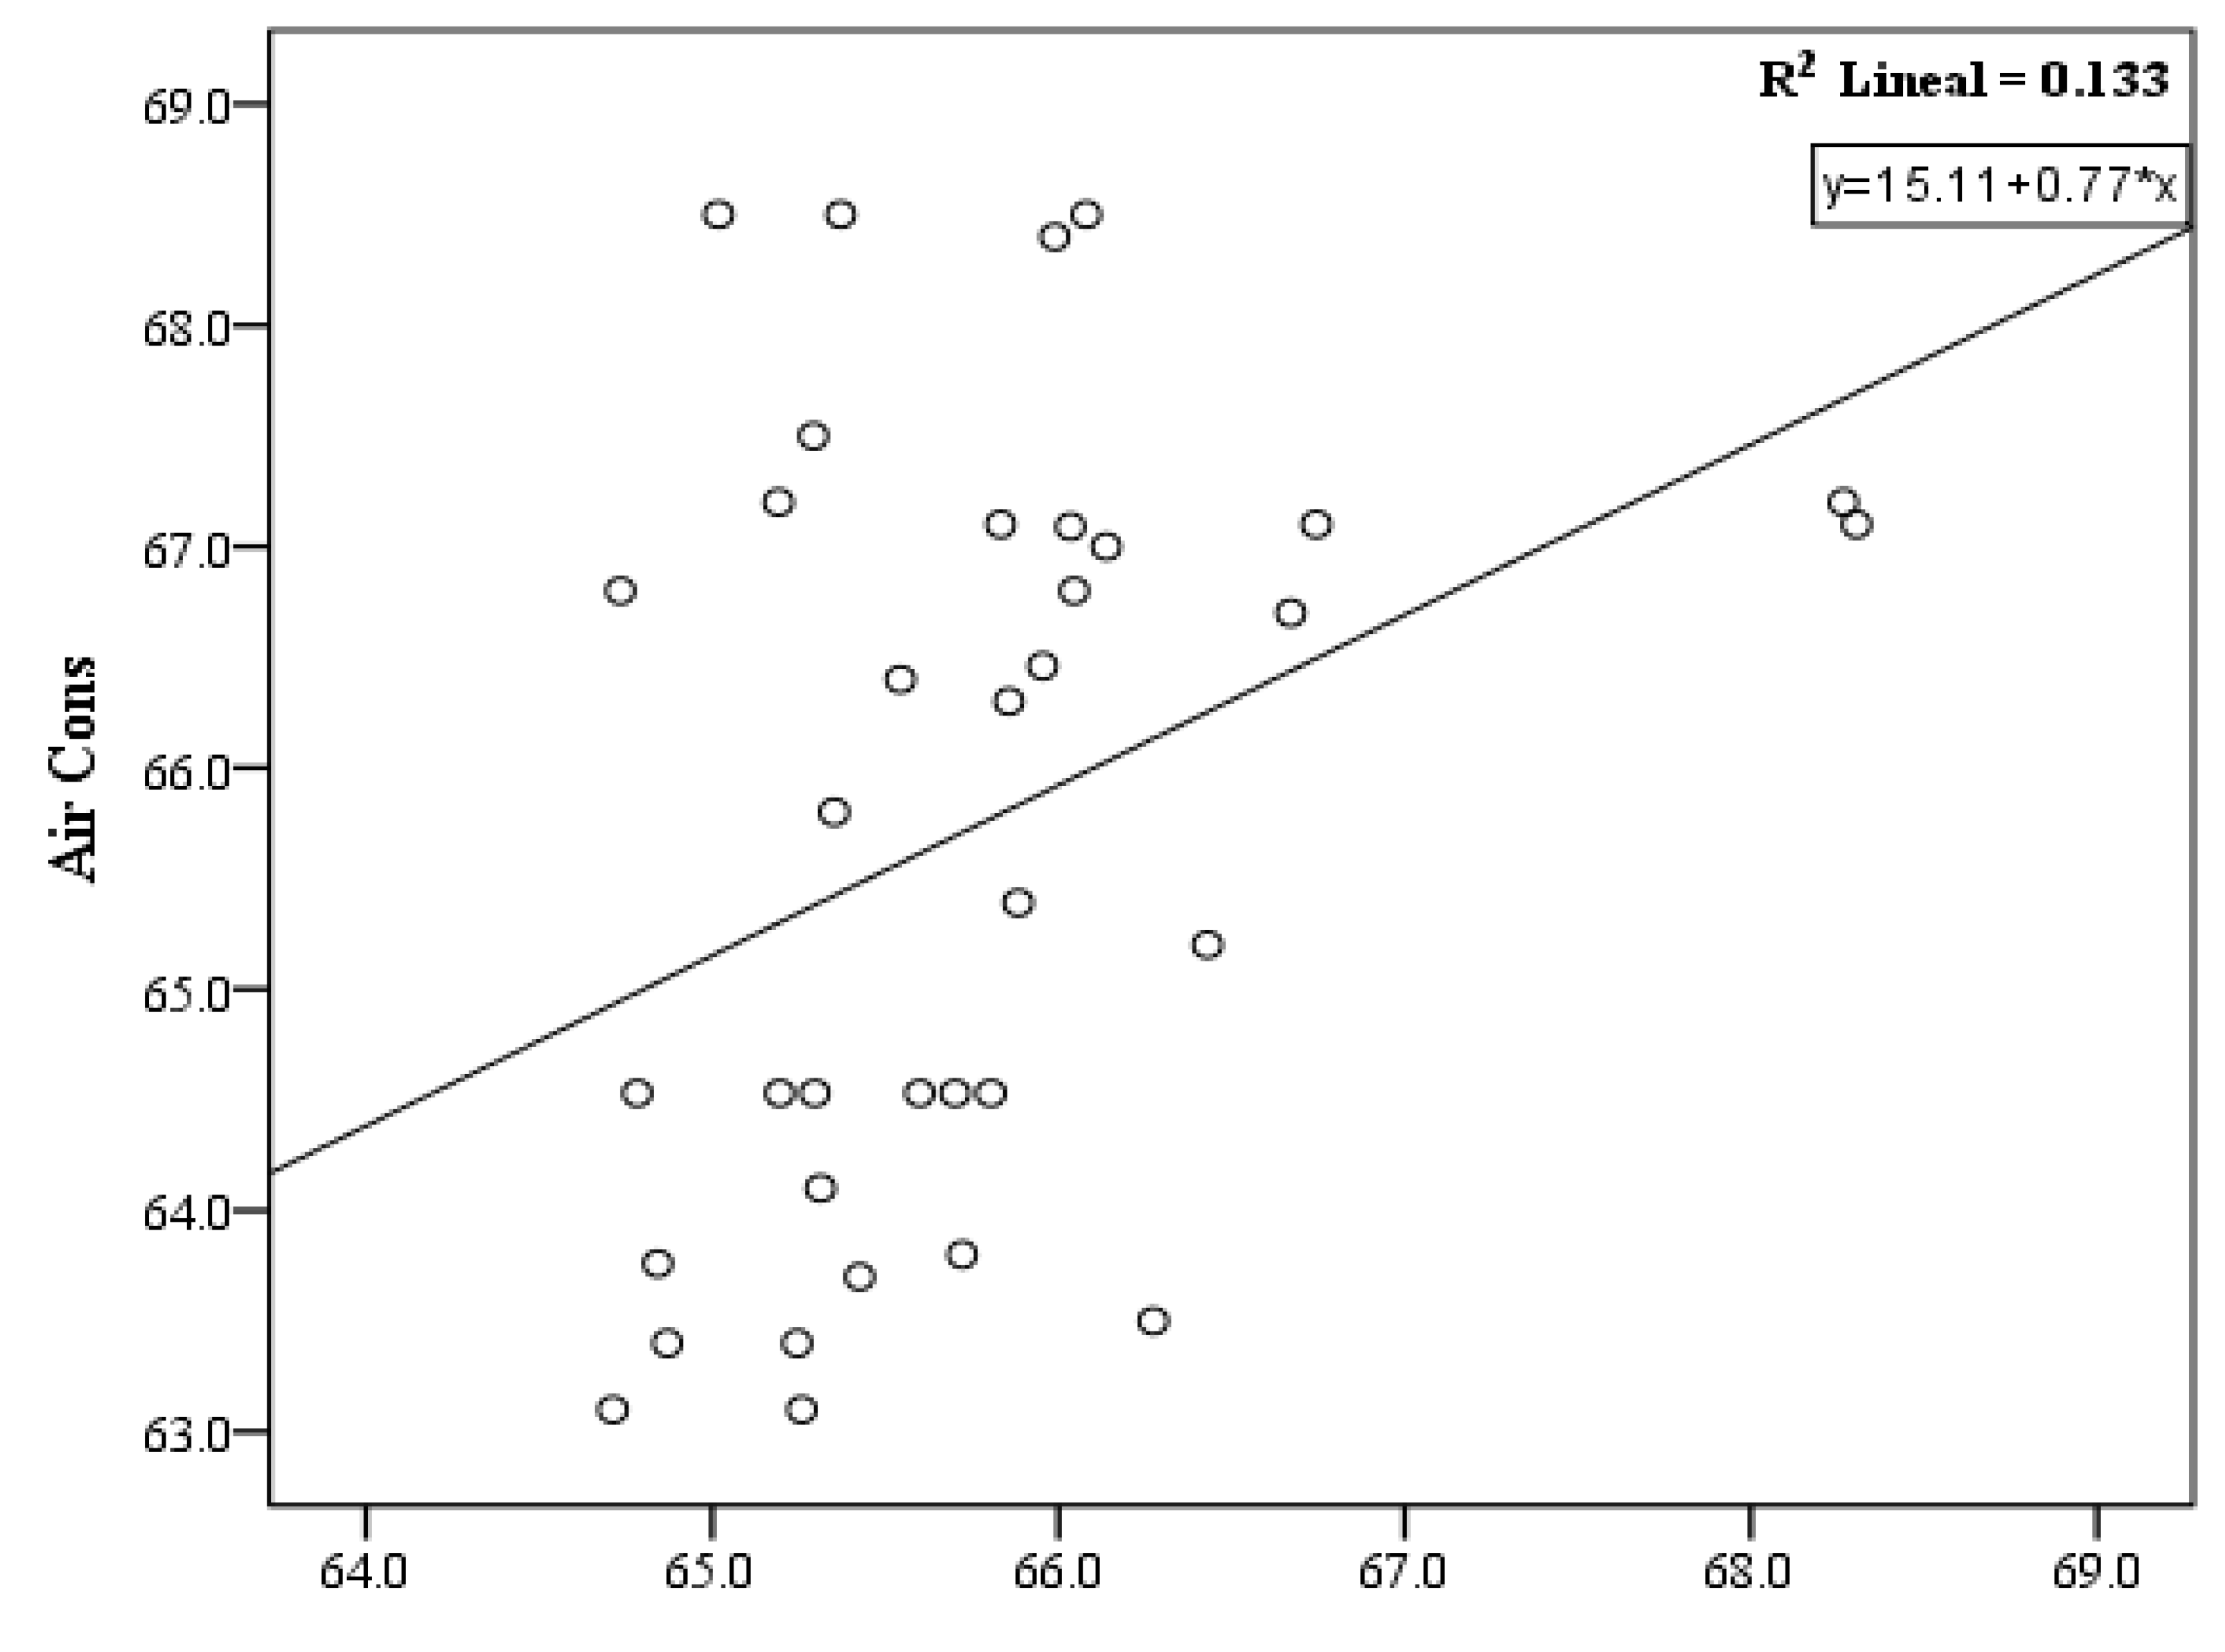
Sustainability 11 04918 g024
Figure 25. Scatter diagram, dependent variable: Aircons.
Sustainability 11 04918 g025
Table 1. Properties of B100 and palm oil.
PropertiesDensity at 15 °C gm/mlKinematic Viscosity at 40 °C mm2/sFlash Point, °CHeating Value MJ/kg
MethodASTM D1298ASTM D445ASTM D92ASTM D270
B1000.8774.5619640.56
Palm oil0.9254126039.849
Table 2. Biodiesel B10 properties.
PropertiesB10
Higher calorific power (MJ/kg)45.4
Lower calorific power (MJ/kg)42.9
Specific gravity (a 20 °C)0.87
Flash point (°C)60
Freezing point (°C)23
Cloud point (°C)45
Soot (%)0.001
Cetane number (Cst)45-50
Viscosity (20 °C) (Cst)4.1
Viscosity (40 °C) (Cst)2.6
Viscosity (60 °C) (Cst)2.046
Viscosity (100 °C) (Cst)1.1
Table 3. Variables for the study.
VariableUnits
Engine speedRevolutions per minute (rpm)
TorqueN-m
Fuel consumptionmg/s
Air consumption m 3 /h
Exhaust gases temperature°C
Motor oil temperature°C
Carbon monoxideCO
Carbon dioxideCO2
HydrocarbonsHC
Nitrogen oxidesNOX
OxygenO2
Table 4. The regression ANOVA.
Source of VarianceSum of SquaresDegrees of Freedom (df)Mean Squares (SS/df)F-ratio (F statistic)Sig.
RegressionRegression SS1Regression MSFPr(F>Fobs)
ResidualResidual SSN-kResidual MS
TotalSSTN-1
Table 5. Air flowmeter characteristics.
ParameterMeasurement Interval (normalized)
Maximum flow range0.05 to 200 Nm/s air velocity at standard conditions 100 psi
Minimum flow range0.05 to 2.5 Nm/s air velocity at standard conditions 100 psi
Precision+/−1% Reading
Repeatability+/−0.5% Reading
Working temperature70 to 40 °C
Table 6. Characteristics of the equipment EXSA 240 cl.
Measurement Range0–2500 ppm
Operating temperature5 to 45 °C
Response timeT90 in 30 s
Linearity+/−2% of full scale
Reproducibility+/−0.5% of full scale
Warm-up time30 min
Analog out0–1 V
Table 7. Characteristics of the equipment VL Dicom 400.
Measurement ParametersUnitRangeResolution
Turning raterpm250 to 80010
Oil temperature°C1 to 1201
CO% vol.0 to 100.01
CO2% vol.0 to 200.1
HC**ppm in vol.0 to 200001
O2% vol.0 to 4 and 4 to 220.01 0.1
NO**ppm in vol.0 to 90001
Spark advance angle *° of the crankshaft−10 to 1000.1
* Respect to top dead center; ** Particles per million (ppm).
Table 8. Equipment operation range.
ParameterUnitsMeasurement RangeResolution
Rotationrpm250 to 800 *10
Oil temperature°C1 to 120 *1
* Respect to upper dead point.
Table 9. Data of the run test for controls adjustment.
LoadRegime (rpm)Torque (Nm)FuelAirExhaust Gases TempOil TempNOxCOCO2O2HC
LoadDesiredMeasuredDesiredMeasured mg/sN*m3/h°C°Cppm% Vol% Vol% Volppm
35%1800180517.517.39228123.1197.26794630.073.416.133
1800182017.518.11219120.13179.27834750.073.815.739
1800181217.517.69216120.08191.46984480.063.715.738
50%180018152525.20315106.24254.80937840.055.013.947
180018022525.60298107.12252.50937740.065.113.949
180018202525.05290110.51251.501068900.065.313.531
65%180018113232.01348115.08310.0010410610.106.611.645
180017913232.10345109.66307.0010413260.126.811.259
180018243231.69356114.41313.5611411330.096.511.744
80%180017874041.50487118.87422.6911114850.529.07.963
180017904041.25482119.32422.1111214780.528.98.064
180018154040.90488115.42424.0011415260.478.98.072
Table 10. One factor ANOVA results.
F valueP valueFcrit
CO (%vol)2.0160.0732.216
CO2 (%vol)12.7491.687 × 10 −72. 216
O2 (%vol)13.3361.091 × 10 −72. 216
HC (ppm)3.0630.0102. 216
NOx (ppm)19.3252.607 × 10 −92. 216
TORQUE (N.m)4.6557.988 × 10 −42. 216
RPM0.6320.7842. 216
GAS TEMP (°C)68.0262.430× 10 −152. 216
AIR CONSUM (m3/h)48.6921.102× 10 −132. 216
EXHAUST GASES TEMP (°C)50.6807.009× 10 −142. 216
OIL TEMP (°C)7.3162.531× 10 −52. 216
Table 11. Pearson Correlation of FC.
FuelconsCOCO2O2HCNOx
Fuelcons1.0000.2780.791−0.768−0.5420.720
CO0.2781.0000.532−0.5380.1550.466
CO20.7910.5321.000−0.994−0.3920.972
O2−0.768−0.538−0.9941.0000.351−0.972
HC−0.5420.155−0.3920.3511.000−0.437
NOx0.7200.4660.972−0.972−0.4371.000
Table 12. FC statistic change.
ModelRR SquareR Adjusted SquareStandard Error of the EstimateStatistic change
Change in R SquareChange in Fdf1df2Sig. change in F
10.791a0.6250.61427.3410.62556.6621340.000
20.830b0.6890.67025.2750.0646.7861330.014
30.876c0.7680.74622.1880.07910.8191320.002
Table 13. Regression ANOVA for FC.
ModelSum of squaredfMean squaresFSig.
1Regression42357.948142357.94856.6620.000b
Residue25416.94034747.557
Total67774.88935
2Regression46693.167223346.58336.5450.000c
Residue21081.72233638.840
Total67774.88935
3Regression52019.993317339.99835.2200.000d
Residue15754.89632492.340
Total67774.88935
b: CO2, c: CO2, HC, d: CO2, HC, NOx
Table 14. Correlations for temperature of combustion gases.
TempGasesCOCO2O2HCNOx
Pearson correlationTempGases1.0000.4240.857−0.847−0.4970.870
CO0.4241.0000.532−0.5380.1550.466
CO20.8570.5321.000−0.994−0.3920.972
O2−0.847−0.538−0.9941.0000.351−0.972
HC−0.4970.155−0.3920.3511.000−0.437
NOx0.8700.4660.972−0.972−0.4371.000
Table 15. Statistic change of gas temperatures.
ModelRR SquareR Adjusted SquareStandard Error of the EstimateStatistic Change
Change in R SquareChange in Fdf1df2Sig. Change in F
10.870a0.7560.74915.5530.756105.3651340.000
Table 16. Regression ANOVA of gas temperature.
ModelSum of SquaredfMean SquaresFSig.
1Regression25489.332125489.332105.3650.000b
Residue8225.13534241.916
Total33714.46735
b: NOx
Table 17. Pearson correlations air consume.
AirconsCOCO2O2HCNOx
Aircons1.000−0.138−0.2940.2840.447−0.441
CO−0.1381.0000.532−0.5380.1550.466
CO2−0.2940.5321.000−0.994−0.3920.972
O20.284−0.538−0.9941.0000.351−0.972
HC0.4470.155−0.3920.3511.000−0.437
NOx−0.4410.4660.972−0.972−0.4371.000
Table 18. Statistic of change of air consumption.
ModelRR SquareR Sum of SquareStandard Error of the EstimateStatistic Change
Change in R SquareChange in Fdf1df2Sig. Change in F
10.447a0.2000.1771.5660.2008.5091340.006
Table 19. Regression of ANOVA of air consumption.
ModelSum of SquaredfMean SquaresFSig.
1Regression20.882120.8828.5090.006b
Residue83.440342.454
Total104.32135
b: HC

