Article

A Study on the Factors Affecting China’s Direct Household Carbon Emission and Comparison of Regional Differences

1
School of Public Administration, University of International Business and Economics, No. 10, Huixindongjie, Chaoyang District, Beijing 100029, China
2
School of Social Sciences, Tsinghua University, Beijing 100084, China
*
Author to whom correspondence should be addressed.
Sustainability 2019, 11(18), 4919; https://doi.org/10.3390/su11184919
Submission received: 31 July 2019 / Revised: 1 September 2019 / Accepted: 5 September 2019 / Published: 9 September 2019
(This article belongs to the Section Energy Sustainability)

Abstract

:
As the world’s largest emitter of greenhouse gases, China has been attracting attention. In the global carbon emission structure, the proportion of household carbon emissions continues to increase, and it is necessary to focus on the issue of household emissions. Based on the perspective of the family sector and the comparison of urban–rural and interprovincial differences, this study makes a thorough and systematic analysis of the factors affecting direct household carbon emissions. The average carbon emission of urban households is higher than that of rural households. Both personal background and household energy consumption facility use have important impacts on household carbon emissions, and the degree of impact varies between urban and rural areas and between provinces. Reducing household carbon emissions and achieving a harmonious coexistence between man and nature are the common goals of the government and society. The government should explore the model of green sustainable development on the basis of ensuring the energy needs of residents. Residents should also further establish a low-carbon life concept and focus on the cultivation of low-carbon lifestyles.

1. Introduction

Global warming and extreme weather are common problems worldwide. The international mainstream views the main cause of global warming as the strengthening of the greenhouse effect resulting from the large amount of greenhouse gas emissions in the process of modernization [1,2]. On 4 June 1992, the United Nations approved the United Nations Framework Convention on Climate Change (UNFCCC), requiring all members to take measures to limit greenhouse gas emissions. Moreover, in December 1997, the members of the UNFCCC signed the Kyoto protocol, which limits the emission of greenhouse gases by law for the first time. China signed the protocol in May 1998 and approved it in August 2002. As the world’s largest greenhouse gas emitter, China is also under great pressure to reduce emissions [3]. In recent years, with the increase of disposable household incomes [4,5] and the acceleration of urbanization [6,7] in China, the carbon emissions from households has increased since more high-carbon lifestyles have been adopted by residents, which attracts attention [8,9,10]. Moreover, analysis of households and lifestyles might promote an understanding of family business [11], and even building industry [12] towards sustainability.
Compared with other countries, China’s per capita household carbon emissions are not high [13,14], but in 2012, the percentage of energy consumption caused by household consumption activities of the total consumption in China increased to 24.7% [15], which is a rising trend, especially in rural areas [16]. In China’s energy reform objectives, the household sector also plays an increasingly important role [17]. Some studies calculated China’s household carbon emissions from different perspectives [6,7,18,19,20,21], including urban–rural differences and interprovincial differences. This study combines the two perspectives to show the urban–rural differences in different provinces in terms of household carbon emissions, and focusing on more specific behaviors of households, such as using household appliances. Based on the analysis, we can provide specific policy suggestions with regard to the provincial differences and the concrete household behaviors concerning carbon emissions.
Household carbon emissions can be divided into indirect ones and direct ones. Wang and Yang analyzed indirect household CO2 emissions from the perspective of urban–rural differences in China, and found that the structure of consumption dominates the energy use, and urban emissions are more significant [20]. Wiedenhofer et al. pointed out that the indirect carbon emissions of rural areas are much less than those of urban areas, which indicates the income gap affecting the indirect household carbon emissions [6]. Xia et al. calculated the residential indirect carbon emissions affected by a growing urban population, household income, and living standards [22]. Thus, indirect carbon emissions are important factors resulting in household carbon emissions.
According to the daily lifestyle, direct carbon emissions play an essential role in low-carbon development. Direct household carbon emissions are generated by direct energy consumption behaviors, such as consumption of household electrical appliances, cooking, heating, and private cars, in daily life. Feng et al. noticed the differences of direct carbon emissions between rural and urban areas, and found that the emissions of urban households are more diverse and increasing more than that of rural areas [18]. Zhang et al.’s [4] result is comparatively inconsistent with the conclusion of Feng et al., finding that in the same income cluster, the direct carbon emissions of rural areas are more than those of urban areas. Li et al. found that direct and indirect carbon emissions dominate rural and urban areas, respectively. Direct energy demand and consumption of urban households are higher than those of rural areas in China, but their marginal demands are lower than rural areas [23]. Wang et al. found that the total carbon emission gap between urban and rural households is widening, while the gap of carbon emission per capita between urban and rural areas is narrowing because of urbanization and modernization in the countryside [24]. These studies show the differences between urban and rural areas, which we focused on as well. In addition, the differences between provinces and regions are significant [25]. Li et al. found that direct carbon emission varies according to different regions [26]. Zhang and Lahr found that different regions have different direct carbon emissions because of the different weather conditions, which means the residents who live in northern China would emit more carbon [27]. Wang et al. used the Jing-Jin-Ji region as an example, and found that household direct carbon emissions increased to 123.34 MtC in 2012, and those different sub-regions varied hugely, but they did not analyze the impact factors of direct carbon emissions [28]. Considering the great importance of the differences in urban–rural and interprovincial areas, we combined both perspectives to reveal more details about direct household carbon emissions, which could supplement previous studies. Zhang et al. combined the above two perspectives, but they focused more on the impact of household consumption [29], which is not specific to our study.
There are many factors affecting household carbon emissions in China. Feng et al., Wiedenhofer et al., and Shi et al. found that income has a large impact on residential carbon emissions [6,17,30]. Zhang et al. found a positive correlation between income and household carbon emissions [4]. Household consumption related to rising income is also an important factor [19]. From the perspective of urban–rural differences, Wang and Yang found that the Engel coefficient and energy intensity negatively correlate with urban residential indirect energy use. On the contrary, these factors positively correlate with rural residential indirect energy use, owing to the negative influence of the urbanization level and per capita income [20]. Different from the view on urbanization, as the household size and urban density increases, per capita carbon emissions will decrease [31]. Zhang et al. systematically reviewed all possible factors affecting household carbon emissions from the literature worldwide, concluding that household income, household size, and rebound effects positively influence emissions; and the impacts of age, education level, and household location, which are related to mobility and gender are dependent on the context [32]. Some studies conclude that the Chinese urban family income, private car, living space, family members, population structure, education level, urban development model, and climate are significantly correlated with household carbon emissions [33,34,35,36,37]. Moreover, Li et al. indicate that the awareness significantly affects the household carbon emissions, and emphasize the intermediate role of a frugal or prodigal lifestyle plays in the relationship [9]. This paper investigates more specific factors by using the CGSS2015 data, which is explained in the next section.
In the long run, the analysis of China’s household carbon emissions can deepen our understanding of the diversity of the influencing factors. Through an analysis of the UK’s situation, Brand et al. found that employment status, car ownership, and commuting distance are the most important factors affecting household carbon emissions, followed by family income, property quantity, education level, and other factors [38] Morris et al. point out the significant influence of climate, income, and the ratios of electricity to gas meters on household carbon emissions [39]. Although income has a positive impact on household carbon emissions, low-income, unemployed, and elderly groups may produce more carbon emissions, considering that the elderly group may feel colder and they are not constrained by carbon tax [40]. Household carbon emissions currently account for two-thirds of total carbon emissions in Australian cities [41], which means a significant gap between urban and rural households’ carbon emissions exists. By studying developing countries, such as Ecuador and Bangladesh, Ponce et al. and Baul et al. found that labor income and human capital can significantly promote households’ low-carbon behavior [42,43]. Zhang et al. found that there are several differences between developed countries and developing countries, such as education level positively influences household carbon emissions in developed countries but negatively influences that in developing countries [32], which means there is a diversity of situations of carbon emissions in different countries [13]. Therefore, our analysis can contribute to the appreciation of diversity.
The combination of two perspectives of urban–rural differences and interprovincial differences and an investigation of detailed data of households can provide a more thorough analysis, which could support precise policy implication. The research results will also provide a reference for the cultivation of residents’ good energy-saving consciousness, as well as low-carbon lifestyles. The remainder of this paper is organized as follows. Section 2 gives the methodology of calculating emissions and analyzing influencing factors. Section 3 gives the results, and the last section concludes the findings and provides policy implication.

2. Methodology

2.1. The Methodology of Calculating Emissions

Direct household carbon emissions mainly come from three parts: Household fuel consumption, household electricity consumption, and central heating energy consumption. Among them, household fuels mainly include honeycomb briquette/briquette, coal, gasoline, diesel, bottled liquefied gas, pipeline natural gas, pipeline gas, domestic livestock and poultry manure, straw, and firewood, forming 10 categories. The data used in this research were sourced from the household questionnaire survey of the CGSS (China General Social Survey) in 2015 (Data analyzed in this article were collected by the research project “China General Social Survey (CGSS)” sponsored by the China Social Science Foundation. This research project was carried out by the Department of Sociology, Renmin University of China and Social Science Division, Hong Kong Science and Technology University, and directed by Dr. Li Lulu and Dr. Bian Yanjie. The authors appreciate the assistance in providing data by the institutes and individuals aforementioned. The views expressed herein are the authors’ own). China’s CGSS is a member of the international GSS survey project. It has been jointly conducted by the Department of Social Sciences of Renmin University of China and the Social Science Division of Hong Kong Science and Technology University since 2003. The survey used a four-phase stratified sampling strategy with unequal probabilities (districts/counties, streets/towns, residents’ committees/villagers’ committees, and domestic households). The samples were recruited from 28 provincial-level divisions (hereinafter referred to as province), including province, autonomous region, and directly controlled municipality. The sampling method, questionnaire design, and survey procedure of the CGSS survey project were relatively similar to the international GSS survey project. Based on the reference of the GSS project, the CGSS survey project was adjusted and improved to some degree on the basis of China’s national conditions, resulting in relatively better authority and representativeness. The 2015 CGSS specifically included a survey of household energy consumption modules. It investigated all household energy consumption, including the annual consumption of 10 household fuels (in kg or m3), the total annual household electricity consumption (unit: kW·h), and the method of domestic heating (central heating or non-central heating). Central heating is mainly used in urban areas of northern China, and household self-heating is mainly used in southern China and northern rural areas. Central heating is supplied by the government or a company, and coal is the main fuel. The government or company charges heating fees based on the domestic heating area. The main fuels used for household self-heating are included in the 10 household fuels. The 2015 CGSS data consisted of 10,968 samples. Of these, 6470 were urban samples and 4498 were rural samples, comprising 58.990% and 41.010% of the total samples, respectively. There were also 5134 male samples and 5834 female samples, comprising 46.809% and 53.191% of the total samples, respectively. The distribution of sample sizes among provinces is shown in Table 3.
Based on the annual total consumption of all kinds of energy of each respondent’s family, the carbon emissions of all kinds of energy consumption can be calculated. The specific calculation model (model 1) was set as follows:
T c o 2 = i = 1 10 F 1 i J i F u e i + F 2 E l e + F 12 A r e · H e a .
Among them, Tco2 represents the annual total carbon emission of direct energy consumption by households. Fuei (i = 1, …, 10) is the annual consumption of 10 household fuels, respectively; Ji refers to the heating value of various household fuels, which is specifically taken from the “China Energy Statistical Yearbook 2015”. F1i denotes the carbon emission factor of corresponding household fuels, which is taken from the “2006 IPCC Guidelines for National Greenhouse Gas inventories”. Ele refers to the total annual household electricity consumption. F2 is the carbon emission factor of household electricity consumption in various regions, which is taken from the “weighted average of the marginal emission factor of electricity quantity from 2008 to 2010” in “2012 Baseline Emission Factors for Regional Power Grids in China”. Are represents the domestic heating area; Hea refers to the coal consumption index of the unit heating area in the corresponding region, which is taken from the design standard for energy conservation of civil buildings (heating residential buildings) (JGJ 26-95). F12 is the carbon emission factor of coal.

2.2. The Design of the Influencing Factor Model

Based on the literature review, it can be known that the individual background, family energy usage pattern, and climate conditions may all have an impact on household carbon emissions. Individual background variables include urban and rural areas, provinces, the number of registration residents, highest level of education, income, working status, socioeconomic status, etc. Family energy usage pattern includes the number of cars, the number of cooking appliances, the number of household appliances, types of cooking appliances, and so on. Climate conditions include the average daily sunshine time, temperature, and so on. In combination with the index variables contained in the 2015 CGSS database, the semi-logarithmic multiple-regression model (model 2) was set as follows:
ln T c o 2 = a + m = 1 7 b m P b m + β = 1 Φ 1 α = 8 22 c α β P b α β + n = 1 14 d n H e n + η = 1 Φ 1 λ = 15 17 e λ η P b λ η + ε .
Among them, Pbm (m = 1, …, 7) is seven consecutive personal background variables, which are age, total individual income last year, total family income last year, the number of registration residents, the number of houses owned by the family, household economic status, and individual perception of socioeconomic status. Hen (n = 1, …, 14) are variables for 14 types of family energy facilities use, followed by domestic living space, the average daily sunshine time in winter and summer, and the number of main cooking appliances, refrigerators, freezers, washing machines, dryers, TVs, computers, fluorescent lamps, incandescent lamps, water heaters, and air conditioners.
The independent variables in the Pbα (α = 8, …, 22) are 15 classification variables for personal background, which are urban and rural areas, provinces, gender, nationality, highest level of education, political status, registration residents, nature of work, daily work management activities, autonomy in deciding work methods, whether people often want to handle their troubles through the convenience of their present job, type of workplace (organization/company), ownership of the company/organization, current marital status, and the spouse’ s highest degree of education. Heλ (λ = 15, …, 17) refers to the classification variables used by the three household energy consumption facilities, which are whether the family owns a car, cooking appliances type 1, and cooking appliances type 2. In the model, these classification variables should be set as dummy variables; that is, when the value appears, it should be assigned as “1”; otherwise, it should be assigned as “0”. Therefore, Pbα (α = 8, …, 22) were the 15 dummy variables of personal background, and Heλ (λ = 15, …, 17) were the 3 dummy variables for the usage of household energy-consuming facilities. Furthermore, to avoid the occurrence of the dummy variable trap, one of its values was selected as the reference group, where the value range of β, η is 1—“Φ − 1”.

3. Results

3.1. Calculation and Statistics of Direct Household Carbon Emissions

Model 1 was used to calculate the average carbon emission of Chinese households, which is 1536.671 kg. The average total carbon emission of urban households is 1654.462 kg, which is higher than that of rural households (1368.435 kg). This result is consistent with the previous findings [6,21,25]. As the educational level increases, the average total carbon household emissions show an increasing trend. Table 1 provides detailed statistics of the average total household carbon emissions by the highest level of education, and Table 2 shows the average carbon emissions associated with various types of energy consumption. In general, among all kinds of energy consumption, Co2 released by central heating ranks first, followed by bottled liquefied gas, coal, electricity, gasoline, firewood, honeycomb briquet/coal, pipeline natural gas, straw, diesel, pipeline gas, and livestock and manure. From the perspective of differences between urban and rural areas, energy is consumed in different ways. The consumption of honeycomb briquet/coal, coal, livestock and poultry manure, straw, and wood burning in rural areas is higher than that in urban areas. Additionally, urban areas consume more gasoline, pipeline natural gas, pipeline gas, electricity, and coal for central heating. This demonstrates that direct emissions are dominant in rural areas; that is, carbon emissions from direct combustion of household fuels. Indirect emissions are dominant in urban areas; that is, carbon emissions from households through purchased electricity and heat. The above results are close to previous studies [6,8].
There is a gap between the average total household carbon emissions in provinces. The chi-square test results show a significant difference at the level of 0.01. In terms of the total household carbon emissions, the mean values of the Inner Mongolia, Beijing, Jilin, Ningxia, Shanxi, Hebei, Gansu, Liaoning, Qinghai, and Heilongjiang provinces are relatively high (all above 2000 kg). In particular, the mean value of Ningxia reaches as high as 3848.488 kg. The mean values of Shanghai, Yunnan, Sichuan, Anhui, Guangdong, Guangxi, Jiangxi, Henan, Zhejiang, and Hunan are relatively low (all below 1000 kg). In particular, the mean value of Yunnan is only 431.312 kg. Table 3 and Figure 1 provide detailed statistics of the average total household carbon emissions in different provinces.

3.2. Regression Results and Comparison of Urban–Rural and Interprovincial Differences

Next, the overall samples and the urban and rural subsamples were integrated with the regression equation to build model 2, which analyzed how these three variables influence the direct household carbon emissions. In the above equation, the Pb8 (urban–rural variable) is excluded in model 2 when the regression of urban and rural subsamples was carried out. The regression results show that model 2 fits the three samples well, and the associated probability values are all less than 0.05, indicating a significant linear relationship of the model. The adjusted R2 values are 0.321, 0.408, and 0.259, respectively. The interpretation degree of the independent variables to the dependent variables in the models reaches 32.1%, 40.8%, and 25.9%, respectively. In terms of the interpretation degree of total household carbon emissions, the individual background variables and domestic energy-consuming facility-use variables of urban areas are higher than those of rural areas.
According to the coefficient estimation results, the individual background variables in urban areas and the household energy-consuming facility-use variables still have higher impacts on household carbon emissions. Statistics of coefficient estimation results of continuous independent variables are shown in Table 4. In the regression results of the overall, urban, and rural samples, there are six, nine, and four continuous independent variables that are significant at the level of 0.1. In the regression results of the overall samples, the registered permanent residence, average daily sunshine time in winter, and the number of refrigerators, freezers, water heaters, and air conditioners all have significant influences on family carbon emissions. With the increase of these variables, the value of total annual carbon emissions of households also shows an increasing trend. In urban areas, with the increase of the registered permanent residence, average daily sunshine time in winter, and the number of refrigerators, freezers, computers, incandescent lamps, water heaters, and air conditioners, the total annual carbon emissions of households increases significantly. With the decrease of the number of household cooking appliances, the total annual carbon emission of households also increases. In rural areas, with the increase of household economic status, the number of household cooking appliances, washing machines, and air conditioners, the total annual carbon emission of households increases significantly. Variables, such as age, individual and family income, the number of houses owned by families, and the perception of one’s socioeconomic status, do not have great impacts on household carbon emissions. Income variables are not significant factors affecting household carbon emissions in China, which is different from the analysis results of previous studies (Zhang et al., 2015). This is because it is possible that the number of appliances and household economic status can partly represent the direct household income. An awareness of energy conservation, energy type, and modernization level of household energy-consuming facilities may be potential factors for the differences.
From the estimation results of independent variables of each category, there are significant differences in household carbon emissions between urban and rural areas and between provinces. When other conditions are controlled, urban households emit 17.4% more carbon than rural households. From the interprovincial perspective, the household carbon emissions in Liaoning, Ningxia, Qinghai, Gansu, and Shanxi are relatively high, while those in Shanghai, Yunnan, Henan, Zhejiang, Hubei, and Anhui are relatively low. In the overall sample, the five provinces with the highest household carbon emissions are in Liaoning, Ningxia, Qinghai, Gansu, and Shanxi, whose emissions are 122.6%, 112.9%, 109.9%, 103.3%, and 90.9%, respectively, higher than those of the reference group, i.e., Guangxi. Additionally, the provinces with the lowest household carbon emissions are Shanghai, Yunnan, Henan, Zhejiang, and Hubei, whose emissions are 120.0%, 90.5%, 80.7%, 77.0%, and 61.2% lower than those of the reference group, respectively. In the urban subsample, Liaoning, Shanxi, Qinghai, Heilongjiang, and Ningxia have the top five provinces in terms of household carbon emissions, and the last five provinces are in Shanghai, Zhejiang, Yunnan, Hubei, and Henan. In the rural subsample, in terms of household carbon emissions, the top five provinces are Qinghai, Gansu, Liaoning, Guizhou, and Inner Mongolia, and the last five provinces are Yunnan, Henan, Anhui, Zhejiang, and Hubei. Figure 2 shows the estimated coefficients of every province.
The registration status, type of workplace (organization/company), ownership of the company/organization, marital status, and type of cooking appliances all show significant impacts on household carbon emissions in the regressions of the overall and urban subsamples. In terms of the overall samples, the non-agricultural households’ carbon emission is 15.1% higher than that of agricultural households.
The household carbon emissions of people working in the Party and government organizations, enterprises, public institutions, and social organizations are 74.3%, 67.8%, 141.7%, and 27.3% higher than those of people working in the reference group (the “other” group), respectively. The household carbon emissions of people working in enterprises sponsored or controlled by Hong Kong, Macao, and Taiwan are 122.9% lower than those of people working in the reference group (the “other” group), respectively. This is possibly explained by the awareness of energy saving. People who work in non-governmental organizations might be limited by market mechanisms, because they pay for energy themselves in the workplace, resulting in a high awareness. While people who work in the Party and government organizations and public institutions do not need to pay for energy in the workplace, resulting in low awareness. Married households have 50.0% more carbon emissions than unmarried households because it is more likely that the former one has more housework and a larger population.
For families where firewood stove/earth stove (livestock and poultry excrement), honeycomb coal stove, induction cooker, gas stove (bottled liquefied gas), gas stove (pipeline natural gas), gas stove (pipeline gas), and electric rice cooker are the most commonly used cooking appliances, their household carbon emissions are 230.1%, 157.6%, 26.9%, 98.2%, 82.5%, and 80.9% higher than those of the reference group (the “other” group), respectively. For families where the solar cooker is the most commonly used cooking appliance, their carbon emissions are 429.9% lower than those of the reference group (the “other” group). The variable “whether a family owns a car” is only significant in the urban subsamples, and the carbon emissions of families with cars are 25.8% higher than those of families without cars. In terms of the urban–rural comparison, the carbon emission of cooking appliances for rural households is significantly higher than that for urban households. Gender, nationality, the highest degree of education, political status, and daily work management activities, autonomy in deciding work methods, and whether problems are easily handled in the current job have no significant impact on household carbon emissions.

4. Discussion and Conclusions

In summary, we identified the following main findings:
(1)
The average carbon emission of urban households is higher than that of rural households, and the average carbon emission of northeastern, eastern, western, and central households decreases in turn. In the case that other variables are controlled, the carbon emission of urban households is 17.4% higher than that of rural households.
(2)
Among all kinds of household energy consumption, central heating releases the highest amount of CO2.
(3)
Both personal background and household energy-consuming facility use have important influences on household carbon emissions, and their influence degree is higher in urban areas than in rural areas. In urban areas, continuous variables, such as the number of registration residents, average daily sunshine time in winter, and number of refrigerators, freezers, computers, incandescent lamps, water heaters, and air conditioners, all have significant positive impacts on household carbon emissions. The number of primary household cooking appliances has a significant negative impact. In rural areas, the number of cooking appliances, washing machines, and air conditioners has significant positive impacts on household carbon emissions. Household economic status has a significant negative impact, because poorer households use cheaper energy, such as coal rather than gas, thus emitting more carbon. Factors, such as age, income, family assets, and the individual perception of socioeconomic status, do not have significant impacts on household carbon emissions.
(4)
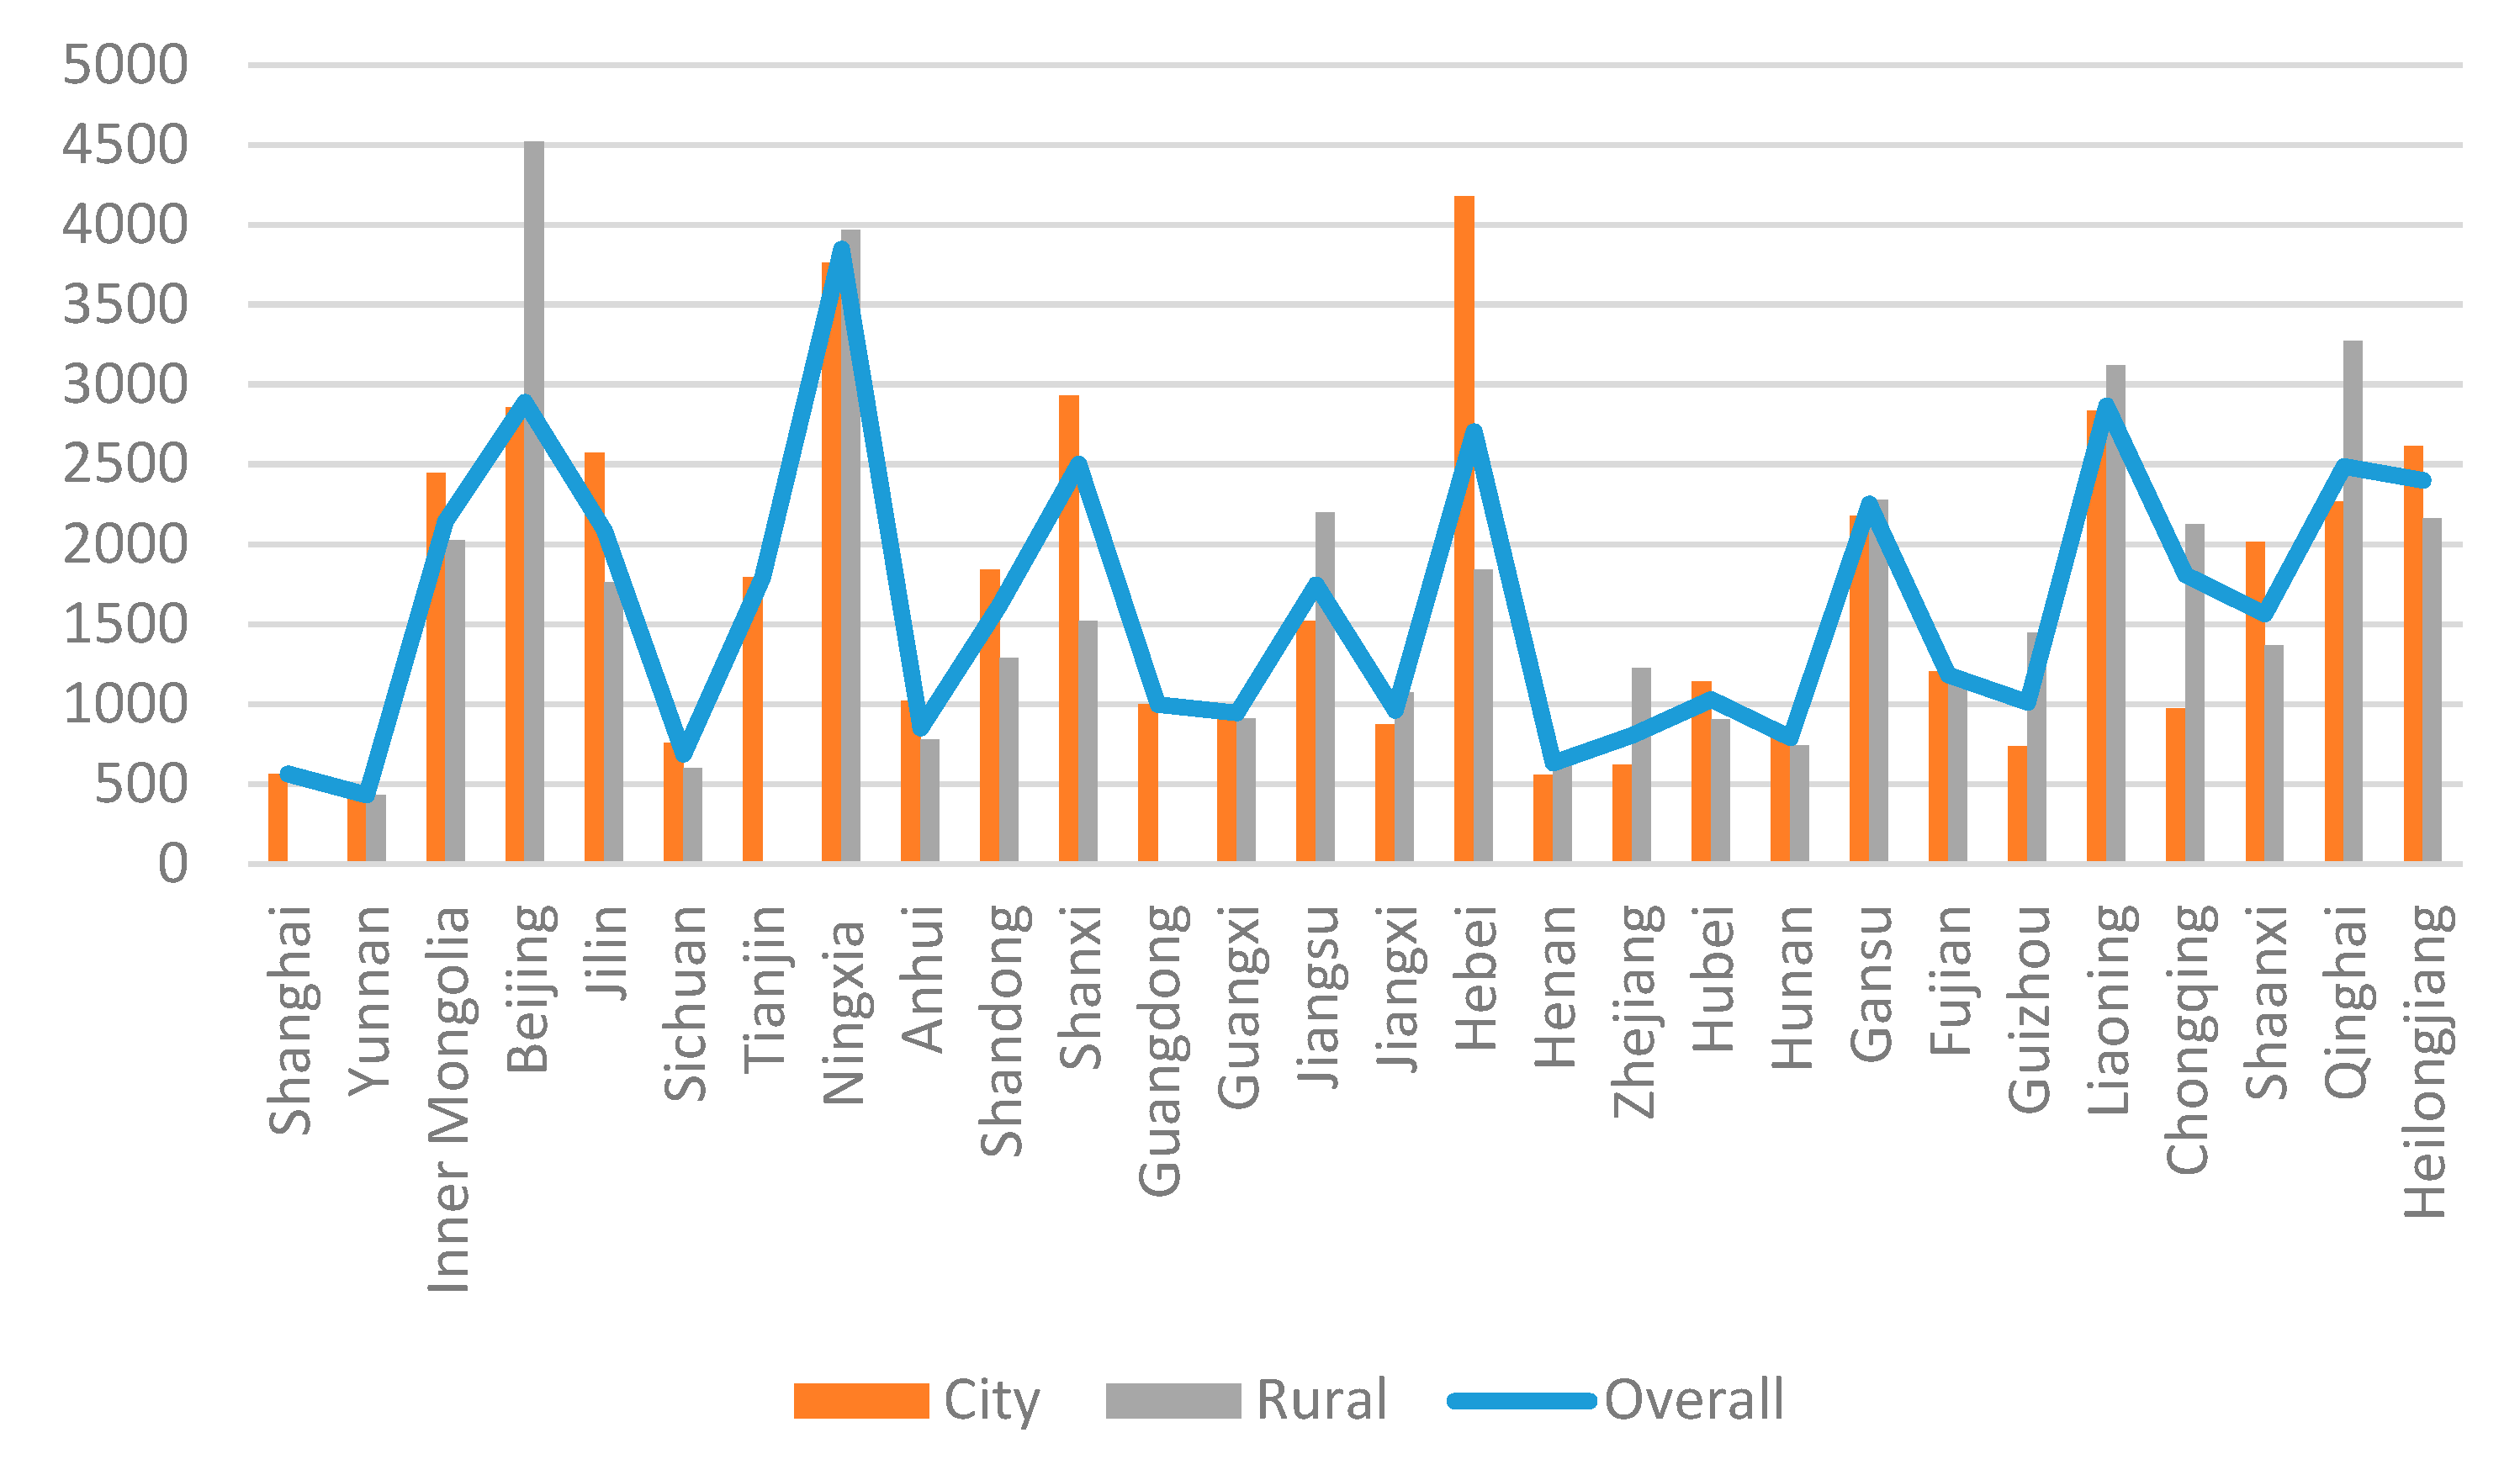
From an interprovincial perspective, household carbon emissions in Liaoning, Ningxia, Qinghai, Gansu, and Shanxi are relatively high, while those in Shanghai, Yunnan, Henan, Zhejiang, Hubei, and Anhui are relatively low.
(5)
Registration status, type of workplace (organization/company), ownership of the company/organization, marital status, and type of cooking appliances all show significant impacts on household carbon emissions. The carbon emissions of non-agricultural household registration residents and married people, especially people working in the Party and government organizations, enterprises, public institutions, and social organizations, are significantly higher. Rural households’ carbon emissions associated with cooking appliances are significantly higher than urban households’ emissions. Other classification independent variables, such as gender, nationality, the highest level of education, and political status, have no significant impact on household carbon emissions.
According to the results of the analysis, we provide several policy suggestions. First, policy should be more specific for different regions and kinds of residents. It is possible to make punishment policies for urban residents since they emit more carbon and have higher incomes. It is possible to implement more incentive plans for energy saving in northeast regions since they emit less carbon and do not have high incomes. In short, it is necessary to conduct further research. From an interprovincial perspective, firstly, the government should implement effective measures to support Liaoning, Ningxia, Qinghai, Gansu, and Shanxi. Secondly, policies should be emphasized that promote energy saving to solve the problems of central heating, by absorbing more resources to innovate green-building technology. Thirdly, the emphasis of policies should be different according to urban–rural differences. For example, control of the resident population and usage of appliances are important moves in urban areas, whereas the improvement of the structure of energy usage from coal to gas and controlling the use of appliances are significant in rural areas. Besides, companies should put more resources into technical innovation of low-energy appliances. Fourth, the more carbon the province emits, the more active measures need to be taken, especially at the household-level. Fifth, more communication about energy saving and low-carbon development should be conducted in the Party and governmental organizations and public institutions. Moreover, it might be better to popularize the new method of cooking since it influences carbon emissions hugely.

Author Contributions

J.F. designed the research, established the models and wrote the majority of the manuscript. A.R. and X.L. reviewed the literature and analyzed the data. All authors have read and approved the final manuscript.

Funding

This research received no external funding.

Acknowledgments

The authors wish to thank the anonymous reviewers for their constructive suggestions to improve the quality of this article.

Conflicts of Interest

The authors declare no conflict of interest.

References

  1. Allen, M.R.; Frame, D.J.; Huntingford, C.; Jones, C.D.; Lowe, J.A.; Meinshausen, M.; Meinshausen, N. Warming caused by cumulative carbon emissions towards the trillionth tonne. Nature 2009, 458, 1163–1166. [Google Scholar] [CrossRef] [PubMed]
  2. Li, S.; Zhou, C.; Wang, S. Does modernization affect carbon dioxide emissions? A panel data analysis. Sci. Total Environ. 2019, 663, 426–435. [Google Scholar] [CrossRef] [PubMed]
  3. Zhang, J.; Yu, B.; Cai, J.; Wei, Y. Impacts of household income change on CO2 emissions: An empirical analysis of China. J. Clean. Prod. 2017, 157, 190–200. [Google Scholar] [CrossRef]
  4. Burck, J.; Marten, F.; Bals, C.; Hohne, N. Climate Change Performance Index: Results 2018; Germanwatch: Bonn, Germany, 2018. [Google Scholar]
  5. Dong, F.; Li, J.; Wang, Y.; Zhang, X.; Zhang, S.; Zhang, S. Drivers of the decoupling indicator between the economic growth and energy-related CO2 in China: A revisit from the perspectives of decomposition and spatiotemporal heterogeneity. Sci. Total Environ. 2019, 685, 631–658. [Google Scholar] [CrossRef] [PubMed]
  6. Wiedenhofer, D.; Guan, D.; Liu, Z.; Meng, J.; Zhang, N.; Wei, Y.-M. Unequal household carbon footprints in China. Nat. Clim. Chang. 2016, 7, 75–80. [Google Scholar] [CrossRef] [Green Version]
  7. Wu, Y.; Shen, J.; Zhang, X.; Skitmore, M.; Lu, W. Reprint of: The impact of urbanization on carbon emissions in developing countries: A Chinese study based on the U-Kaya method. J. Clean. Prod. 2017, 163, S284–S298. [Google Scholar] [CrossRef]
  8. Wei, Y.-M.; Liu, L.-C.; Fan, Y.; Wu, G. The impact of lifestyle on energy use and CO2 emission: An empirical analysis of China’s residents. Energy Policy 2007, 35, 247–257. [Google Scholar] [CrossRef]
  9. Li, J.; Zhang, D.; Su, B. The Impact of Social Awareness and Lifestyles on Household Carbon Emissions in China. Ecol. Econom. 2019, 160, 145–155. [Google Scholar] [CrossRef]
  10. Chen, C.; Liu, G.; Meng, F.; Hao, Y.; Zhang, Y.; Casazza, M. Energy consumption and carbon footprint accounting of urban and rural residents in Beijing through Consumer Lifestyle Approach. Ecol. Indic. 2019, 98, 575–586. [Google Scholar] [CrossRef]
  11. Núñez-Cacho, P.; Molina-Moreno, V.; Corpas-Iglesias, F.A.; Cortés-García, F.J. Family Businesses Transitioning to a Circular Economy Model: The Case of “Mercadona”. Sustainability 2018, 10, 538. [Google Scholar]
  12. Nuñez-Cacho, P.; Górecki, J.; Molina-Moreno, V.; Corpas-Iglesias, F.A. What Gets Measured, Gets Done: Development of a Circular Economy Measurement Scale for Building Industry. Sustainability 2018, 10, 2340. [Google Scholar] [CrossRef]
  13. Maraseni, T.; Qu, J.; Zeng, J. A comparison of trends and magnitudes of household carbon missions between China, Canada and UK. Environ. Dev. 2015, 15, 103–119. [Google Scholar] [CrossRef]
  14. Du, J.; Zhang, M.-Y.; Ye, Y.; Ma, X.-W. Indirect carbon emissions from household consumption between China and the USA: based on an input–output model. Nat. Hazards 2016, 84, 399–410. [Google Scholar]
  15. Ding, Q.; Cai, W.; Wang, C.; Sanwal, M. The relationships between household consumption activities and energy consumption in china—An input-output analysis from the lifestyle perspective. Appl. Energy 2017, 207, 520–532. [Google Scholar] [CrossRef]
  16. Marasent, T.; Qu, J.; Yue, B.; Zeng, J.; Maroulis, J. Dynamism of household carbon emissions (HCEs) from rural and urban regions of northern and southern China. Environ. Sci. Pollut. Res. 2016, 23, 20553–20566. [Google Scholar] [CrossRef] [PubMed]
  17. Jiang, L.; Chen, X.; Xue, B. Features, Driving Forces and Transition of the Household Energy Consumption in China: A Review. Sustainability 2019, 11, 1186. [Google Scholar] [CrossRef]
  18. Feng, Z.-H.; Zou, L.-L.; Wei, Y.-M. The impact of household consumption on energy use and CO2 emissions in China. Energy 2011, 36, 656–670. [Google Scholar] [CrossRef]
  19. Liu, L.-C.; Wu, G.; Wang, J.-N.; Wei, Y.-M. China’s carbon emissions from urban and rural households during 1992–2007. J. Clean. Prod. 2011, 19, 1754–1762. [Google Scholar] [CrossRef]
  20. Wang, Z.; Yang, L. Indirect carbon emissions in household consumption: evidence from the urban and rural area in China. J. Clean. Prod. 2014, 78, 94–103. [Google Scholar] [CrossRef]
  21. Yu, B.; Wei, Y.-M.; Kei, G.; Matsuoka, Y. Future scenarios for energy consumption and carbon emissions due to demographic transitions in Chinese households. Nat. Energy 2018, 3, 109–118. [Google Scholar] [CrossRef]
  22. Xia, Y.; Wang, H.; Liu, W. The indirect carbon emission from household consumption in China between 1995–2009 and 2010–2030: A decomposition and prediction analysis. Comput. Ind. Eng. 2019, 128, 264–276. [Google Scholar] [CrossRef]
  23. Li, Y.; Zhao, R.; Liu, T.; Zhao, J. Does urbanization lead to more direct and indirect household carbon dioxide emissions? Evidence from China during 1996–2012. J. Clean. Prod. 2015, 102, 103–114. [Google Scholar] [CrossRef]
  24. Wang, L.; Qu, L.; Liu, L.; Bian, Y. Analysis and comparison of urban and rural household carbon emissions in China. J. Arid Land Resour. Environ. 2015, 5, 6–11. Available online: http://en.cnki.com.cn/article_en/cjfdtotal-ghzh201505002.htm (accessed on 28 March 2019). (In Chinese).
  25. Niu, H. An Empirical Test on the Carbon Emission Effect of Urbanization in China. Stat. Decis. 2019, 6, 138–142. Available online: http://kns.cnki.net/kcms/detail/Detail.aspx?dbname=CJFDTEMP&filename=TJJC201906034&v= (accessed on 2 July 2019). (In Chinese).
  26. Li, J.; Huang, X.; Yang, H.; Chuai, X.; Li, Y.; Qu, J.; Zhang, Z. Situation and determinants of household carbon emissions in Northwest China. Habitat Int. 2016, 51, 178–187. [Google Scholar] [CrossRef]
  27. Zhang, H.; Lahr, M. Households’ Energy Consumption Change in China: A Multi-Regional Perspective. Sustainability 2018, 10, 2486. [Google Scholar] [CrossRef]
  28. Wang, C.; Zhan, J.; Li, Z.; Zhang, F.; Zhang, Y. Structural decomposition analysis of carbon emissions from residential consumption in the Beijing-Tianjin-Hebei region, China. J. Clean. Prod. 2019, 208, 1357–1364. [Google Scholar] [CrossRef]
  29. Zhang, J.; Yu, B.; Wei, Y.-M. Heterogeneous impacts of households on carbon dioxide emissions in Chinese provinces. Appl. Energy 2018, 229, 236–252. [Google Scholar] [CrossRef]
  30. Shi, Y.; Han, B.; Han, L.; Wei, Z. Uncovering the national and regional household carbon emissions in China using temporal and spatial decomposition analysis models. J. Clean. Prod. 2019, 232, 966–979. [Google Scholar] [CrossRef]
  31. Fremstad, A.; Underwood, A.; Zahran, S. The Environmental Impact of Sharing: Household and Urban Economies in CO2 Emissions. Ecol. Econom. 2018, 145, 137–147. [Google Scholar] [CrossRef]
  32. Zhang, X.; Luo, L.; Skitmore, M.; Skitmore, R. Household carbon emission research: an analytical review of measurement, influencing factors and mitigation prospects. J. Clean. Prod. 2015, 103, 873–883. [Google Scholar] [CrossRef] [Green Version]
  33. Huang, J.; Huang, X.; Gao, J. Study on the relation between socio–economic attributes of family and household daily travel carbon emission—Taking Wuhan as an Example. Urban Probl. 2015, 5, 66–76. Available online: http://www.cnki.com.cn/Article/CJFDTOTAL-CSWT201505012.htm (accessed on 29 March 2019). (In Chinese).
  34. Hu, Z.; He, J.; Li, Y. Study on the marginal effect of residential carbon emissions on urban household. Popul. Econ. 2018, 6, 112–124. Available online: http://www.cnki.com.cn/Article/CJFDTOTAL-RKJJ201806011.htm (accessed on 29 March 2019). (In Chinese).
  35. Xu, X.; Han, L.; Lv, X. Household carbon inequality in urban China, its sources and determinants. Ecol. Econom. 2016, 128, 77–86. Available online: http://www.cnki.com.cn/Article/CJFDTOTAL-STJJ201204008.htm (accessed on 30 March 2019). (In Chinese). [CrossRef]
  36. LI, Z.; Li, P.; Guo, J.; Zeng, X. Impact factors estimation and research on the differences across cities of residential CO2 emissions in Chinese major cities. China Popul. Resour. Environ. 2013, 10, 87–94. Available online: http://en.cnki.com.cn/Article_en/CJFDTotal-ZGRZ201310013.htm (accessed on 30 March 2019). (In Chinese).
  37. Wang, W.; Li, J. Correlation between residential density and carbon emissions caused by household energy consumption: A case study on Caoyang Xincun, Shanghai. City Plan. Rev. 2017, 6, 83–91. Available online: http://www.en.cnki.com.cn/Article_en/CJFDTotal-CSGH201706013.htm (accessed on 30 March 2019). (In Chinese).
  38. Brand, C.; Goodman, A.; Rutter, H.; Song, Y.; Ogilvie, D. Associations of individual, household and environmental characteristics with carbon dioxide emissions from motorized passenger travel. Appl. Energy 2013, 104, 158–169. [Google Scholar] [CrossRef]
  39. Morris, J.; Allinson, D.; Harrison, J.; Lomas, K.J. Benchmarking and tracking domestic gas and electricity consumption at the local authority level. Energy Efficiency 2016, 9, 723–743. [Google Scholar] [CrossRef]
  40. Buchs, M.; Schnepf, S. Who emits most? Associations between socio-economic factors and UK households’ home energy, transport, indirect and total CO2 emissions. Ecol. Econom. 2013, 90, 114–123. [Google Scholar] [CrossRef]
  41. Chen, G.; Wiedmann, T.; Hadjikakou, M.; Rowley, H. City carbon footprint networks. Energies 2016, 9, 602. [Google Scholar] [CrossRef]
  42. Ponce, P.; Alvarado, R.; Ponce, K.; Alvarado, R.; Granda, D.; Yaguana, K. Green returns of labor income and human capital: Empirical evidence of the environmental behavior of households in developing countries. Ecol. Econ. 2019, 6, 105–113. [Google Scholar] [CrossRef]
  43. Baul, T.K.; Datta, D.; Alam, A. A comparative study on household level energy consumption and related emissions from renewable (biomass) and non-renewable energy sources in Bangladesh. Energy Policy 2018, 114, 598–608. [Google Scholar] [CrossRef]
Figure 1. Statistical schematic diagram of the average total household carbon emissions by province.
Sustainability 11 04919 g001
Figure 2. Statistical schematic diagram of estimated values and orders of the provinces’ coefficients.
Sustainability 11 04919 g002
Table 1. Statistics of the average total household carbon emissions by the highest level of education. Unit: kg.
Highest Level of EducationIlliteracyPrimary SchoolMiddle SchoolHigh SchoolJunior CollegeUndergraduatePostgraduate
Mean1058.4921305.3331622.0131764.0981732.6712030.6831662.322
Table 2. Statistics of the mean annual household fuel consumption and Co2 emission. Units: kg.
OverallCityRural
MeanStandard Error MeanStandard Error MeanStandard Error
Annual CO2 emission from honeycomb briquette/coal90.43310.96468.66813.715121.07417.978
Annual CO2 emission from coal consumption242.18621.468126.15921.399405.53041.612
Annual CO2 emission from gasoline consumption111.72225.534144.88442.15865.03615.983
Annual CO2 emission from diesel fuel consumption22.7877.59820.22911.27426.3899.101
Annual CO2 emission from bottled liquefied gas consumption285.60430.198295.67436.285271.42851.758
Annual CO2 emission from pipeline natural gas consumption89.3626.418145.78710.6349.9262.607
Annual CO2 emission from pipeline gas consumption4.5700.9917.6301.6870.2630.166
Annual CO2 emission from domestic livestock and poultry manure consumption0.6890.4570.0010.0011.6581.101
Annual CO2 emission from straw consumption36.76110.5560.6800.39887.55725.352
Annual CO2 emission from fuelwood consumption95.28616.41213.9875.593209.74038.519
Annual CO2 emission from electricity consumption140.2553.342162.4844.941108.9613.891
Annual CO2 emission from coal consumption for central heating416.01516.785668.28025.94760.87211.844
Table 3. Statistics of the average total household carbon emissions by province. Unit: kg.
OverallCityRural
Sample SizeMeanStandard ErrorChi-SquareSample SizeMeanStandard ErrorChi-SquareSample SizeMeanStandard ErrorChi-Square
Shanghai502563.93481.14263,472.542 **502563.93481.14242,007.862 **---41,875.822 **
Yunnan385431.312109.26893432.576230.452292430.977124.858
Inner Mongolia992148.507430.850252444.166768.832742027.556528.35
Beijing5472890.335411.9385192852.278413.583284517.273914.308
Jilin4652086.345266.3331782568.291359.6852871761.665371.945
Sichuan566685.66759.624275758.29772.848291597.37297.413
Tianjin2881791.54993.0182881791.54993.018---
Ningxia 943848.488765.211473759.8221113.41473966.7091047.567
Anhui397849.748165.761191018.621312.868278775.867195.673
Shandong5751621.078166.7923151839.414218.5972601290.621254.466
Shanxi2802503.978205.6971892928.688200.255911518.648448.442
Guangdong531998.398143.13531998.398143.130---
Guangxi393944.638244.071194990.616349.036199910.551339.695
Jiangsu4991748.379360.5753211521.577338.8411782197.783842.309
Jiangxi476959.256219.712284873.694202.3751921074.697440.045
Hebei2952705.470366.161994176.916842.4201961841.287255.453
Henan582630.339184.061216554.15182.867366681.132302.232
Zhejiang462804.428181.933341617.490166.6111211222.579453.276
Hubei6001029.383229.2633501139.935377.321250902.247235.862
Hunan475788.081110.976240840.126150.085235738.705163.523
Gansu1952254.467290.209502180.543553.1031452276.645341.671
Fujian2941182.625364.781941202.781503.7591001134.849307.779
Guizhou2491009.139203.509177734.973286.453721447.806246.531
Liaoning3952867.547295.7363452832.957286.600503116.5951313.229
Chongqing2651807.233556.67279973.932187.3461862126.664764.541
Shaanxi3691563.291201.1591062017.001214.2522631366.285270.846
Qinghai1012486.825331.347752263.146298.489263269.671074.684
Heilongjiang5892401.231233.9043182613.66203.6452712161.686442.081
**: Difference is significant at the 0.01 level (2-sided).
Table 4. Statistics of coefficient estimation results of continuous independent variables.
Independent VariableOverallCityRural
βSig.ToleranceVIFβSig.ToleranceVIFβSig.ToleranceVIF
Constant0.2350.959 2.7290.609 −1.4040.865
Pb1age0.0020.3420.3652.7410.0010.8490.3153.1770.0040.3490.4002.503
Pb2total individual income last year0.0000.3400.9661.0360.0000.2400.9361.0690.0000.9590.9511.052
Pb3total family income last year0.0000.8290.8821.1340.0000.9110.8271.2090.0000.3960.8361.196
Pb4number of registration residents0.0450.0190.7391.3530.0430.0580.7061.4170.0460.1690.7061.416
Pb5number of houses owned by the family0.0260.5400.8461.1820.0420.3230.8241.213−0.0490.6400.7951.259
Pb6household economic status−0.0390.3090.6611.5130.0210.6140.6811.467−0.1580.0400.5571.797
Pb7individual perception of socioeconomic status−0.0530.2680.6991.430−0.0660.2050.7121.404−0.0800.4060.5881.700
He1domestic living space0.0000.1640.7071.4140.0010.1150.7041.4200.0000.6690.6831.464
He2the average daily sunshine time in winter0.0450.0100.3323.0160.0630.0020.3163.1670.0400.2110.3382.958
He3the average daily sunshine time in summer−0.0160.3430.3313.024−0.0270.1530.3133.198−0.0210.5140.3532.834
He4the number of main cooking appliances−0.0150.1220.7881.269−0.0200.0210.7871.2710.0970.0160.4912.037
He5the number of refrigerators0.2360.0000.6211.6110.2530.0030.6191.6150.1500.1560.6181.617
He6the number of freezers0.1550.0490.7871.2710.1860.0660.8071.2400.0880.5110.6541.530
He7the number of washing machines0.0900.1560.6651.504−0.0460.5720.6481.5430.2490.0180.6231.605
He8the number of dryers0.0260.8890.8991.1120.1160.5830.8761.141−0.0940.7930.7841.276
He9the number of TVs0.0800.1180.7051.4190.0550.3480.6711.4900.0950.3220.6641.505
He10the number of computers0.0360.1720.7681.3020.0950.0380.5821.7170.0030.9330.8491.178
He11the number of fluorescent lamps0.0200.5620.2484.0240.0180.6280.2533.946−0.0040.9510.2204.551
He12the number of incandescent lamps0.0070.7720.8741.1440.0590.0460.8801.136−0.0530.1690.8211.218
He13the number of water heaters0.1590.0050.5831.7160.2210.0010.6281.5920.0920.3730.6301.588
He14the number of air conditioners0.0790.0370.4462.2410.0670.0800.4672.1430.1630.0990.4882.050

