1. Introduction
Precast concrete architecture is a new type of architecture that combines precast construction technology with sustainable technology. Compared with cast-in-place concrete structures, precast ones are advantageous in terms of less resource consumption, more rapid construction, better quality control and less field wet operation [
1,
2,
3]. Currently, the precast concrete structure system is greatly developed and popularized in China. It includes (1) the precast shear wall system, (2) precast frame system, and (3) precast frame-shear wall composite system. The precast frame system is the most important system in China [
4]. The mechanical properties of the joints are the most vital factor affecting the seismic performance of the precast frame structure [
5]. Therefore, the connection forms and mechanical properties of the precast concrete frame become a focus in this field.
The connection types of precast concrete frame joints include two categories [
4]: (1) Wet connection, and (2) dry connection. The wet connection combines the precast concrete components with post-cast concrete during assembling. For example, Cai et al. [
6] conducted an experimental study on the Scope system introduced from France. In this system, a post-cast concrete includes a service hole, and U-shaped reinforcements are arranged at the end of the beam.
Yuksel et al. [
7] proposed that grouting sleeves are used to connect the upper column and lower column, and the beam and column are connected by U-shaped reinforcements and post-cast concrete. Vasconez et al. [
8] proposed to post-cast high-performance, fiber-reinforced cement composite materials in the beam-to-column connection area. Many research results show that the precast joint with the wet connection has a similar seismic performance to the monolithic joint with good energy dissipation and bearing capacity [
6,
7,
8,
9]. In addition, the wet connection does not require high production accuracy for its components, so it has convenience in assembling [
2]. However, the advantages of precast structures are not fully utilized in the wet connection due to numerous on-site activities, such as casting wet joints and the grouting of ducts and connections [
10].
Dry connection does not require cast-in-place, which greatly improves the construction efficiency, and avoids the drawback of environmental pollution. Dry connection can be mainly classified as (1) welded connection [
11,
12], (2) prestressed connection [
13,
14,
15,
16,
17,
18], and (3) bolted connection [
11,
19,
20,
21,
22,
23,
24,
25].
The welded connection is to pre-embed steel end plates in the connection part of the precast components, and then the connections are established by welding steel link plates to the pre-embedded end plates. Ersoy et al. [
11] proposed a midspan welded connection scheme by embedding steel plates at the top, bottom and side of the connection area, and then combine the components by welding steel link plates to the embedded steel plates, respectively. Law et al. [
12] proposed that a precast beam is inserted into the precast column for welding connection. The connection area also needs embedded end plates and weld steel link plates. These research results show that the welded connection does not require high production accuracy, and has higher bearing capacity and stiffness than the cast-in-place one. Besides, the energy dissipation is comparable to those of monolithic structures [
11,
12]. However, the quality of welded connections relies heavily on the skill of the welders, and is difficult to be guaranteed [
2].
In the prestressed connection structures, the prestressed tendons are used to connect the beam and column through the reserved hole in the beam and column during assembling. The Precast Seismic Structural Systems (PRESSS) research program [
13,
14], which was firstly proposed by the United States and Japan, conducted a variety of beam-to-column prestressed connection schemes. The result of the research shows that post-tensioned prestressed components at beam-to-column connections have strong self-resetting ability. Based on the PRESSS, some further research results reveal that post-tensioning prestressed connections have the advantages of small residual deformation [
15,
16,
17]. However, additional energy dissipation devices are always needed in prestressed connection to overcome the drawback of low-energy dissipation, which increases the cost and difficulty in construction [
17,
18].
In the bolted connection structures, the connection is established by the bolts through the reserved holes in the beam and column, and the bolts are the most vital part to transfer the load. Al-Salloum et al. [
19] proposed a bolted connection with grouting hole. In his study, the rebar on the bracket is reserved to pass through a grouting hole of the beam, and then high-strength bolts are used to pass through the steel link plates and reserved holes to strengthen the connection. Rahman et al. [
20] and Vidjeapriy et al. [
21] take the connection of steel structure as a reference. They propose that setting an angle cleat at the connection area of beam and column, and connecting them respectively with bolts. Aninthaneni et al. [
10] proposed a removable precast beam-column bolted connection scheme. An end plate, which is welded to two horizontal embedded steel plates in the beam, is arranged at the end of the beam. Along with this, the longitudinal rebars of the beam are welded to the embedded steel plate. To connect the beam and the column, the column is embedded with steel ducts through which threaded rods are passed and bolted to the end plate. Li et al. [
1] proposed a hybrid connection by bolts and prestress, that the steel end plate and beam become an integral component by the connection of the end plate and non-prestressed reinforcements, prestressed tendons. Then the integral component is connected to the column by bolts through the reserved bolt holes in the column. Nakaki et al. [
22] and Englekirk [
23] proposed a bolted connection with ductile rods. The ductile rods are embedded in the column, and they are connected to an embedded steel plate at the end of the beam by high-strength bolts.
Many research results [
11,
19,
20,
21,
22,
23] show that the bolted connection has the advantages of better ductility and energy dissipation ability, and more convenience in assembling than welded connection and prestressed connection has. However, the failure of the bolted connection structures usually takes place at the joint region, and most of the existing joints are arranged at the beam-to-column interface [
1,
21,
24,
25], which always causes the damage of the joint core region. Thus, a novel precast concrete beam-to-column frame with a bolted connection is proposed in this paper. Then, a quasi-static test is used to obtain the mechanical properties and failure modes of the new joints, and also compared with a cast-in-place specimen. Finally, a method of deducing the equivalent stiffness of precast joints is discussed.
2. Novel Dry Connection Details
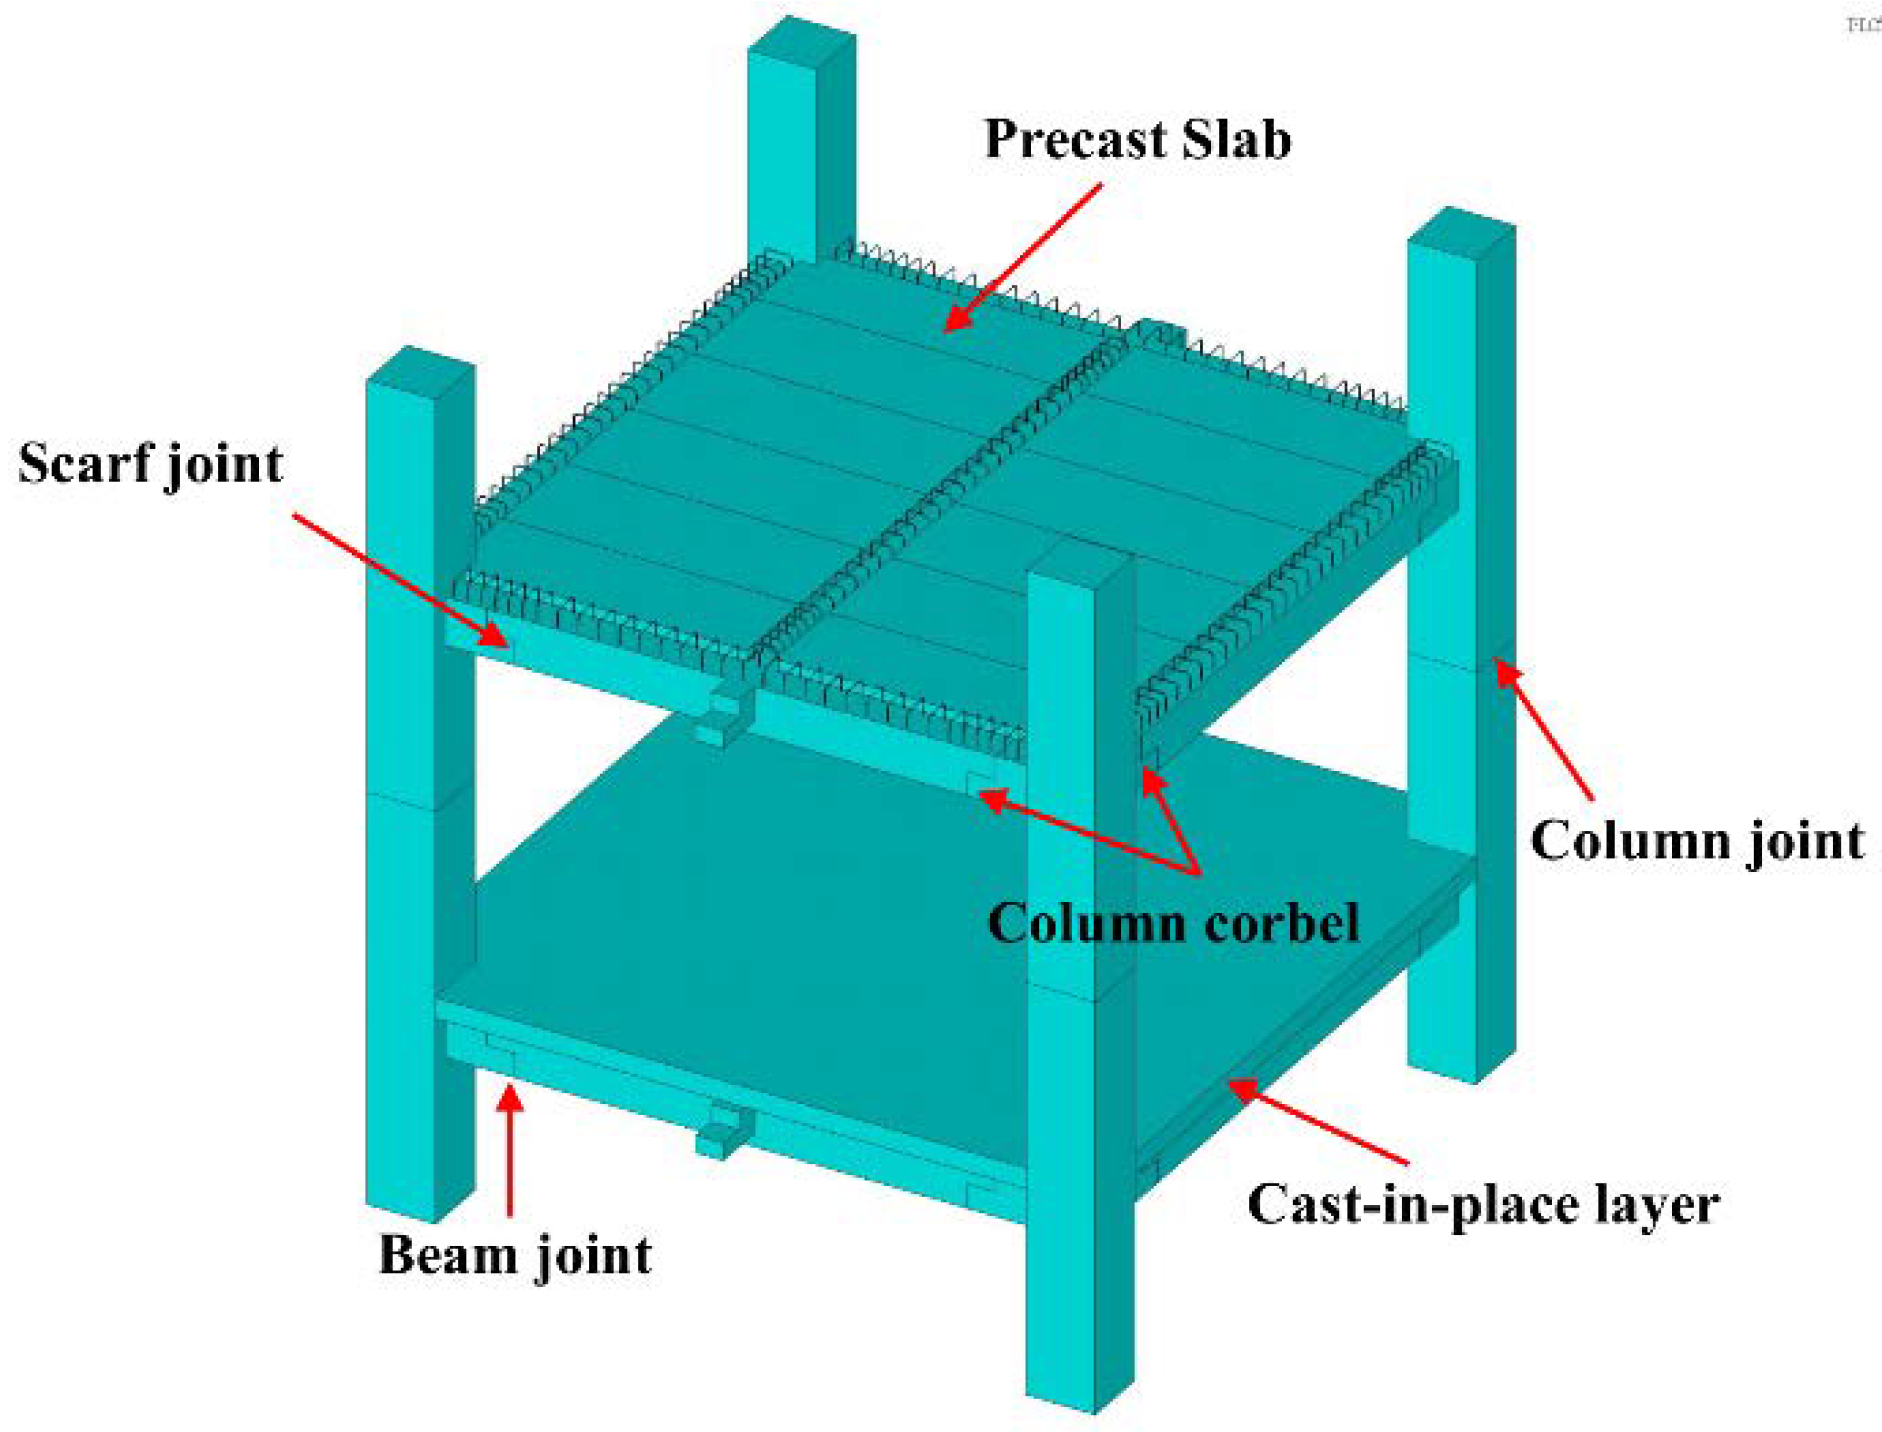
A novel, dryly-connected, precast frame structure system was proposed as in
Figure 1.
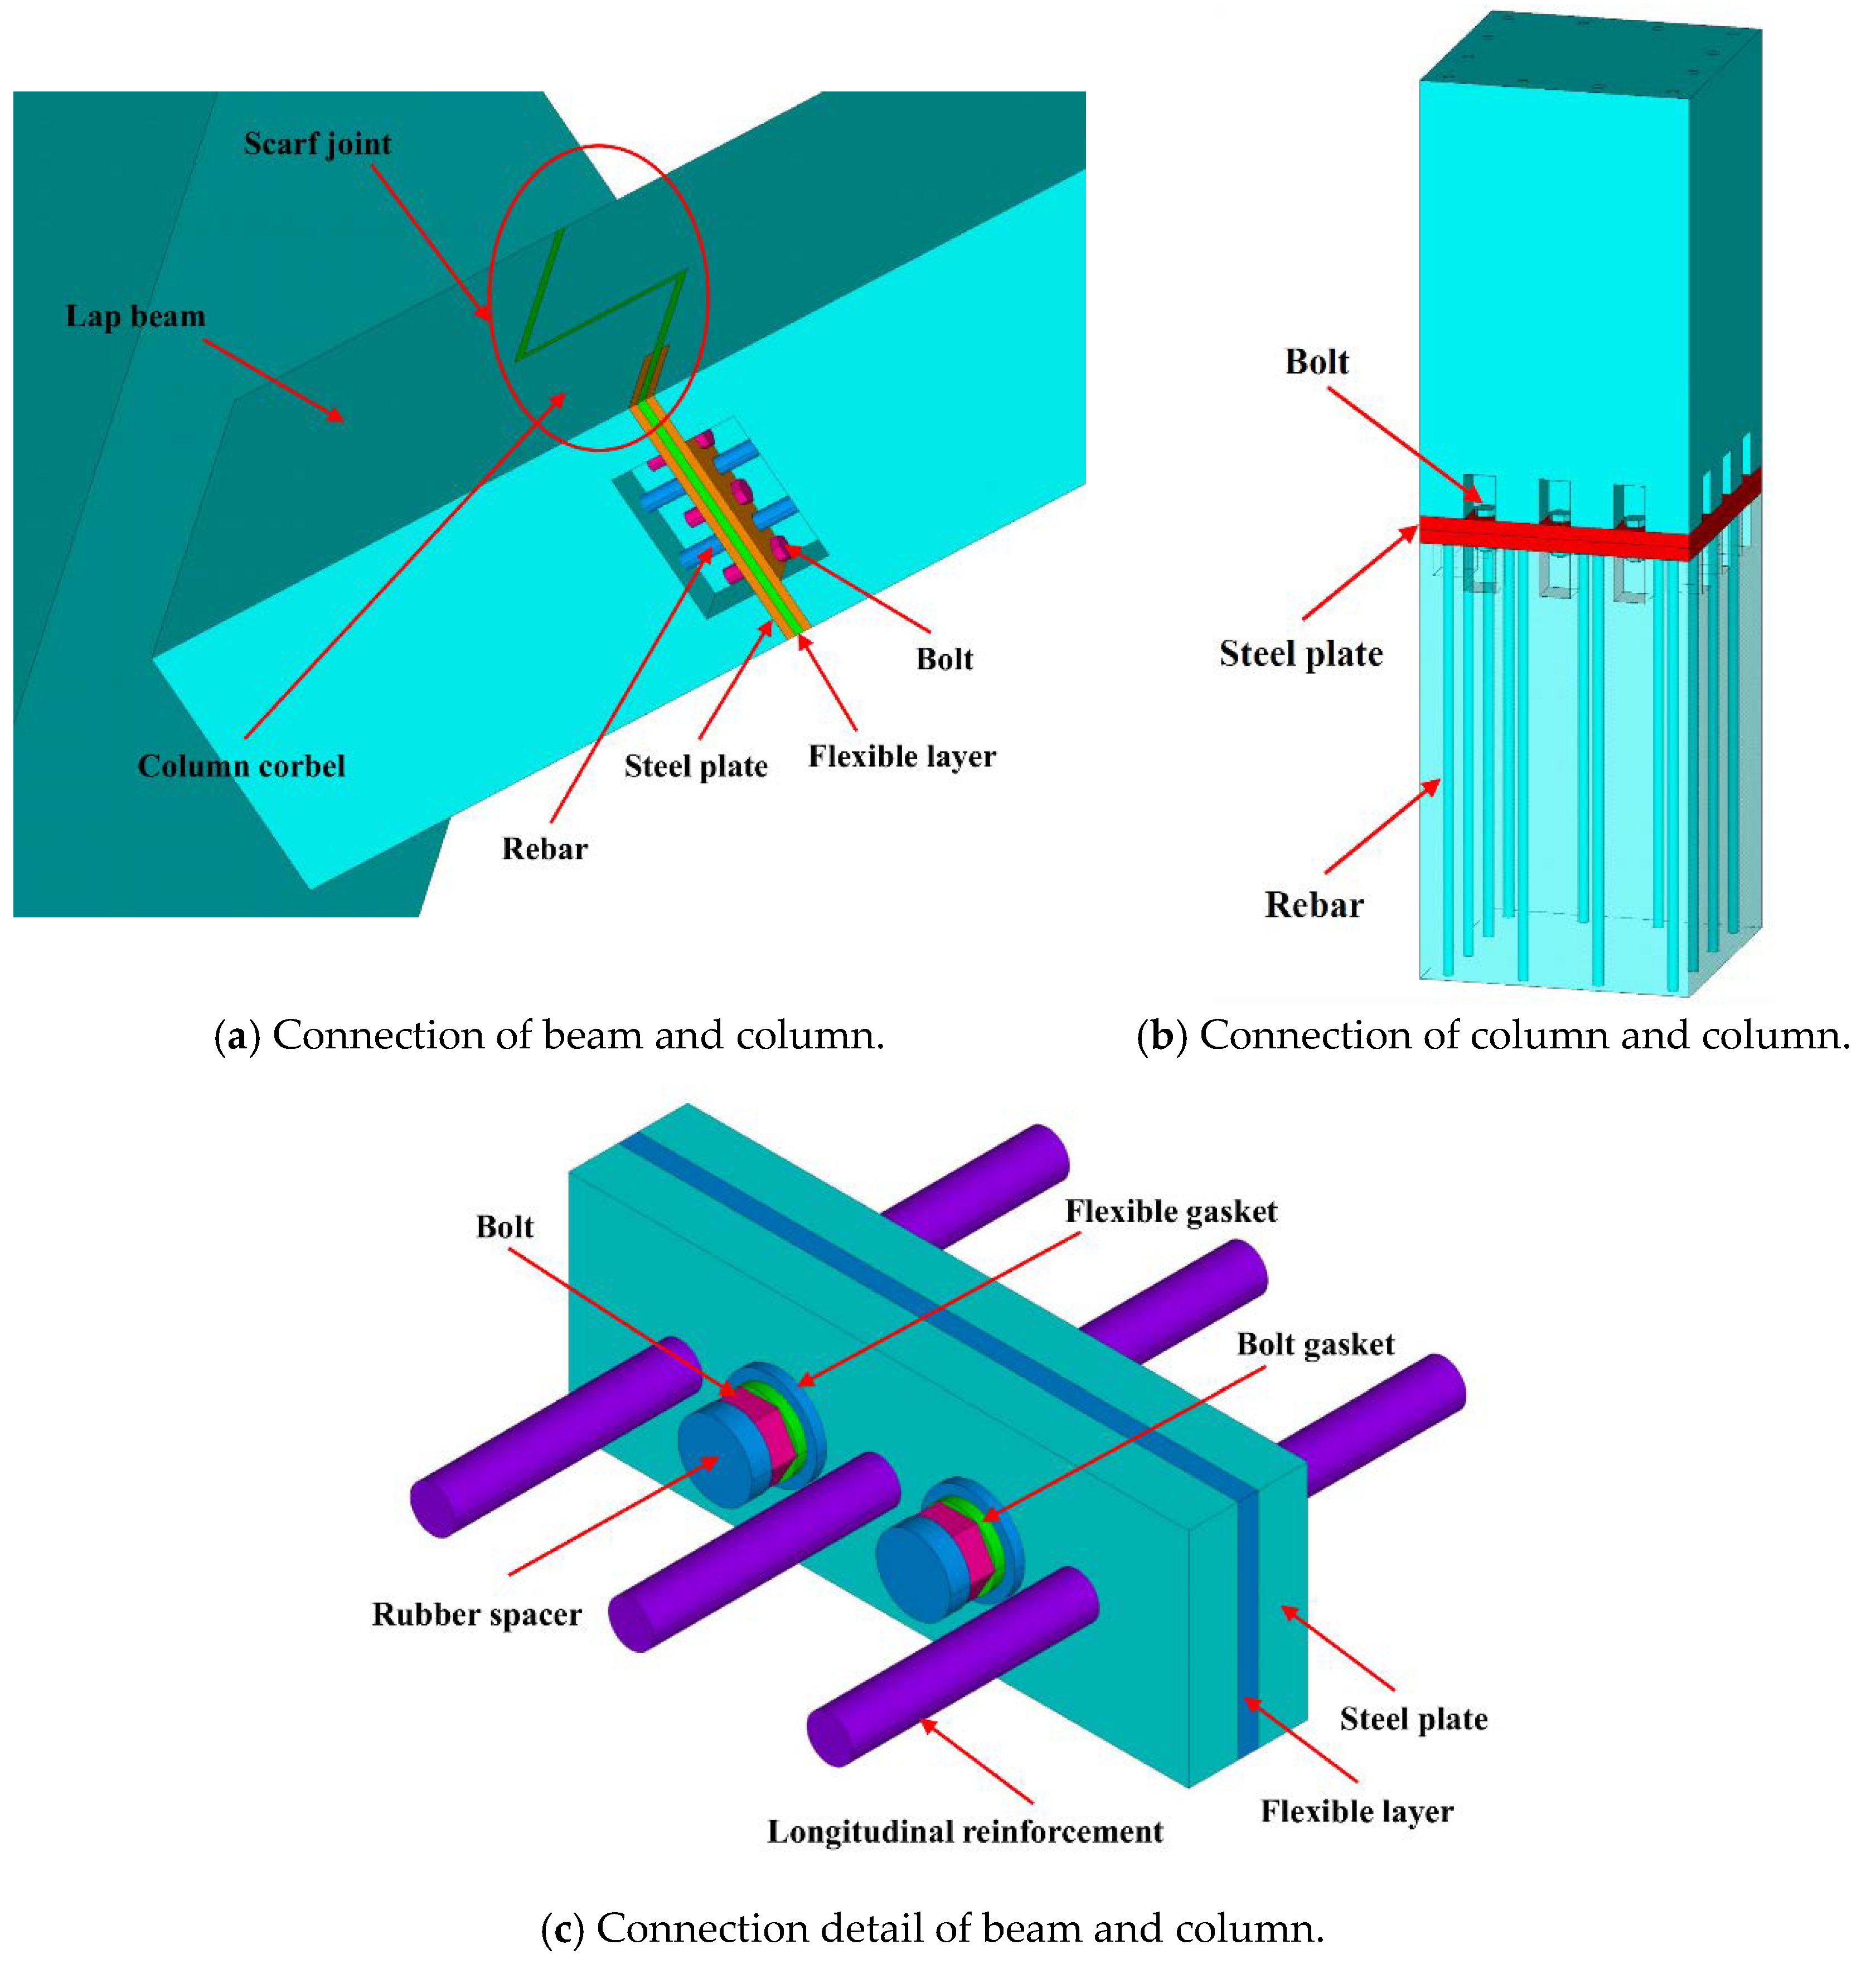
Figure 2 shows its typical beam-column joint and column-column joint. In a beam-column joint (
Figure 2a), the column is continuous and prefabricated with a stepped corbel to support the precast beam. The beam and corbel are connected by bolts through steel plates welded to longitudinal rebars embedded on both end sections of the corbel and beam.
Figure 2c shows the connection details. Between the plates, flexible materials (i.e., rubber layers) are filled to make a well-distributed contact and prevent any leakage of moisture from the external environment. Besides, between the plates and bolts, flexible gaskets (i.e., rubber washers) are arranged to adjust the stiffness of beams by controlling the thickness of the rubber washers. The bolt connector should have also been used on the top of the beam if the floor slabs supported on the beam are prefabricated. The top connection details are the same as the bottom one. In this research, to simulate the composite floor slab system with the upper layer cast in-site, which is popularly applied currently, the top layer of the beam-column joint is cast together. Therefore, in this experiment, the novel bolt connector is only installed at the bottom of the joint. In this novel system the connections between main beams and secondary beams also apply the dry bolt connector, where a small corbel is attached to the main beam to support the secondary beam.
The column to column is connected at the mid-height in this system.
Figure 2b shows the connection details. The steel plates are embedded at the ends of the precast column, welded as to longitudinal rebars. The upper and lower columns are jointed by the bolts surrounding the periphery of the embedded plates.
Besides, with the advantages of dry connections in precast concrete structures, such as speed construction, easy erection, and pollution reduction, the novel system is able to adjust the stiffness of the beams by controlling the thickness of flexible gasket. When increasing the thickness, the stiffness of the beam may decrease. For a concrete frame structure, to achieve the “strong column and weak beam” mechanism and ensure a ductile damage, the stiffness of the beam is expected to be reduced. In the cast-in-site system, the stiffness of this beam is higher than the design expected, since the floor slab system is always cast together with the beams. It prevents the plastic hinges occurring in the beam ends prior to those in the column ends. The special dry beam-column joint can even form a semi rigid joint.
4. Experimental Results
4.1. Failure Modes
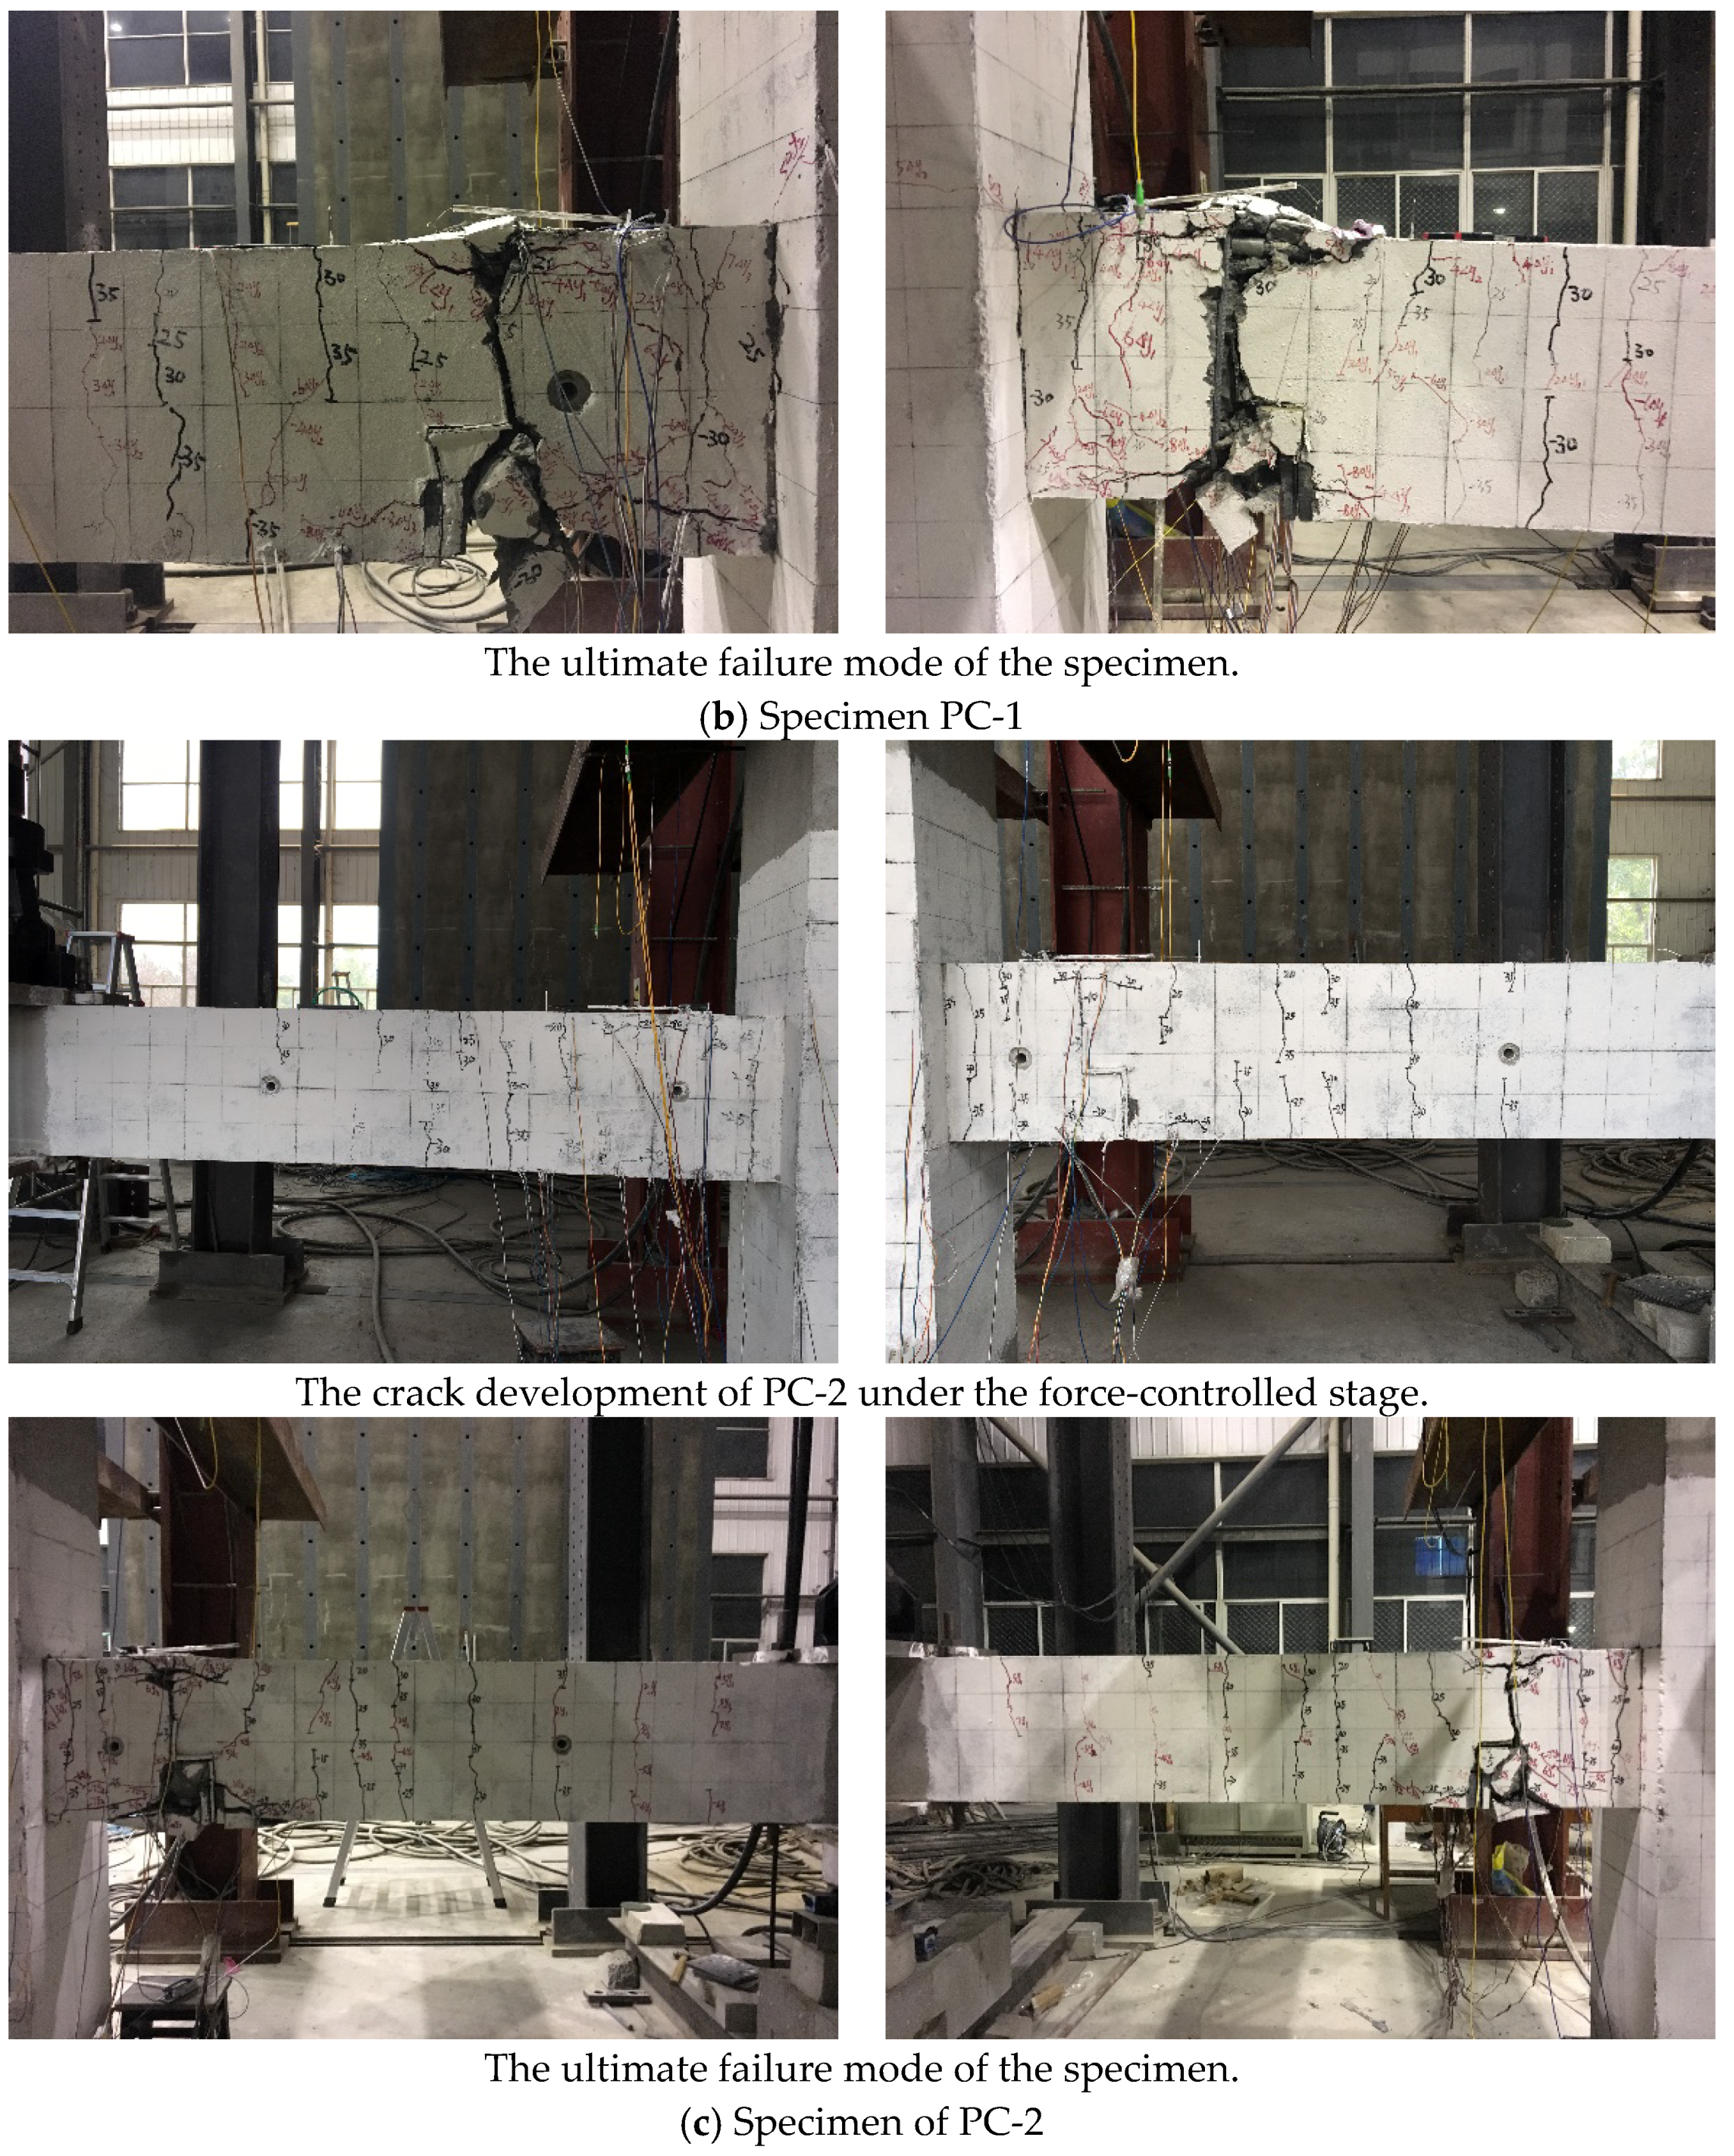
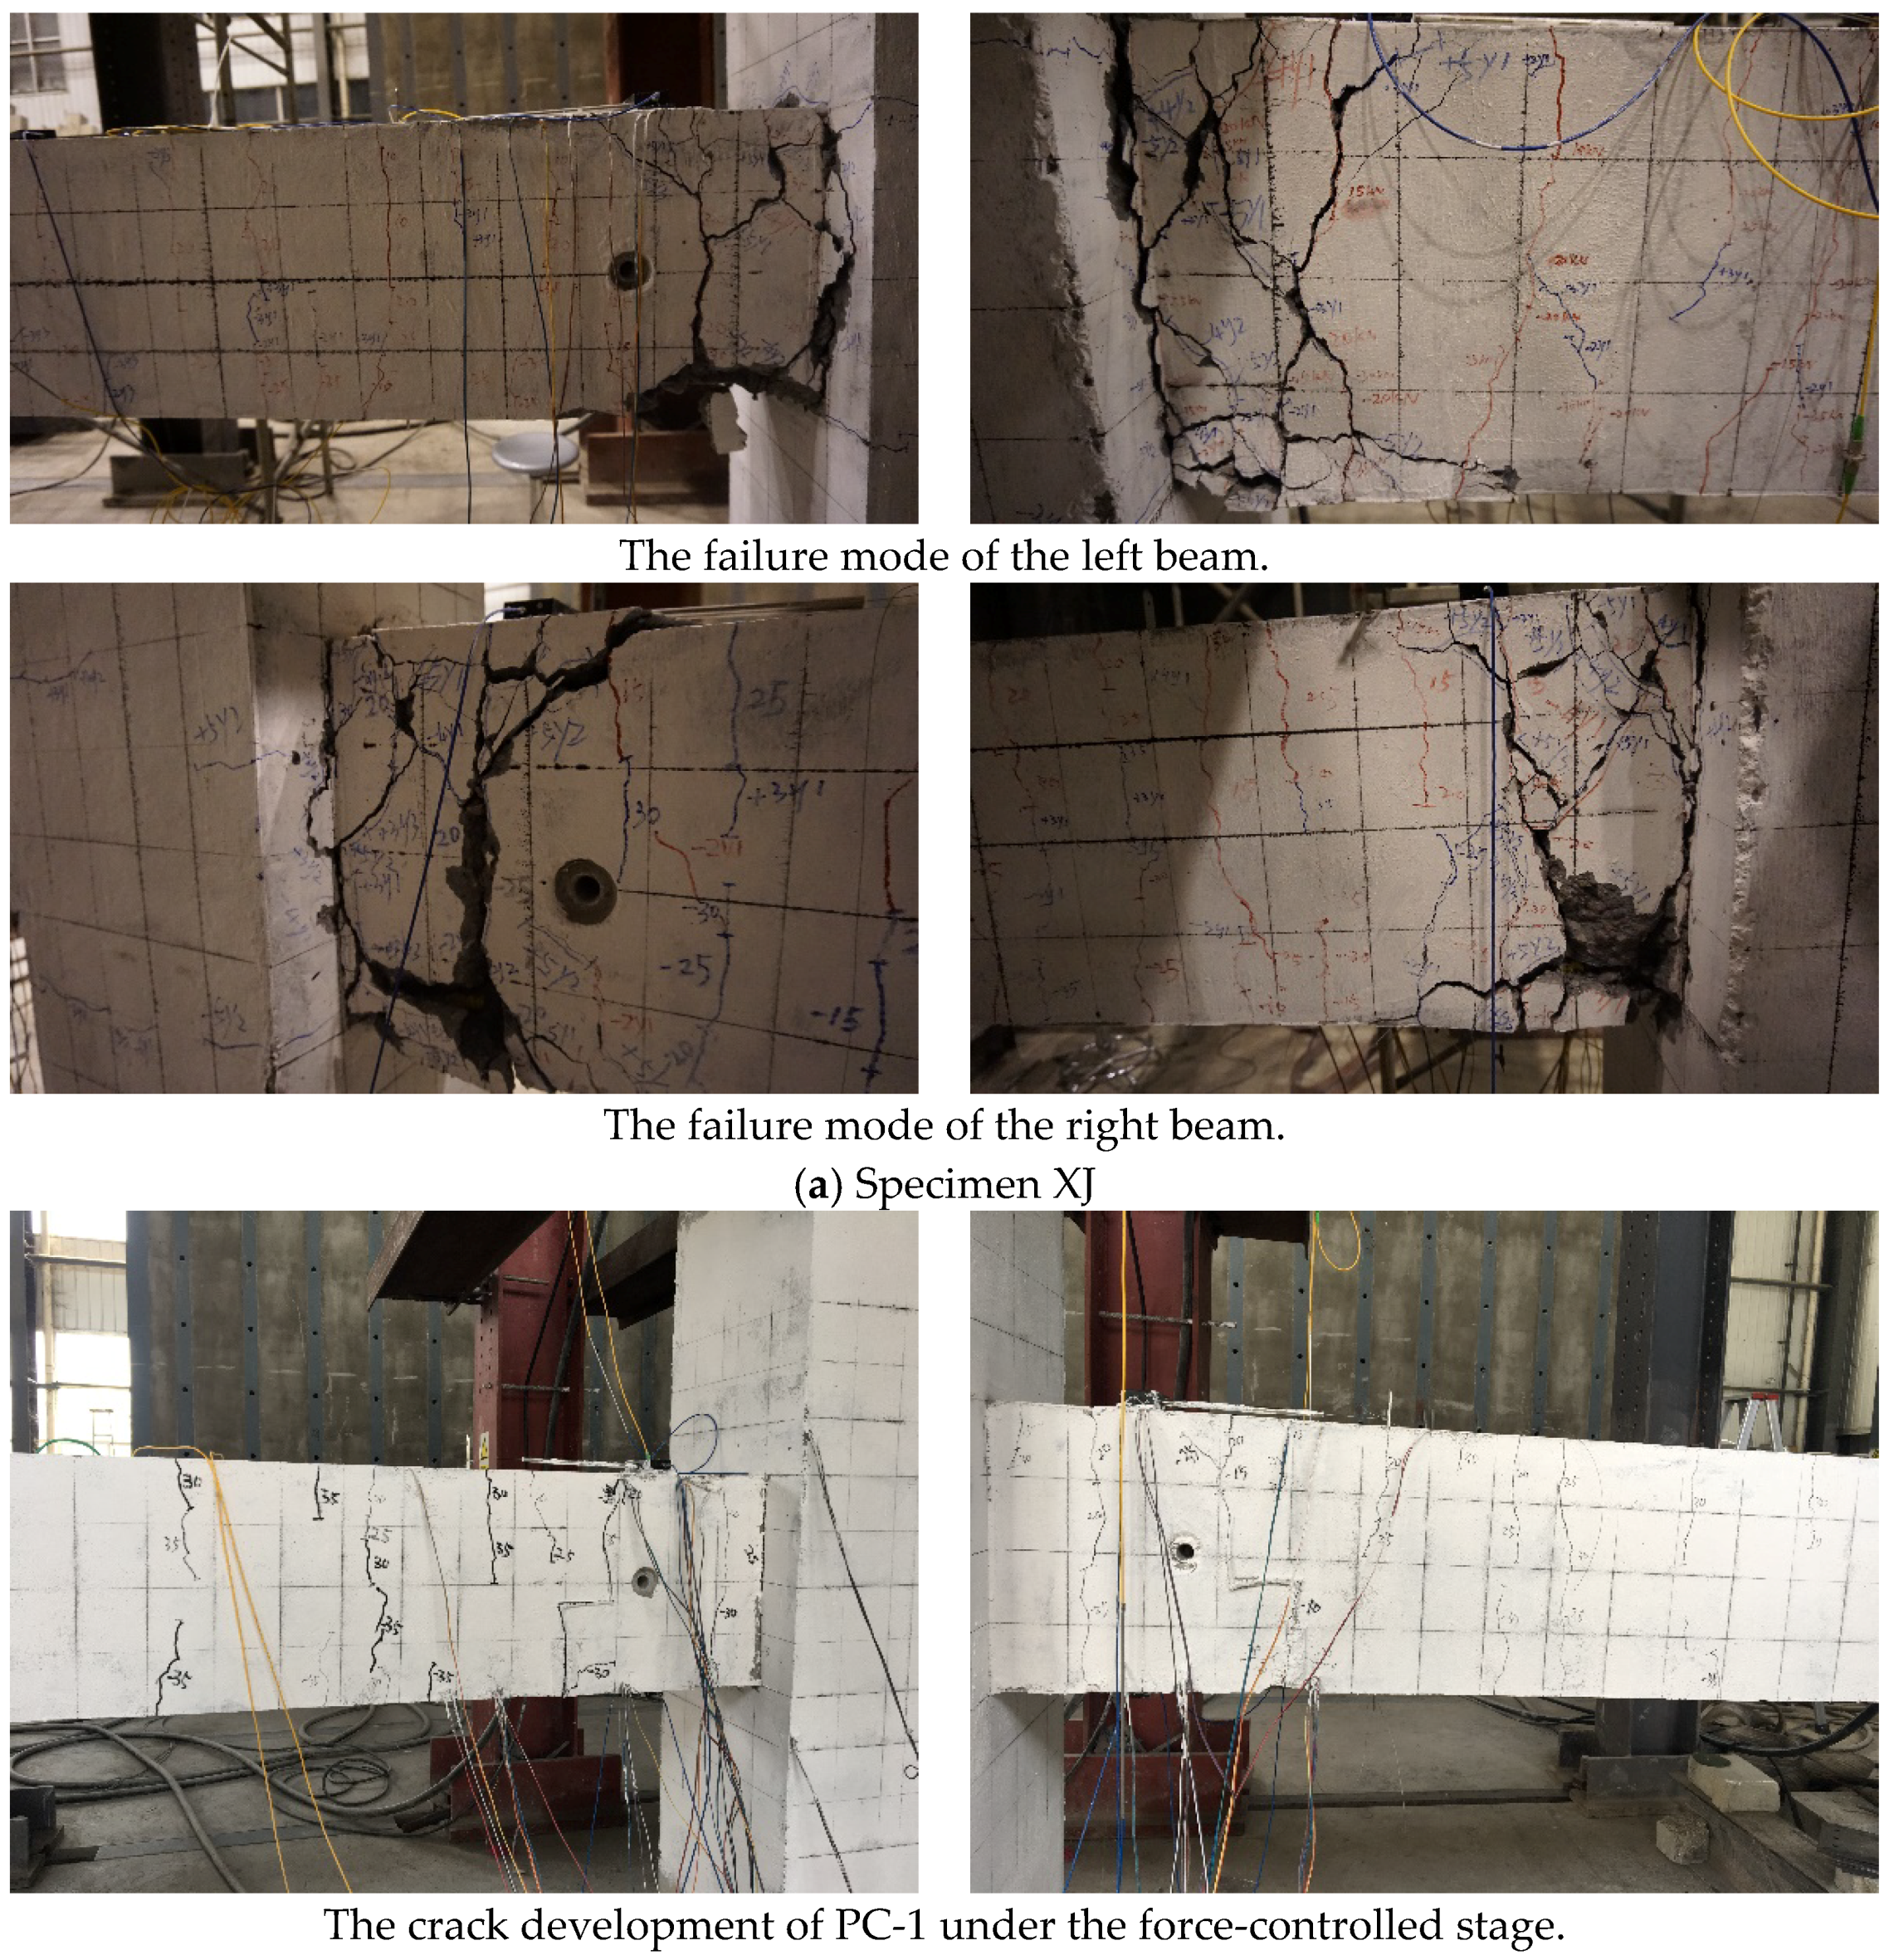
The ultimate failures of the three specimens are shown in
Figure 7. For monolithic specimen XJ, as shown in
Figure 7a, when the load reached 10 kN, the first vertical cracks formed at a distance of 60 mm from the beam end. When the load reached 15 kN, the crack at the beam end was observed. With the increase of load, the vertical crack of the beam end propagated, and new cracks constantly developed at a distance of 350–750 mm from the beam end. When the yielding load was reached, a continuous vertical crack was formed from the top of the beam end to the bottom of the beam end. Shifting to the displacement control stage, the dominant cracks, which were at the beam end, became wider and larger. Meanwhile, the plastic hinges formed gradually at the beam end. When the displacement of the beams reached 4∆y (∆y was the yield displacement), concrete spalling occurred at the end of the beam under compressive load. The specimen reached its ultimate bearing capacity 65 kN with the loading cycle into the 6∆y. When the displacement reached the first cycle of 9∆y (i.e., the load reached 52 kN), the bearing capacity of the beam dropped to 85% of the ultimate bearing capacity. Besides, the beam flexural reinforcement buckled, and the concrete was seriously crushed at the plastic hinge regions. These phenomena indicated that the specimen was damaged. During the whole loading process, cracks were mainly concentrated at a distance of 300 mm from the beam end. Meanwhile, a small quality of cracks was observed at the column core area. The failure mode of specimen XJ was flexural failure at the beam ends, which met the “strong column, weak beam” concept.
For precast specimen PC-1, as seen from
Figure 7b, when the beam suffered a negative load of 15 kN, the first crack formed at the cast-in-place layer, which was above the connection interface. Initially, the earlier tensile cracking of the cast-in-place layer meant that the bolts and part of the concrete bore the tension. It could further explain that the addition of rubber washers between the bolts and steel plates not only increased the deformation at the tension bolts’ position, but also caused the neutral axis to move up. When the load reached 20 kN, the beam-column interface cracked, and the crack along the connection joint propagated from the bottom to the top of the beam. At the beam end, a continuous crack did not form until the displacement reached 4∆y. At the 7∆y displacement, unexpected damage caused by production problems occurred, so the loading on the right beam was stopped before finishing the experiment. PC-1 reached its ultimate bearing capacity 68 kN with the displacement cycle into the 8∆y. The loading on the left beam was continued and, when the displacement reached 9∆y, a significant amount of concrete spalled at the connection joint, exposing the longitudinal rebars and stirrups.
Meanwhile, the loading was stopped at 85% of the ultimate loading (i.e., 51 kN). During the whole loading process, dominant cracks were mainly concentrated at the connection joints, and the plastic hinge also formed around this region. The specimen PC-1 also showed a flexural failure mode. Compared with specimen XJ, however, less cracks were observed at the column core region. This is because the column core region is better protected by transferring the plastic hinge farther from the beam end. Therefore, the failure mode of specimen PC-1 also satisfied the “strong column, weak beam” concept.
As seen from the
Figure 7c, the property of specimen PC-2 was similar to that of specimen PC-1. However, due to the rubber washers in PC-2 being twice as thick as those in PC-1, the deformation of the tension bolts’ position was larger. The first crack formed at the same position as PC-1 when the load reached 10 kN. The development of dominant cracks and the formation of plastic hinges were in the same place as PC-1. The cracks were more widely distributed on the beam, which was more than 1000 mm from the column face. When the displacement reached 7∆y, PC-2 reached its ultimate bearing capacity of 61 kN. Due to the rebars being weakened too much by tapping, brittle fracture happened when the displacement reached 8∆y. Therefore, the loading on the left beam was stopped. Similarly, this specimen was also destroyed in a flexural failure, and the experiment was stopped at 9∆y (i.e., at 47 kN). Compared with specimen XJ and PC-1, however, the continuous crack at the beam end did not form until the experiment finished, and no observed cracks and damages occurred at the column core region. It could be concluded that PC-2 more satisfied the “strong column, weak beam” concept.
Comparing the three specimens, some significant conclusions could be drawn. Firstly, the position of plastic hinges was different. The rubber washers between the bolts and steel plates excessively weakened the initial stiffness of the connection regions in PC-1 and PC-2. So, the plastic hinge of XJ was within 300 mm from the beam end, while that of PC-1 and PC-2 was at a distance of 200–500 mm from the beam end. For PC-1 and PC-2, the plastic hinges led to a smaller bending moment to be transferred to the end of the beam, so the cracks at the column core region and the beam end decreased. Compared with PC-2 and PC-1, with the thickness of the rubber washers being increased, the damages of the column core region were less. The column core region was better protected, which meant the integrity of the precast specimens was better than the monolithic one. Therefore, this implied that PC-1 and PC-2 had more satisfied the “strong column, weak beam” concept. Secondly, specimens PC-1 and PC-2 had almost the same ultimate bearing and deformation capacity as specimen XJ, which implied the precast specimens reach the same strength requirements as specimen XJ. Thirdly, the load of the first crack in PC-2 (10 kN) was lower than that of PC-1 (15 kN).
The rubber washer in PC-2 was twice as thick as the one in PC-1, so it could compress more easily under the same load. Finally, for specimen PC-1 and PC-2, due to the dominant damage developed at the joint connection region, the connectors, such as bolts and flexible layers, were more easy to remove. In other words, PC-1 and PC-2 showed the advantages of detachable precast specimens after the structure was damaged by an earthquake.
4.2. Hysteretic Behavior
The hysteretic curves can help to study the mechanical properties and seismic performance of specimens such as bearing capacity, energy dissipation capacity and stiffness degradation [
26].
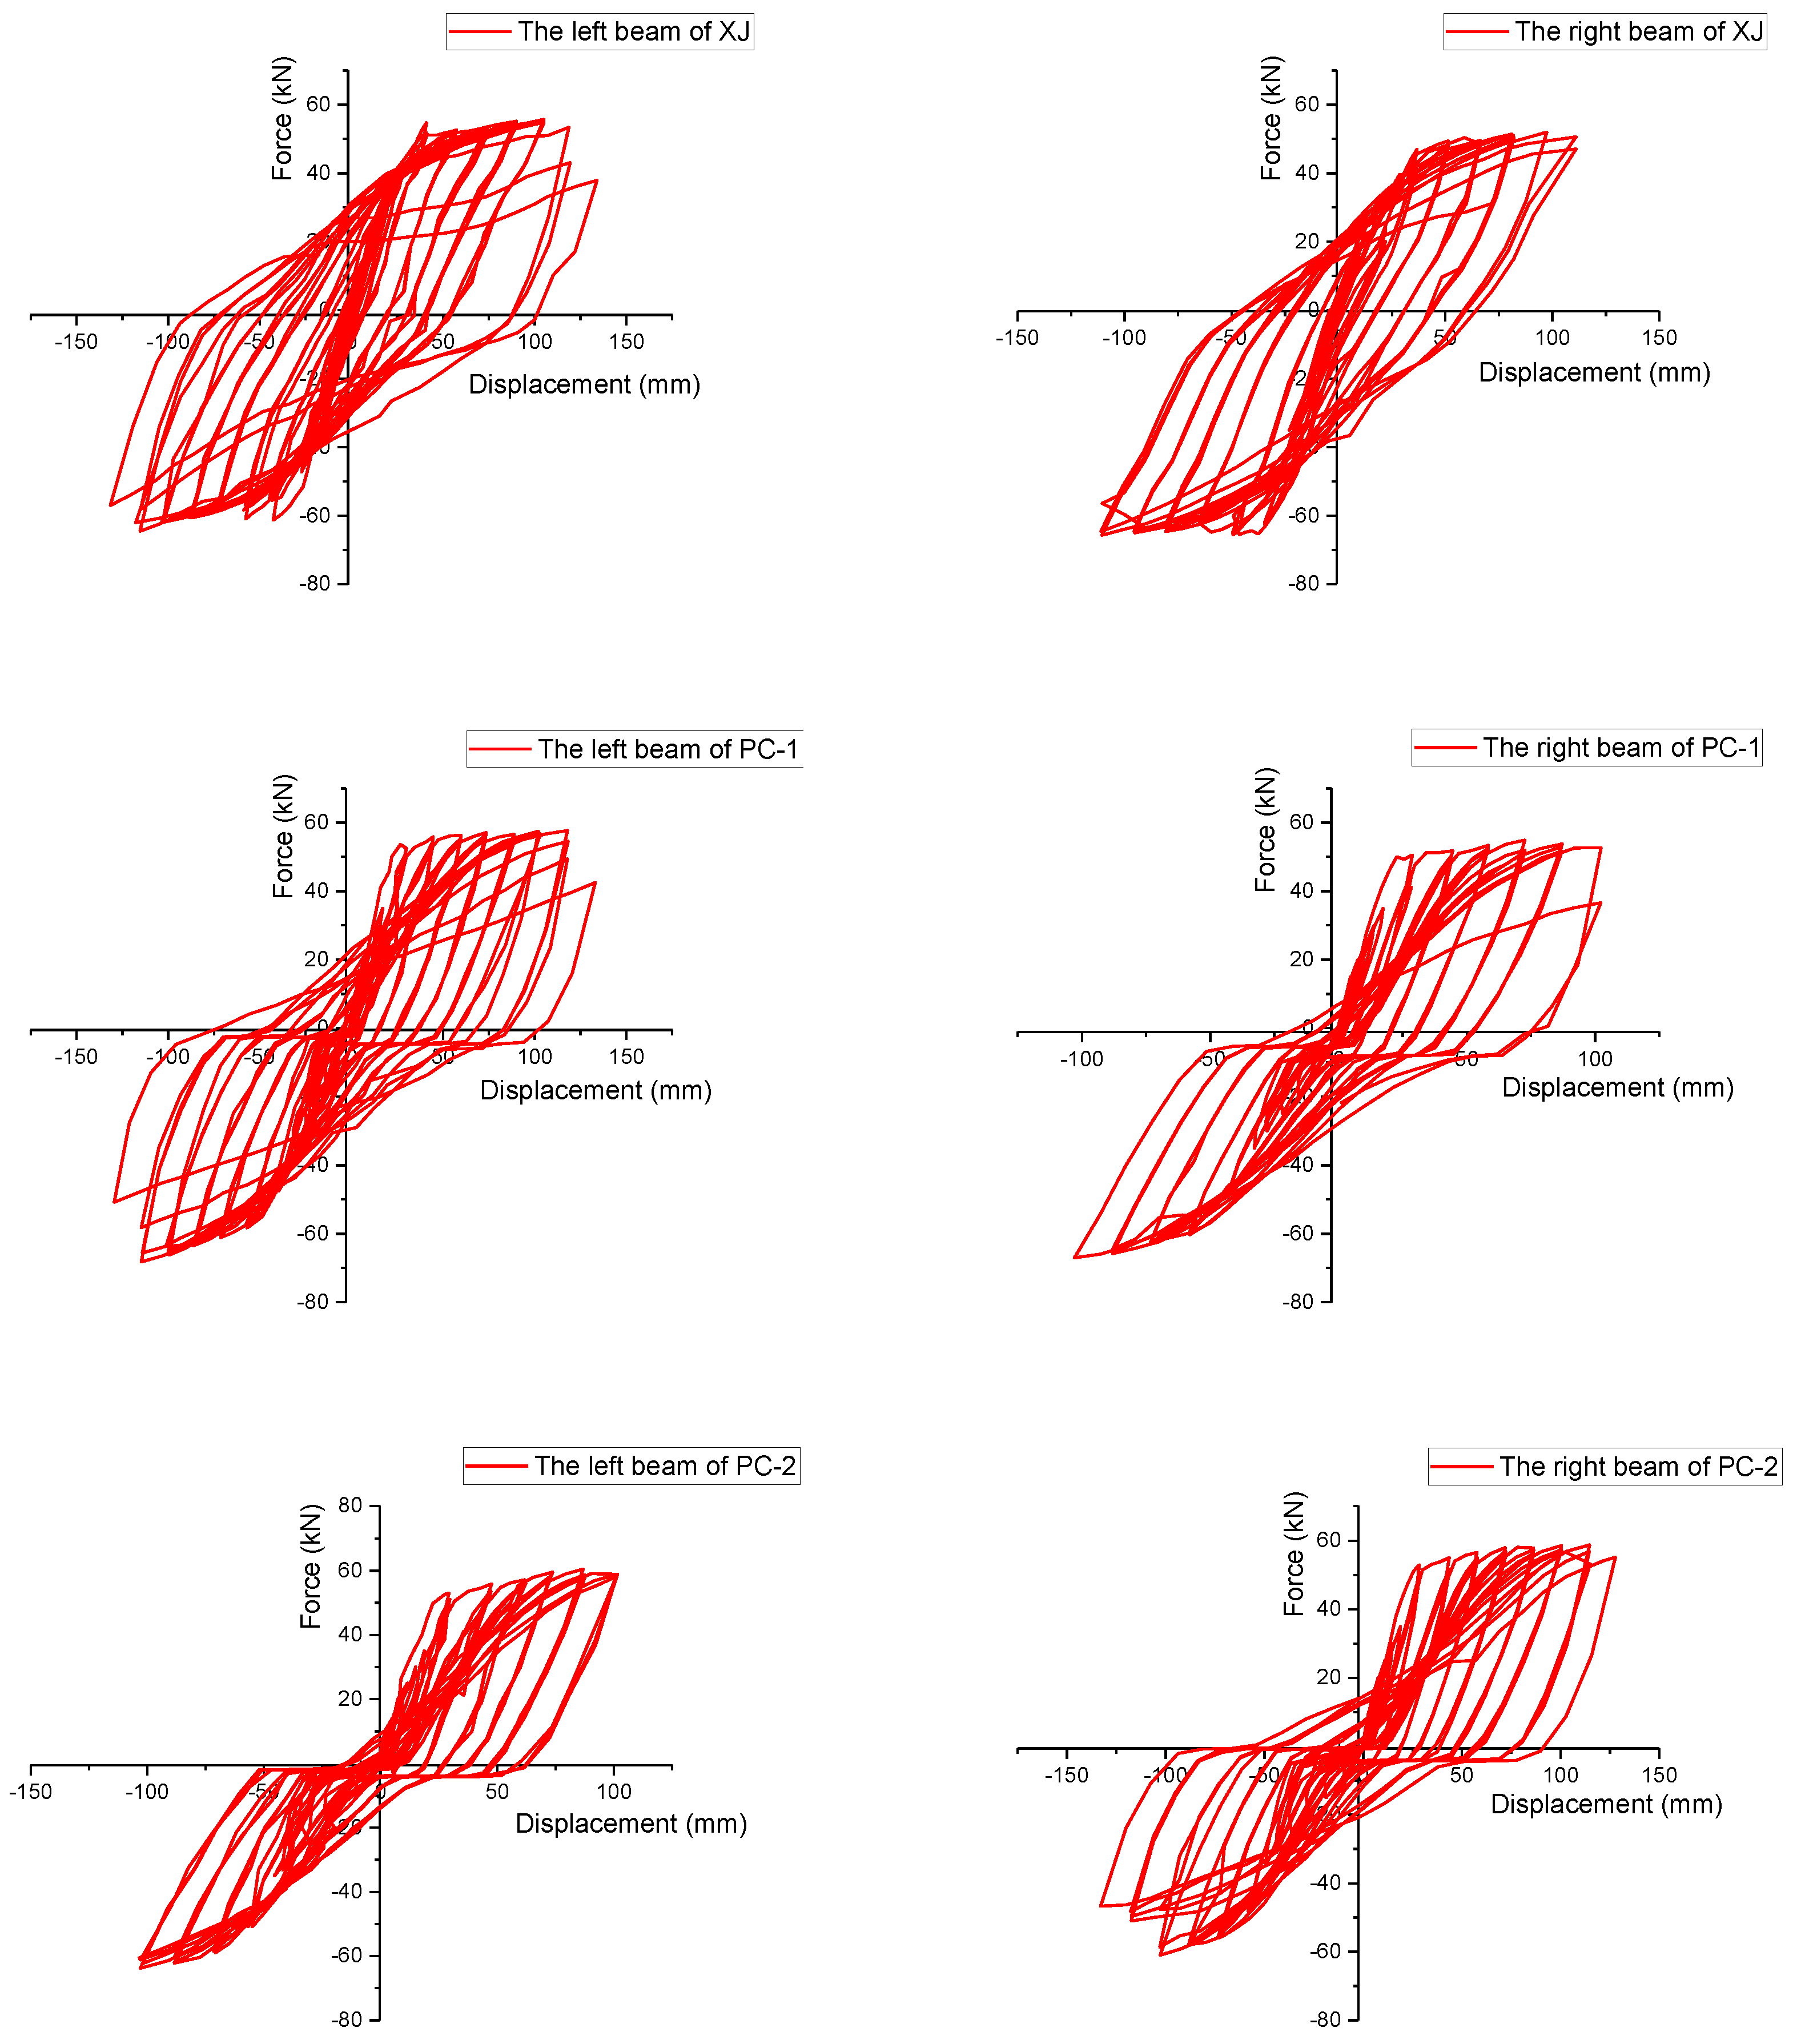
Figure 8 presents the hysteretic curves of the three specimens. The downwards load was defined as the positive load, and the upwards load was defined as the negative load.
Comparing the three specimens, according to
Figure 8, the hysteretic loop of specimen XJ was fuller than PC-1 and PC-2. This phenomenon indicated that the energy dissipation capacity of PC-1 and PC-2 were poorer than the monolithic specimen XJ. When a negative load applied to the beam, the initial slippage increased more rapidly.
This was owed to the fact that the rubber washers between the bolts and steel plates would deform greatly under a small load at the early stage of loading. Thus, the initial shrinkage phenomenon of precast specimens PC-1 and PC-2 was obvious. After the specimens entered the elastoplastic stage, the slippage of PC-1 and PC-2 was smaller than in the initial stage. This is because the rubber washer was compressed so thin that the elastic modulus thereof was close to that of the concrete. Compared with the specimen XJ, the hysteretic hoop areas of PC-1 and PC-2 were smaller. This implies that the energy-dissipating capacity of precast specimens with rubber washers is poorer than the monolithic specimen. For the precast specimens, due to a manufacturing error, the right beam of PC-1 and the left beam of PC-2 were stopped before the test completed. Compared to the left beam of PC-1, the hysteretic hoop areas of PC-1 were smaller. It indicated that with the thickness of the rubber washers increased, the energy consumption of the beam became worse.
Comparing the hysteresis curve of the three specimens, the shrinkage in specimen PC-2 is more obvious than specimen PC-1 and XJ. And with the thickness of the rubbers increases, the area of the hysteresis hoop became smaller. These phenomenon indicated that the energy dissipation is slightly reduced by adding rubbers at the connection joint. Due to the early extent of cracks along the connection interface, the compression area at the top of the beam decreased, and the deformation of the concrete was large. Meanwhile, the rubber washer was bound to be extruded out of shape by bolts and steel plates, which was the main reason for the hysteresis curve pinching. Furthermore, it was obvious that the slippage of the connection joint of specimen PC-2 was larger than PC-1 because the rubber cushions in PC-2 were twice as thick as PC-1. Although the energy dissipation capacity of the precast specimen was poor, the precast specimens PC-1 and PC-2 can satisfy the seismic performance.
4.3. Skeleton Curve
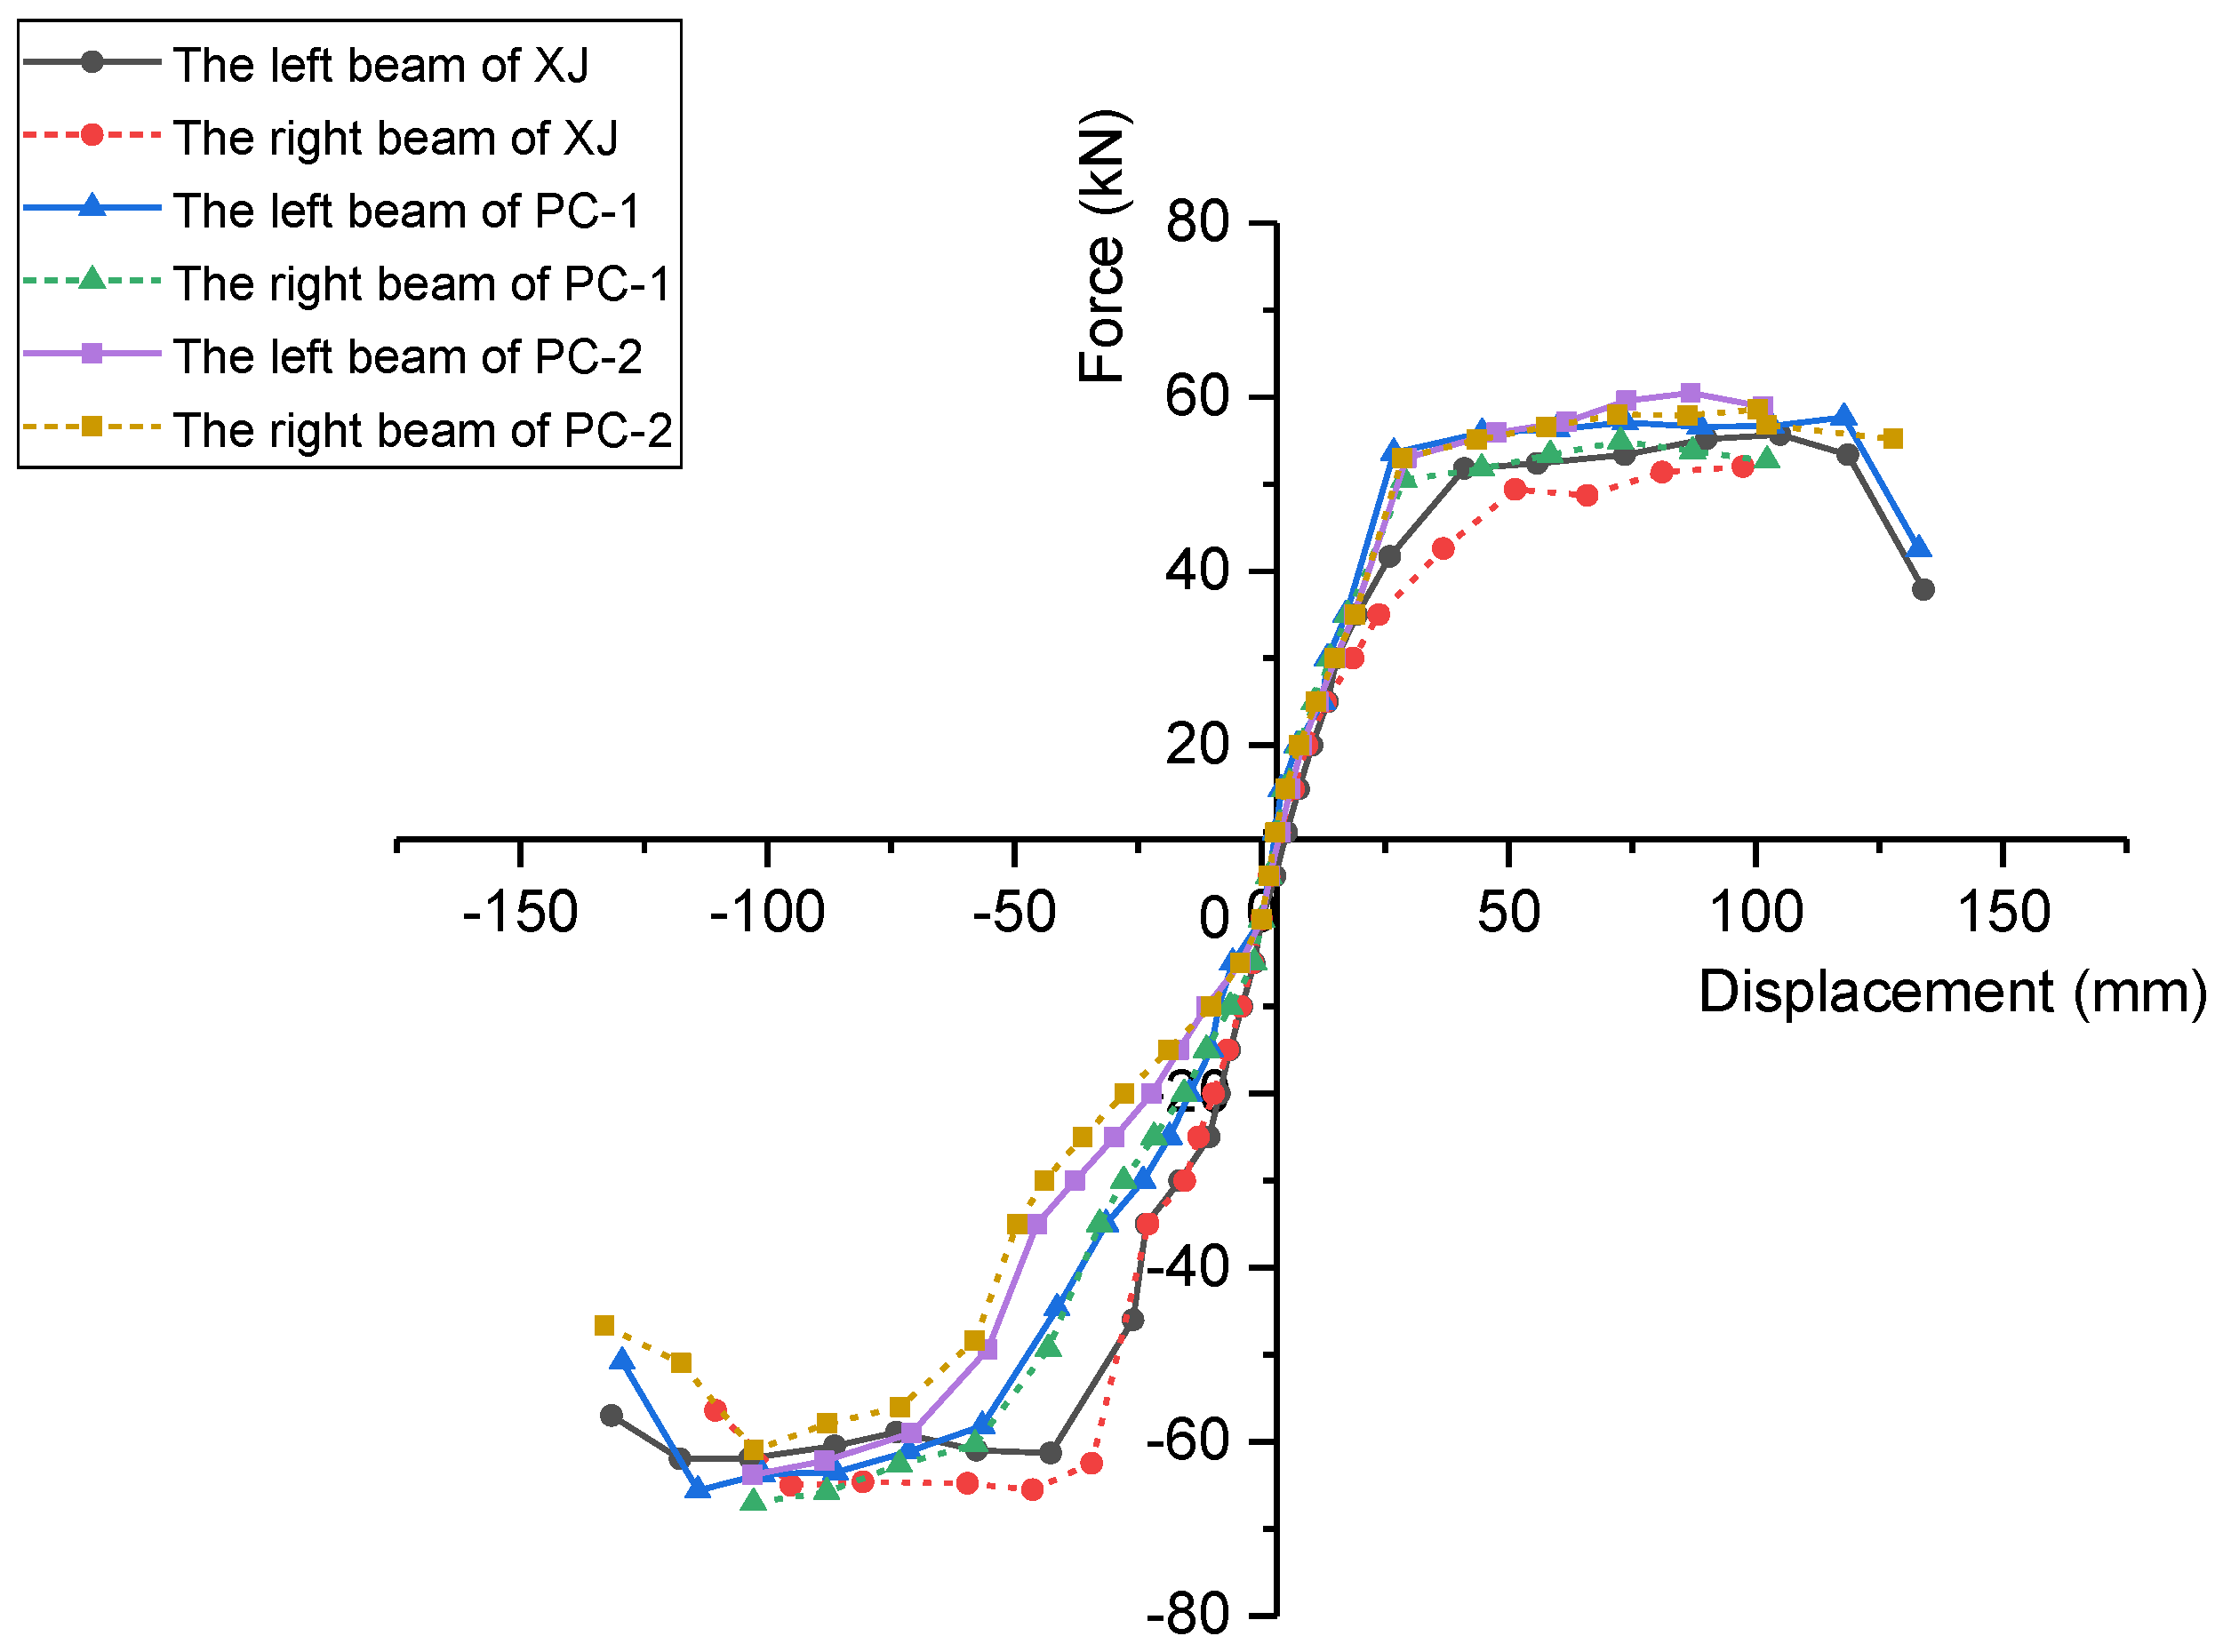
The skeleton curves of three specimens were presented in
Figure 9, which was the envelope of hysteresis curves.
Some conclusions can be drawn according to
Figure 9. The skeleton curve trend of the three specimens is similar. However, compared with the three specimens under the negative load, the stiffness of precast specimens was obviously lower than specimen XJ before the displacement reached 75 mm. This is due to a larger compression in the precast joint region caused by the rubber washers than the monolithic joint. The rubber washer in PC-2 (4 mm) is twice the thickness than that in PC-1 (2 mm), which means that the joint region in PC-2 can be compressed more than PC-1. Therefore, the stiffness of PC-1 is slightly higher than PC-2 under the same stage. This phenomenon indicates that increasing the thickness of the rubber washer could reduce the stiffness of the specimens. It achieves the target to control the stiffness of beams by adding a different thickness of the rubber washer. It is obvious that the ultimate bearing capacity and the ultimate displacement of the three specimens are almost the same.
4.4. Stiffness Degradation
Under the reversed cyclic loading, the cumulative internal damage of the structure will gradually increase, which causes the stiffness to decrease. Stiffness degradation is a vital factor in assessing the seismic behavior of a structure [
30].
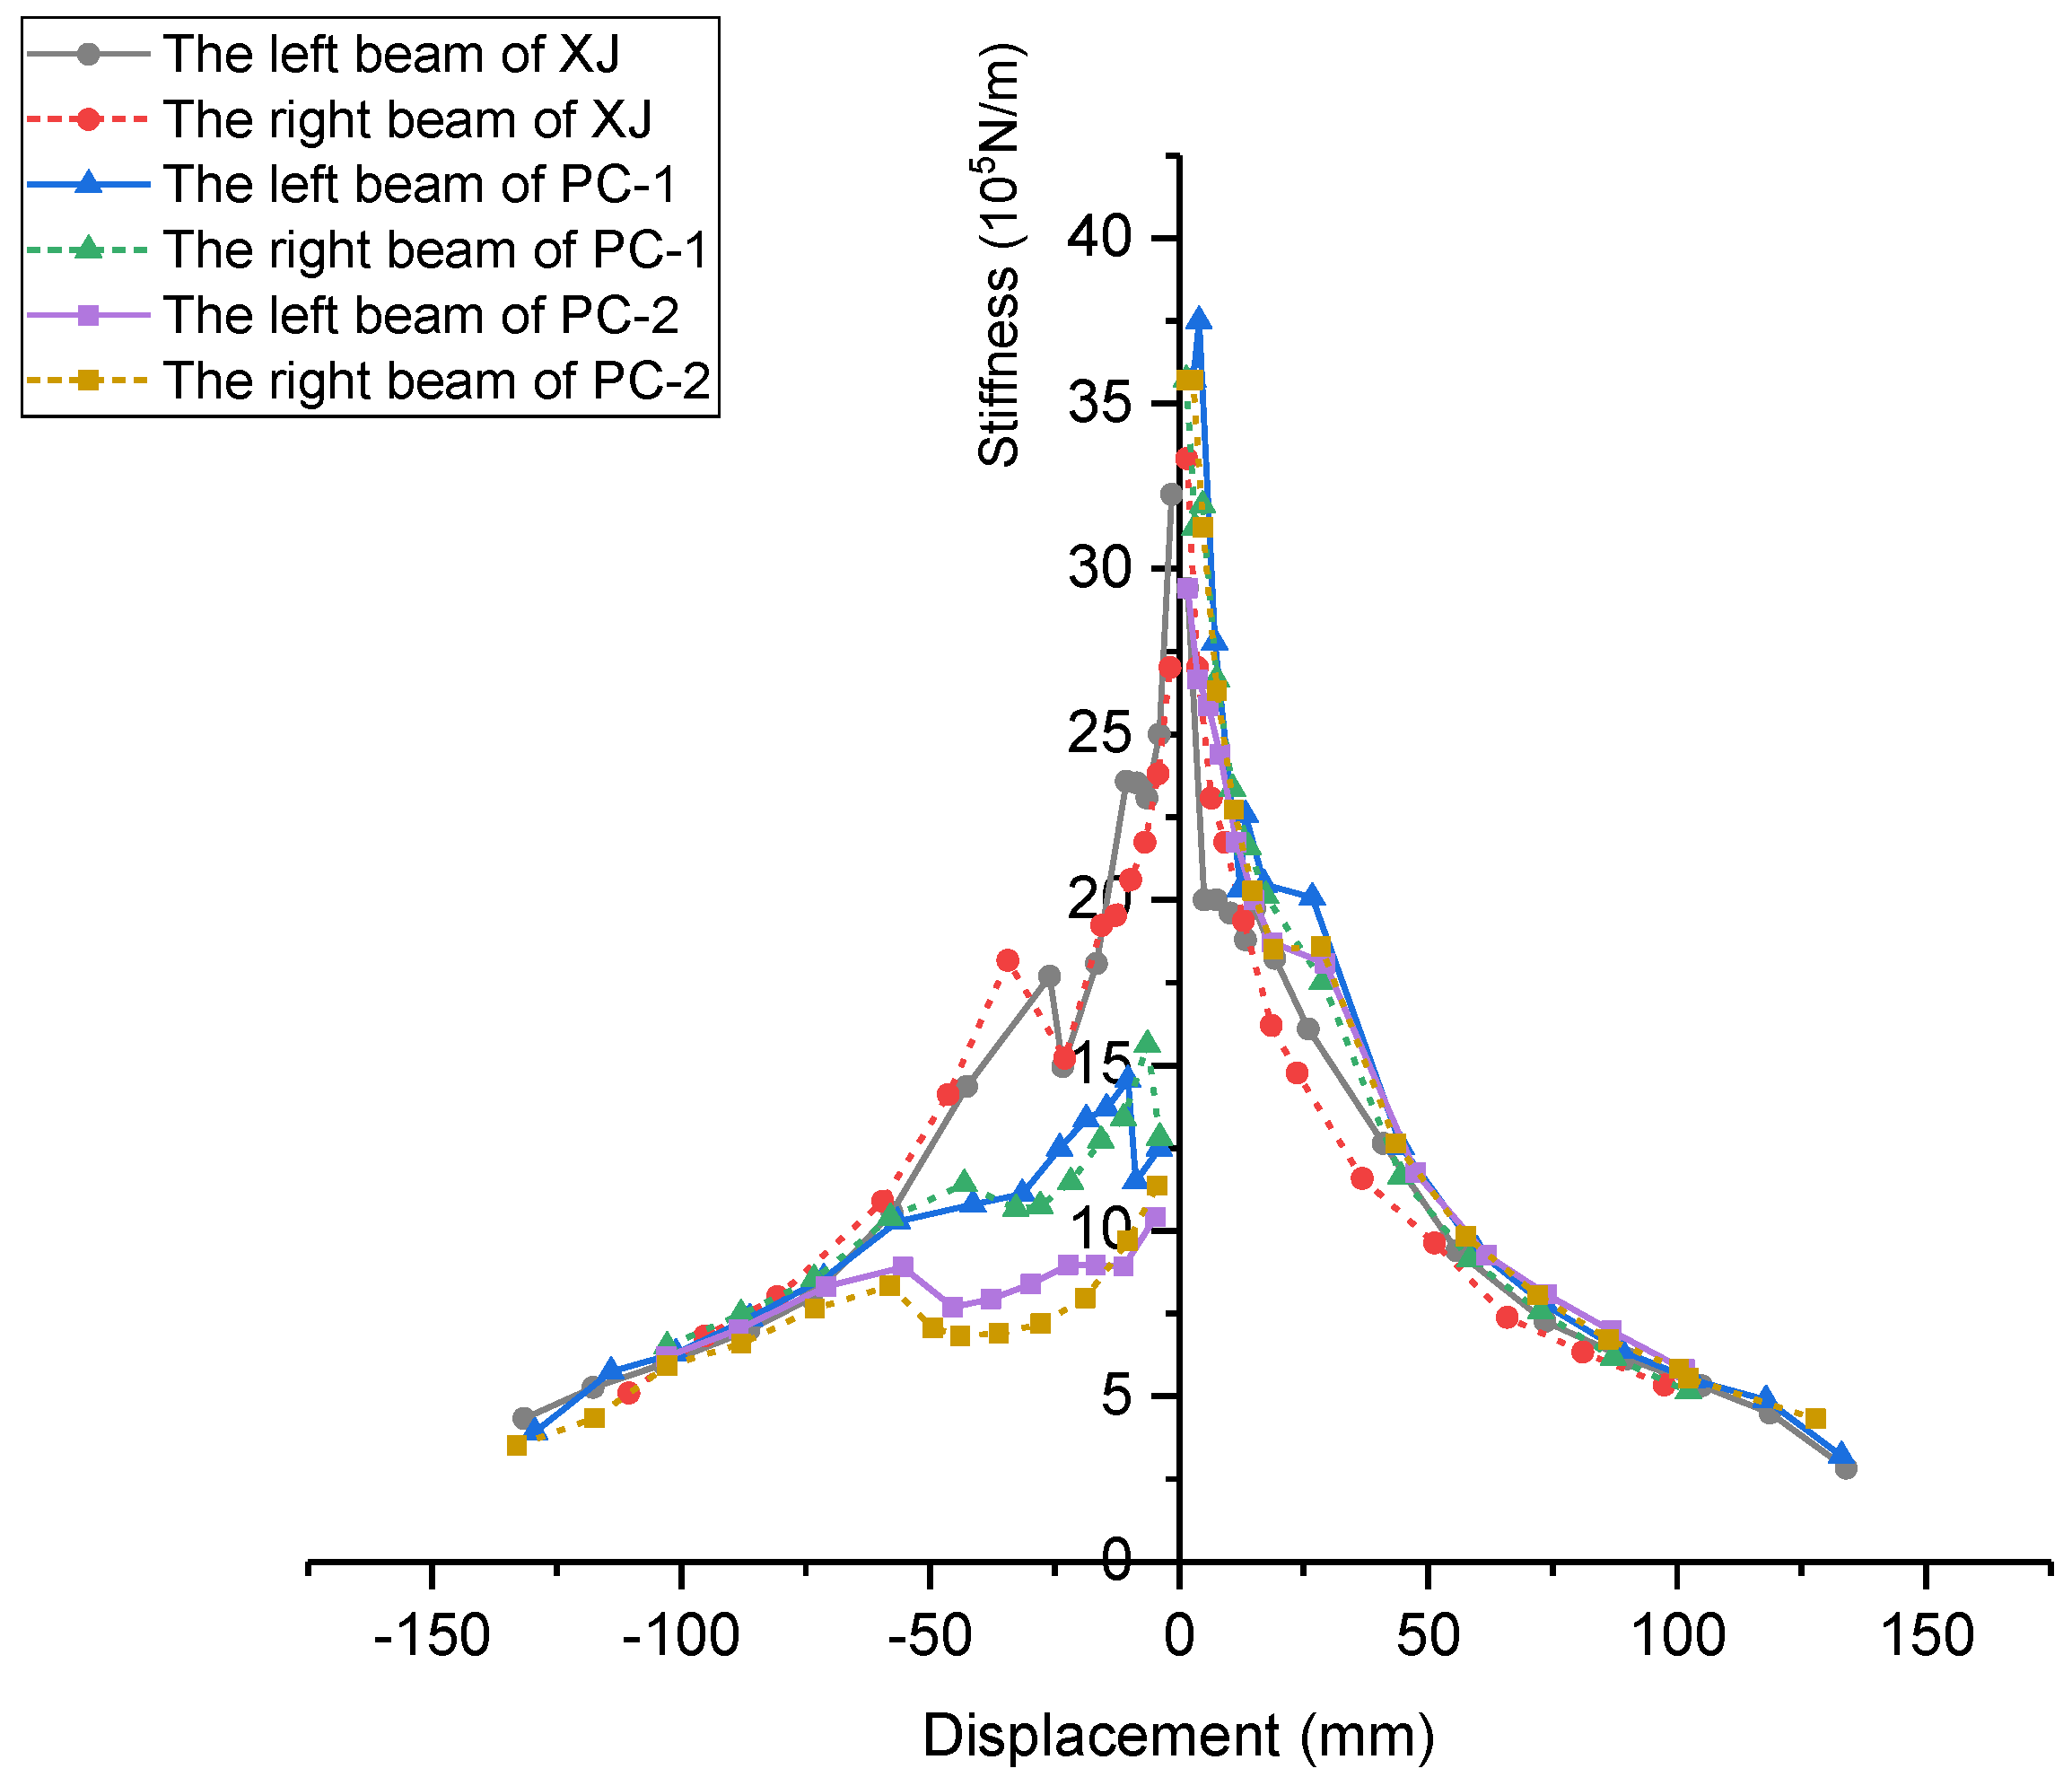
Figure 10 depicts the curves of the stiffness degradation of the three specimens.
As for the positive loading, the stiffness of PC-1 and PC-2 remain basically the same in the whole test process. As for the negative loading,
Figure 10 demonstrates that the initial stiffness of PC-1 and PC-2 are decreased by 61% and 65% compared with XJ. As the experiment goes on, however, the negative stiffness of the three specimens gradually tends to be the same. This phenomenon of inconsistent negative stiffness is because the rubber washers decrease the connection area stiffness. At the early stage of loading, the initial elasticity modulus of the rubber washers is far less than that of concrete, so the deformation of the precast connection area is larger than the monolithic one. When the rubber washers are extruded extremely thin, the elasticity modulus of this material is about the same as concrete. As a result, the later stiffness of precast specimens is greatly close to the monolithic one.
Comparing the specimen PC-1 and PC-2, the initial stiffness of PC-1 is slightly larger than that of PC-2. This is because the rubber washers in PC-1 (2 mm) are half as thick as in PC-2 (4 mm). The thicker the rubber washers, the larger the compression needed to reach the same elastic modulus to that of concrete. According to the stiffness degradation in
Figure 10, it can be apparently known that the rubber washers between the steel plates and bolts can effectively decrease the initial stiffness, and with the rubber thickness increase, the stiffness will further decrease.
4.5. Ductility and Energy Dissipation Capacity
Ductility is a significant factor in seismic behavior to avoid brittle failure. Ductility of structure refers to the capacity to undergo inelastic deformation without significant decrease in bearing capacity, and can be measured by the ductility factor. The ductility factor μ in the study can be expressed by the equation:
where ∆u is the ultimate displacement; and ∆y is the yield displacement. Then, ductility factors of the three specimens and the ultimate bearing capacities were compared in
Table 4. (where
Pmax is the ultimate load of the specimen in the first list;
Pxj is the ultimate load of specimen XJ)
It can be seen from
Table 4 that the yield displacement of precast specimens has a significant difference under positive and negative loading. The yield displacement of the three specimens in the positive loading is similar. However, the yield displacement of the precast specimens under negative load is larger than that of specimen XJ. Compared with specimen XJ and PC-1, the yield displacement of PC-1 is about 30 mm larger than that of XJ. It means that at this stage the 2 mm thick rubber washer in PC-1 is compressed until the elasticity modulus of the rubber is close to that of the concrete. Besides, compared with PC-2 and PC-1, when the rubber washers get higher, the yield displacement of PC-2 is larger than the PC-1. Furthermore, on the premise of the same bearing capacity under negative load, for the three specimens, the ductility of PC-1 and PC-2 was poorer than the monolithic one. Due to a manufacturing error, the load on the right beam of PC-1 and the left beam of PC-2 were stopped earlier than another ends.
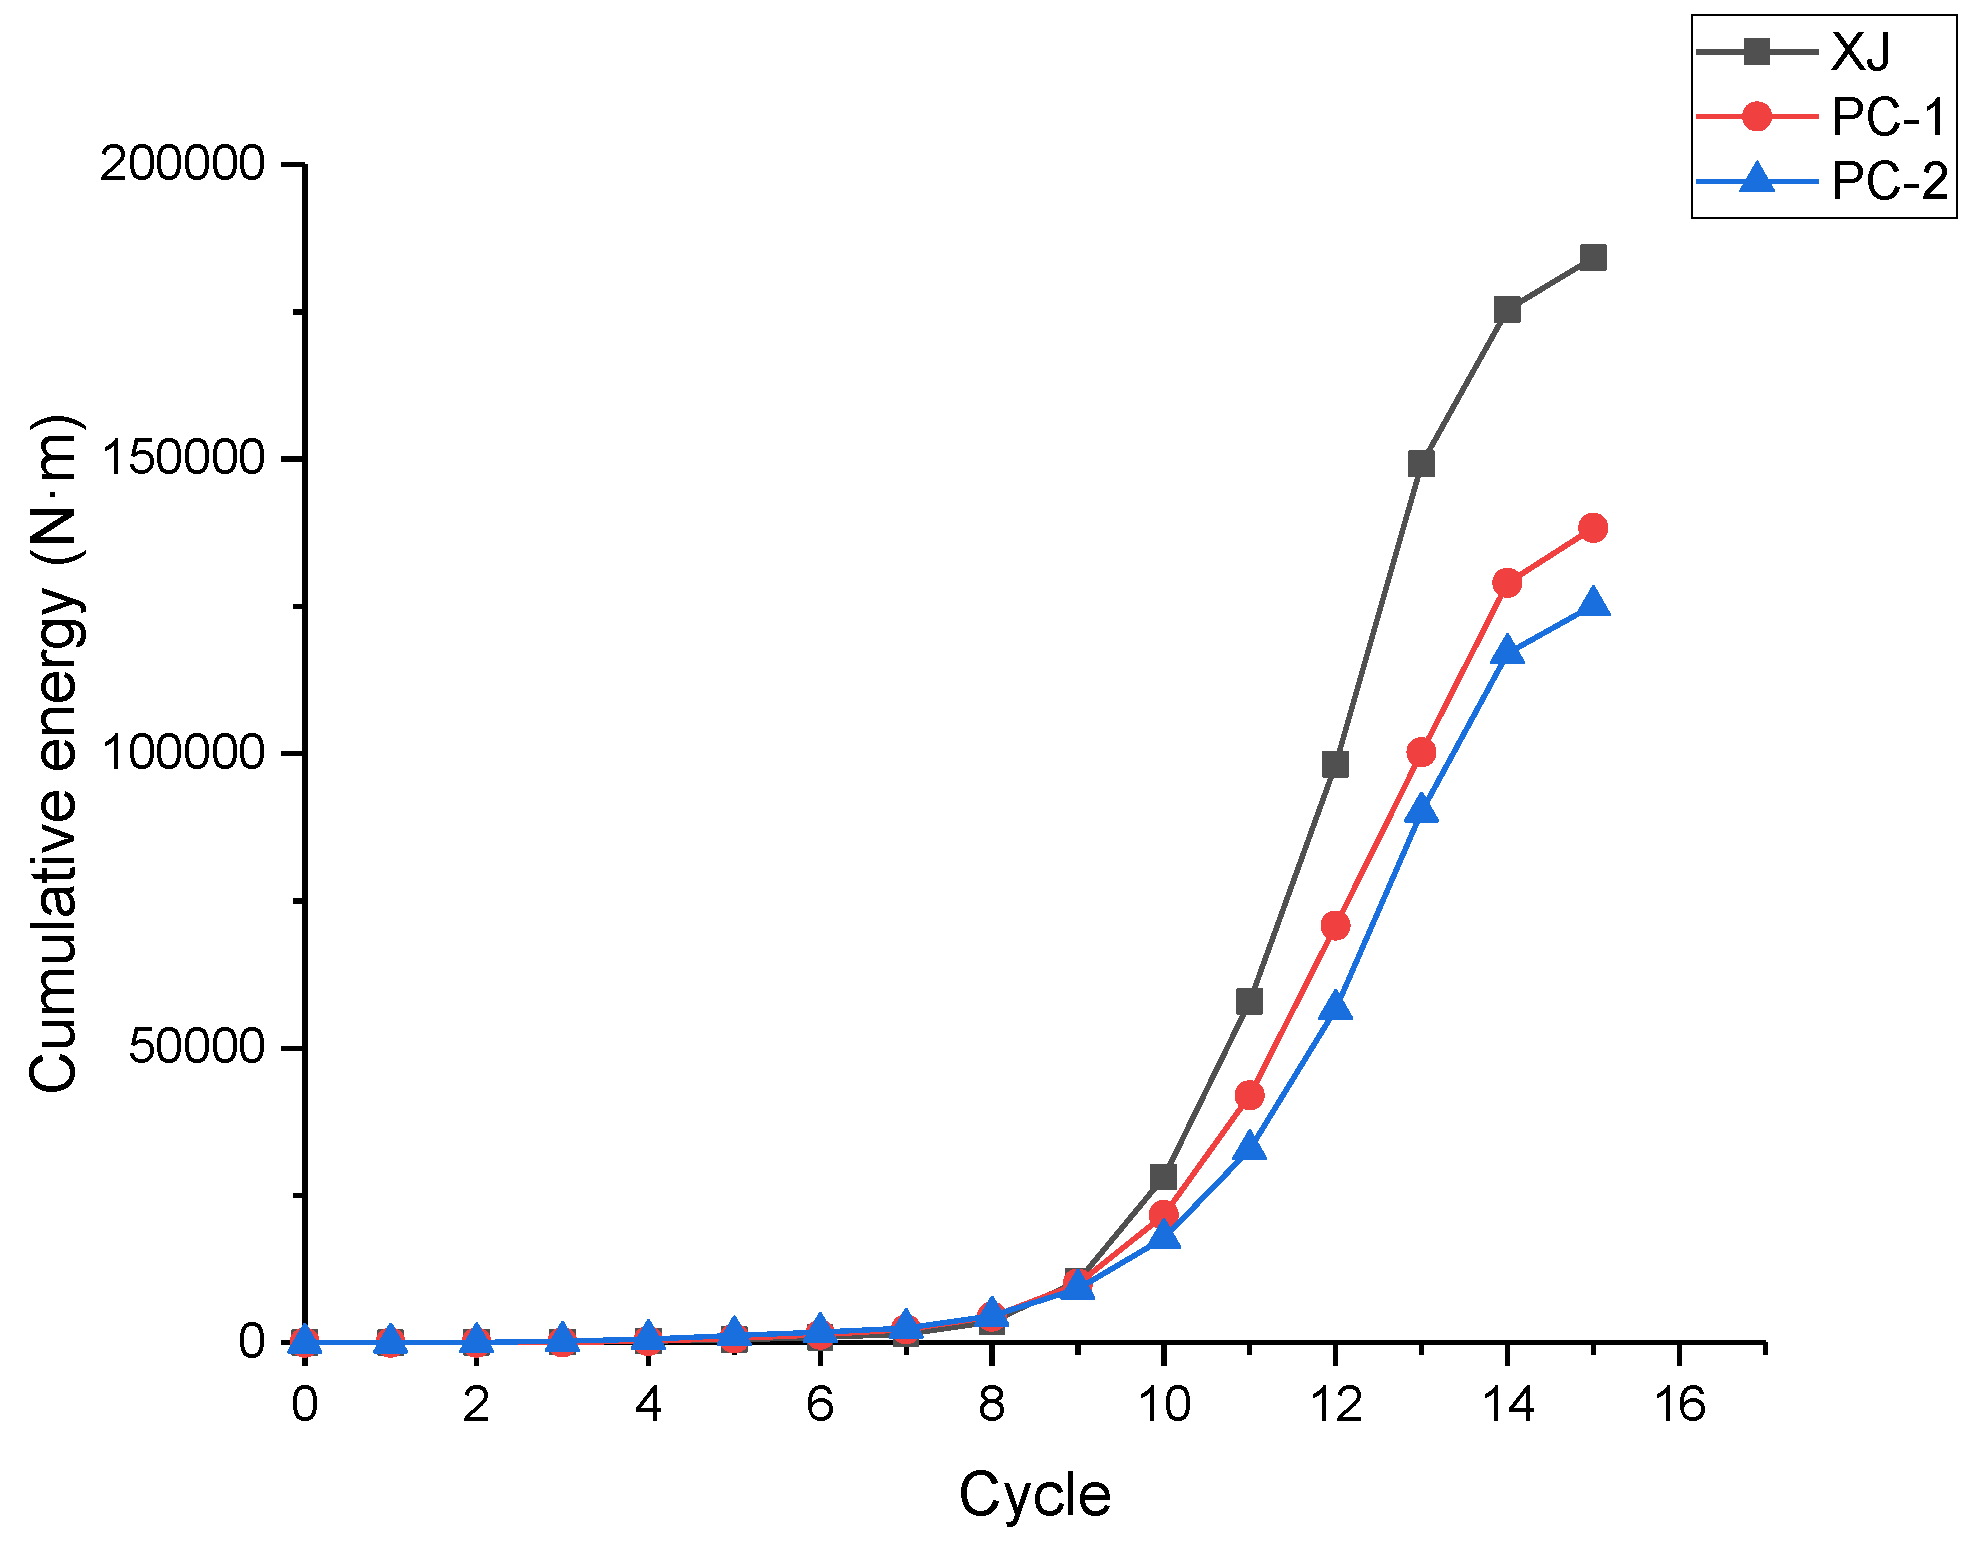
The energy dissipation is another important index in studying the seismic behavior of a structure. The cumulative dissipated energy of each specimen is calculated in
Figure 11. The energy dissipations of precast specimens PC-1 and PC-2 were lower than those of specimen XJ. This is because the rubber washers in the precast joint are not an effective energy dissipating element. Poor energy dissipation capacity is harmful to the seismic performance of buildings. Therefore, for buildings with high energy consumption requirements, rubber layers should be avoided. and other high-performance materials can be used, such as: Elastic fiber, glass fiber and so on.
Furthermore, due to the rubber washers in PC-2 being twice as thick as PC-1, the cumulative dissipated energy of PC-2 is slightly lower than that of PC-1. It could be perceived from
Figure 11 that the trend of the cumulative energy dissipation of the specimens slowed down at the load case 13 and 14, because one part of the beam is damaged earlier before the test finish.
5. Discussion
According to the analyses mentioned above, the rubber washers (flexible layers) between the bolts and steel plates obviously decreased the initial stiffness of precast specimens (61% in PC-1, and 65% in PC-2). This phenomenon was not remarkable after entering the plastic stage. The stiffness of the joint region plays a vital role in adjusting the stiffness of the beam. To build a set of formulae of the novel joint region with different thickness of rubber washer, a computing method about the joint region’s stiffness is discussed. However, due to the joint region having different stiffness from other parts of the beam, the stiffness calculation of the whole precast beam is complex. Therefore, a stiffness equivalent method to simplify the stiffness calculation of the beam is proposed next.
5.1. Stiffness of Semi-Rigid Joints
In the elastic stage, this method requires the following assumptions [
31]:
- (1)
Linear distribution of strains over the depth of the section;
- (2)
The deformation satisfies the small elastic deformation and equilibrium cross-section assumption;
- (3)
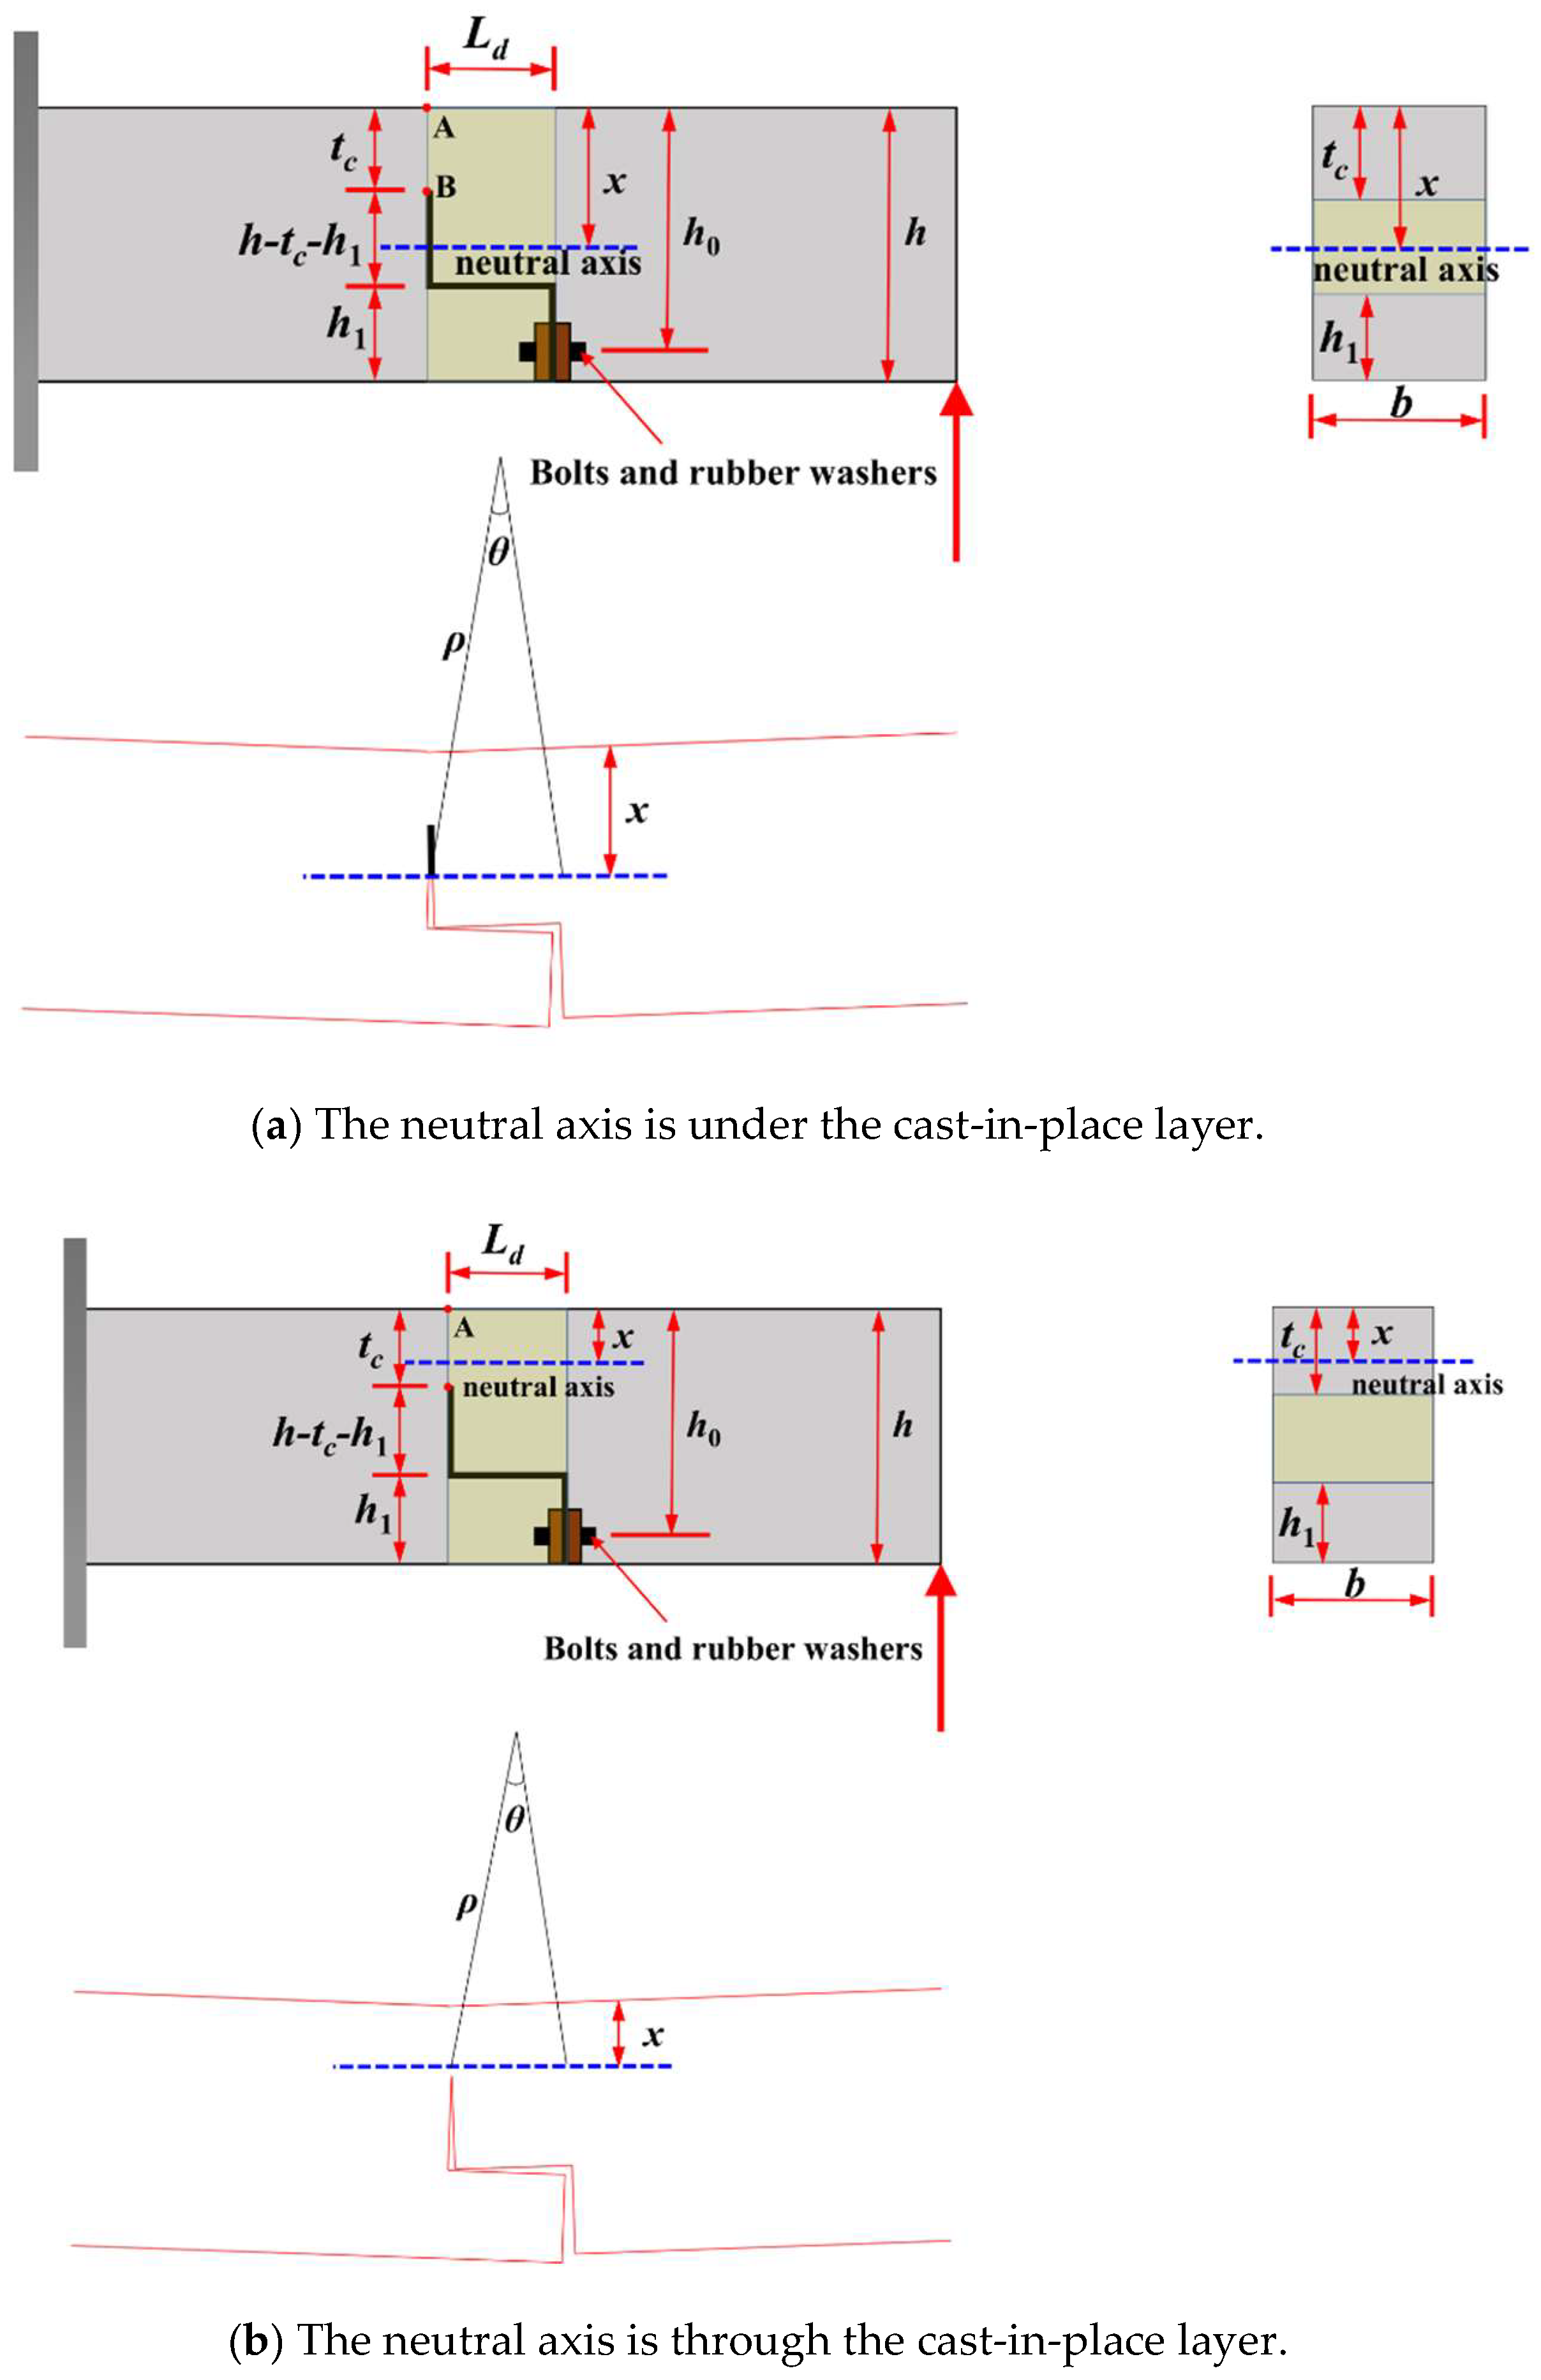
the length of the semi-rigid joint
is from the start of the stepped corbel part to the end of it (as depicted in
Figure 12a). Within this section, the radius of curvature is constant.
- (4)
In the elastic stage, the strain of rubber washers is much larger than that of bolts, so the strain of bolts can be ignored.
According to the force equilibrium, the pressure on rubber washers is equal to the tension on the bolts. As shown in
Figure 12a,b, depending on the different location of the neutral axis, the calculation about the joint region can be divided into two cases. In the first case, as shown in
Figure 12a, the neutral axis is assumed to be under the cast-in-place layer, which implies the cast-in-place layer is compressed. Whereas, the neutral axis in the
Figure 12b is through the cast-in-place layer, which means the lower part of the monolithic layer is under tension. Then
and
are the height and thickness of the section;
is the height from the bolts position to the top of the beam, and
is the height of the step. The thickness of cast-in-place layer is
, and
represents the average radius of curvature in the length of the
part.
and
are the elastic modulus of the concrete and the rubber washer, respectively.
As can be seen from
Figure 12a, the first case is as follows:
From force equilibrium:
where,
stand for the pressure on the concrete; the
is the tension on bolts (
can be replaced by the pressure on the rubber washer
). The Equation (2) can be represented by
Then, the Equation (3) can be represented by:
In this equation, can be calculated based on and ; so ; and ; represents the thickness of the rubber washer; is the average angel of the section, .
The height of the compression zone
can be obtained by the following equations
where,
is the cross-sectional area of rubber washer;
is the number of the rubber washers.
Then, the compression region
x can be obtained as follow:
Finally, the moment of inertia
at length
can be obtained:
As for the
Figure 12b, the second case has the similar calculation process as the first case in
Figure 12a. However, the tensile stress of concrete should be considered in the calculation of second case.
The force equilibrium is:
where,
is the tension on the concrete.
Similarity, a same moment of inertia at length as (7) can be obtained.
According to the size of the three specimens, the exact value of
and
is calculated in the
Table 5. Then, the stiffness
of the precast specimens and the stiffness
of the monolithic specimen can be easily obtained. Furthermore, the ratio of
and
can be calculated in the last column of
Table 5. The formula shows that the initial stiffness of precast specimens is just 38% of the cast-in-place specimen. This result means that the initial stiffness of precast specimens has been decreased 62% compared with the monolithic one. Obviously, as shown in
Figure 10, the actual stiffness of PC-1 and PC-2 decrease 61% and 65% respectively, which is close to the calculation result. Therefore, the computing method is acceptable. (
is the moment of inertia of the monolithic part and the cast-in-place specimen)
5.2. Discussion on the Simplified Calculation Method of Beam Stiffness
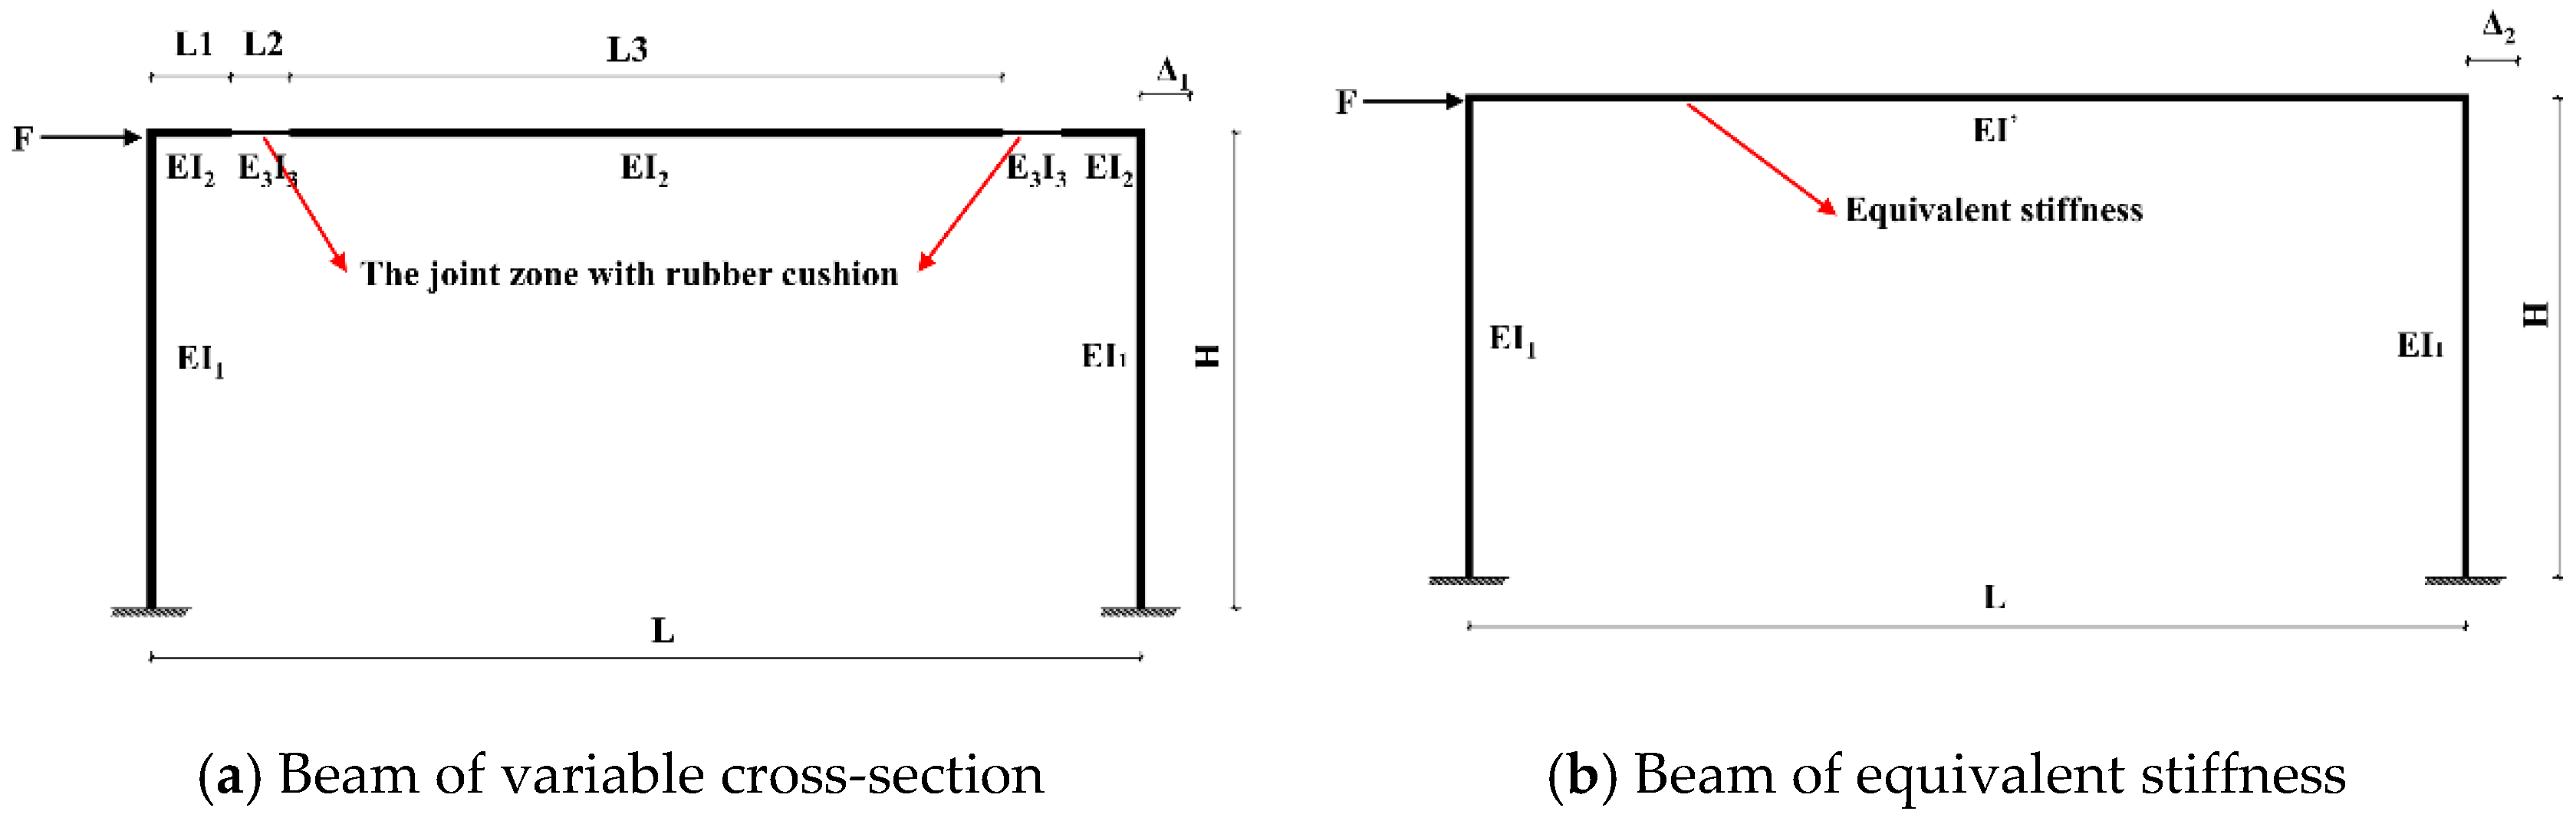
In
Figure 13a, the beam can be divided into three parts: (1) The first part with the length of
is from the end of the beam to the start of the stepped corbel part; (2) the second part with the length of
represents the plastic hinge zone (i.e., the length of the semi-rigid joint
); (3) the third part with the length of
represents the rest of the beam.
,
and
represent the stiffness of the column, beam and connection joint region, respectively; and
is the horizontal displacement under a horizontal load
F. In the
Figure 13b,
represents the stiffness of a homogeneous stiffness beam; and the horizontal displacement under the same load
F is
. In order to simplify calculation, the variable stiffness beam in
Figure 13a can be replaced by the constant stiffness beam in
Figure 13b. Hence, when the two frames have the same horizontal displacement (
), the stiffness of the first beam can be replaced by the second beam’s stiffness
. Then, the new stiffness
(i.e.,
) can be obtained by deformation compatibility conditions [
32].
According to the graphic multiplication method in structural mechanics, the following equations can be obtained.
where,
Then, according to
, the final equivalent stiffness
of the simplified model is obtained.
where,
5.3. A comparison of Horizontal Displacement
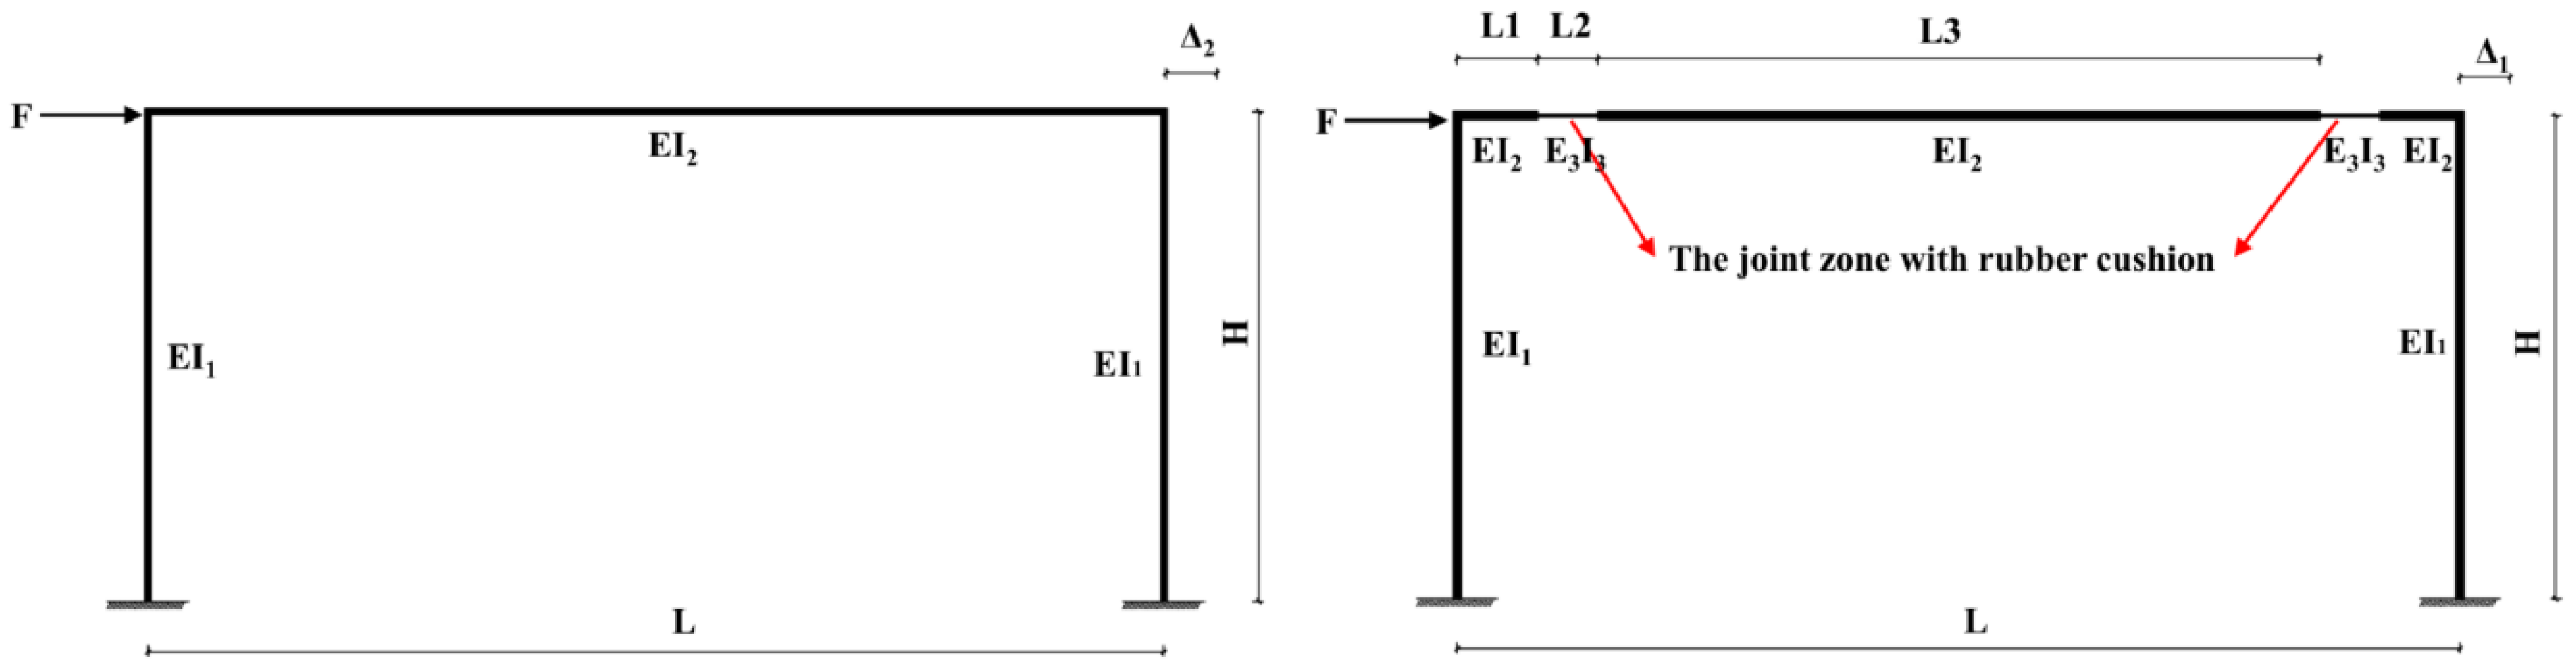
In order to illustrate the limited influence of the beam section bending stiffness reduction on the lateral stiffness of a frame, a comparison calculation has been carried out.
The frame with constant section stiffness of beam and the frame with variable section stiffness of beam have been displayed in
Figure 14.
The dimensions and parameters of the two frames are the same as those of specimen in the test. The horizontal force
F is supposed to be 1000 kN. Then, according to the force method and the graphic multiplication method in structural mechanics, the displacement of the two frames can be obtained.
where,
represents the horizontal displacement of the frame with variable cross-section beam;
represents the horizontal displacement of the frame with constant cross-section beam.
The two frames have almost the same horizontal displacement under the same force F. So, it can be concluded that the connection scheme of the precast specimens in this paper does not cause any significant increase of lateral displacement of the frame structure. Due to the elastic modulus of rubber layer being relatively small compared with other high-performance materials, the stiffness of the beam with the rubber layer is weakened the most among all of the high-performance materials. It could be concluded that the specimen with the rubber layer produces the largest lateral displacement. Therefore, other high-performance materials do not cause a significant increase in the lateral displacement of the structure.
6. Conclusions
The purpose of this paper was to propose a novel dry connection for a beam-to-column joint. Two full-scale precast frames and a cast-in-place counterpart specimen were designed to explore the performance of the precast joint. Based on the experimental results, conclusions can be summarized as follows:
1. The position of plastic hinges in the precast specimen are different from the monolithic one. Due to the rubber washers between the bolts and steel plates, the stiffness of the joint region can be decreased by 60%. Obviously, the novel dry connections have different mechanical characteristics from the monolithic specimen, where the connection joint regions are semi-rigid.
2. All the specimens have almost the same ultimate bearing and deformation capacity, and all of them are bending failure in a malleable way with a plastic hinge in the beam. This phenomenon demonstrates that the precast specimens meet the demands of the seismic codes and appropriate strong-column weak-beam design concept.
3. Comparing the stiffness degradation curve of the three specimens, the initial stiffness of the precast specimens PC-1 and PC-2 are decreased by 61% and 65%, respectively. Moreover, the thicker the rubber washers, the more obvious the stiffness decline. So, the rubber washers at the joint region can be used as an effective method to reduce the initial stiffness of the beam.
4. For specimens PC-1 and PC-2, since the thickness of the rubber washers in PC-2 increases, the slippage of PC-2 is larger than PC-1. The initial stiffness and the cracking load of PC-2 is lower than PC-1. Besides, the energy-dissipating capacity of it is worse than PC-1. It can be concluded that too thick rubber washers in the connection region may have a bad effect on the seismic performance of the structure.
5. At the end of the paper, a formula about the stiffness of the novel joint is obtained and compared with the experimental results. Additionally, in order to simplify the process of calculation, the formula of the equivalent stiffness model frame is proposed. The equation of can be used to obtain the same displacement of a constant stiffness beam as the variable stiffness beam, which can provide a new computing method of the joint.


