Article

Systemic Sustainability of the French Organic Rice and PGI Einkorn Value Chains: A Preliminary Assessment Based on Network Analysis

by
Sylvain Quiédeville
1,*,
Jean-Baptiste Bassene
2,
Frédéric Lançon
3,
Didier Chabrol
2 and
Paule Moustier
4
1
Department of Economics and Social Sciences, Research Institute of Organic Agriculture (FiBL), 5070 Frick, Switzerland
2
UMR Innovation, CIRAD, University Montpellier, 34398 Montpellier, France
3
UMR ART-DEV, CIRAD, University Montpellier, 34398 Montpellier, France
4
UMR MOISA, CIRAD, University Montpellier, 34398 Montpellier, France
*
Author to whom correspondence should be addressed.
Sustainability 2018, 10(7), 2344; https://doi.org/10.3390/su10072344
Submission received: 9 May 2018 / Revised: 28 June 2018 / Accepted: 3 July 2018 / Published: 6 July 2018
(This article belongs to the Special Issue Sustainable Agribusiness and Food Supply Chain)

Abstract

:
Public authorities and consumers increasingly support food value chains that are more environmentally friendly. However, these value chains are faced with technical, economic and institutional limitations, calling into question their long-term viability. Based on two case studies of alternative food chains in France, namely einkorn (Triticum monococcum) in Haute Provence and organic rice in the Camargue, we evaluated their capacity to remain both viable and environmentally, economically and socially sustainable. After assessing the traditional economic, social and environmental performance of their sustainability, we performed a network analysis to determine the survivability of the systems. The combined use of the traditional pillars of sustainability and the network analysis forms what we term the systemic sustainability. Results suggest that the einkorn value chain is characterised by a high degree of centrality represented by a producers’ association, although the systemic sustainability of the chain is reduced by its dependence on a leading processor. As for the organic rice value chain, centralised power is exerted by three companies embedded in a strong network of actors characterised by diversified connections. The paper concludes by highlighting the potential interest of conducting a network analysis to better determine the sustainability of food value chains.

1. Introduction

Food value chains and farming are often criticised for their negative externalities on the environment [1]. This situation is due to the predominance of the conventional model making use of chemical inputs. This model is criticised by both consumers and public authorities, encouraging more environmentally friendly as well as economically and socially acceptable production models or, in other words, alternative forms of production [2,3]. The interest shown by consumers in such production models has given them increased impetus [4]. Nevertheless, alternative food production methods encounter difficulties in meeting the needs of all consumers and in expanding beyond niche markets. Although organic farming has gained ground, it accounted only for 2.4% of the French food market in 2013 [5]. The development of alternative forms of production is faced with path-dependency linked to the predominant production model [6]. In particularly, the adoption of new agricultural practices is uncertain as regards the return on investment [7]. Furthermore, alternative farming systems usually display higher production costs [8] and yields are generally lower and more variable [9,10].
In this paper, we test the relevance of an original approach to sustainability that takes account of both the traditional pillars of sustainability (i.e., the economic, environmental and social pillars) and the way actors are connected and organised within the network. The research question was if, and how, this original approach to sustainability strengthens a traditional analysis of sustainability for food value chains. The approach was tested on two French food value chains: the einkorn chain in Haute Provence (an alternative and protected geographic indication (PGI) value chain) and the organic (and PGI) rice value chain in the Camargue. The conducting of this comprehensive analysis of sustainability is referred to as the assessment of systemic sustainability.
The case of the transition to organic farming in the Camargue was chosen in light of the considerable ecological and economic challenges facing it. The relatively intensive cultivation of rice impacts severely on the environment, especially with regard to the water quality of the River Rhône. Furthermore, the future of the whole French rice value chain is exposed to the changes in the Common Agricultural Policy (CAP). The einkorn value chain of Haute Provence was selected because of the creation of a PGI system requiring the establishment of a strong collaborative network of actors. The conceptual background to our original approach is first presented before explaining the methodology adopted in more detailed, tangible terms. The case study results and main findings are then presented and discussed.

2. Conceptual Background

We first define the concept of systemic sustainability, in particularly in relation to food value chains. We then address the potential of network analysis, showing how it can contribute to the assessment of the systemic sustainability of food value chains.

2.1. Systemic Sustainability of Food Value Chains

Food value chains can be seen as “systems”. Stringer and Hall [11] defined food value chains as a set of material flows calling on the involvement of numerous economic actors with complementary and interdependent functions. In other words, several actors (constituent elements) are intended to interact together to ensure that product development is in line with consumer expectations. A sustainable food value chain (SFVC) was defined by Neven [12] (p. 6) as “the full range of farms and firms and their successive coordinated value-adding activities that produce particular raw agricultural materials and transform them into particular food products that are sold to final consumers and disposed of after use, in a manner that is profitable throughout, has broad-based benefits for society, and does not permanently deplete natural resources”. Sustainable food value chains are dynamic, market-driven systems in which vertical coordination (governance) is the central dimension.
We refer to systemic sustainability as the assessment of how sustainable a given socio-economic system is in the context of agriculture. A system is deemed to be a delimited entity comprising its own organisation and complying with specific principles and rules. The sustainability of a system depends on its capacity to produce goods and services that fulfil the objectives of the system’s actors (e.g., in terms of productivity) without affecting existing resources [13]. A systemic vision of sustainability was used in studies examining natural resource management [13], health [14] and human resource management [15]. This approach is designed to be global (focusing on the entire entity studied) by combining a study of the normative aspects of sustainability (the traditional pillars) with a study of the functional aspects. In other words, the analysis of systemic sustainability focuses not only on the environmental, economic and social dimensions, but also on stakeholders’ interactions in their capacity to ensure the viability of systems.
Systemic sustainability refers to system’s resilience and survivability [13,16]. The definition of resilience has been the object of fierce debate in recent decades. According to the IPCC [17], resilience can be defined as “the ability of a social or ecological system to absorb disturbances while retaining the same basic structure and ways of functioning, the capacity of self-organisation, and the capacity to adapt to stress and change”. Survivability can be measured through the attributes of survival capacity determining how a chain can cope with disturbances, uncertainties and risks [18,19]. It can also be informed by attributes of value chain governance [20]. These attributes can, in turn, be determined by network analysis indicators. Our hypothesis is that a traditional analysis of sustainability combined with survival capacity and value chain governance attributes can determine the systemic sustainability of food value chains.

2.2. Using Network and Mapping Analysis to Assess the Systemic Sustainability of Food Value Chains

2.2.1. The Contribution of Network Analysis to Value Chain Assessment

Value chains are likened to complex networks where information and goods are, respectively, shared and traded through highly diverse linkages involving industrial, organisational and socio-economic constituents [21,22]. The study of networks can help in analysing the systemic sustainability of alternative food value chains. The latter commonly rely on local agri-food systems, defined as concentrations of small-scale farmers specialising in particular in food-processing activities [23]. The long-term viability of local agri-food systems depends, inter alia, on the effectiveness of collective actions, which are determined by social capital encompassing the notions of trust, reciprocity, norms and sanctions. “Primary among the influences assuring the viability and vibrancy of regional food networks are the social relations of cooperation and trust that exist among suppliers, producers, workers, brokers, retailers and consumers who comprise the regional food network” [24] (p. 279). A high network density, referring to relational thickness or strong ties, was described to favour trust and common norms, but in certain contexts also to curb innovation development and assimilation of external knowledge by actors [25]. Furthermore, it has been highlighted in the literature that the existence of highly-developed ties may weaken the sustainability of the value chain as the maintenance of numerous relations may consume considerable resources, leaving very few resources to cope with contingencies [26]. The density of networks can be measured with the Social Network Analysis (SNA) tool, using the ratio of real links between actors within the network to the number of possible links. It is close to 1 for a network at full capacity. Strong ties are related to family and local communities, and should be distinguished from weak ties. The latter can be described as acquaintance relationships connecting groups to society as a whole. Paradoxically, weak ties can favour innovation processes within professional communities, while strong ties may hinder them [27,28,29].
The viability of alternative food value chains requires adaptation to the environment and the development of often radical agricultural innovations [30]. It has been demonstrated that such innovations can develop with the help of complex relationships between actors, learning synergies, knowledge and techniques [31,32,33,34]. This implies a need for knowledge brokers to strengthen actors’ relationships [35]. The SNA tool makes it possible to identify and determine the role played by knowledge brokers using the indicator of betweenness centrality, which can be defined as the propensity of a central stakeholder to link unconnected members [36].
Betweenness centrality also accounts for the centrality of actors in the network and can influence the development and survivability of local alternative food systems. Centrality is the relational influence of particular individuals or groups within a community [23]. In other words, centrality implies the influence exerted by actors on a network’s ties [37]. A high degree of centrality might “facilitate trade between farmer cooperatives, their inputs and service providers, and processors” if the conditions of effective coordination and coherent governance are fulfilled [38]. In addition, a high level of centrality is conducive to better access to and control of information, which a priori favours innovation [39,40]. The central influence of some members may nevertheless create barriers for newcomers and jeopardise the control of the network. The failure of the union of cheese producers in Mexico, for example, was explained by the excessive centrality of some actors in the network combined with a low density of the professional network [23]. Thus, there is a need for knowledge brokers and/or for a high network density to ensure all actors are sufficiently connected to all others.
Furthermore, it is acknowledged that improved coordination among a value chain’s actors is a condition for their competitiveness and long-term viability [41]. Coordination may relate to information sharing on consumer demand which in turn enables innovation, particularly in the area of quality development [42]. More generally, the importance of information flows, cooperation and financial links within networks of actors, in terms of systems’ survivability, has been shown extensively in the field of cluster theory. A cluster is to be understood as a group of companies belonging to the same sector and situated close to each other [43]. Porter [44] theorised that companies located in a cluster are likely to be more innovative due to the possibility of using collective knowledge [45] and easily observing similar companies (competitors) in the network [46], to the effect of the scale of the agglomeration [47] and to increased social interaction [48]. The degree to which actors are clustered together can be measured by the clustering coefficient, using the SNA tool.
Moreover, it has been shown that good supply chain flexibility, i.e., the possibility of changing suppliers or buyers, is conducive to a high degree of system survivability. Carayannis [49] and Aspara et al. [50] stressed that targeting flexibility and innovation as strategic goals enables companies both to better respond to possible risks and to meet demands of consumers while increasing their knowledge of technological progress. As survivability implies the capacity to react to diverse disruptive events by analysing the relevant information gathered and taking quick, appropriate decisions accordingly, the distance between actors must be considered together with the intensity of their relations. The distance can be measured with the SNA tool and equals the average number of actors an actor has to call on in order to reach another actor.

2.2.2. Value Chain and Network Governance

Sustainable Supply Chain Governance (SSCG) models classify value chains based on the measure of centrality and density while drawing inferences on the performance of these value chains [20]. A highly centralised organisation can be eithervery negative or positive, depending on the level of network density. By contrast, a high network density is considered positive, regardless of the power of the central organisation. The network structure analysis classification developed by Vurro et al. [20] is composed of four attributes that depends on both the level of centrality of the core organisation and the level of density of the network of actors (Table 1).
The “transactional” model boasts a central organisation that has no influence over the network and a structurally dispersed value chain. The circulation of information between stakeholders is consequently weakened. In the “dictatorial” model, a high level of centrality (concentration of power by central actors) combined with a low network density gives considerable power to the central organisation, which can impose its own views on the network (practices, standards, behaviour, etc.). That said, if the central organisation plays a leadership role in terms of sustainability, such an organisation might not be as negative as it seems. In the “acquiescent” model, the actors occupy a peripheral position in a highly interconnected network. While the low level of centrality could lower commitments to sustainability (no central actor to impose its views), the high level of network density is a priori conducive to a better information flow. According to the authors, the “participative” model represents the best governance scheme, insofar as we can observe reciprocal influences between a highly centralised organisation and a greatly densified network. Nevertheless, such an organisation can only operate if the central actor (actors) agrees (agree) to collaborate with the others.

2.2.3. Survival Capacity of the Network

To ensure a good survival capacity, a network must be able to adapt to the vagaries of its environment. This presupposes that actors within a network can cope with disruptions and be both flexible and highly reactive. The indicators of robustness, responsiveness, flexibility and adaptivity were proposed by Thadakamalla et al. [19] to take account of the survival capacity of supply chains. The larger is a network component, the more robust is the network due to the presence of more alternative pathways between actors that enhance their ability to cope with risks, uncertainties and disturbances. It is expected that the disappearance of an actor in a robust network will not affect it very much, as the distance between actors would not significantly increase. Nevertheless, any difficulty encountered by an actor would not cause extraordinary risks given the high capacity of the network to react.
Responsiveness relates to the speed of responses to shocks or any vagaries and is conducive to a high level of reactivity, and thus to the survival of the network. A small average distance between actors (number of links needed for one individual to reach any other in the network) ensures quicker responses. Finally, the flexibility component depends on the existence of alternative pathways. A high level of flexibility tends to favour the survival of the network. Adaptivity differs from flexibility in that it is based more on the perception of the actors themselves and on their potential reaction to decisive events.

2.3. Operationalisation of Systemic Sustainability

In this paper, we propose to define a value chain as sustainable in systemic terms through a high survival capacity of the system (balanced centrality and density of the network) as well as through good robustness and responsiveness (characterised by a low distance between actors) and a high level of flexibility and adaptivity. It is assumed that the density and centrality of networks are crucial structural properties influencing their capacity to innovate, adapt and thus survive. The centrality of the network can nevertheless have ambiguous effects. Indeed, the considerable power of some actors may be beneficial to investment, innovation and leadership for sustainability, while at the same time creating barriers to new competitors and leading to asymmetries and a lack of information. The systemic sustainability of food value chains is also measured by various indicators taking account of the traditional pillars of sustainability (i.e., economic, social and environmental).

3. Methodology

The study was based on data acquired through interviews with actors in the chains. We first present the nature of the people interviewed, and then the different topics dealt with. How indicators of sustainability were generated is the object of the last section.

3.1. Source of Data

We conducted in-depth interviews with a group of actors from each of the two organic value chains. These actors were purposefully selected to capture the various value chain functions. All marketing and processing organic players were interviewed as they are not numerous (see Table 2). For producers, we first defined a typology of three groups relating to size, specialisation and length of participation in farmers’ organisations; we then interviewed between two and four farmers from each group.
During the interviews, we first used a qualitative approach with open questions that enabled stakeholders to express themselves and highlight their concerns concerning the respective value chains. We also adopted a quantitative approach to collect required data for the economic, social and environmental indicators as well as for the network analysis. More details on which data were collected and how are provided in the following subsections. We first address the key features of the case studies before tackling the traditional pillars of sustainability and then the survivability of systems.

3.2. Information on the History and Organization of Chains

During interviews with non-producer actors, five general topics were addressed before tackling the more quantitative aspect: (1) characteristics of the company or institution in terms of size (number of employees and turnover), general goals and place within the value chain; (2) history and future perspectives of the company, including in terms of production and marketing of the commodity with the changes in production mode, production areas, volumes handled, nature of outlets, quality specifications and role played by the PGI system; (3) current and envisaged future mapping of trade with the origin and outlet of commodities and corresponding volumes and prices as well as the place and nature of supplier or buyer; (4) current and future strategy of the company or institution in terms of supply and marketing, including the use of contracts, the emphasis on price or quality as well as the eventual strategy relating to the diversification of activities; and (5) the commitment to and opinion on the current PGI system, in particularly with regard to the PGI specifications, and opinion on the potential future of the PGI system.

3.3. Information on Sustainability According to the Traditional Pillars

We selected a few relevant indicators to offer an overview of the traditional pillars of sustainability of the two French food value chains investigated. Numerous indicators have been developed since the Rio Summit in 1992. Regarding the agricultural sector, three groups of indicators can be defined [51]: land management, land quality and generic indicators of sustainability. For the purpose of this study, it was decided to focus more on the socio-economic dimensions at farm level. Soil-related indicators are not directly explored and equity between actors is not studied for reasons of limited data availability. Furthermore, environmental indicators are limited to the use of pesticides, which was identified as the main environmental issue in the two case studies explored. Of course, scholars are free to use a broader range of indicators depending on the object of the analysis and research question(s) (see, e.g., Zahm et al. and Schader et al. [52,53]). The indicators selected in this study are specified in Table 3, which also specifies what data were collected and how indicators were computed.

3.4. Information on Chain Governance and Survival Capacity

We used SNA indicators to assess the type and intensity of relationships between stakeholders within the value chains. The indicators used to determine the governance and survival capacity of the value chains are summarised in Table 4.
The network analysis was conducted using a matrix reporting the actors’ relationships. Relationships among actors comprise three dimensions which were all considered together: information flow, financial links and collaboration links. The direction of the relationships was not considered. Furthermore, a score of relation intensity from 0 to 10 was considered in the Camargue case while a binary score (0 or 1) was used in the einkorn case. All the actors interviewed were asked to state their level of relationships with the other actors. A pre-list of actors to consult was prepared by the interviewer. However, the actors interviewed were asked to complete this list and specify their level of relationships with those actors, where appropriate. The more detailed analysis performed in the Camargue case was justified by the relative complexity of the situation, in that several conflicts occurred in the past. This implies greater variability in the level of relationships between actors.
The indicators of betweenness centrality, distance, clustering coefficient and density are calculated as follows [37]:
  • Betweenness centrality: C b ( n i ) = g   j k ( n i ) g   j k ( g 1 ) ( g 2 ) 2
    where gjk is the number of geodesics connecting jk, and gjk(ni) the number of geodesics that actor i is on.
  • Clustering coefficient: C i = 2   n i k i   ( k i 1 )
    where ki is the number of “adjacent actors” of actor i (actors who are directly connected to this actor i), and ni the number of edges between the ki adjacent actors of actor i.
  • Distance: ( D ) = 1 n   d i s t i , j
  • Density: ( D y ) = A c t u a l   c o n n e c t i o n s M a x i m u m   p o s s i b l e   c o n n e c t i o n s

4. Results

We first present the history and organisation of the two value chains investigated, based on the information provided by the stakeholders interviewed. We then present the economic, social and environmental dimensions of sustainability before characterising the governance and survival capacity of the value chains and finally their systemic sustainability.

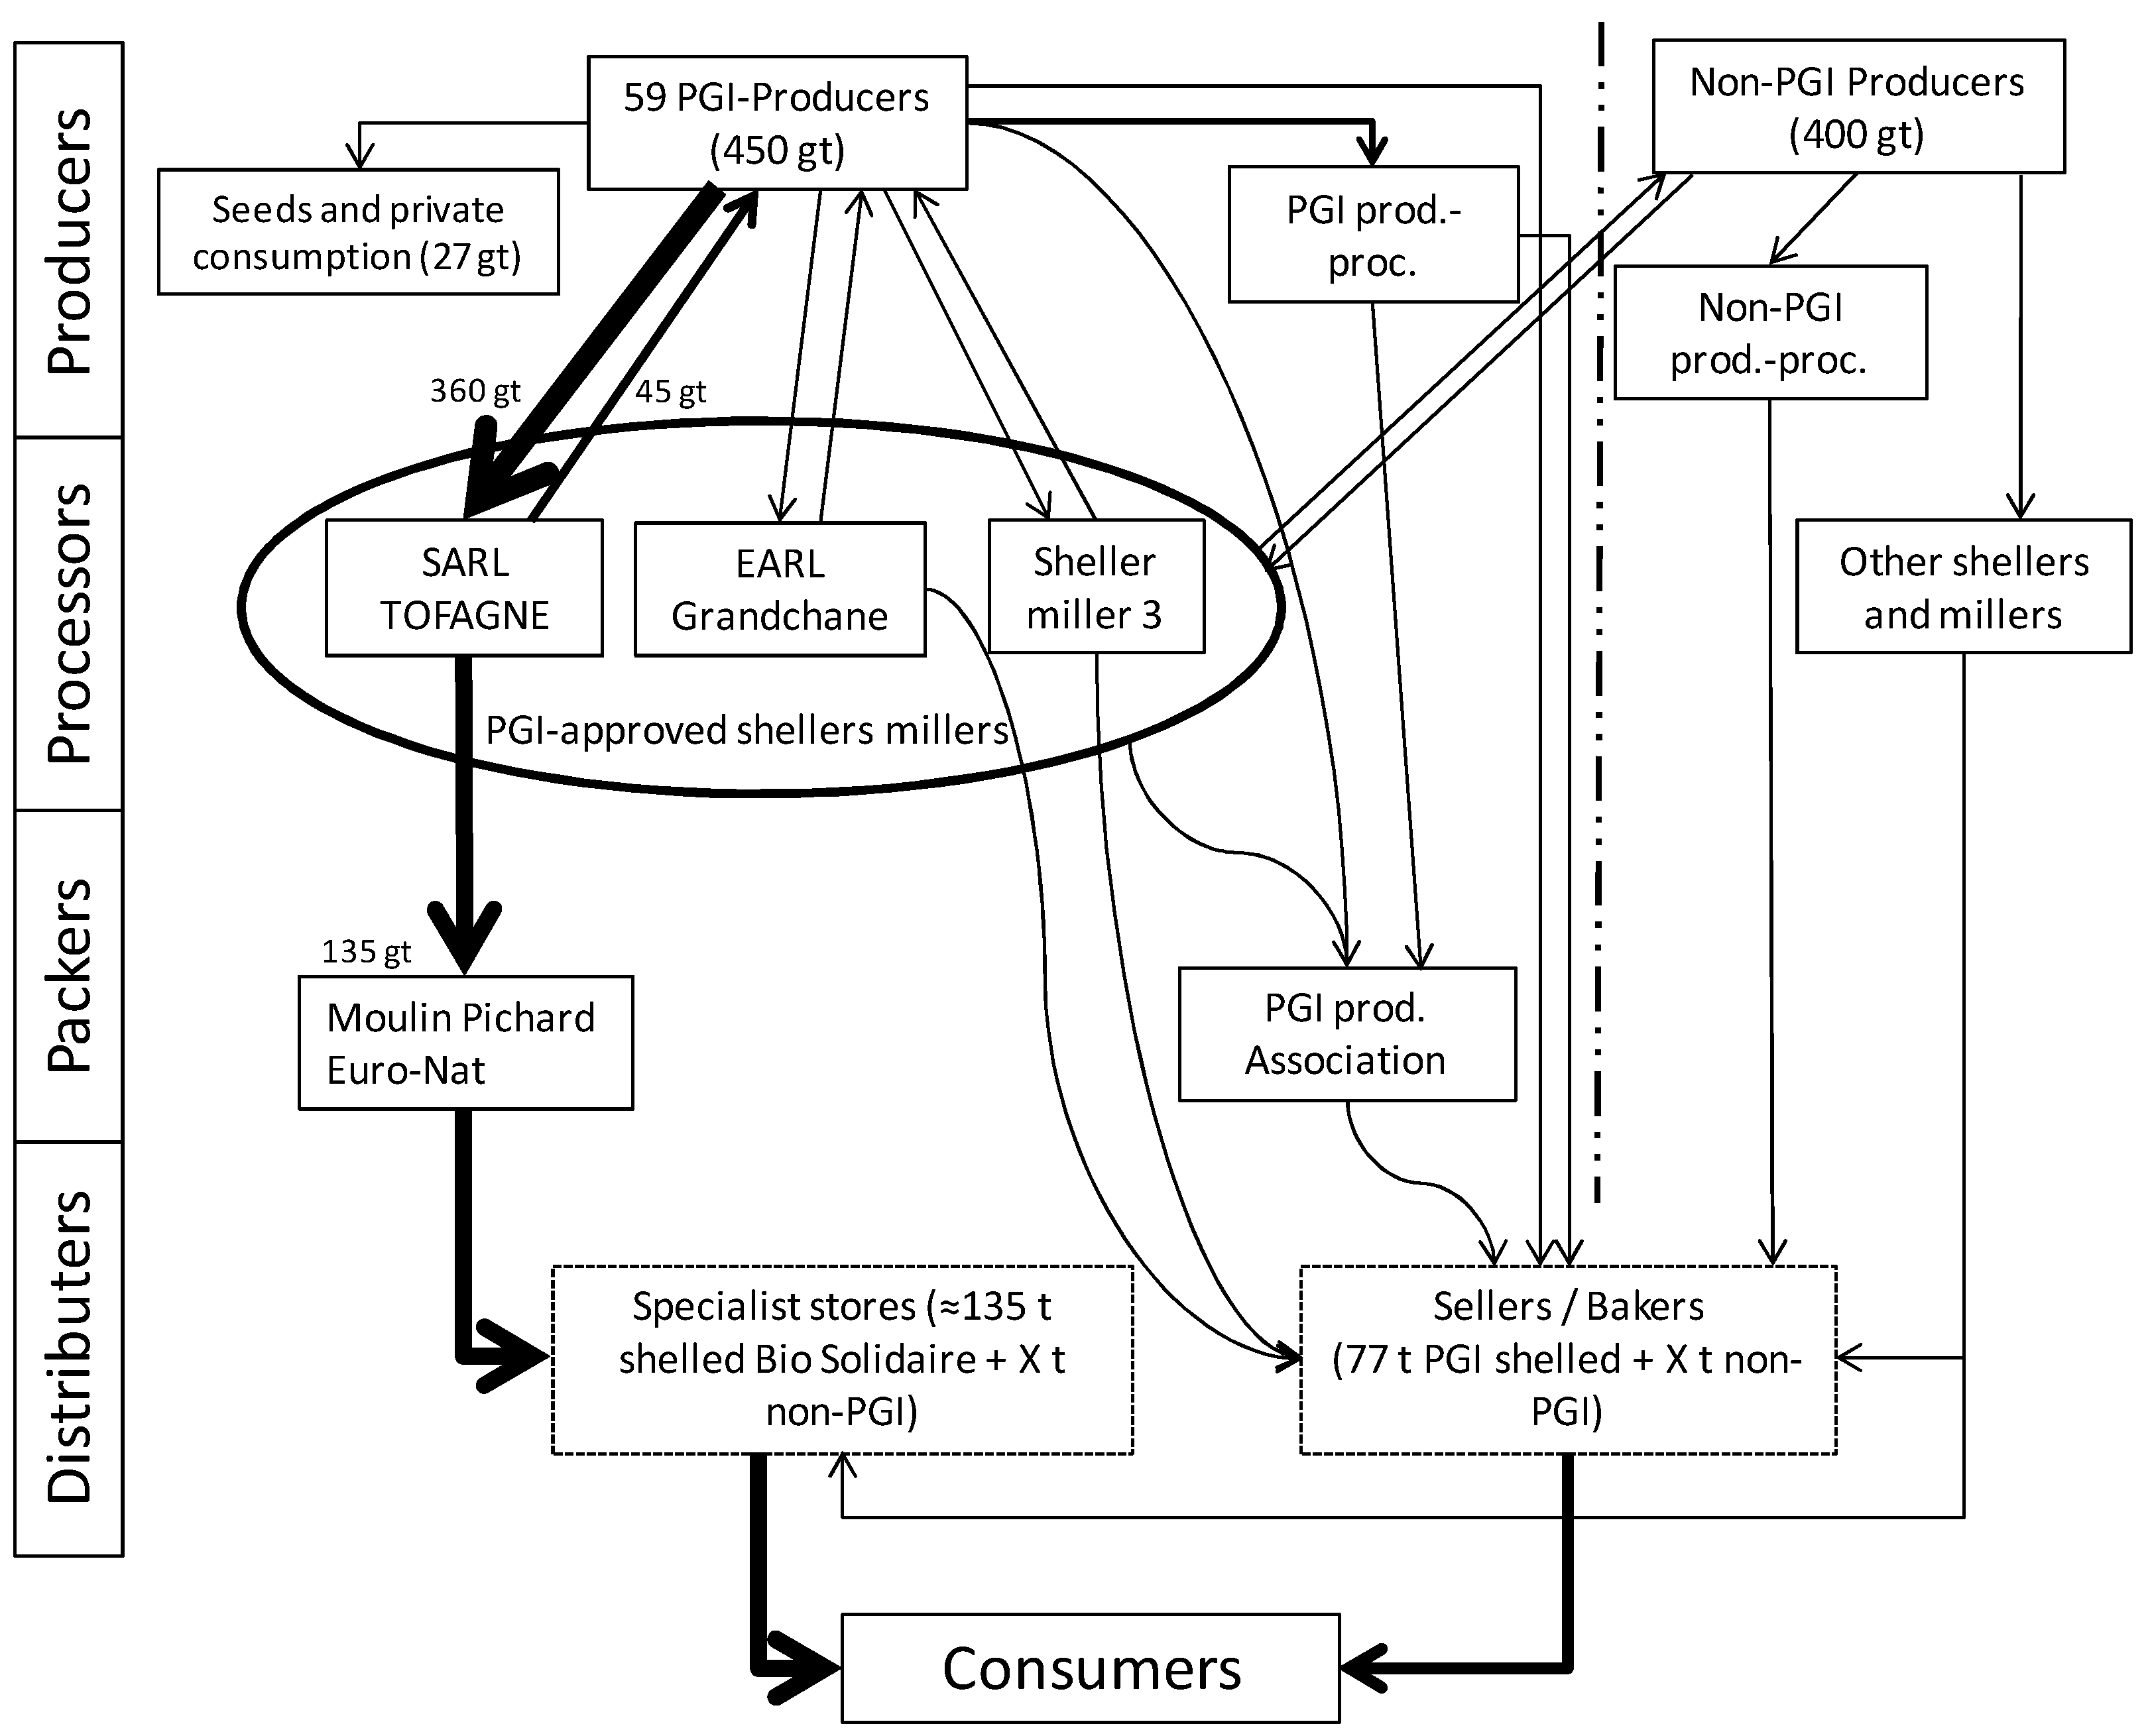
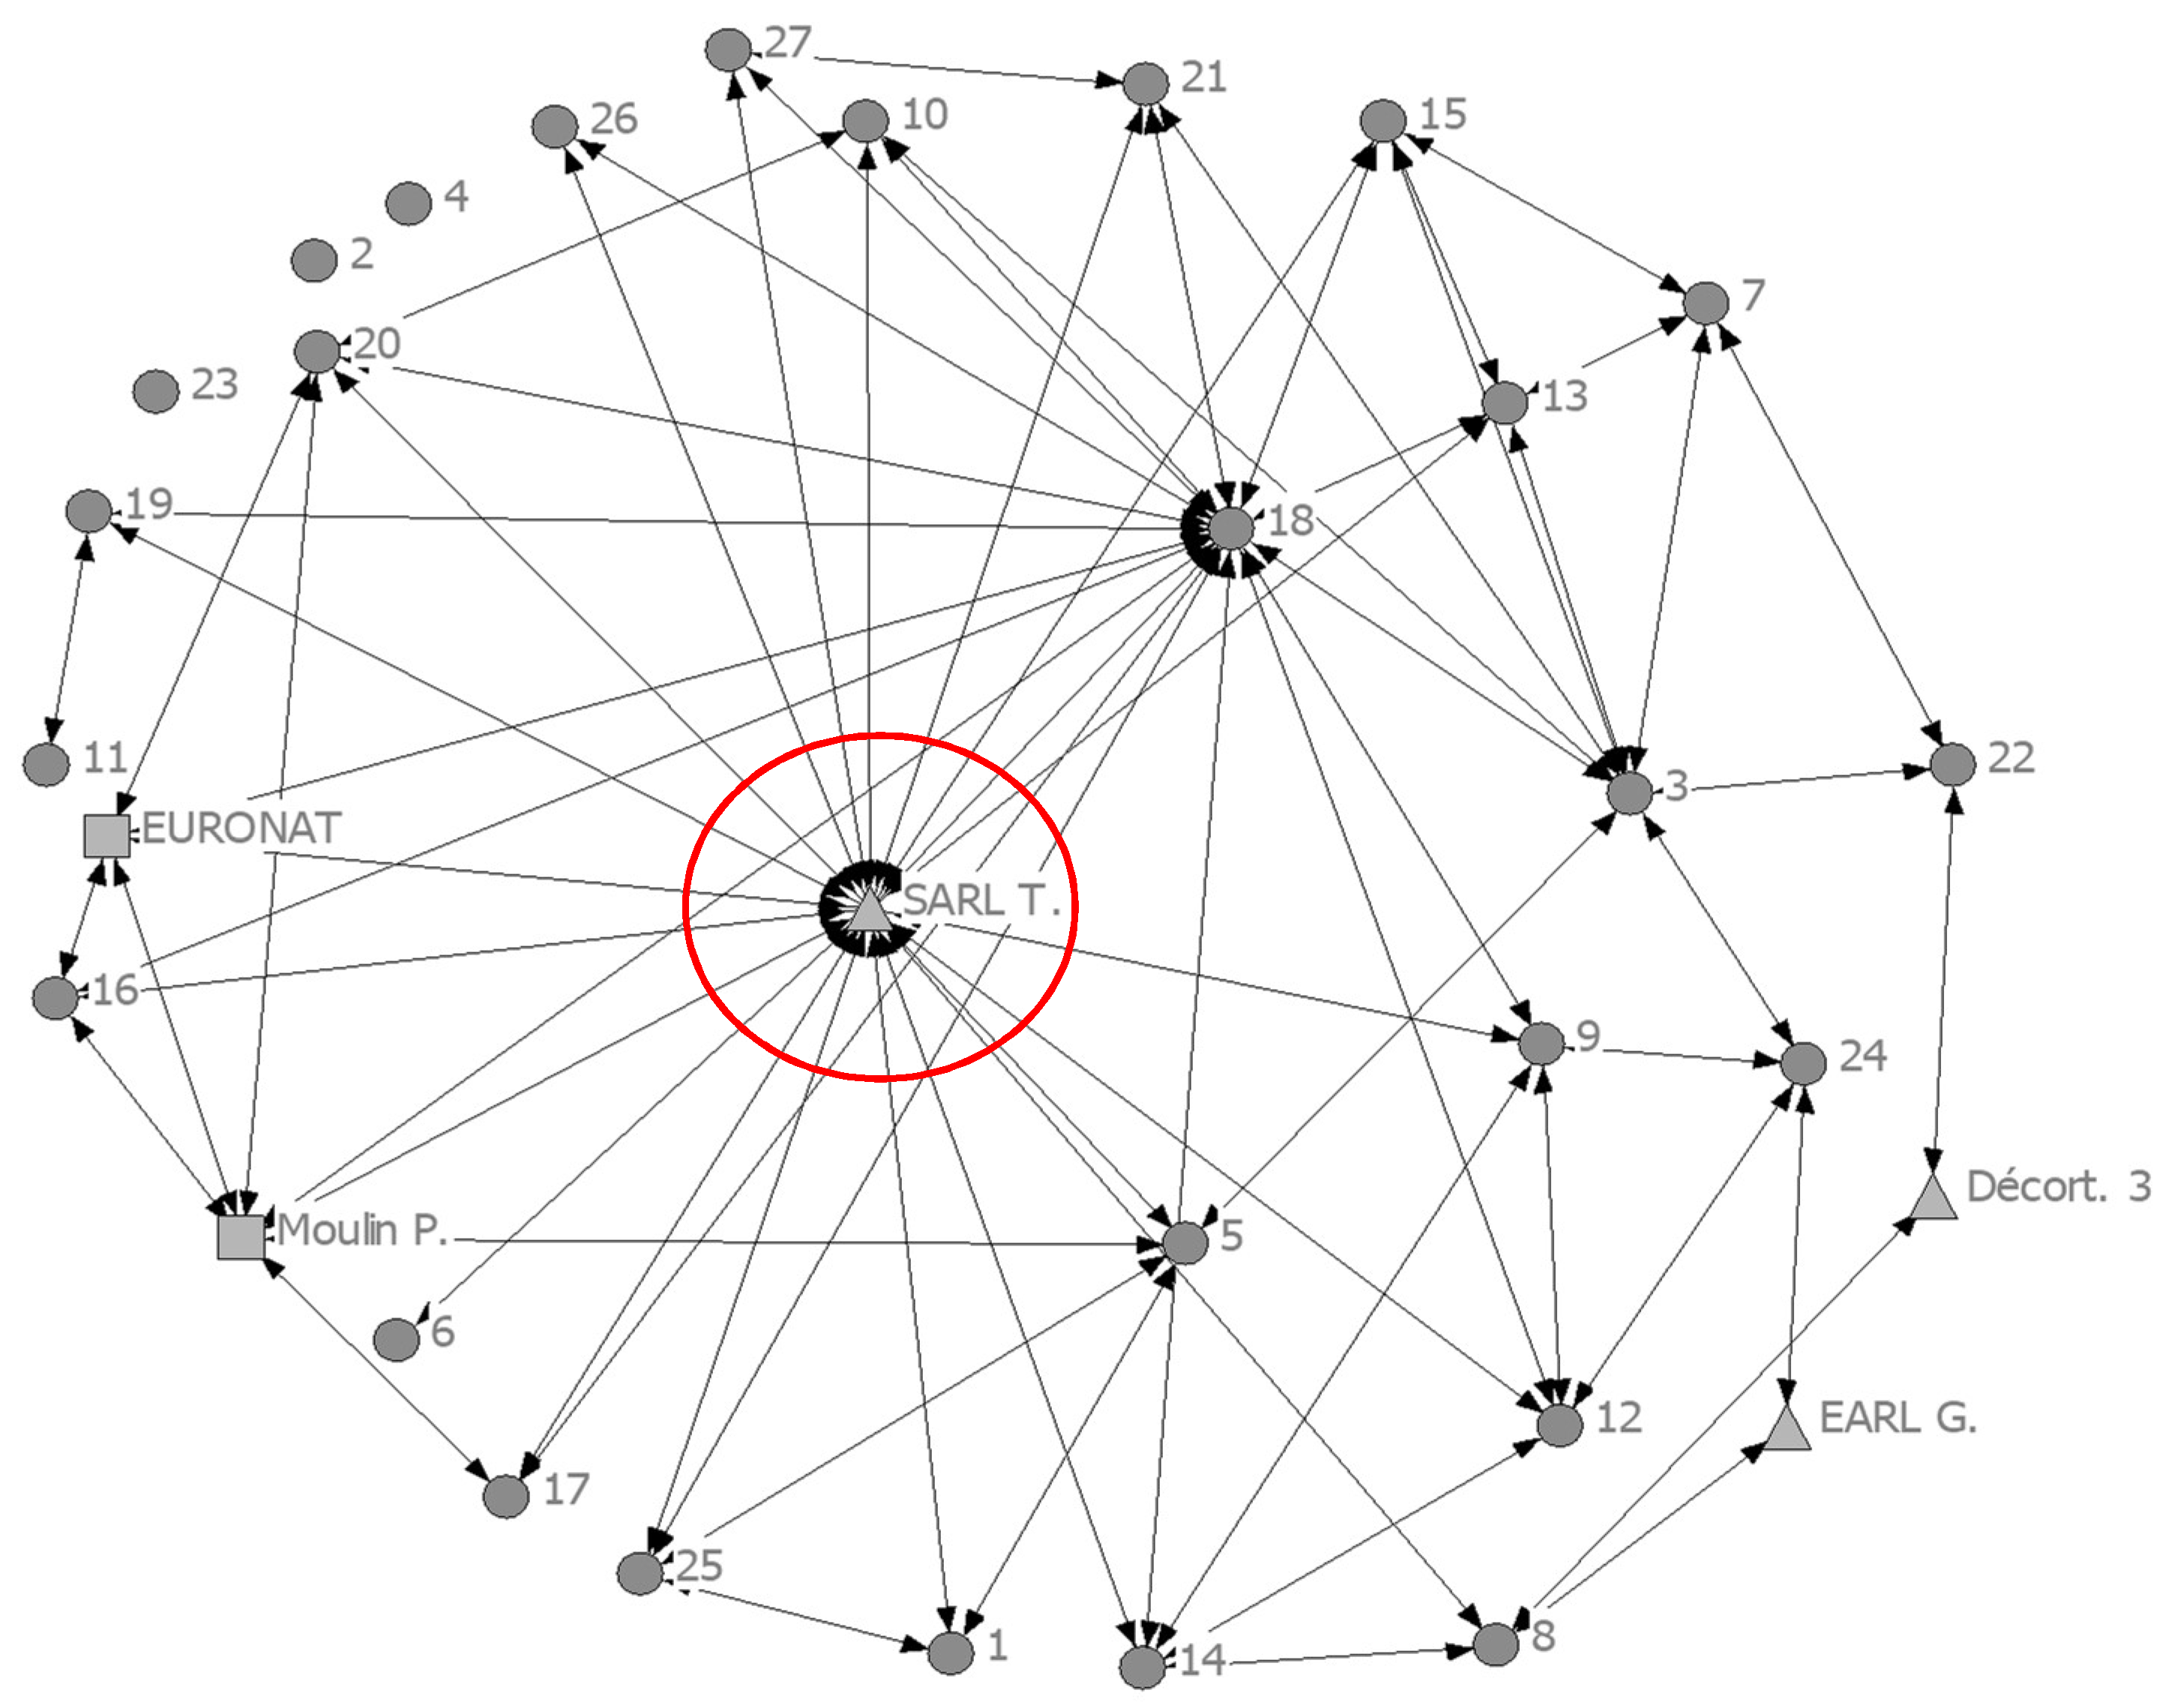
4.1. A Highly-Centralised and Low-Density Network: The Case of the PGI Einkorn Chain

4.1.1. History and Mapping of Trade

The Haute Provence einkorn (Triticum monococcum) value chain is one of the alternative value chains currently experiencing significant success. This cereal was first farmed 10,000 years ago in the Fertile Crescent and was subsequently adopted in the Mediterranean basin and particularly in Provence [63]. Long used in subsistence farming [64], einkorn production enjoyed a new lease of life in the 1990s when French producers took a collective decision to preserve this crop, and the Haute Provence einkorn union (SYPEHP) was formed in 1997 [65]. Furthermore, producers were reported to have developed the PGI of “Petit Epeautre de Haute Provence” (PEHP) in 2009 and to have benefited from strategic partnerships with the Slow Food association and a range of companies (SARL Tofagne, Moulin Pichard, and Euro-Nat). According to the value chain actors, this organisation generated benefits within the territory through the renewal of a forgotten product coupled with traditional and environmentally-friendly practices. Representatives from the PGI einkorn union claim that the value chain boasts 59 producers, who are nevertheless unevenly distributed throughout the PGI area (stretching from the département of Drôme to that of Vaucluse). In addition to the PGI-approved shellers and millers, we also distinguish producer-processors who shell and/or grind their own products. In 2008, einkorn producers formed an association “to defend, promote and market einkorn and its related products” [66]. The aim was to “organise the commercialisation of part of production in a collective manner in order to satisfy the demand received by the union and to represent the value chain at trade fairs and exhibitions” [66].
Interviews with non-farmer value chain actors showed that, in 2009, SARL Tofagne (PGI-approved miller-sheller), Moulin Pichard (packer), Euro-Nat (packer) and 25 producers adopted a three-year production contract entitled Bio Solidaire (BS), providing greater guarantees with regard to the development of the value chain. The Bio Solidaire brand belongs to the Biopartenaire association which “brings together small and medium-sized enterprises committed to production in compliance with the quality and environmental criteria of organic agriculture as well as the criteria of fair trade” [67]. The value chain now includes two additional PGI-approved shellers who are not incorporated into the BS contract, and 70% of PGI production is shelled by SARL Tofagne. The structure of the value chain focuses on the BS contract (national market), accounting for 60% of PGI production. For actors selling their own products, be it locally or nationally, we note a lack of structure and contracts. A total of 34% of PGI production is sold in short circuits (farm, fairs, local markets, with local stores, etc.). The remaining 6% is dedicated to seeds and private consumption (Figure 1).

4.1.2. Traditional Pillars of Sustainability

The organisation of the value chain helped to maintain a stable production capacity by implementing highly-restrictive PGI specifications with regard to the environment. This implied the promotion of the reusability, restoration and conservation of resources, thereby allowing the production level to be maintained. The PGI specifications thus guarantee quality production (rate of proteins greater than 10.5%) and stable output (1.70 t/ha) which is satisfactory to the value chain. The union endeavoured to achieve this stability by incorporating a policy of soil preservation (obligation of rotation with pulse crops over three years) into the PGI specifications. These specifications prohibit the use of herbicides (mechanical weeding only) and the use of synthetic chemical products while fertilisation is only authorised from January to March and is limited to 60-60-60 units of NPK. NPK stands for nitrogen (N), phosphorus (P) and potassium (K), which are the three main nutritive elements required by plants during their development.
In socio-economic terms, the different stakeholders are satisfied with the incomes obtained from the promotion of PGI einkorn. Prices for PGI einkorn in BS are guaranteed and high. In 2012, BS einkorn won an organic excellence award delivered by the French organic agency to producers, processors and distributors that introduce technical, commercial, economic or social innovations. The PEHP value chain was rewarded for having offered consumers PEHP bulgur, a product which can be cooked more quickly. Producers can therefore choose to sell wholesale via the BS contract, taking account of their other activities. The PGI represents a cost (€60 annual membership and €50 per ha of einkorn) for SYPEHP members which must be turned to profit for this commitment to be perpetuated. The members feel that the costs are appropriate and know that they are used to fund the union’s activities. Nevertheless, only the BS contract is acquired as a guaranteed outlet for the sale of PGI (accounting for 60% of production). The development of the producers’ association to offset this lack of outlets has not (yet) resulted in any significant volumes of sales. With respect to the transmission of farms, most producers (20 out of 26) have no potential buyer even though they would like to ensure continuity. The quality of life may be of considerable importance in maintaining this very low input mode of production in difficult zones. Most PGI producers (19 out of 26) interviewed claimed to enjoy a high quality of life.

4.1.3. Survivability

Network Characteristics

Based on relationships between the different actors, the PGI einkorn value chain network (Figure 2) is of low-density (0.14) with a relatively centralised organisation in that the PGI and BS-approved sheller (SARL Tofagne) has a betweenness centrality score of 170 compared to 14 on average for the entire network. This position gives it a structural advantage within the value chain as it serves as an intermediary for most actors to reach others.

Value Chain Governance and Survival Capacity

The robustness of the PGI einkorn value chain appears weak as no tight cluster of actors could be identified in the whole value chain network. This suggests an absence of “democratic” leadership within the network, where SARL Tofagne is the only strong central actor. This supposed low robustness is linked to the low density (0.14) of the network, characterising the relatively low average number of connections among actors. A broader analysis of the organisation of the value chain also illustrates this weakness, in particular with regard to shelling. Through its three PGI-shellers, the value chain has a shelling capacity of approximately 2.5 t/day of finished product, which is largely underused. This situation can be explained by the structure of the value chain where the rather “non-democratic” coordination seems not to be conducive to a fluid circulation of information or to an appropriate management of product flows. Furthermore, a distance of 2.39 was calculated, suggesting an average responsiveness of the value chain. This distance, however, is not very large as SARL Tofagne plays a role of intermediation between actors. The relationships between the different actors in the system were previously governed by trust, an informal means of coordination, which enabled the development of a high level of social capital focusing on the development and protection of PGI einkorn. However, due to the arrival of several new members and given their close relationships with the SARL Tofagne, an increasing imbalance in the distribution of resources and power is observed. We therefore witness a gradual shift away from coordination based on trust towards a more market-based coordination (BS contract, specific to the SARL). Moreover, this situation could help explain why the actors find it difficult to deal with the other two PGI-approved shellers (poor adaptivity). This low adaptivity is also linked to the rather poor flexibility. The organisation raises questions in terms of survivability in the event of the failure of one of the strategic actors of the BS (Tofagne, Euro-Nat, and Pichard) and of SARL Tofagne in particular. Short circuit sales, which only account for 34% of the total production volume, would encounter serious difficulty in securing the entire market, according to the interviewed actors.

Summary

The characteristics of the network are summarised in Table 5.

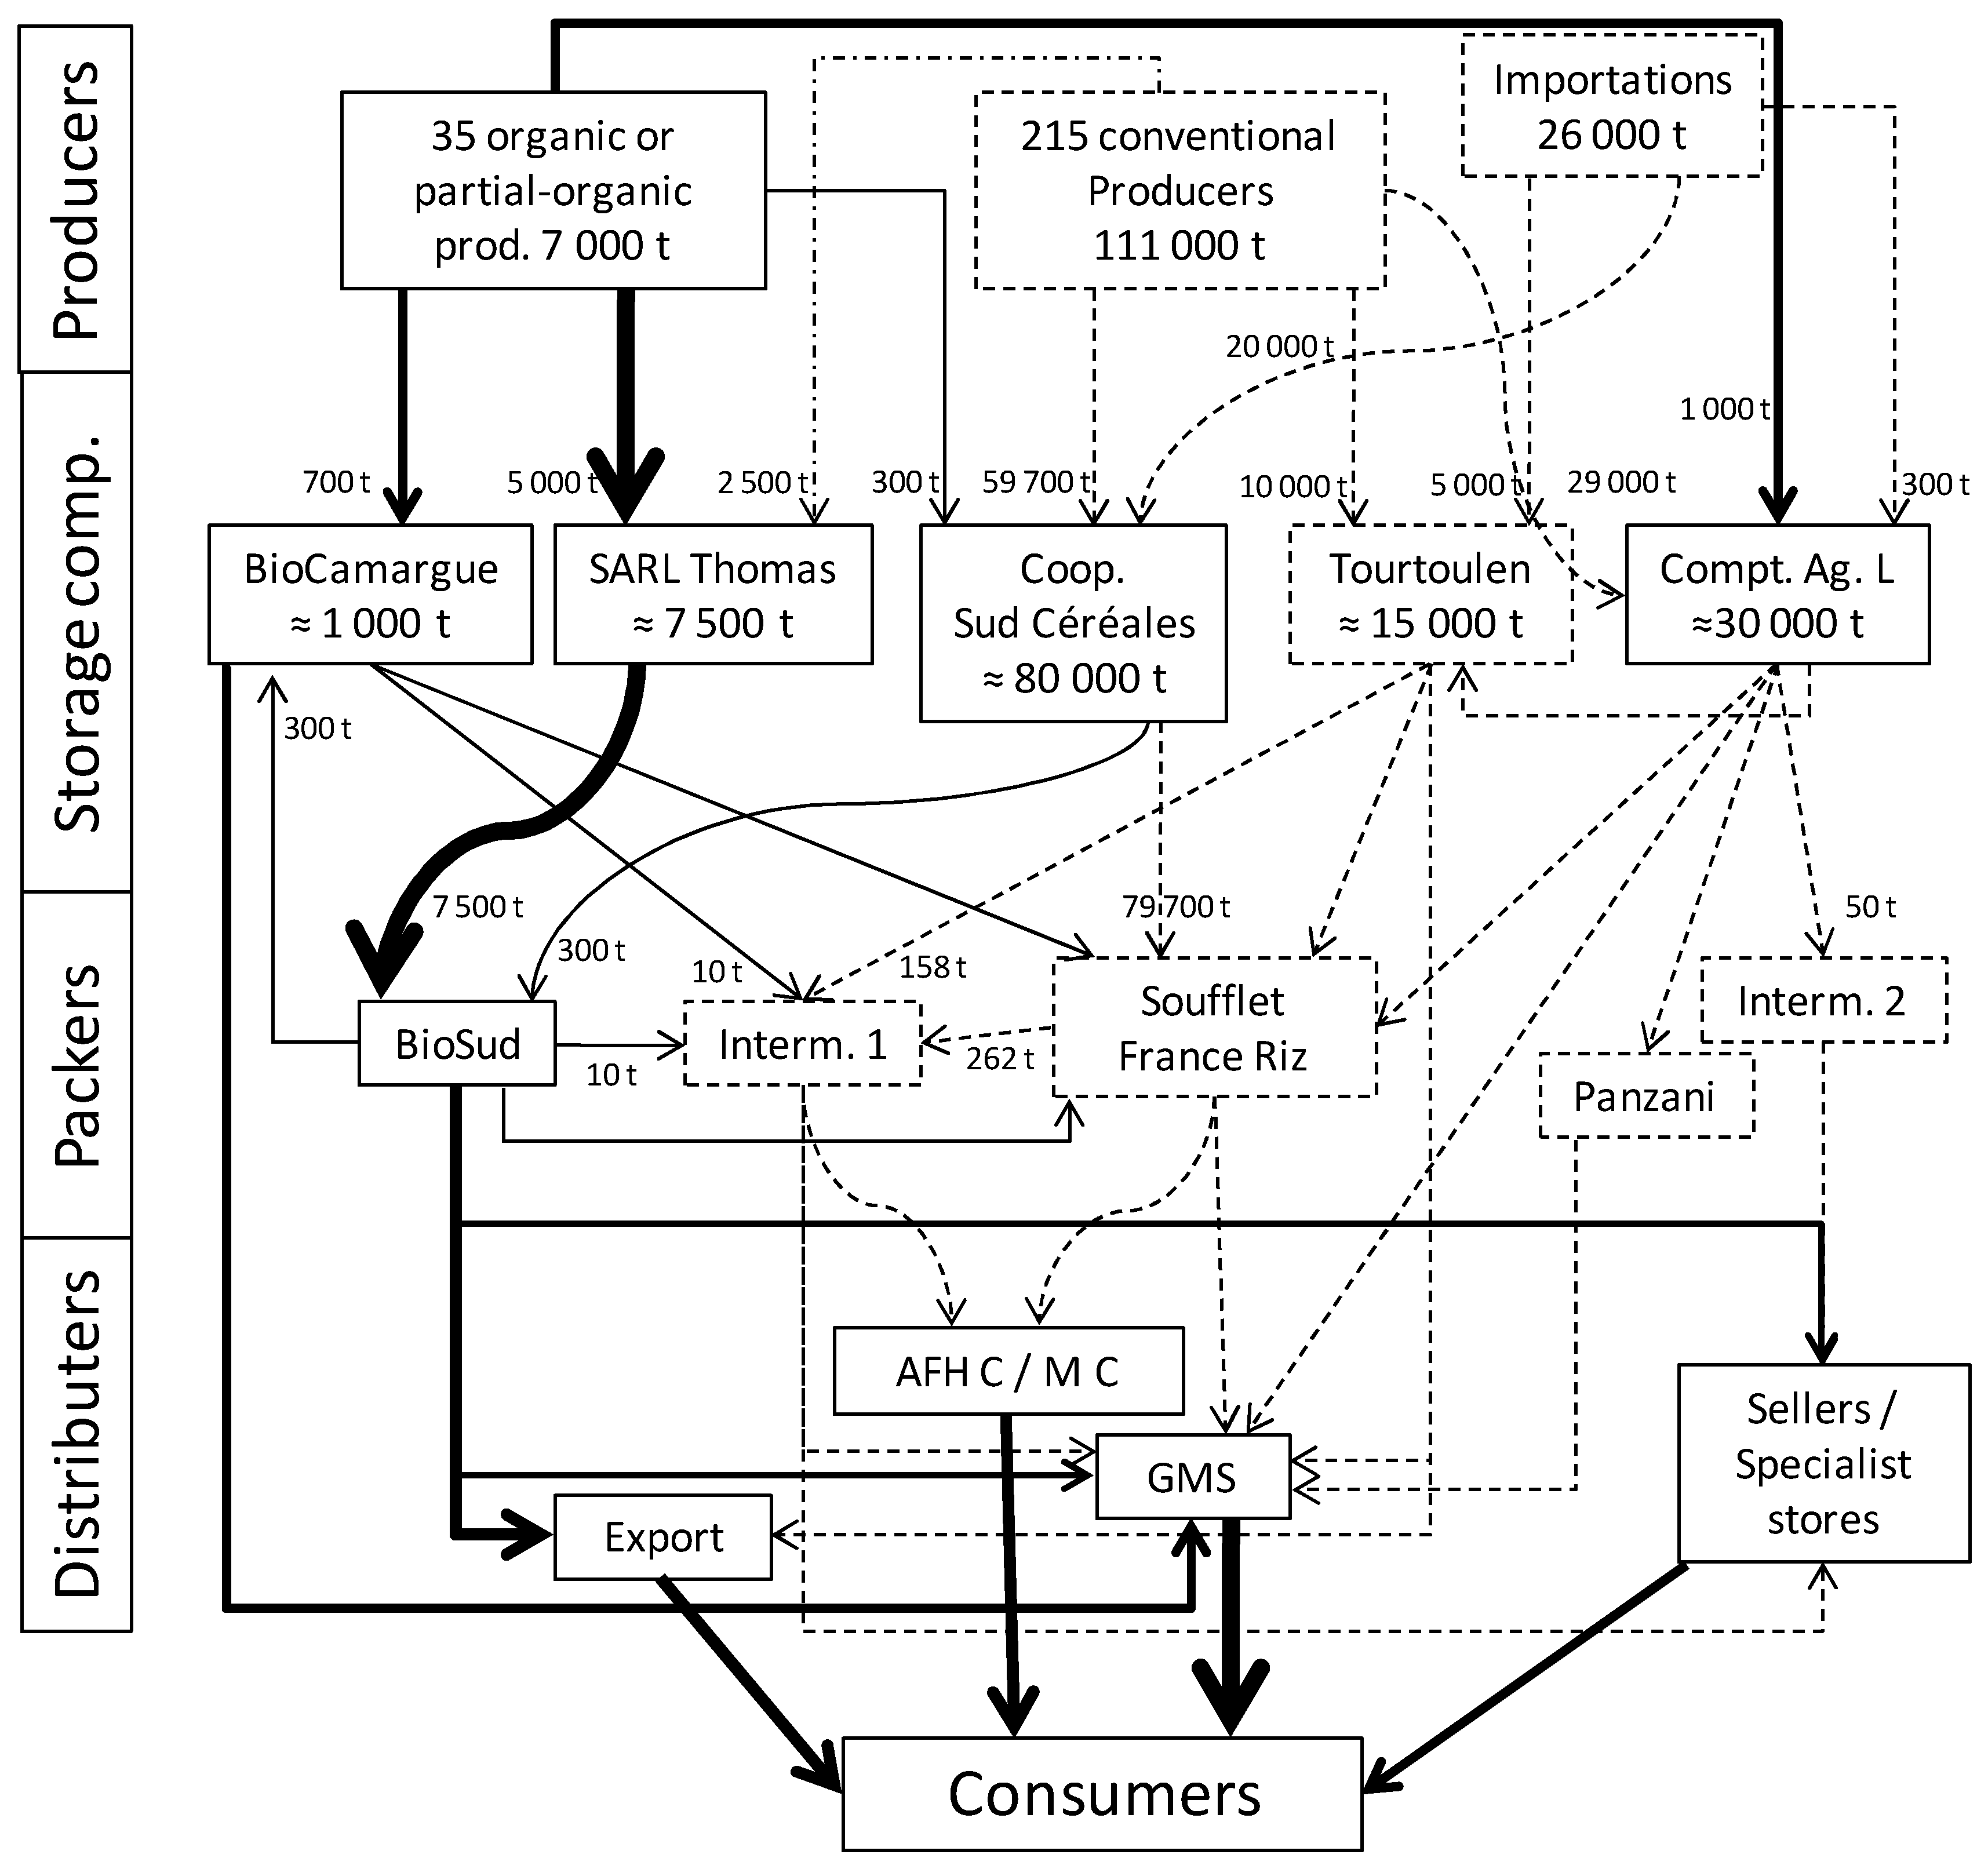
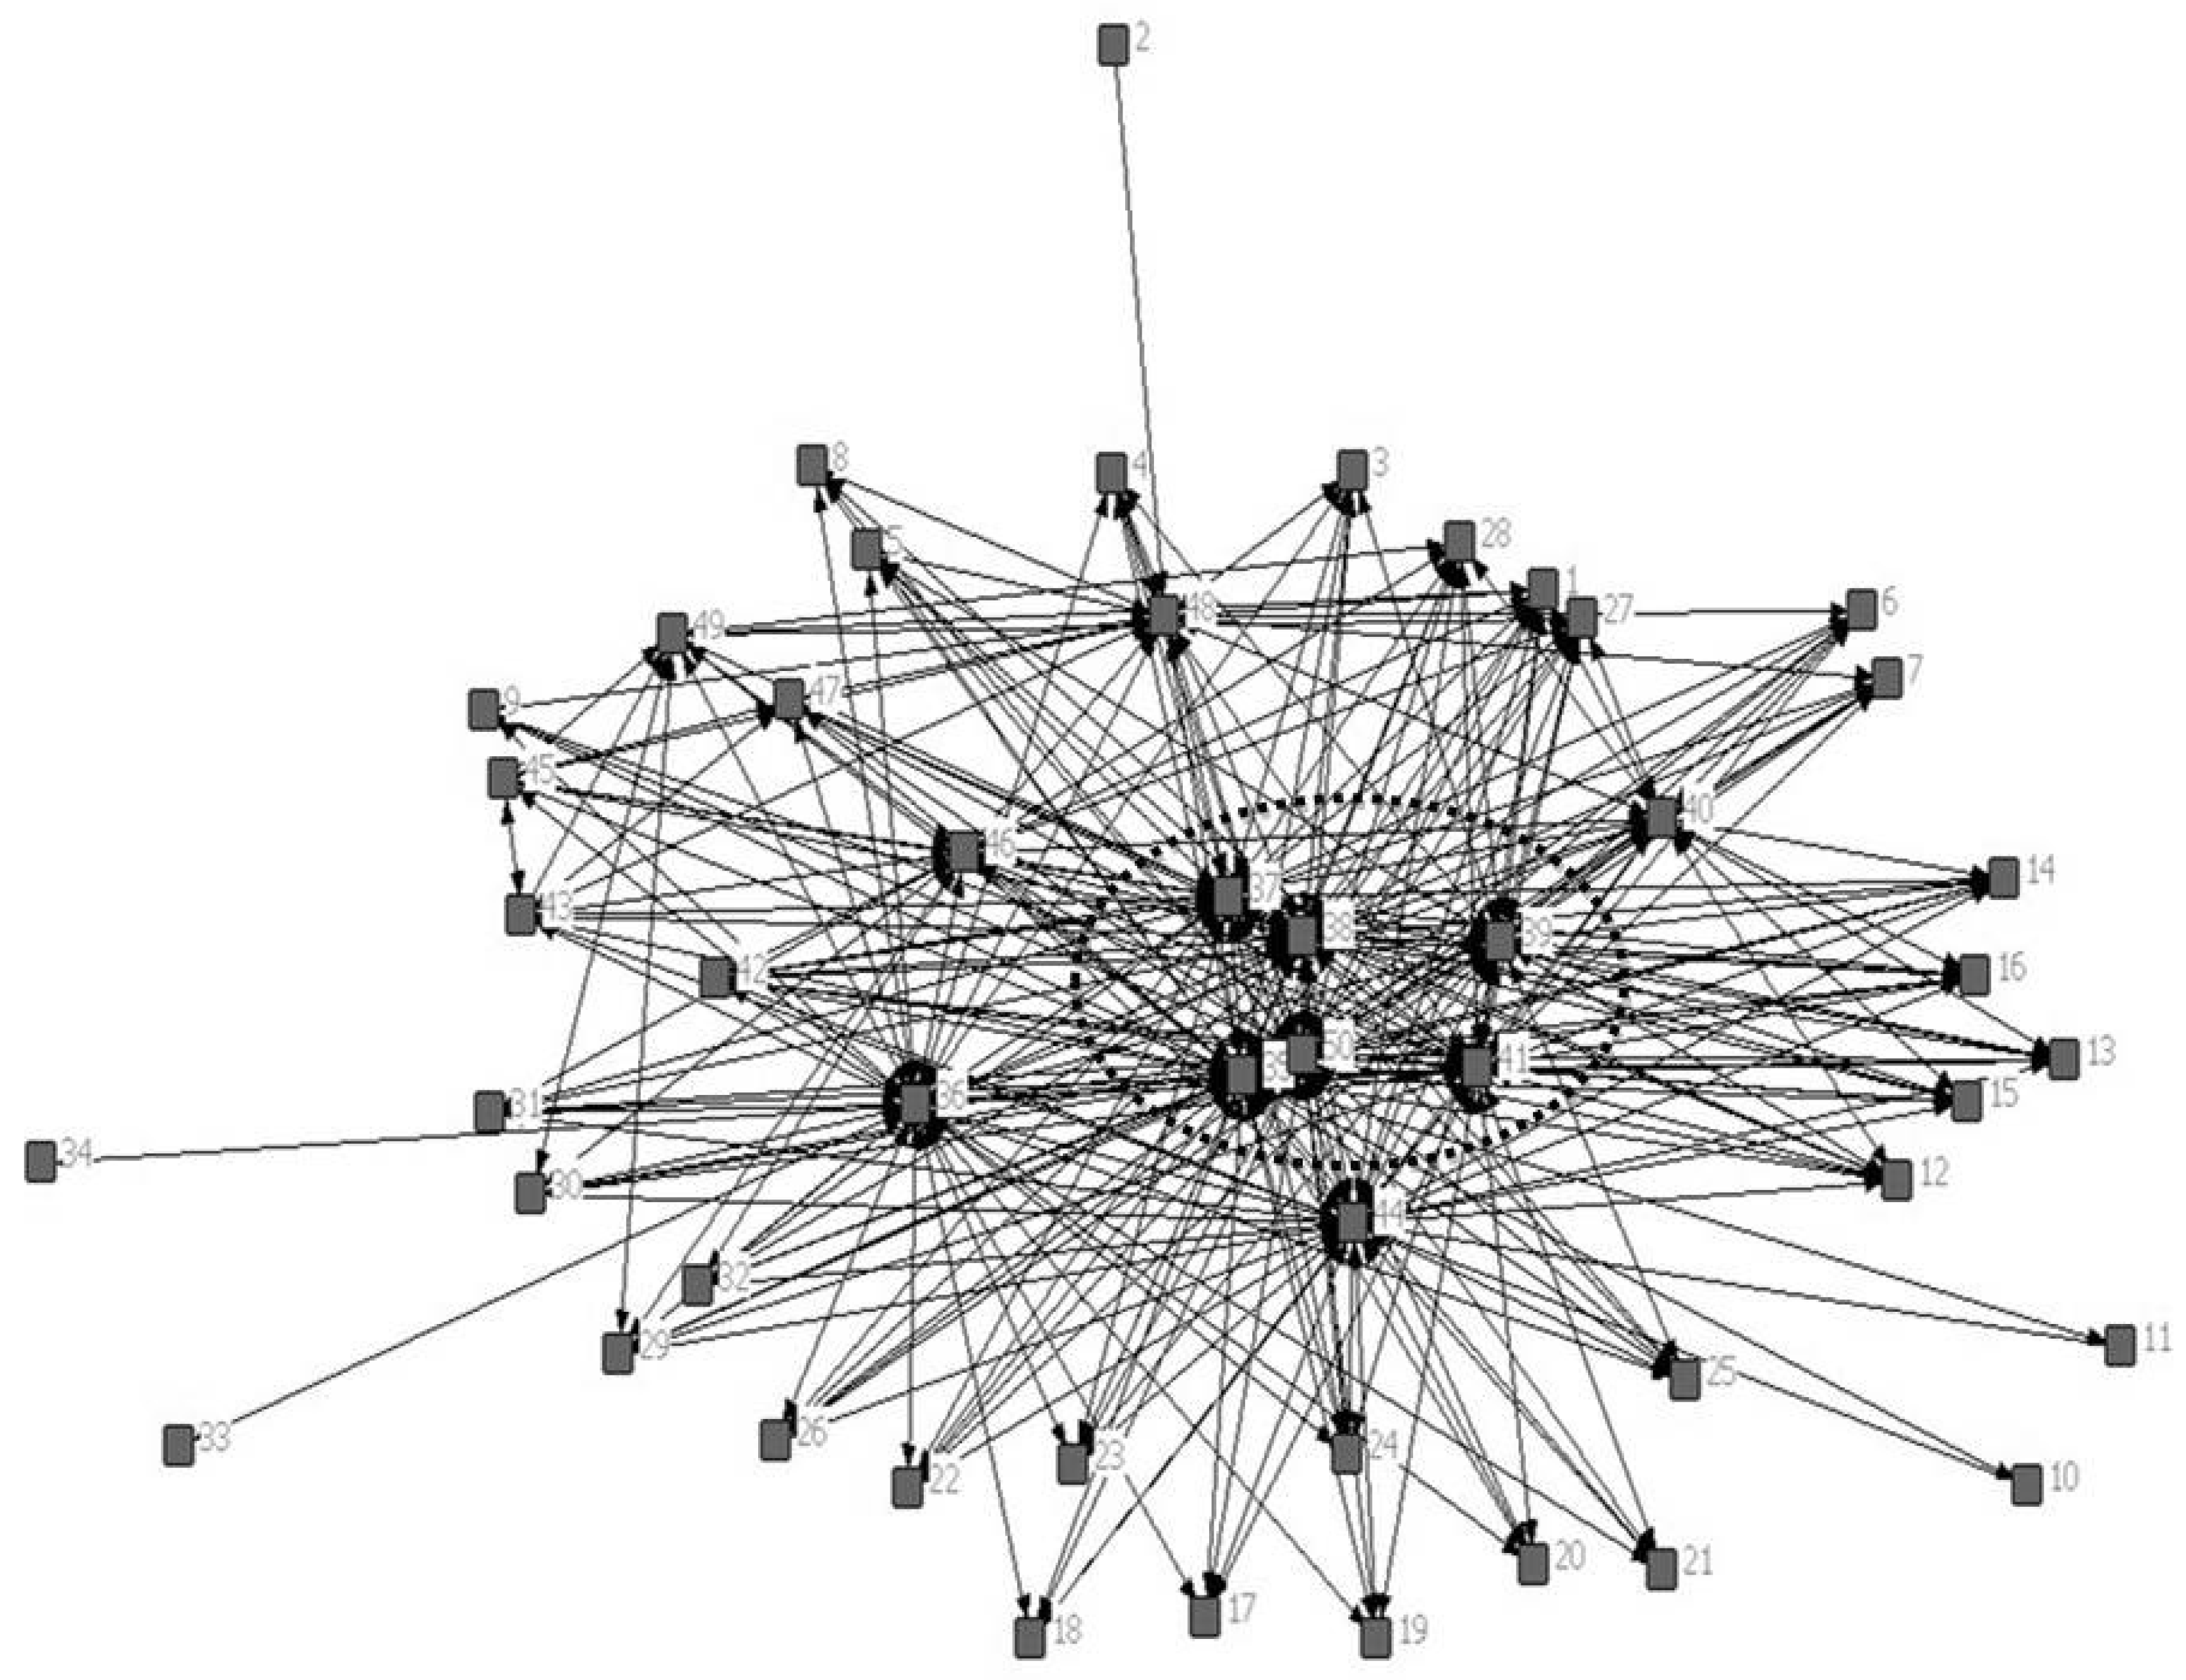
4.2. A Highly Centralised Organisation within a Diversified Network: The Case of the Camargue Organic Rice Value Chain

4.2.1. History and Mapping of Trade

Introduced to the Camargue at the end of the 16th century by Henry IV, rice farming took off in the 20th century [68]. The rice-farming area accounted for around 30,000 ha in 1958 but the opening of the markets rendered the Camargue rice particularly uncompetitive, especially in relation to Italian rice [69]. This, in turn, raised the problem of the salinization of the land and required the launch of a recovery plan with the development of irrigation infrastructures as well as an increase in the intervention price for rice [69]. The land in the Camargue is very low in relation to the sea level and is constantly subject to salt rising to the surface. As long as rice farming allows the land to be flooded by freshwater, these upward salt flows are blocked. These measures gave rise to a considerable increase in the area of land farmed, from around 9000 hectares in 1984 [70] to approximately 20,000 in 2013 [71]. Furthermore, value chain actors reported having tried themselves to overcome economic difficulties by creating the Camargue rice PGI (in 2000) and developing organic rice production (since the early 1980s).
According to organic rice traders, the Camargue organic rice value chain boasts some 35 producers with at least part of their rice farming land dedicated to organic production. The organic value chain is thus marginal compared to conventional rice and accounted for only 10% of rice-farming land in 2015. Organic rice came to the fore in 1980s and the storage actor SARL Thomas was reported to have played an important role by switching from conventional to organic rice. SARL Thomas declared that it collected approximately 2500t of “traditional” organic rice and 5000t of baby-food-certified rice (50% of which is organic) annually, primarily sold to Danone and Nestlé (Figure 3). The baby-food-certified rice is intended for the baby food market which implements highly restrictive specifications and takes absolutely no risks of the batches being contaminated. The other storage entities also reported handling organic rice, but they remain marginal. Nevertheless, the interviews conducted showed that the cooperative SudCéréales has special relations with SARL Thomas through the intermediary of BioSud. The latter was founded in 2003 with the aim of organising a specific value chain for organic rice and baby food dietetic rice, thus improving the performance of the value chain (according to representatives of BioSud). Finally, the Camargue witnessed the rise of Biocamargue, a subsidiary of the Ekibio group. The company reported that annually it collected around 1000t of organic rice from Camargue.
The producers in the organic value chain therefore have access to a diversified range of storage actors. Furthermore, different entities operate within the value chain, including the rice-farmers union (Syndicat des riziculteurs), the French Rice Centre (FRC), the Camargue Natural Reserve and various technical organisations (e.g., CIRAD and INRA).

4.2.2. Traditional Pillars of Sustainability

In addition to 100%-organic producers, the Camargue organic value chain includes partially-organic producers allocating a part of their farming activity to conventional production. The producer net margin is shown to be higher for 100%-organic farms (€756/ha of rice with single payment entitlements (SPE), and €320/ha without SPE) than for partially-organic farms (€664/ha with SPE, and €45/ha without SPE). This result reflects an increased dependence of partially-organic rice farmers on SPE compared to 100%-organic farmers and is consistent with the optimism of 100% organic producers with regard to the future of the CAP. If the aid allocated to rice were to be reduced, 100%-organic farms would be less inclined to decrease their rice rotations than the other producers. Furthermore, taking the entire rotation into account somewhat offsets the good income obtained by 100% organic farms. While the income for the rotation with SPE remains decent (€570/ha), it is low without SPE (€152/ha). As to the transmission of farms, it appears alarming from a social standpoint with very few farms able to say that they already have a potential successor (12%). Furthermore, farmers do enjoy a good quality of life.
As to the environmental dimension, it was decided to measure the treatment frequency index (TFI) and the toxicity index (TI) for the conventional part of partially-organic farms (it does not apply for the organic part). The average TFI is 2.5 for partially-organic farms, a value which is lower than that observed for conventional rice production (4.2), suggesting that partially-organic producers take the environment into greater consideration in their choice. The toxicity index of 132 compared to 323 in conventional farming confirms this trend. These results can be seen in the rhetoric of partially-organic farmers who are generally sensitive to reasoned agriculture. These results bear witness to a better protection of partially-organic farms with regard to possible outside “risks”, such as more stringent environmental demands on the part of the citizens or an increased greening of the CAP. Nevertheless, an analysis of the motivations underlying the choice to produce organically suggests that partially-organic rice farmers are not strongly committed to the organic production method, with all of them stressing a resolutely economic rationale in their choices. This situation may indicate a weakness in the organic value chain as it would be more vulnerable to economic hazards, in particular sale price fluctuations. Partially-organic producers could easily abandon this production model, thereby reducing the level of organic rice production, but the value chain can count on 100%-organic producers who are very attached to this mode of production.

4.2.3. Survivability

Network Characteristics

The Camargue organic rice value chain boasts good attributes with a limited distance of 1.8 between its actors and a cluster coefficient of 5.37. These attributes can be explained by the diversification strategies employed by the organic and partially-organic producers with regard to the storage companies, as well as those adopted by the storage companies themselves, which are conducive to a denser network (Figure 4). The analysis shows a strong influence of the cooperative SudCéréales on the network, with a betweenness centrality of 934. This can be explained by farmers’ diversified connections—in particular to SudCéréales, the main actor in the conventional rice value chain (which is connected to partially-organic producers, to BioSud and to SARL Thomas). The organic value chain thus retains a certain proximity to the conventional value chain. We note a strong organisation of the organic value chain around three entities—SudCéréales, SARL Thomas and BioSud—which form a genuine cluster within the Camargue organic rice network (clustering of 8.14 for these three actors together with their producer customers compared to 5.37 overall). Our analysis suggests that the “SudCéréales–SARL Thomas–BioSud” cluster wields the power over the Camargue organic rice network as two major components of this cluster (SudCéréales and SARL Thomas) have a high betweenness centrality score (respectively, 934 and 184 compared to 53 on average for the entire network). The force of the organic network also lies in the relationships maintained by the producers and storage companies with the peripheral stakeholders (e.g., the union, the French Rice Centre and the Camargue Natural Reserve) working to develop and promote (organic) rice farming in the Camargue.

Value Chain Governance and Survival Capacity

From an organisational point of view, the organic rice network has a high level of centrality through the presence of the “SudCéréales–SARL Thomas–BioSud” cluster. Despite the high density of relationships within the network, we observe a strong organisation of the system around this cluster. The organisation of the organic value chain may therefore be deemed a “participative” governance model. This value chain structure provides it with good arguments in terms of survival capacity. The high robustness of the network is suggested by the high share of the aggregate degrees of the actors involved in the “SudCéréales–SARL Thomas–BioSud” cluster (76%). Similarly, through the diverse connections of these actors to the different entities promoting Camargue rice, it is suggested that the network encourages a more fluid circulation of information and an increased reactivity. The distance between actors is rather low (1.8) compared to the einkorn value chain (2.39). This diversification shows a certain flexibility of the different actors, in particular with the storage companies trading amongst themselves to maintain the viability of the system and the producers who can choose between four outlets. The analysis nevertheless shows that, in the Camargue case, changing from the trader SARL Thomas to another one is not perceived as an easy process by farmers (all farmers said there are no “easy” alternatives”). However, all farmers stated that changing from SARL Thomas to another outlet would have a moderate or high negative impact on their business. Furthermore, the level of adaptivity of SARL Thomas concerning the baby food outlets is low as it is highly dependent on Danone and Nestlé, with no “easy” alternatives.

Summary

The characteristics of the network are summarised in Table 6.

5. Discussion and Conclusions

In this study, we tested an original approach to sustainability by investigating whether it could reinforce a traditional sustainability assessment for food value chains. Table 7 summarises the results for the traditional pillars of sustainability while Table 8 sums up outcomes in relation to the governance and survival capacity of the two value chains examined.
The organisational choice of the value chain provides a means of acting on its capacity for survival and guiding its choices in terms of environmental practices, economic strategies and social orientations. Our observations in the two cases studied show that, from the very outset, actors adopted a form of organisation aimed at ensuring the development and survival of their value chain. In the case of the PGI einkorn value chain, the analysis suggests a highly centralised organisation enabling the value chain to achieve very good performance from an environmental standpoint with very strict PGI specifications; from a social standpoint with the Bio Solidaire charter and a good quality of life for farmers; as well as from an economic standpoint with decent incomes for farmers. An analysis based strictly on indicators accounting for the three traditional pillars of sustainability would illustrate this very good performance but probably neglect the fragility of the value chain concerning organisational dynamics, since the structural properties as well as the study of dynamic systems are often neglected in the literature [72]. As shown by Janssen et al. [72], a network perspective improves the understanding and characterisation of a system’s sustainability or resilience by emphasising the ins and outs of interactions between the various system’s components. The network analysis highlighted a situation that could threaten the survivability of the einkorn value chain in the medium and long term. The analysis suggests that even though the PGI einkorn value chain boasts very good attributes regarding the traditional pillars of sustainability, it appears to have a limited capacity to cope with disruptive events (internal and external risks or vagaries) compared to the Camargue organic rice value chain. This situation is the result of a limited robustness, a poor network density placing the value chain governance in a “dictatorial” position, given the high centrality of a leading actor, and limited responsiveness (i.e., the capacity to react to any events), flexibility and adaptivity. That said, since the central organisation plays a role of leader in terms of sustainability, this situation is not such a negative scenario. Furthermore, while it was shown in the literature that the central influence of some actors combined with a low density induced the failure of the cheese producers union in Mexico [23], in the case of einkorn, actors’ relationships were earlier governed by trust—an informal means of coordination—which enabled a high level of social capital to be achieved in the network, where the development and protection of PGI einkorn was established as a priority. There are no straightforward relationships between the supposed quality of the network structure and systemic sustainability. This relationship is context-dependent, which is why it is important to collect qualitative information to deepen the analysis. Janssen et al. [72] showed that a system’s resilience can be increased in certain cases by a higher density of certain network components, but in other cases by a decrease in that density. The latter particularly applies when certain actors adopt opportunistic behaviour.
In contrast, in the Camargue organic rice value chain, the central power offset by a strong network with diversified, well-developed and tight connections a priori lends the value chain a certain solidity with the capacity to react to different vagaries. This, in theory, enables the value chain to be sustained, despite uncertain prospects (e.g., dependence of partially-organic farms on SPE). Similarly, Bell [73] showed that the level of innovativeness and performance of Canadian fund companies is positively linked to their degree of centrality in the industry cluster of Toronto. Furthermore, denser networks have not always been seen to favour a system’s resilience. For instance, the literature highlights the fact that the mere presence of “bonding” links might occur at the expense of resilience and that “bridging” links are more critical [74]. “Bonding” links (or weak ties) can decrease resilience as they can dictate binding social norms, increase network homophily and reduce accepted options for actors; diversity, on the other hand, enhances the capacity to react to the vagaries of the environment [74]. In the Camargue case, however, there are both “bonding” and “bridging” links, which lends greater power to its high density. Organic farmers are connected to quite diverse actors, and not only with those with which they work on a very regular basis. The close interdependency between the organic and conventional rice value chains in the Camargue also explains this diversity. A shift in the current situation towards a disadvantageous reform of the CAP (e.g., reduction of CAP payments) could nevertheless weaken the entire Camargue rice value chain. With the dual position of SudCéréales (centrally positioned both in the conventional segment and in the “SudCéréales–SARL Thomas–BioSud” organic cluster), it is likely that an alteration to the conventional rice value chain would affect the organic value chain, even though it may have the capacity to recover given its good network attributes. Furthermore, an economic reversal in terms of the selling price of organic rice could endanger the organic rice value chain in light of the low level of commitment of partially-organic farmers (their objective is primarily of an economic nature). However, fully organic producers are much more committed and the good network attributes might help partially-organic farmers to react and build a common strategy before envisaging a return to a fully conventional production mode. Here, a classical analysis of sustainability would probably also have failed to reveal the full extent of this complexity, i.e., the fact that traditional attributes of sustainability may be compensated by the capacity of the value chain network to foster innovation and learning processes as well as to react to environmental contingencies by mobilising internal resources and communicating efficiently between various actors.
The original approach tested in this paper makes it possible to consider the different links in the value chain in a single analysis involving the coordination of the actors. In the case of the Camargue organic rice value chain, the fact that the storage company SARL Thomas developed privileged relationships with the other storage companies (even with the cooperative SudCéréales mostly positioned in the conventional segment) facilitated the formation of a powerful cluster, a priori increasing the capacity of the value chain to develop and sustain over time. Krugman [75] highlighted the positive influence exerted by clusters of actors, both on information flow and knowledge spill-overs, in turn catalysing innovation, economic development and system survivability. In contrast, the exclusive relationship among SARL Tofagne, the Pichard mill and Euro NAT appears to weaken the PGI einkorn value chain. In fact, one sheller prefers to protect its supply by limiting resource-sharing with the other shellers, which may weaken the system’s survivability in the medium and long term. The literature stresses that actor coordination in value chains determines their competitiveness and their capacity to survive in the long term [41]. More crucial is the vast literature drawing on the notion of “coopetition” [76]. This term is defined as the combination of the competition and cooperation acting across enterprises or between companies [77]. Xueming et al. [77] found that “coopetition” improves the financial performance of companies from the standpoint of a learning mechanism resulting from market transactions. The success of a company requires both aspects in order to fulfil the common interests of that company [78]. In the einkorn case, “coopetition” is shattered by the predominance of a powerful and rather non-collaborative sheller.
The systemic sustainability approach tested in this paper places greater emphasis on actors’ relationships and coordination than a traditional analysis of sustainability, thereby enhancing the measurement and understanding of the resilience of food value chains. It nevertheless remains difficult to establish clear causal relations and to conclude that one type of organisation or another undoubtedly strengthens sustainability. The literature stresses that “significant differences in governance processes and outcomes can be expected among networks experiencing structural differences in terms of the density of relations, […] and degree of network centralization” [79] (p. 366). The approach presented in this paper must be tested further to ensure a better interaction of the different dimensions and increase its external validity. One way to achieve this would be to apply the approach to a range of case studies over a certain period to collect extensive empirical data capable of verifying the different suggestions made in this paper and revising the approach accordingly when necessary. It would be particularly important to collect systematic data on relationships at different periods during network development, a task which could be conducted in quasi-real time or retrospectively. The latter option requires that actors remember what happened in the past, but this can work when the network of actors is relatively small and if additional information is requested in order to increase the level of thinking when defining relationship intensity scores [34]. The recommendation to collect network data over time to better account for the resilience of systems is supported by Janssen et al. [72]. A broader range of sustainability indicators could also be used, drawing for example on the work of Schader et al. [53]. Finally, there is a need to define sustainability thresholds, i.e., values or qualitative characteristics below which the sustainability of the value chain would be threatened. A related idea would be to develop a diagnostic tool allowing the level of systemic sustainability to be predicted for different combinations of network characteristics and contextual features of food value chains.

Author Contributions

Conceptualization, P.M., F.L. and D.C.; Methodology, S.Q. and J-B.B.; Software, S.Q. and J.-B.B.; Validation, P.M., F.L. and D.C.; Formal Analysis, S.Q. and J.-B.B.; Data Curation, S.Q. and J.-B.B.; Writing-Original Draft Preparation, J.-B.B. and S.Q.; Writing-Review & Editing, S.Q. and P.M.; Supervision, P.M., F.L. and D.C.; Project Administration, P.M.

Funding

The research was funded by the French National Research Agency (ANR) grant number ANR-11-ALID-0006, within the framework of the Illiad project (Local and Innovative Initiatives for Sustainable Food). The overall Illiad project was coordinated by Sandrine Costa (INRA-MOISA) from 2012 to 2015.

Conflicts of Interest

The authors declare no conflict of interest.

References

  1. Dufumier, M.; Lallau, B. Agriculture et Développement Durable; Presses Universitaires du Septentrion: Villeneuve d’Ascq, France, 2010; pp. 38–41. [Google Scholar]
  2. Rangnekar, D. Remaking Place: The Social Construction of a Geographical Indication for Feni. Environ. Plan. A 2011, 43, 2043–2059. [Google Scholar] [CrossRef] [Green Version]
  3. Raynolds, L.T. Fair Trade: Social Regulation in Global Food Markets. J. Rural Stud. 2012, 28, 276–287. [Google Scholar] [CrossRef]
  4. Bean, M.; Sharp, J.S. Profiling Alternative Food System Supporters: The Personal and Social Basis of Local and Organic Food Support. Renew. Agric. Food Syst. 2011, 26, 243–254. [Google Scholar] [CrossRef]
  5. Ministère de l’Agriculture. Ambition Bio 2017, un Nouvel Horizon pour la Bio! Available online: http://agriculture.gouv.fr/chiffres-agriculture-bio (accessed on 10 June 2017).
  6. Fares, M.; Magrini, M.-B.; Triboulet, P. Transition Agroécologique, Innovation et Effets de Verrouillage: Le Rôle de La Structure Organisationnelle Des Filières. Cah. Agric. 2012, 21, 34–45. (In French) [Google Scholar]
  7. Foster, A.D.; Rosenzweig, M.R. Microeconomics of Technology Adoption. Annu. Rev. Econ. 2010, 2, 395–424. [Google Scholar] [CrossRef] [PubMed] [Green Version]
  8. Ministère de l’Agriculture. Les Enjeux de la Production Biologique en France. Available online: http://agriculture.gouv.fr/IMG/pdf/ANALYSE_CEP_50_Les_enjeux_de_la_production_d_agriculture_biologique_en_France_cle0b821c.pdf (accessed on 10 January 2015).
  9. De Ponti, T.; Rijk, B.; Van Ittersum, M.K. The Crop Yield Gap between Organic and Conventional Agriculture. Agric. Syst. 2012, 108, 1–9. [Google Scholar] [CrossRef]
  10. Seufert, V.; Ramankutty, N.; Foley, J.A. Comparing the Yields of Organic and Conventional Agriculture. Nature 2012, 485, 229–232. [Google Scholar] [CrossRef] [PubMed]
  11. Stringer, M.F.; Hall, M.N. A Generic Model of the Integrated Food Supply Chain to Aid the Investigation of Food Safety Breakdowns. Food Control 2007, 18, 755–765. [Google Scholar] [CrossRef]
  12. Neven, D. Developing Sustainable Food Value Chains: Guiding Principles; Food & Agriculture Organization of the United Nations (FAO): Rome, Italy, 2014. [Google Scholar]
  13. López-ridaura, S.; Keulen, H.V.; van Ittersum, M.K.; Leffelaar, P.A. Multiscale Methodological Framework to Derive Criteria and Indicators for Sustainability Evaluation of Peasant Natural Resource Management Systems. Environ. Dev. Sustain. 2005, 7, 51–69. [Google Scholar] [CrossRef] [Green Version]
  14. Lee, A. Health-Promoting Schools. Appl. Health Econ. Health Policy 2009, 7, 11–17. [Google Scholar] [CrossRef] [PubMed]
  15. Quatro, S.A.; Waldman, D.A.; Galvin, B.M. Developing Holistic Leaders: Four Domains for Leadership Development and Practice. Hum. Resour. Manag. Rev. 2007, 17, 427–441. [Google Scholar] [CrossRef]
  16. Fresco, L.O. Challenges for Food System Adaptation Today and Tomorrow. Environ. Sci. Policy 2009, 12, 378–385. [Google Scholar] [CrossRef]
  17. IPCC. Climate Change 2007: Appendix to Synthesis Report; Baede, A.P.M., van Der Lingen, P., Verbruggen, A., Eds.; IPCC: Geneva, Switzerland, 2007. [Google Scholar]
  18. Talamini, E.; Ferreira, G.M.V. Merging Netchain and Social Network: Introducing the Social Netchain Concept as an Analytical Framework in the Agribusiness Sector. Afr. J. Bus. Manag. 2010, 4, 2981–2993. [Google Scholar]
  19. Thadakamalla, H.P.; Raghavan, U.N.; Kumara, S.; Albert, R. Survivability of Multiagent-Based Supply Networks: A Topological Perspective. IEEE Intell. Syst. 2004, 19, 24–31. [Google Scholar] [CrossRef]
  20. Vurro, C.; Russo, A.; Perrini, F. Shaping Sustainable Value Chains: Network Determinants of Supply Chain Governance Models. J. Bus. Ethics 2010, 90, 607–621. [Google Scholar] [CrossRef]
  21. Christopher, M.; Peck, H. Building the Resilient Supply Chain. Int. J. Logist. Manag. 2004, 15, 1–14. [Google Scholar] [CrossRef] [Green Version]
  22. Giacomini, C.; Mancini, C. Organisation as a Key Factor in LocalisedAgri-Food Systems (LAFS). Bio-Based Appl. Econ. 2015, 4, 17–32. [Google Scholar]
  23. Crespo, J.; Réquier-Desjardins, D.; Vicente, J. Why Can Collective Action Fail in Local Agri-Food Systems? A Social Network Analysis of Cheese Producers in Aculco, Mexico. Food Policy 2014, 46, 165–177. [Google Scholar] [CrossRef]
  24. Jarosz, L. Understanding Agri-Food Networks as Social Relations. Agric. Hum. Values 2000, 17, 279–283. [Google Scholar] [CrossRef]
  25. Lazzarini, S.; Chaddad, F.; Cook, M. Integrating Supply Chain and Network Analyses: The Study of Netchains. J. Chain Netw. Sci. 2001, 1, 7–22. [Google Scholar] [CrossRef]
  26. Ulanowicz, R.E.; Goerner, S.J.; Lietaer, B.; Gomez, R. Quantifying Sustainability: Resilience, Efficiency and the Return of Information Theory. Ecol. Complex 2009, 6, 27–36. [Google Scholar] [CrossRef]
  27. Granovetter, M. The Impact of Social Structure on Economic Outcomes Social Networks and Economic Outcomes: Core Principles. J. Econ. Perspect. 2005, 19, 33–50. [Google Scholar] [CrossRef]
  28. Chiffoleau, Y.; Dreyfus, F.; Stofer, R.; Touzard, J.-M. Networks, Innovation and Performance. In Vertical Markets and Cooperative Hierarchies; Springer: Dordrecht, The Netherlands, 2007; pp. 35–60. [Google Scholar]
  29. Thuo, M.; Bell, A.A.; Bravo-Ureta, B.E.; Lachaud, M.A.; Okello, D.K.; Okoko, E.N.; Kidula, N.L.; Deom, C.M.; Puppala, N. Effects of Social Network Factors on Information Acquisition and Adoption of Improved Groundnut Varieties: The Case of Uganda and Kenya. Agric. Hum. Values 2014, 31, 339–353. [Google Scholar] [CrossRef]
  30. Lamine, C.; Meynard, J.-M.; Perrot, N.; Bellon, S. Analyse Des Formes de Transition Vers Des Agricultures plus Écologiques: Les Cas de l’Agriculture Biologique et de La Protection Intégrée. Innov. Agron. 2009, 4, 483–493. (In French) [Google Scholar]
  31. Kuhn, T.S. The Structure of Scientific Revolutions; University of Chicago Press: Chicago, IL, USA, 1970. [Google Scholar]
  32. Nemes, G.; High, C. Old Institutions, New Challenges: The Agricultural Knowledge System in Hungary. Stud. Agric. Econ. 2013, 115, 76–84. [Google Scholar] [CrossRef]
  33. Quiédeville, S.; Barjolle, D.; Mouret, J.-C.; Stolze, M. Ex-Post Evaluation of the Impacts of the Science-Based Research and Innovation Program: A New Method Applied in the Case of Farmers’ Transition to Organic Production in the Camargue. J. Innov. Econ. Manag. 2017, 22, 145. [Google Scholar] [CrossRef] [Green Version]
  34. Quiédeville, S.; Barjolle, D.; Stolze, M. Using Social Network Analysis to Evaluate the Impacts of the Research: On the Transition to Organic Farming in the Camargue. Cah. Agric. 2018, 27, 15012. [Google Scholar] [CrossRef]
  35. Earl, M.J.; Scott, L.A. Opinion: What Is a Chief Knowledge Officer? Sloan Manag. Rev. 1999, 40, 29. [Google Scholar]
  36. Scott, J. Social Network Analysis: A Handbook; SAGE Publications: London, UK, 2000. [Google Scholar]
  37. Wasserman, S.; Faust, K. Social Network Analysis: Methods and Applications; Cambridge University Press: Cambridge, UK, 1994. [Google Scholar]
  38. Vroegindewey, R.; Hodbod, J. Resilience of Agricultural Value Chains in Developing Country Contexts: A Framework and Assessment Approach. Sustainability 2018, 10, 916. [Google Scholar] [CrossRef]
  39. Powell, W.W.; Koput, K.W.; Smith-Doerr, L. Interorganizational Collaboration and the Locus of Innovation: Networks of Learning in Biotechnology. Adm. Sci. Q. 1996, 41, 116–145. [Google Scholar] [CrossRef]
  40. Rogers, E.M. Diffusion of Innovations; Free Press: New York, NY, USA, 1995. [Google Scholar]
  41. Wilson, N. The Supply Chains of Perishable Products in Northern Europe. Br. Food J. 1996, 98, 9–15. [Google Scholar] [CrossRef]
  42. Claro, D.P.; Hagelaar, G.; Omta, O. The Determinants of Relational Governance and Performance: How to Manage Business Relationships? Ind. Mark. Manag. 2003, 32, 703–716. [Google Scholar] [CrossRef]
  43. Storper, M.; Harrison, B. Flexibility, Hierarchy and Regional Development: The Changing Structure of Industrial Production Systems and Their Forms of Governance in the 1990s. Res. Policy 1991, 20, 407–422. [Google Scholar] [CrossRef]
  44. Porter, M.E. The Competitive Advantage of Nations; Free Press: New York, NY, USA, 1990. [Google Scholar]
  45. Dosi, G. Sources, Procedures, and Microeconomic Effects of Innovation. J. Econ. Lit. 1988, 26, 1120–1171. [Google Scholar]
  46. Harrison, B.; Kelley, M.R.; Gant, J. Innovative Firm Behavior and Local Milieu: Exploring the Intersection of Agglomeration, Firm Effects, and Technological Change. Econ. Geogr. 1996, 72, 233–258. [Google Scholar] [CrossRef]
  47. Scott, A.J. The Role of Large Producers in Industrial Districts: A Case Study of High Technology Systems Houses in Southern California. Reg. Stud. 1992, 26, 265–275. [Google Scholar] [CrossRef]
  48. Harrison, B. Industrial Districts: Old Wine in New Bottles? Reg. Stud. 1992, 26, 469–483. [Google Scholar] [CrossRef]
  49. Carayannis, E.G. Knowledge-Driven Creative Destruction, or Leveraging Knowledge for Competitive Advantage. Ind. High. Educ. 2008, 22, 343–355. [Google Scholar] [CrossRef]
  50. Aspara, J.; Hietanen, J.; Tikkanen, H. Business Model Innovation vs Replication: Financial Performance Implications of Strategic Emphases. J. Strateg. Mark. 2010, 18, 39–56. [Google Scholar] [CrossRef]
  51. Rigby, D.; Woodhouse, P.; Young, T.; Burton, M. Constructing a Farm Level Indicator of Sustainable Agricultural Practice. Ecol. Econ. 2001, 39, 463–478. [Google Scholar] [CrossRef]
  52. Zahm, F.; Viaux, P.; Vilain, L.; Girardin, P.; Mouchet, C. Assessing Farm Sustainability with the IDEA Method—From the Concept of Agriculture Sustainability to Case Studies on Farms. Sustain. Dev. 2008, 16, 271–281. [Google Scholar] [CrossRef]
  53. Schader, C.; Baumgart, L.; Landert, J.; Muller, A.; Ssebunya, B.; Blockeel, J.; Weisshaidinger, R.; Petrasek, R.; Mészáros, D.; Padel, S.; et al. Using the Sustainability Monitoring and Assessment Routine (SMART) for the Systematic Analysis of Trade-Offs and Synergies between Sustainability Dimensions and Themes at Farm Level. Sustainability 2016, 8, 274. [Google Scholar] [CrossRef]
  54. Pretty, J.N. Regenerating Agriculture: Policies and Practice for Sustainability and Self-Reliance; Joseph Henry Press: Washington, DC, USA, 1995. [Google Scholar]
  55. Gomez, A.A.; Swete Kelly, D.E.; Syers, J.K.; Coughtan, K.J. Measuring Sustainability of Agricultural Systems at the Farm Level. In Methods for Assessing Soil Quality; Soil Science Society of America: Madison, WI, USA, 1996; pp. 401–410. [Google Scholar]
  56. FranceAgriMer. Etude Coûts de Production Sur Le Riz Camarguais-Récolte 2011; FranceAgriMer: Limoges, France, 2011. (In French) [Google Scholar]
  57. Seyfang, G.; Smith, A. Grassroots Innovations for Sustainable Development: Towards a New Research and Policy Agenda. Environ. Politics 2007, 16, 584–603. [Google Scholar] [CrossRef]
  58. Parent, D.; Bélanger, V.; Vanasse, A.; Allard, G.; Pellerin, D. Method for the Evaluation of Farm Sustainability in Quebec, Canada: The Social Aspect. In Methods and Procedures for Building Sustainable Farming Systems; Springer: Dordrecht, The Netherlands, 2013; pp. 239–250. [Google Scholar]
  59. Gafsi, M.; Favreau, J. Appropriate Method to Assess the Sustainability of Organic Farming Systems. In Proceedings of the 9th European IFSA Symposium, Vienna, Austria, 4–7 July 2010. [Google Scholar]
  60. Halberg, N.; Verschuur, G.; Goodlass, G. Farm Level Environmental Indicators; Are They Useful? An Overview of Green Accounting Systems for European Farms. Agric. Ecosyst. Environ. 2005, 105, 195–212. [Google Scholar] [CrossRef]
  61. Picazo-Tadeo, A.J.; Gómez-Limón, J.A.; Reig-Martínez, E. Assessing Farming Eco-Efficiency: A Data Envelopment Analysis Approach. J. Environ. Manag. 2011, 92, 1154–1164. [Google Scholar] [CrossRef] [PubMed]
  62. Borgatti, S.P.; Everett, M.G.; Freeman, L.C. UCINET 6 for Windows: Software for Social Network Analysis; Analytic Technologies: Harvard, MA, USA, 2002. [Google Scholar]
  63. Heun, M.; Schäfer-Pregl, R.; Klawan, D.; Castagna, R.; Accerbi, M.; Borghi, B.; Salamini, F. Site of Einkorn Wheat Domestication Identified by DNA Fingerprinting. Science 1997, 278, 1312–1314. [Google Scholar] [CrossRef]
  64. Bogucki, P. The Spread of Early Farming in Europe. Am. Sci. 1996, 84, 242–253. [Google Scholar]
  65. Chabrol, D.; Bassene, J.B.; Fournier, S. Petit Épeautre de Haute-Provence: Quand l’IGP Est Le Pivot D’un Système Associant Différents Signes de Qualité. In Proceedings of the Symposium International sur L’agriculture Biologique Méditerranéenne et les Signes Distinctifs de Qualité liés à l’Origine, Agardi, Maroc, 2–4 December 2013. (In French). [Google Scholar]
  66. Clary, V. Projet Petit Épeautre 2014–2017; Syndicat des Producteurs de Petit Epeautre de Haute Provence: Mévouillon, France, 2013. (In French) [Google Scholar]
  67. Biopartenaire. Présentation. Available online: http://www.biopartenaire.com/ item/presentation.html (accessed on 4 April 2014).
  68. Cahier des Charges de la Dénomination «Riz de Camargue» Homologué par Arrêté du 18 Décembre 2013. Available online: https://www.legifrance.gouv.fr/jo_pdf.do?numJO=0&dateJO=20140107&numTexte=28&pageDebut=00191&pageFin=00191 (accessed on 5 July 2018). (In French).
  69. Mouret, J.-C. L’évolution Des Pratiques Agricoles En Relation Avec La Mise En Œuvre D’une Riziculture Durable. In 40 ans de Recherche au Service de la Gestion en Camargue: Actes du Forum Scientifique du 24 Septembre 2010; Parc Naturel Régional de Camargue: Bouches-du-Rhône, France, 2011. (In French) [Google Scholar]
  70. Chataigner, J.; Mouret, J.C. Recherche et Production Rizicole En France. Cah. Options Méditerranéennes 1997, 24, 117–126. (In French) [Google Scholar]
  71. Delmotte, S.; Lacombe, C.; Couderc, V.; Mailly, F.; Mouret, J.C.; Lopez-Ridaura, S.; Barbier, J.M. Obstacles, Levers and Impacts of Organic Farming Development in Camargue. Innov. Agron. 2013, 32, 213–226. [Google Scholar]
  72. Janssen, M.A.; Bodin, Ö.; Anderies, J.M.; Elmqvist, T.; Ernstson, H.; McAllister, R.R.J.; Olsson, P.; Ryan, P. Toward a Network Perspective of the Study of Resilience in Social-Ecological Systems. Ecol. Soc. 2006, 11, 15. [Google Scholar] [CrossRef]
  73. Bell, G.G. Clusters, Networks, and Firm Innovativeness. Strateg. Manag. J. 2005, 26, 287–295. [Google Scholar] [CrossRef]
  74. Newman, L.; Dale, A. Network Structure, Diversity, and Proactive Resilience Building: A Response to Tompkins and Adger. Ecol. Soc. 2005, 10, resp2. Available online: https://www.jstor.org/stable/pdf/26267768.pdf?refreqid=excelsior%3Aee545a164b0e3025b8119974710a9604 (accessed on 5 July 2018). [CrossRef]
  75. Krugman, P.R. Geography and Trade; Leuven University Press: Leuven, Belgium, 1991. [Google Scholar]
  76. Bouncken, R.B.; Gast, J.; Kraus, S.; Bogers, M. Coopetition: A Systematic Review, Synthesis, and Future Research Directions. Rev. Manag. Sci. 2015, 9, 577–601. [Google Scholar] [CrossRef]
  77. Xueming, L.; Slotegraff, R.J.; Pan, X. Cross-Functional “Coopetition”: The Simultaneous Role of Cooperation and Competition within Firms. J. Mark. 2006, 70, 67–80. [Google Scholar]
  78. Narver, J.C.; Slater, S.F. The Effect of a Market Orientation on Business Profitability. J. Mark. 1990, 54, 20–35. [Google Scholar] [CrossRef]
  79. Bodin, Ö.; Crona, B.I. The Role of Social Networks in Natural Resource Governance: What Relational Patterns Make a Difference? Glob. Environ. Chang. 2009, 19, 366–374. [Google Scholar] [CrossRef]
Figure 1. Diagram of the PGI einkorn value chain including interactions with other producers of non-PGI einkorn. The thickness of the arrows is proportional to the quantities traded. prod.-proc.: producer-processors; gt.: gross tons; t.: tons.
Sustainability 10 02344 g001
Figure 2. Network representation of the PEHP value chain. The graph was drawn using the Netdraw Ucinet software [62] and represents the interrelationships (non-directed) between actors on the basis of the information gathered during interviews. Producers are represented by circles, shellers by triangles and processors by squares. Tofagne SARL(SARLT.) emerges as the central actor in that network.
Sustainability 10 02344 g002
Figure 3. Diagram of the Camargue rice value chain. The actors in the organic rice value chain are denoted by solid lines while those in the conventional rice value chain are shown by dotted lines. The thickness of the line corresponds to the volumes traded. Compt. Ag. L, Comptoir Agricole du Languedoc; Interm., Intermediary; AFH C, away-from-home catering; MC, mass catering; GMS, large- and medium-sized supermarkets.
Sustainability 10 02344 g003
Figure 4. Network representation of the Camargue organic rice value chain. Main actors located in the dotted circle: SudCéréales, SARL Thomas, rice-farmers union and Camargue Natural Reserve. The graph was drawn using the Netdraw Ucinet software [62].
Sustainability 10 02344 g004
Table 1. Matrix of governance models.
Influence of the Central Actor (s)
LowHigh
Density of the actor networkLow“Transactional”“Dictatorial”
High“Acquiescent”“Participative”
Source: Adapted from Vurro et al. [20].
Table 2. The actors interviewed.
Actors Interviewed from the PGI Einkorn Value ChainActors Interviewed from the Camargue Rice Value Chain
Upstream actors- 7 elected representatives of the PGI einkorn union
- 19 producers of PGI einkorn
- 4 fully-organic producers
- 3 partially-organic producers (share of fields farmed organically)
- 9 conventional producers
Downstream actors- 2 approved PGI shellers/millers
- 1 PGI einkorndistributer (Euro Nat)- 6 Einkorn sellers
- 4 storage companies (SARL Thomas, Madar, Biocamargue and SudCéréales)
- 2 packers (BioSud, Soufflet group)
Organisations- Biopartenaire
- Coop COCEBI
- Bio82
- Camargue Natural Reserve
- Chamber of Commerce and Industry
Table 3. Indicators selected to inform the classical pillars of sustainability.
Pillars of SustainabilityIndicators of SustainabilityMeaning of the IndicatorsData Collected
Socio-economicNet producer margin [54,55]. This indicator highlights notions of ethics (fair compensation) and performance. Organic farmers were first asked to describe their crop rotation from the previous year. We then asked the yields and sales prices for the different crops. The net producer margin was then calculated by deducing production costs from the turnover (yield * sales prices). In the case of the Camargue, production costs for organic rice were derived from a study conducted by FranceAgriMer [56]. For the other crops, the following hypotheses were made: maize (€1800/ha), sorghum (€1700/ha), conventional wheat (€1700/ha), organic wheat (€1500/ha), alfalfa (€1500/ha), and temporary grassland (€1200/ha).
As for the Einkorn case, the production costs were calculated based on the interviews with farmers: costs of all inputs applied and cost of machinery use (for all operations).
Yield level and variability [55].Output per hectare and variability over years. Organic farmers were asked directly about the yields of the different crops. The yield variability was evaluated in a more qualitative way: organic farmers were asked to state whether they are regularly faced with significant production falls; and if yes to what degree and how often (on average).
Dependence on the CAP, understood here as a way to account for the level of farm autonomy [52,54].Level of support from the CAP in relation to the level of income. A decline in farmed areas following a decrease in the CAP might significantly weaken the value chain.This factor was only considered in the Camargue case. We used the French website Telepac where subsidies given to organic farmers are publicly available. The same sample as the organic farmers interviewed was used. The dependence on the CAP was calculated as the difference between the net margin with and without CAP payments, both for the rotation and for rice only.
Commitment to sustainable and alternative production schemes [57].Producers not heavily involved may represent a weakness for a value chain; a high level of commitment relies on non-economic rationales.We asked organic farmers to rank their motivations to produce organically, from the most to the least important. They could choose from the following items: respect for the environment, social pressure, resilience of the farm, better revenue, and other reasons (specified where applicable).
In the Camargue case, organic farmers were also asked whether they could easily abandon their organic production mode in the event of economic difficulties, e.g., decrease in the selling price.
Quality of life [52].Ethics and human development.Organic farmers were asked to give a general quality of life score from 0 to 10 (10 being the highest possible score) in the Camargue case. In the einkorn case, farmers were asked to say if their quality of life is average, good or very good.
Transmissibility of farms [58,59].Viability of the sector and transmission of know-how to future generations; the share of farms with a successor in mind was calculated.Organic farmers were asked whether they already know who will take over the farm. The percentage of positive and negative answers was then calculated.
EnvironmentTI (toxicity index) [60].
TFI (treatment frequency index) [61].
T I = A p p l i e d   d o s e A u t h o r i z e d   d o s e
T F I = Q t y   o f   p r o d u c t D L 50 L a n d   k
Assessed through the use of chemical inputs, which is zero in the case of einkorn.
For the rice value chain, both organic and conventional farmers were asked to explain their practices in terms of chemical treatments: the name of the products and the dosage applied. The certified dosage as well as the toxicity (LD50) of the molecules used was found on the French E-Phy website.
Table 4. SNA indicators used to inform attributes of governance and the survival capacity of value chains.
Definition of the AttributesIndicators Used to Measure AttributesTools and Methods Used
Attributes of value chain governance
CentralityPropensity of a central stakeholder to connect unconnected members.By the indicator of betweenness centrality, which refers to the extent to which an agent can play the role of a “broker” or “gatekeeper” with a potential for control over others.Ucinet Software.
Graph analysis [62].
DensityRelational thickness.This attribute is also an indicator, which can be calculated based on a matrix of actors’ relationships.Ucinet Software.
Graph analysis.
Attributes of the survival capacity of the value chain
RobustnessAbility to cope with attacks.The clustering coefficient and betweenness centrality are used to identify the central organisation(s) of the network. The size of the larger component is estimated by dividing the aggregate degrees of the actors involved in it by the total sum of degrees from the overall network.Ucinet Software.
Graph analysis.
Responsiveness and distance Rapidity of responses to shocks.Calculated by the indicator of distance (a short distance between actors is conducive to a high degree of responsiveness).Ucinet Software.
Graph analysis.
FlexibilityNumber of alternative pathways.Number of alternative suppliers and outlets for producers and storage companies.Map of actors and in-depth interviews with actors. As explained earlier, the actors interviewed were asked to specify their suppliers and outlets. The question asked to measure the adaptivity was as follows: “If this actor were to collapse, would it be easy to change partner? (All suppliers and outlets were evaluated). The numbers of “easy” alternatives were then calculated. In the Camargue case, actors were also asked whether changing from one partner to another would have a low, moderate or high impact on their business.
AdaptivityDegree of facility to change value chain partners.Capacity to easily change suppliers and outlets for producers and storage companies.
Table 5. Characteristics of the einkorn chain network.
Network Factors of Systemic SustainabilityResult (Value or Characterisation)
Density0.14
Distance2.39
Betweenness centrality SARL Tofagne170
Betweenness centrality (average)14
RobustnessLow
ResponsivenessAverage
FlexibilityLow
AdaptivityLow
Governance model“Dictatorial”
Table 6. Characteristics of the organic rice chain network.
Network Factors of Systemic SustainabilityResult (Value or Characterisation)
Density0.54
Distance1.8
Betweenness centrality SARL Thomas184
Betweenness centrality SudCéréales934
Betweenness centrality (average)53
Cluster coefficient (“SudCéréales–SARL Thomas–BioSud” cluster)8.14
Cluster coefficient (average)5.37
RobustnessHigh
ResponsivenessRather high
FlexibilityHigh
AdaptivityAverage
Governance model“Participative”
Table 7. Summary of results for the traditional pillars of sustainability in the two value chains.
Pillars of SustainabilityIndicators of SustainabilityResults in the PGI Einkorn Value ChainResults in the Camargue Organic Rice Value Chain
Socio-economicNet producer margin Good
Yield level and variabilityLow level and variabilityAverage level and variability
Dependence on the CAP Not relevant Low for organic and average for partially-organic producers
Commitment to the production modeHighHigh for organic producers and low for partially-organic producers
Quality of life Good
Transmissibility of farms Not prepared by the majority of producers
EnvironmentTI (toxicity index) Null (due to the PGI specifications)Significant reduction for partially-organic farmers
TFI (treatment frequency index)
Table 8. Summary of results concerning the governance and survival capacity of the two value chains.
Attributes of Governance and Survival Capacity of Value ChainResults in the PGI Einkorn Value ChainResults in the Camargue Organic Rice Value Chain
Value chain governance
CentralityHighHigh
DensityLowHigh
Governance model“Dictatorial”“Participative”
Survival capacity of value chain
RobustnessLowHigh
ResponsivenessAverageRather high
FlexibilityLowHigh
AdaptivityLowAverage

