Article

Dispersion, Workability and Mechanical Properties of Different Steel-Microfiber-Reinforced Concretes with Low Fiber Content

State Key Laboratory of Disaster Reduction in Civil Engineering, Tongji University, 1239 Siping Road, Shanghai 200092, China
*
Author to whom correspondence should be addressed.
Sustainability 2018, 10(7), 2335; https://doi.org/10.3390/su10072335
Submission received: 14 June 2018 / Revised: 27 June 2018 / Accepted: 3 July 2018 / Published: 5 July 2018
(This article belongs to the Special Issue Sustainable Construction and Building Materials)

Abstract

:
Steel-microfiber-reinforced concrete has been proven to be an effective type of hybrid fiber-reinforced concrete (HyFRC). The microfiber used in these concretes generally include microfilament steel (MS) fibers and synthetic fibers, such as polypropylene (PP), polyvinyl alcohol (PVA), and polyacrylonitrile (PAN) fibers. This study aims to obtain the optimal type of steel-microfiber HyFRC, with low fiber content, which can be easily used in engineering projects without special fabrication procedures, thus achieving the concept of sustainability. Four types of HyFRC that blend steel (S) fiber with MS, PP, PVA and PAN were studied. These HyFRC were compared through a systematic experimental campaign in which the fiber dispersion, mixture workability, and concrete mechanical properties were investigated. The experimental results of the fiber dispersion and mixture workability indicate the following qualitative relationship: MS > PVA ≈ PP > PAN. For the mechanical properties of the concretes, the S-MS, and S-PVA HyFRCs generate an overall higher enhancing effect than those of the S-PP and S-PAN HyFRCs and show a positive hybridization effect for most properties. The S-MS HyFRC is superior in strength, and the S-PVA HyFRC has a significantly improved toughness. Because PVA has relatively good dispersion and workability properties, and toughness is the most important and effective mechanical property in the fiber-reinforced concrete, this study recommends that the S-PVA HyFRC is the optimal type of steel-microfiber HyFRC.

1. Introduction

Concrete is the most widely used material in civil engineering and consumes a large amount of energy every year. Unfortunately, concrete is also a type of brittle material and is easy to crack under tensile or flexure force. To reduce the energy consumption and achieve a sustainable design, two innovative concretes are being developed. One is recycled aggregate concrete [1,2], which uses crushed concrete as a coarse aggregate to reuse the material; the other one is high performance concrete [3,4,5], which reduces the chance of concrete replacement by enhancing the mixture properties, especially the tensile/flexure performances. This study focuses on the latter method.
Hybrid fiber-reinforced concrete (HyFRC) has been demonstrated to be a high performance concrete that mixed fibers of different types or sizes into the concrete simultaneously [6,7]. Compared to mono fiber-reinforced concrete (FRC), the HyFRC is more effective because it can control the crack propagation in multi-phase and multi-level. Generally, concrete mixture with high fiber content usually produces better mechanical properties, but increases time to consolidate [8]. Therefore, special fabrication procedures are needed, such as using customized mix machines and performing strict mixing processes. The additional special care regarding the fabrication procedures limits the material’s application in engineering. To solve this problem, Hossain et al. [9] and Jen et al. [10] developed an appealing method by adding viscosity modifying admixture (VMA) into the mixture to increase its workability. However, this would further complicate the fabrication process and increase the material cost. Another method to achieve a balance is to optimize the mechanical properties with an acceptable reduction in workability, leading to a low fiber content. The American Concrete Institute (ACI) report ACI 544.1R-96 [11] recommended an allowable fiber content less than two percent by volume. Jen et al. [10] noted that even under these restrictions, extra care must be given to ensure satisfactory consolidation during concrete pouring. Therefore, HyFRCs with a total of 1.1% fiber content are used in this study. Although the mechanical properties of the low-fiber-content HyFRCs may be less attractive than HyFRC mixtures with higher fiber contents, the HyFRCs studied in this paper are more economically efficient, consumes less energy, and are much simpler to fabricate in engineering applications, thus approaching the concept of sustainability.
Development in the fiber-reinforcement industry has provided various fiber types. The most commonly used fibers to reinforce concrete are steel fibers (S), carbon fibers (C) and synthetic fibers [12], which include polypropylene fibers (PP), polyvinyl alcohol fibers (PVA), and polyacrylonitrile fibers (PAN). Many studies have been conducted on the hybridization of these fibers. Blunt and Ostertag [8] developed a deflection hardening mixture by combining steel fiber and PVA fiber. Xu et al. [13] conducted an orthogonal experiment of S-PP HyFRC and found that the enhancing effect of hybrid fiber is much better than that of a single fiber. Park et al. [14] studied the behavior of HyFRCs with macro steel fiber mixed with microfilament steel fiber (MS). Although a positive hybridization effect is observed with various fiber combinations, they may have different efficiencies, which raises the issue of determining the optimal fiber combination for HyFRC.
Existing research comparing different types of HyFRC focuses on limited mechanical properties. For example, Lawler et al. [15] investigated the flexural behavior of S-MS and S-PVA HyFRCs; Yao et al. [16] compared C-PP, C-S, and S-PP HyFRCs with identical total fiber fractions in terms of their compression, splitting tensile and flexural behavior; Kim et al. [17] studied the flexural behavior of four types of S-MS HyFRC with different types of steel fiber. In particular, very little information is available about the fiber dispersion, despite the fact that uneven distribution would result in an increase in the initial defects or induce negative effects on the base concrete properties [18,19]. In addition, because the direct tensile test has been found to be challenging [20], most research on HyFRC uses splitting tensile strength test or a flexure test to indirectly evaluate the mixture tensile property. Therefore, the existing research cannot convincingly provide an optimal combination among the many options, and a more comprehensive experimental study is needed and consequently investigated in this study.
Among the various fiber types, steel fiber has been proven in many studies to be effective in improving the concrete behavior [21,22,23,24,25], especially tensile properties [26,27]. Further, micro synthetic fibers have become more favorable in recent years [28]. PP, PVA and PAN are three synthetic fibers that were recommended in the Chinese technical specification CECS 38: 2004 [29]. The results of Park and Kim’s work [14,17] also indicate that a mixture of macro steel fiber and microfilament steel fiber increases the mechanical performance of concrete.
In this research, the following four types of HyFRCs were considered in an experimental study: S-PP HyFRC, S-PVA HyFRC, S-PAN HyFRC, and S-MS HyFRC. Five corresponding mono FRCs and two plain concretes were also used to obtain baseline results for this systematic study. The synthetic fibers and MS used in this study are microfibers. This study aims to find the most effective type of steel-microfiber HyFRC for engineering applications by comparing the fiber dispersion, mixture workability and concrete mechanical properties of the tested concretes. The mechanical properties considered in this study are as follows: cubic compressive strength, prism compressive strength, splitting tensile strength, direct tensile strength, elastic modulus, compressive stress–strain curve, and tensile stress–strain curve.

2. Experimental Details

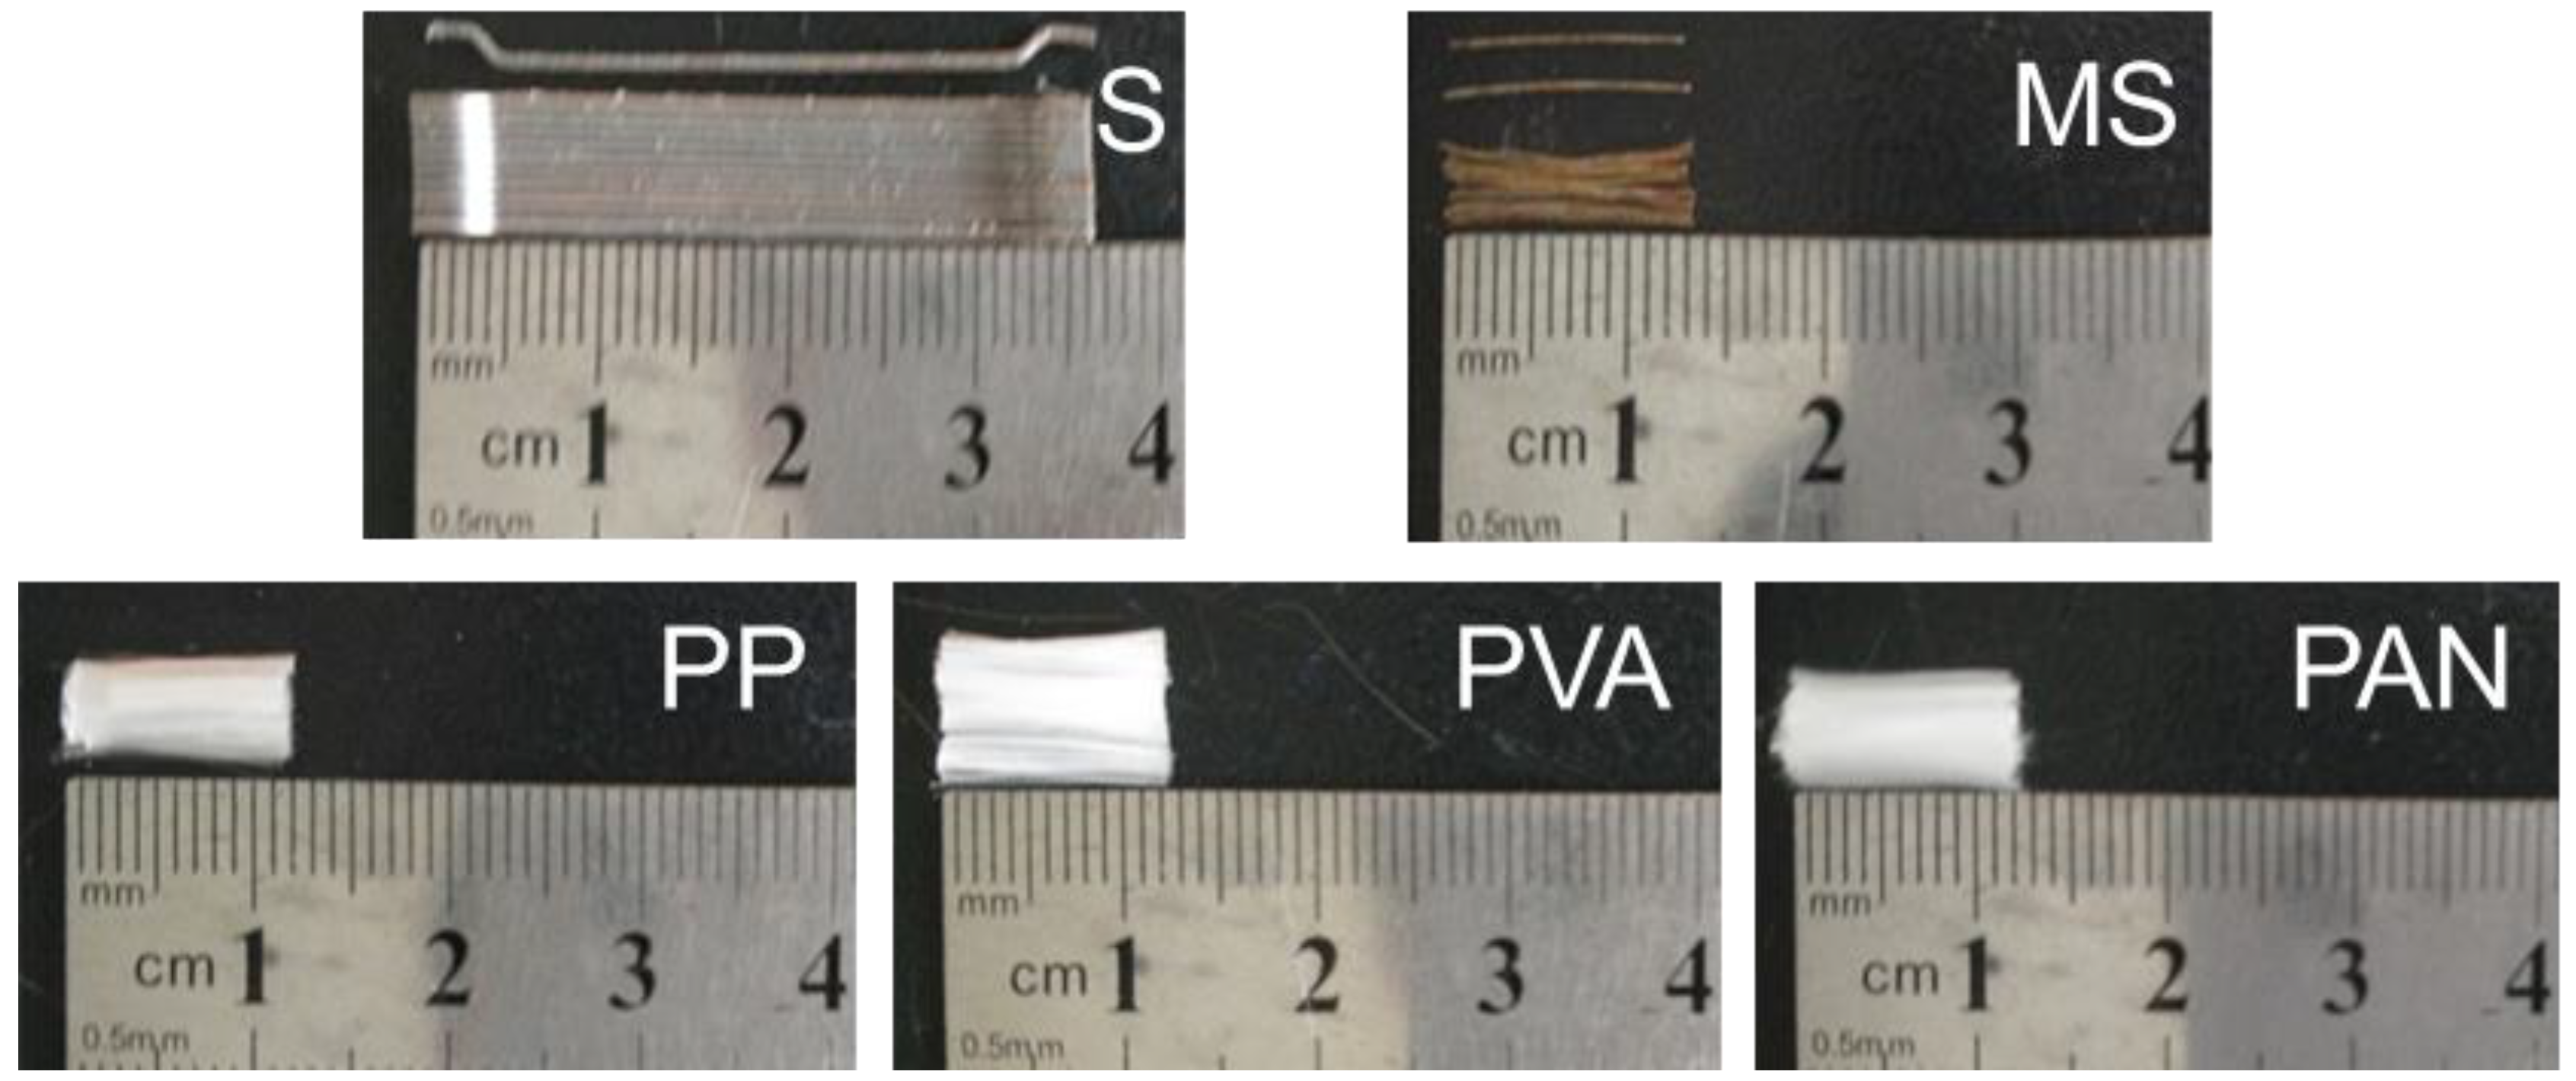
2.1. Materials and Test Groups

Normal Portland cement with a compressive strength of 45 MPa at 28 days of curing and an apparent density of 3015 kg/m3 was used as the base paste material. The coarse aggregate (crushed stone) had sizes of 5~20 mm and an apparent density of 2620 kg/m3. River sand with a fineness modulus of 2.8 and an apparent density of 2640 kg/m3 was used as the fine aggregate. A polycarboxylic water-reducing agent with a 20% water-reducing rate was used in this study, and the recommended dosage was 0.6% to 1.0% by cement mass.
Table 1 shows the abbreviations and properties of the fibers that were used in this research. Three synthetic fibers and an MS fiber were compared according to their effects on the concrete performance under the following two conditions: used alone and blended with S fiber. The lengths of the four fibers were approximately 12 mm to achieve the objective of variable control. The S fibers had end hooks and lengths of 35 mm. The MS is smooth with no end hooks. The designed aspect ratios of the S and MS were both 65. The shape and dimensions of the fibers in this study are shown in Figure 1.
Table 2 shows the mix proportion of all the test groups in this study. P1 and P2 denote the two plain-concrete test groups. The volume content of the S fiber was 1%. For the MS, PP, PVA, and PAN, the volume content was 0.1% in both the FRC and HyFRC. The mix proportion of the benchmark concrete, P1, was designed according to a standard mix design method to guarantee good workability. To reduce slump loss induced by S fiber, the binary superposition method [30,31,32,33] was used for the mix proportion design for the test groups that included S fiber. The binary superposition method divides the steel FRC into the following two parts: (a) S fiber with added cement paste and (b) base concrete. Furthermore, this method considers the S fiber as another type of course aggregate in the calculation of the sand ratio to consider the effect of the S-fiber volume on the sand ratio [30]. Because of the difference in the mix matrix with and without S fiber, the groups were classified into the following two categories: (a) test groups without S fiber, which included P1, MS, PP, PVA, and PAN, and (b) test groups with S fiber, which included P2, S, S-MS, S-PP, S-PVA and S-PAN. P1 was used as a control for those without S fiber. P2 and the S group had identical base mix matrices, but P2 had no fiber. In the mix proportion design, the volumes of the synthetic fiber and MS are also considered course aggregate in the sand ratio formula [34]. However, their effect on the mix matrix is insignificant because of their minor volume content.

2.2. Mix Procedure

The raw materials were stirred using a 60-L-capacity forced mixer. The mixing procedure is as follows: (1) add the coarse aggregate and steel fiber into the mixer and stir for 30 s~1 min; (2) add the fine aggregate and cement into the mixture and stir for 30 s~1 min; (3) add the PVA fiber in two batches and stir each batch for 30 s; and (4) add the solution of water and water-reducing agent into the mixture and stir for 1~2 min. A total of 30 L of concrete was stirred for each mixture. A shaking table was used to vibrate the concrete specimens.

2.3. Experimental Setup

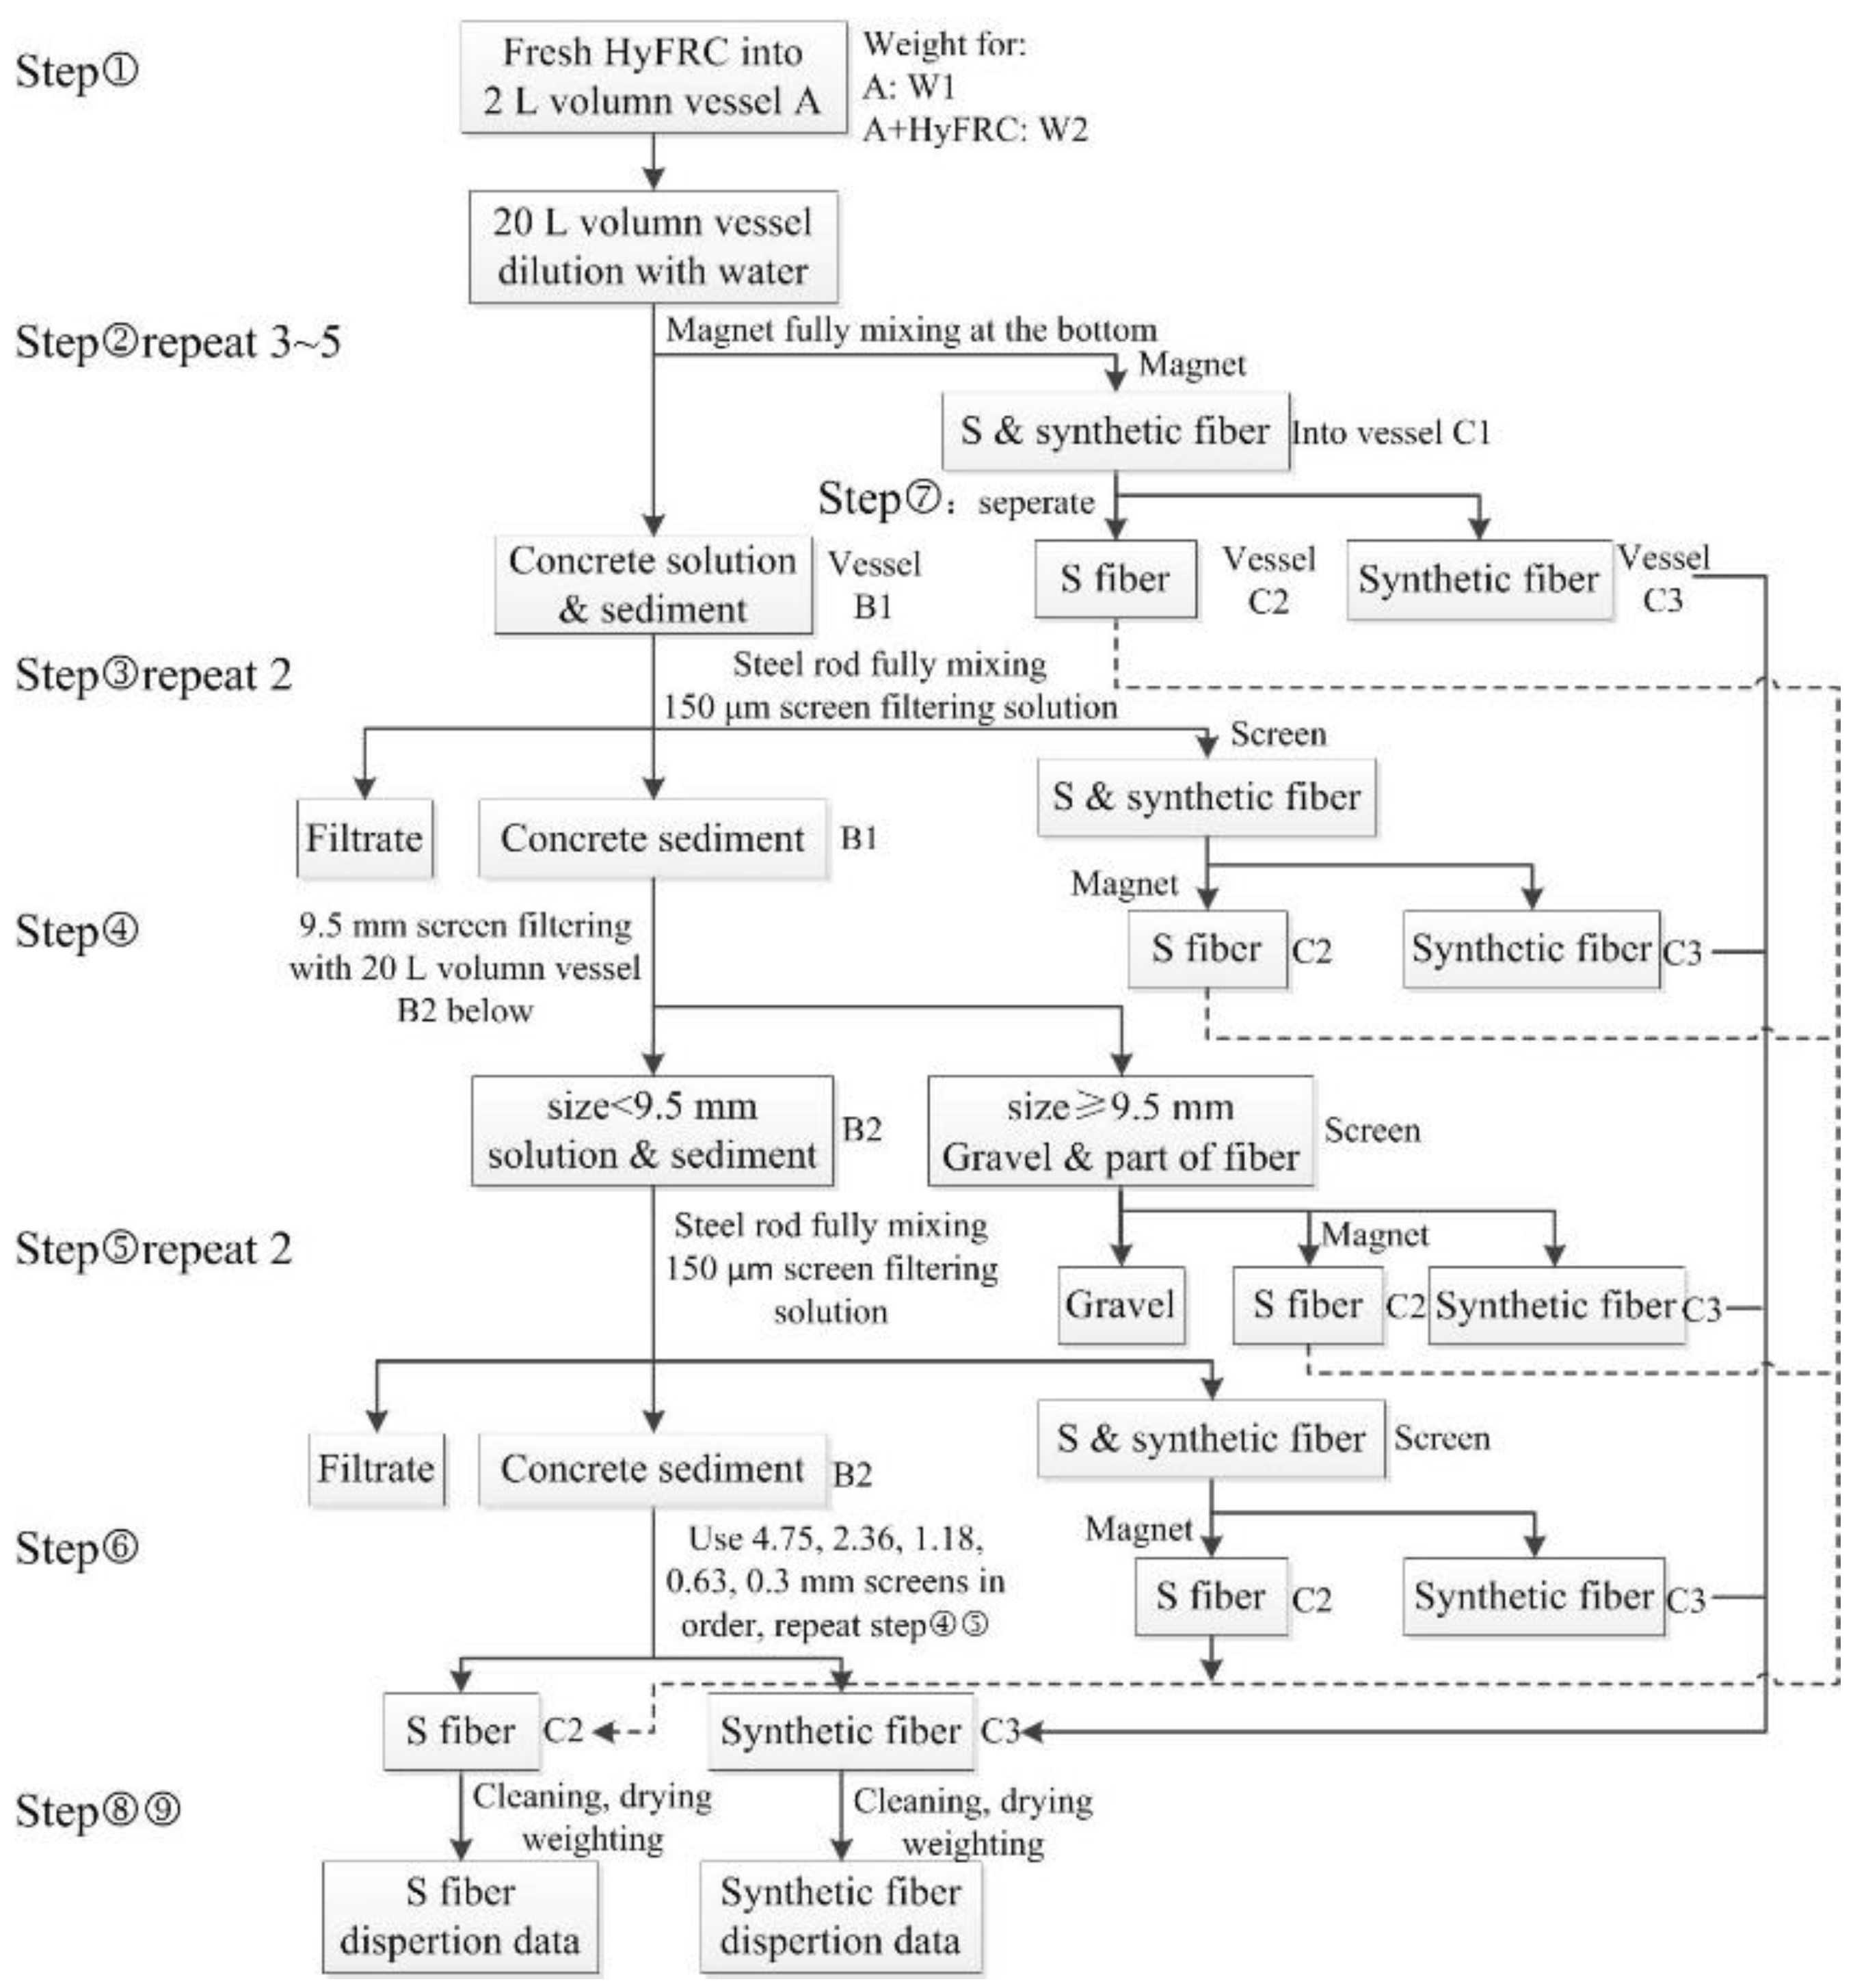
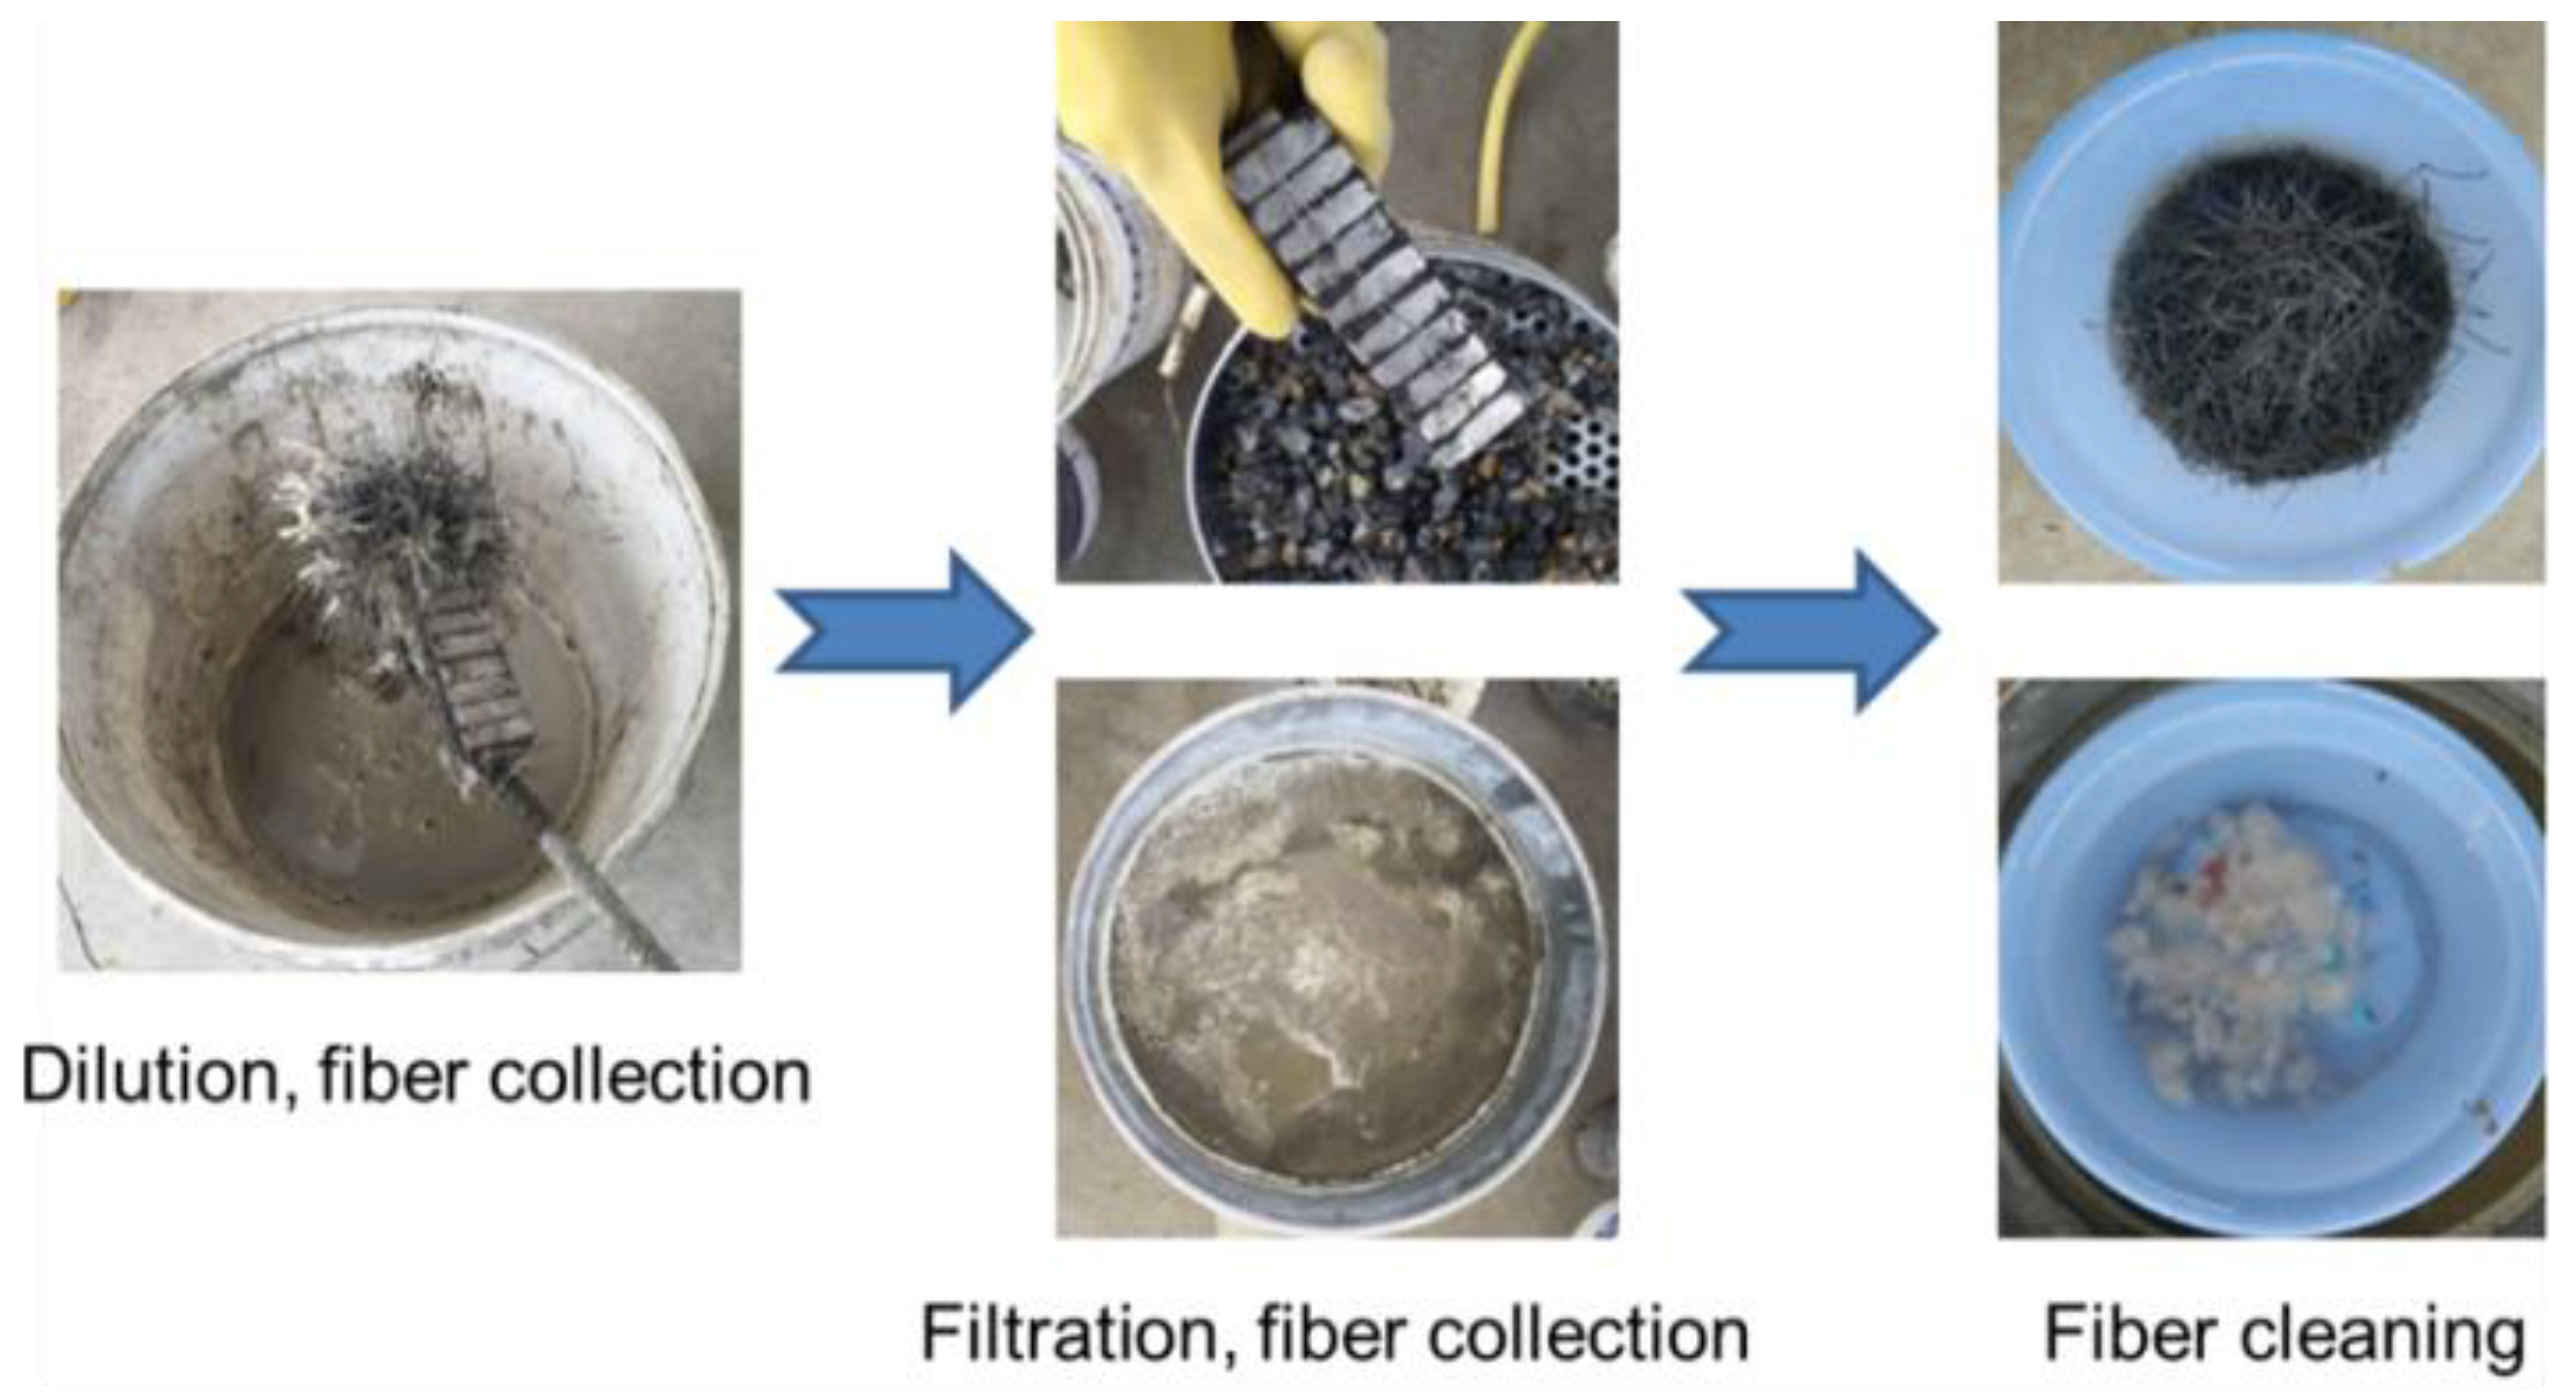
2.3.1. Test Setup for Fiber Dispersion

Fiber dispersion can be evaluated using a wash-out test [35], X-ray analysis [36], and image technique [37], et al. Because X-ray analysis is only feasible for steel fiber and the image technique requires advanced equipment, this study adopts a wash-out test to measure the fiber dispersion. A wash-out test is easy to conduct but needs elaborate work, otherwise large errors can occur. Therefore, a detailed wash-out test process for the HyFRC is developed, as shown in Figure 2.
For each test group, three samples of fresh concrete were collected; then, the wash-out test was immediately conducted to determine the fiber content in each sample. The test process for HyFRC groups was in strict accordance with the workflow in Figure 2. The resultant volume fraction of fiber for each sample was calculated as the ratio of the fiber volume to the volume of the sample concrete. To further reduce the errors, the coefficient of variation (CV) was used to represent fiber dispersion. The CV of a test group is calculated as the standard deviation of the three samples divided by the mean value. As the CV increases, the fiber would have more uneven distribution, reflecting a poorer fiber dispersion. Photos of the test are shown in Figure 3. The test process of the FRC groups is similar, but is a simplified process in relation to HyFRC groups.

2.3.2. Test Setup for Workability

Slump test is conducted to determine the workability of the test groups. For the groups without S fiber, slump was studied with a water reducer at dosages of 0.7% and 0.9% by cement mass. For the groups with S fiber, 0.6% and 0.9% dosages were used. Three replicated samples are used for each test group and their average value is calculated to present the mixture workability.

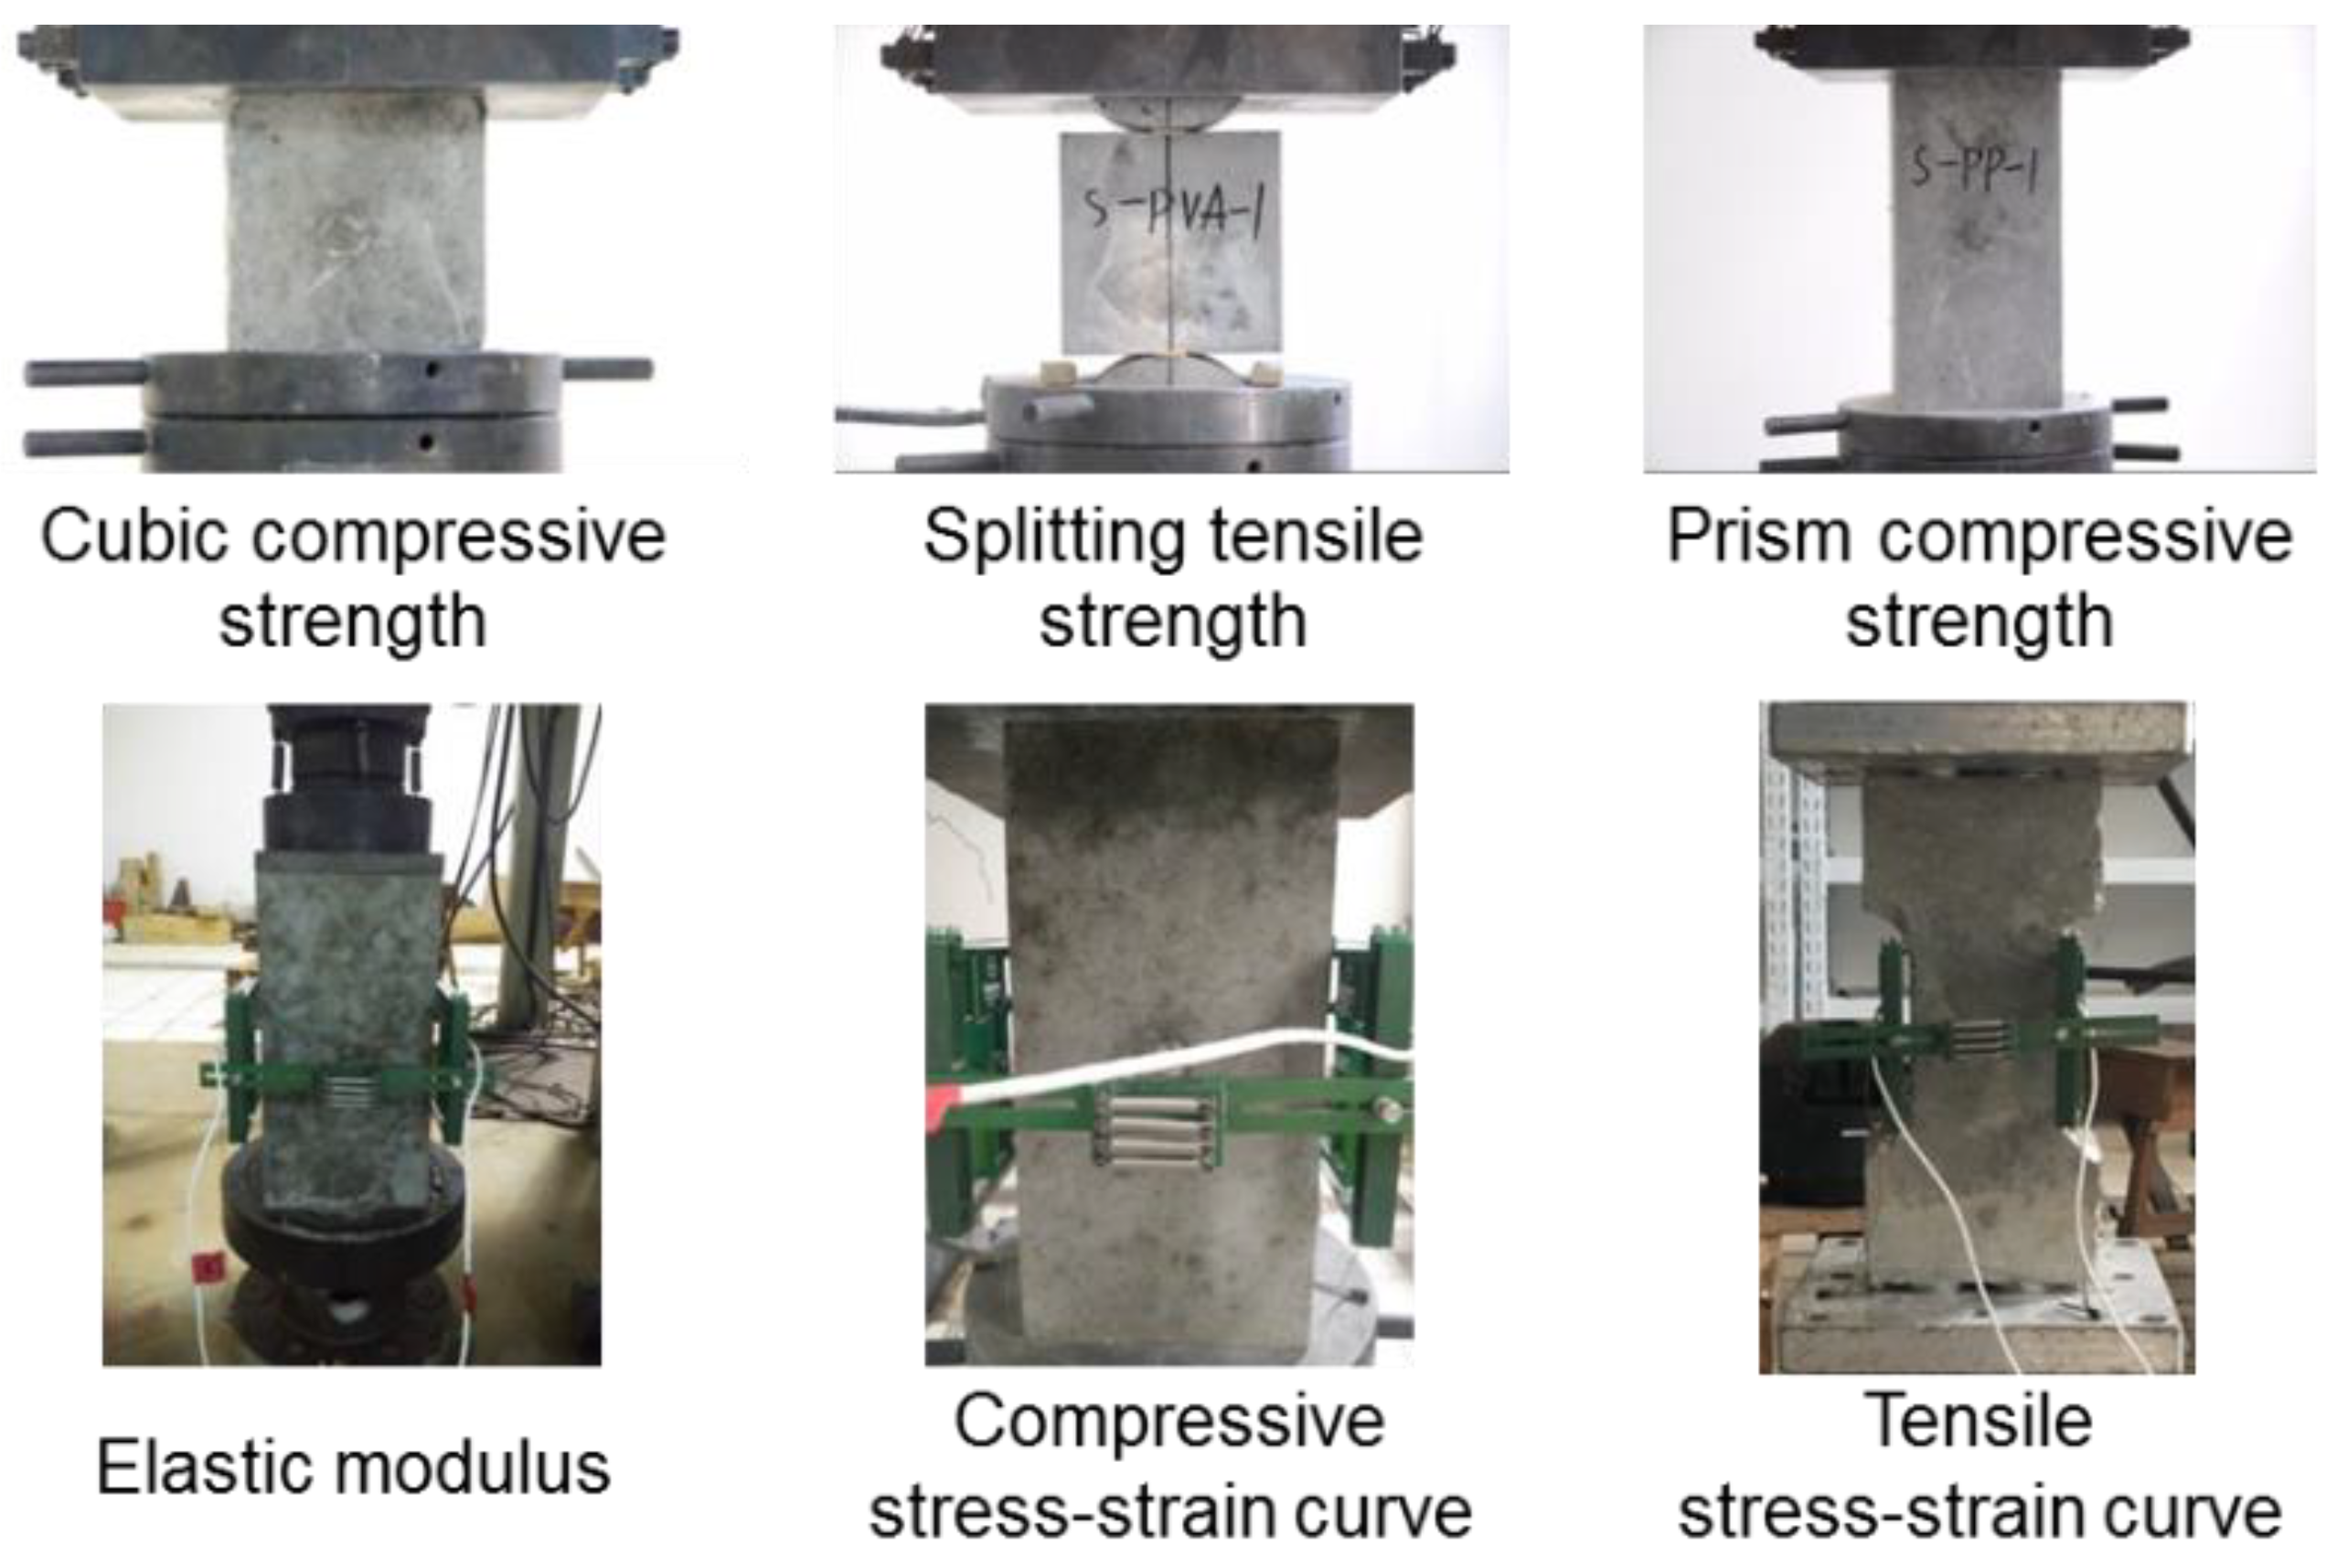
2.3.3. Test Setup for Mechanical Properties

The mechanical properties were studied with a series of tests to determine whether the HyFRC with a combination of S fiber and synthetic or MS fiber improves the mechanical performance of the concretes over the performance of the corresponding mono FRCs. For each test group, four cubic specimens with a side length of 150 mm were used for the cubic compressive strength test and the splitting tensile strength test, respectively. Eleven prismatic specimens with a dimension of 150 mm × 150 mm × 300 mm were casted for each test group, in which four specimens were used to measure the prism compressive strength, three specimens were used to measure the compressive elastic modulus and another four specimens were used to obtain the compressive stress–strain curves. For the tensile stress–strain curve test, six dog-bone specimens with a peripheral dimension of 160 mm × 100 mm × 350 mm were casted for each test group and a universal hinge loading device was used, which have been demonstrated to perform satisfactory control in an earlier study [38]. The mechanical property test setups are shown in Figure 4.

3. Experimental Results and Discussion

3.1. Fiber Dispersion

For each FRC and HyFRC test group, the CV is calculated for its fibers. Figure 5a shows the CV of the microfibers in FRC groups and HyFRC groups. The CV trends in both categories indicate that the dispersion follows a priority order of MS > PVA > PP > PAN. Specifically, the MS fiber has the lowest dispersion CV. The PVA and PP fibers show a slightly more uneven distribution. For the PAN groups, the CV dramatically increases to 14.6% for the FRC group and 16.6% for HyFRC. An explanation for these results is that the hardness of the PAN fiber is relatively low, particularly in comparison with the MS and PVA fibers. Soft fibers easily yield to pressure and cluster, which causes an uneven distribution. The PAN fiber is also soluble in a limited number of polar liquids [28], which affects its dispersion in the complex matrix. Figure 5b shows the CV of the S fiber in steel-fiber FRC group and HyFRC groups and it is shown that the S fiber has relatively low and stable CV values between 4.1% and 5.4%.
Another interesting phenomenon of the fiber dispersion results is that the fibers usually show poorer dispersion in HyFRC groups than in FRC groups. Only the MS fiber has different performance. This is because the S fiber and synthetic fiber become entangled during the stirring processes, the chance of clustering for both fiber types increases, increasing the CV values of the HyFRC relative to the FRC. However, because the MS is much harder than the synthetic fibers, it is the only type of microfibers that would not bend and entangle itself with the steel fiber, resulting in a much better dispersion performance. Therefore, this study shows that the fiber dispersion usually becomes poorer in HyFRC than in FRC, but as long as the fibers are hard enough, this negative effect can be eliminated.

3.2. Slump

Figure 6a shows the slump test results for groups without S fiber, Figure 6b shows the slump test results for groups with S fiber. The data for the plain concrete with 0.9% water reducer are not shown because that concrete exhibited disintegration. The slump values decrease in the following sequence: MS, PP, PVA, and PAN, except one counter-example where the slumps for the PP and PVA cements are 60 mm and 65 mm, respectively, for the test groups without S fiber and a 0.7% dosage of water reducer. The synthetic fibers helped to adsorb water. PP has the weakest ability to adsorb water among the three synthetic fibers because of its hydrophobic surface [28]. With the hydrophile group on PAN’s surface, PAN has a considerably more negative effect on the workability relative to the PP and PVA fibers, explaining the significant decrease in the slump values for the PAN groups. MS and S fibers do not have an adsorptive capacity, but they can impede the flow of concrete by overlapping with each other to form a “canopy frame”. According to this study, the reducing effect of the “canopy frame” of the S and MS fibers is not as strong as that caused by the hygroscopicity in the synthetic fibers.
A comparison of Figure 6a,b shows a difference in the efficiency of the water reducer on the slump values. With a larger difference in the amount of water reducer (0.6–0.9%) for the groups with S fiber, the slump values increase less than those of the groups without S fiber, whose difference in the amount of water reducer is only 0.2% (0.7–0.9%). For example, the slump increase for the S-PP group is 5 mm (water reducer difference: 0.3%), whereas the index for the PP group is 30 mm (water reducer difference: 0.2%). This phenomenon indicates that the water reducer is more efficient in the FRC than in the HyFRC.
The aim of this study is to optimize the HyFRC type with enhancing mechanical properties, but still has acceptable workability. The slump results indicate that, with the fiber content used in this study, S-MS, S-PP and S-PVA HyFRC show acceptable workability, but S-PAN HyFRC causes much lower slump and requires extra care to apply in engineering.

3.3. Mechanical Properties

To quantitatively investigate and compare fibers’ effects on the base concrete, the enhancing coefficient is defined. The enhancing coefficient for a group without S fiber is equal to its test value divided by the test value of the P1 group; the enhancing coefficient for a group with S fiber is equal to its test value divided by the test value of the P2 group. An enhancing coefficient greater than 1 indicates that the added fiber has a positive effect on the mechanical properties.

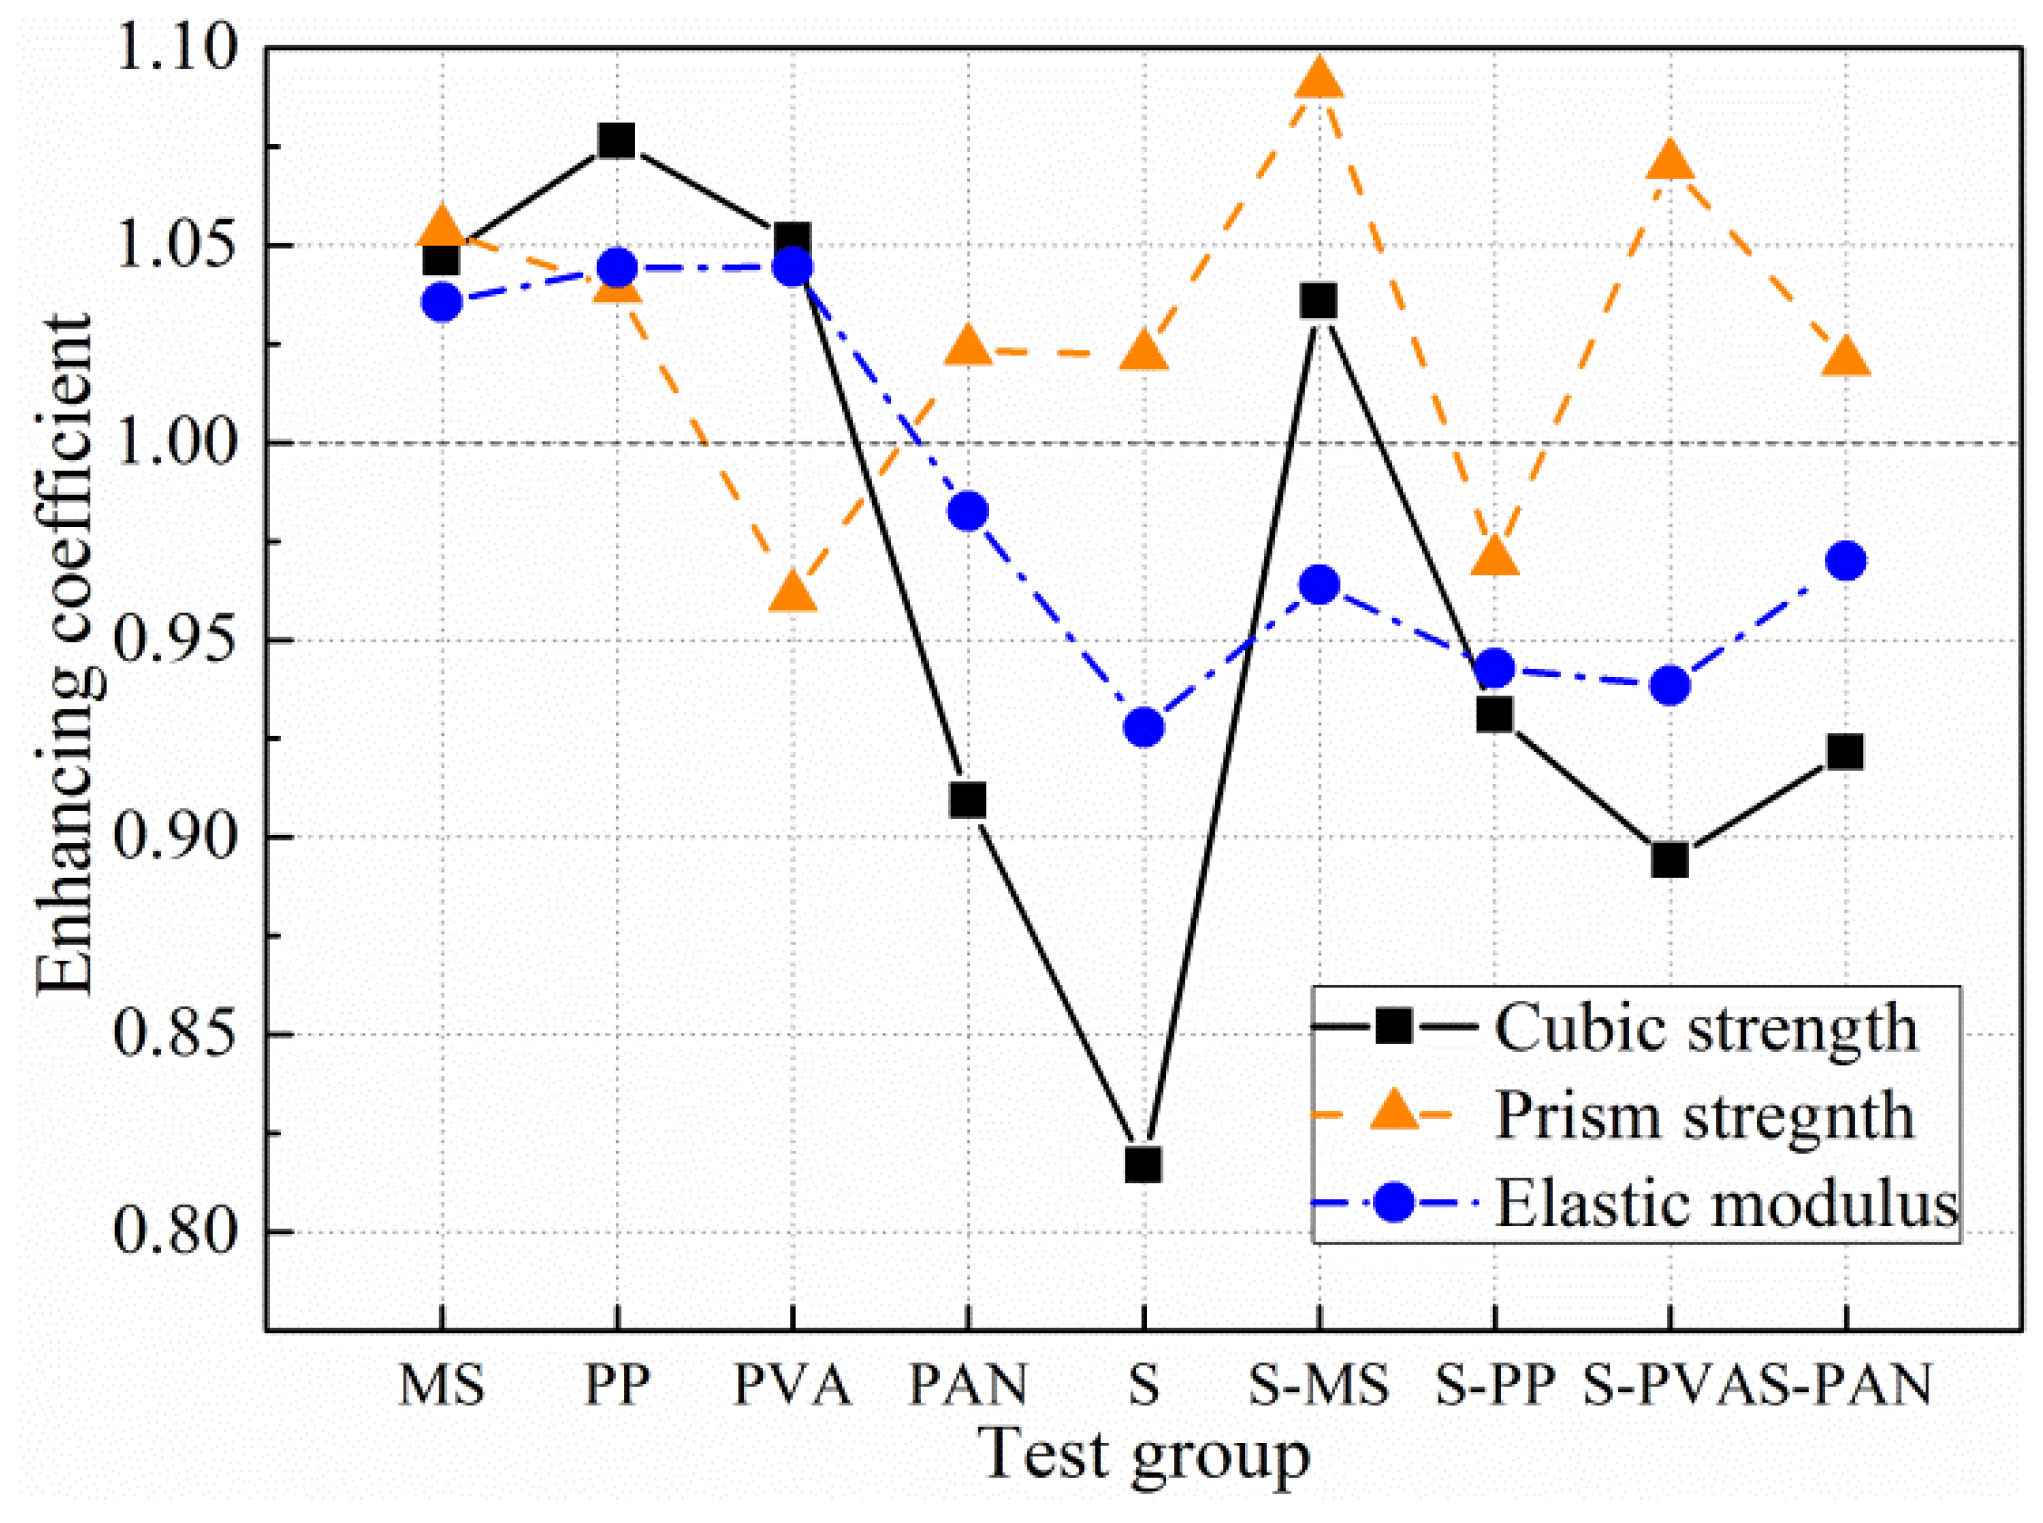
3.3.1. Compressive Strength

The enhancing coefficients of the cubic and prism compressive strength do not follow similar patterns, as shown in Figure 7. In the groups without S fiber, PP has the highest cubic strength enhancing coefficient (1.076). Only PAN causes a negative effect, with a 9.1% decrease in the cubic strength. For the prism strength, PP and PAN increase the concrete strength by 3.9% and 2.3%, respectively. Only PVA causes a negative effect, with a 4.9% decrease in the prism strength. The enhancing coefficients of the MS group are approximately 1.05 for both the cubic and prism strengths.
In the groups with S fiber, the S group reduces the base concrete cubic strength by 18.4%, which indicates that the S fiber alone negatively affects the cubic strength. The enhancing coefficients of the S-MS, S-PP, S-PVA, and S-PAN groups are 1.036, 0.931, 0.894 and 0.921, respectively. Although only the S-MS group has an enhancing coefficient greater than 1, all the tested groups show a clear improvement compared to the S group. For the prism strength, all the tested groups have an enhancing coefficient greater than 1, with the exception of the S-PP group (0.970). The inclusion of S and MS shows the most positive effect, with a 9.1% improvement in the prism strength.
The effect of the S fiber on the concrete can be described by using two opposing theories. On one hand, the S fiber helps to transfer stress over cracks, similar to a “bridge”, and to reduce the extent of the stress concentration at the tip of the cracks. Thus, it changes the crack direction and delays the growth rate of the cracks [39,40], leading to a higher compressive strength. On the other hand, the incorporation of S fiber generates a weakness in the interfacial transition zone. This initial weakness in the matrix can significantly reduce its strength. In this study, we can conclude that the effect of the weakness caused by the S fiber outweighs its bridging effect in the cubic test, whereas the bridging effect is more superior in the prism test. The reason for this phenomenon is that, with a smaller specimen dimension, a crack initialized from the weak interfacial transition zone is much easier to develop through the specimen, resulting in a decrease in the specimen strength. Because most components in an engineering project are larger than the 150 mm × 150 mm × 300 mm prismatic test specimen, the effect of steel fiber shall better refer to the prim strength. However, if the cubic strength is used as the compressive strength indicator, a more conservative design can be adopted.
Despite the fact that the effect of different microfibers varies in the two compressive tests, one can still tell that the S-MS HyFRC has a greater compressive strength than those of the other HyFRC groups.

3.3.2. Compressive Elastic Modulus

The blue dash dot line in Figure 7 compares the enhancing coefficients of the elastic modulus for all the test groups. In the groups without S fiber, the MS, PP and PVA fiber increase the matrix elastic modulus by 3.5%, 4.4% and 4.4%, respectively. The PAN fiber reduces the elastic modulus by 1.7% because of its poor dispersion property. In the groups with S fiber, the incorporation of the S fiber decreases the elastic modulus by 7.2%. When the S fiber is blended with the MS, PP, PVA, and PAN fibers, the concrete modulus recovers back to 96.4%, 94.3%, 93.8%, and 97.0% of that for the plain concrete, respectively.
We can see from Figure 7 that the effect of the fibers on the concrete elastic modulus is minor, but the following conclusion can be drawn: the macro S fiber decreases the matrix elastic modulus, while the microfibers increase the matrix elastic modulus in both the FRCs and HyFRCs. The cause of this phenomenon may be related to the different porosities caused by the macro S fiber and microfibers.

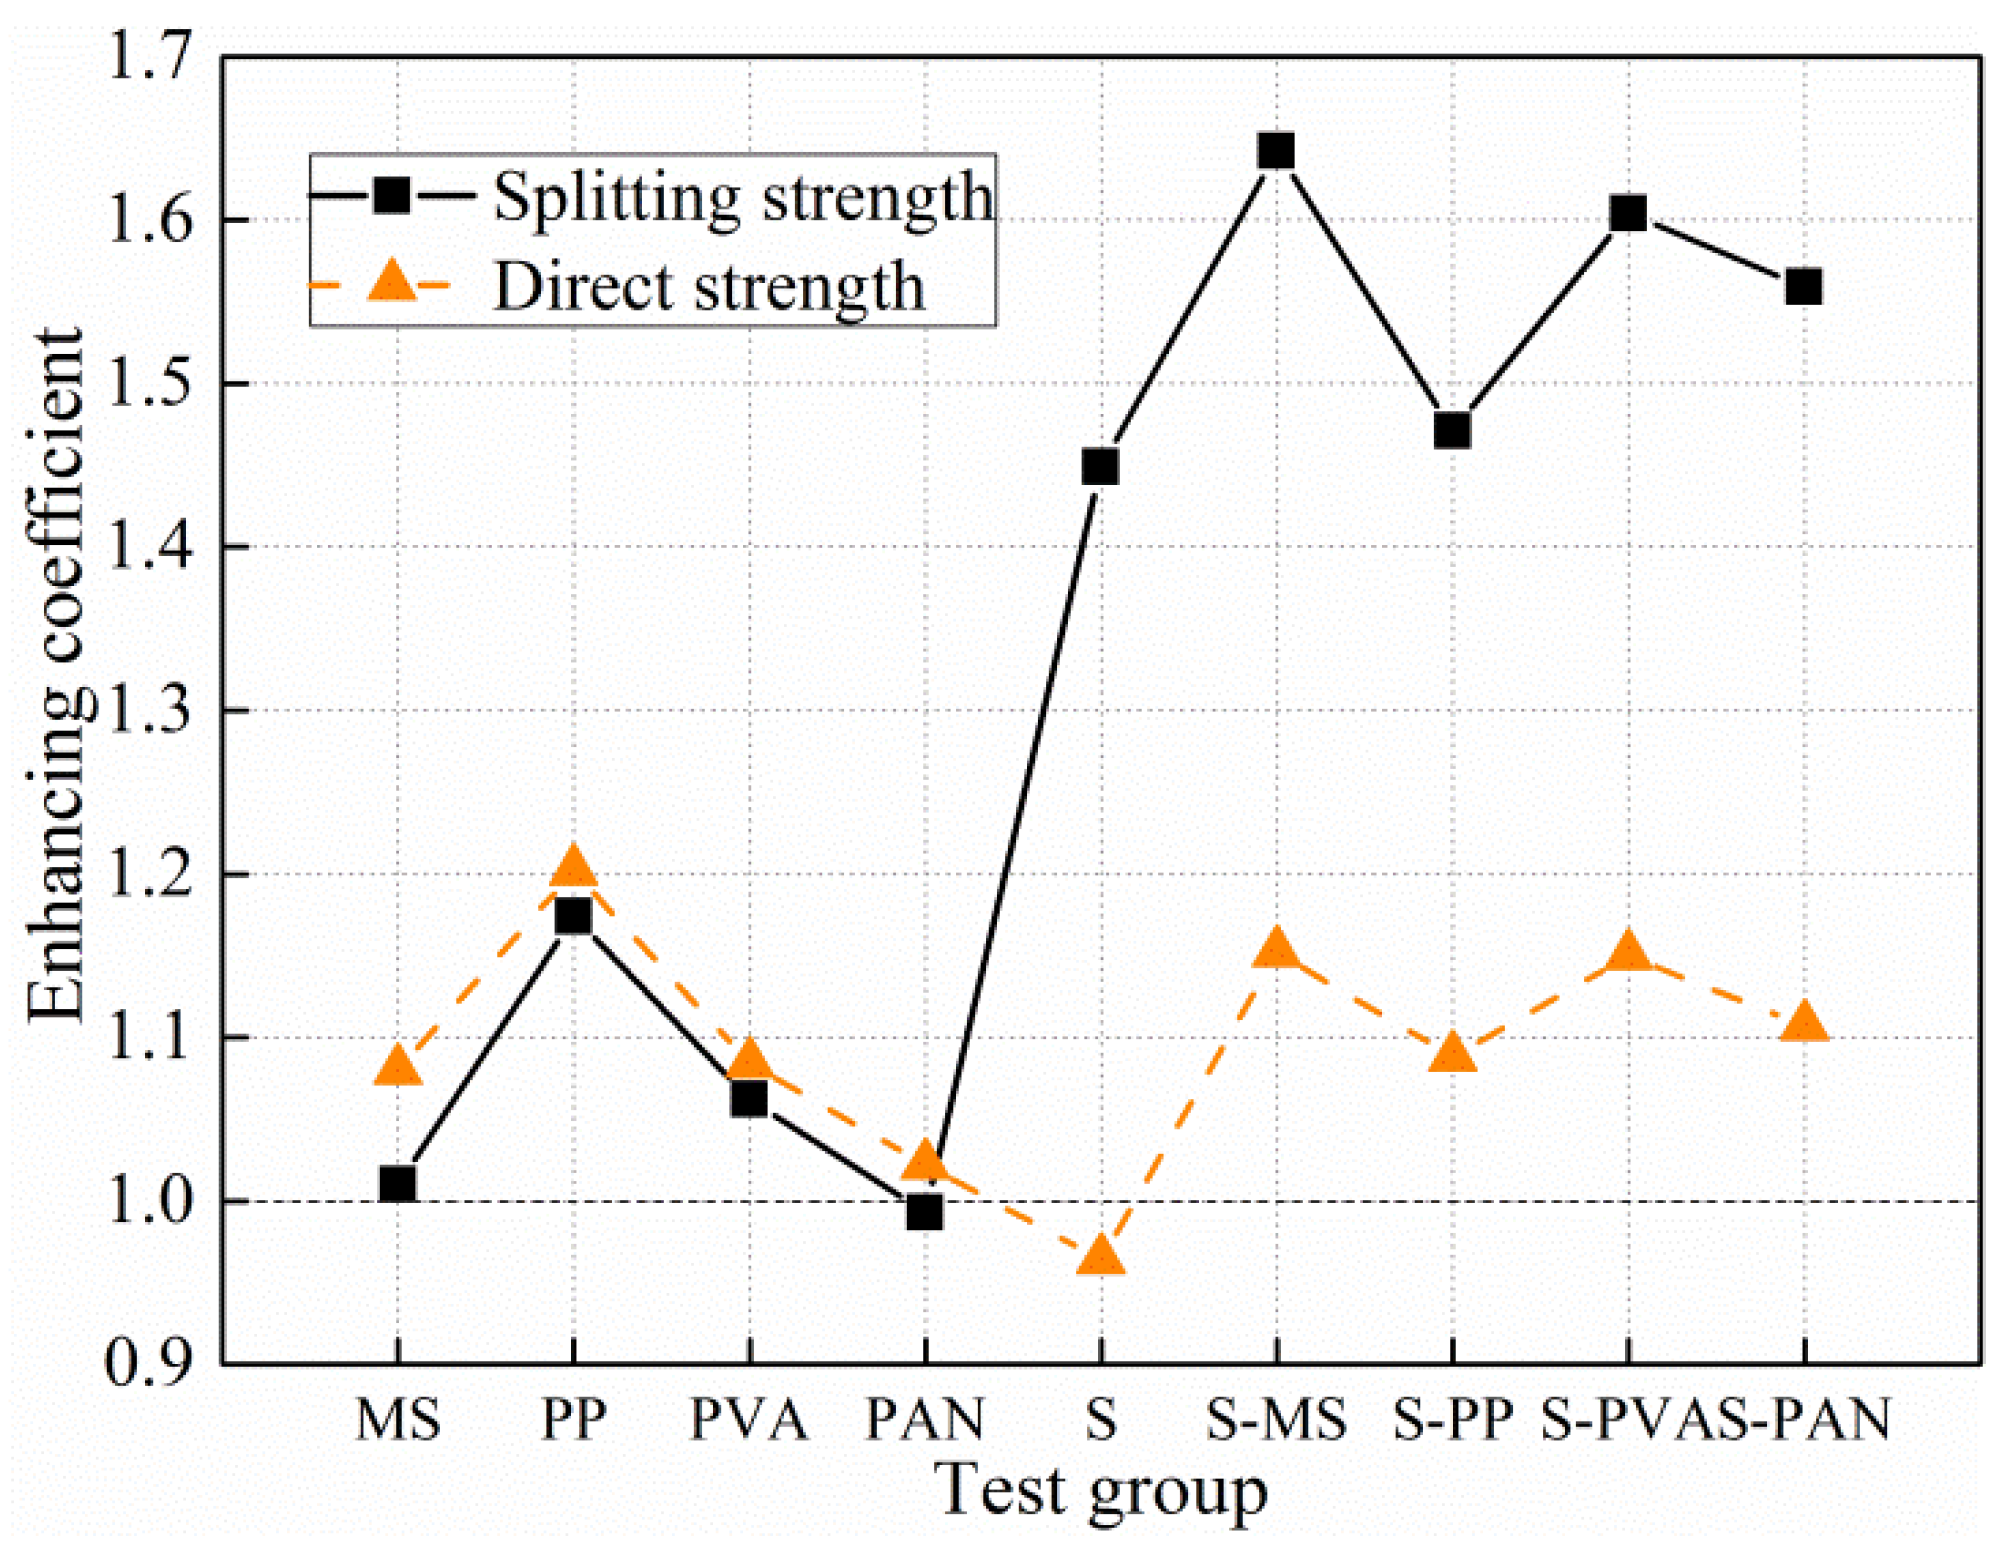
3.3.3. Tensile Strength

Figure 8 shows the enhancing coefficient of the splitting tensile strength and direct tensile strength. The direct tensile strength is obtained from the tensile stress–strain curve test (direct tensile test). The two tensile strengths show obvious correlation with the incorporation of microfiber, but the effect of S fiber on the mixture is opposite. In the groups without S fiber, PP produces the largest improvement in the splitting strength and direct strength, 17.4% and 20.2%, respectively. PVA also has a considerable enhancing effect on the tensile strength. MS has a slightly positive effect on the splitting strength, increasing the strength by 1.0%. However, for the direct strength, the enhancing coefficient of the MS group reaches 1.080. The PAN group has a lower splitting tensile strength than the plain concrete (P1), consistent with its poor dispersion property (see Figure 5). In the groups with S fiber, Figure 8 clearly shows that the incorporation of S fiber significantly increases the splitting tensile strength, although the direct tensile strength decreases in the S group. However, for both tensile strength indicators, blending microfiber with S fiber can improve the tensile behavior relative to the steel FRC. For the splitting strength, the enhancing coefficients of the S-MS, S-PVA, and S-PAN groups are 1.642, 1.604 and 1.559, respectively. Although PP ranks first in enhancing the splitting tensile strength in the groups without S fiber, it is the least effective microfiber when blended with S fiber. For the direct strength, the HyFRC groups show the same priority sequence, with S-MS, the most improved group, increasing the strength by 15.2% and S-PP, the least improved group, increasing the strength by 8.8%.
The difference in the effect of the macro S fiber and microfiber on the splitting tensile strength and direct tensile strength can be attributed to the crack propagation and fiber crack-control mechanism. In the splitting tests, the cracks propagating from one point through the entire section allows the S fiber buffer to perform bridging effect. In the direct tests, the microcracks are evenly developed within the specimen. Once a macrocrack is formed, the specimen quickly losses its strength. Because the S fiber cannot control microcracks and generates weak interfacial transition zones, the direct tensile strength in the S group is less than that of the P2 group. However, in a real engineering application, most of the reinforced concrete components only bear a flexure moment instead of direct tension, which is more similar with the splitting tensile test. On the other hand, the microfibers control the microcracks in both the tensile tests, but the enhancing mechanism differs between the FRCs and HyFRCs. In the groups without S fiber, the microfibers are the main elements in the material that bear tension. The material reaches its maximum tensile strength after the bond effect of these fibers loses its strength [41]. Although MS has a much higher elastic modulus and tensile strength than those of the synthetic fibers, it is smooth with no end hooks, producing the poorest bond effect. Meanwhile, synthetic fibers have much stronger bonds with the cement paste because of their relatively rougher surface and bendability. The bond effect of the MS and synthetic fibers explains the different performances of the specimen groups without S fiber. The poor behavior of the PAN is attributed to its inferior dispersion property. In the groups with S fiber, the macro S fiber helps to transfer most of the tension across the macrocracks. Thus, the microfibers can more effectively transfer stress across the microcracks. Due to this mechanism, the enhancing effect of the microfibers on the tensile strength is proportional to their modulus of elasticity. This observation is verified by comparing the tensile strength results with the elastic modulus in Table 1 because both properties show a relative order of MS > PVA > PAN > PP.

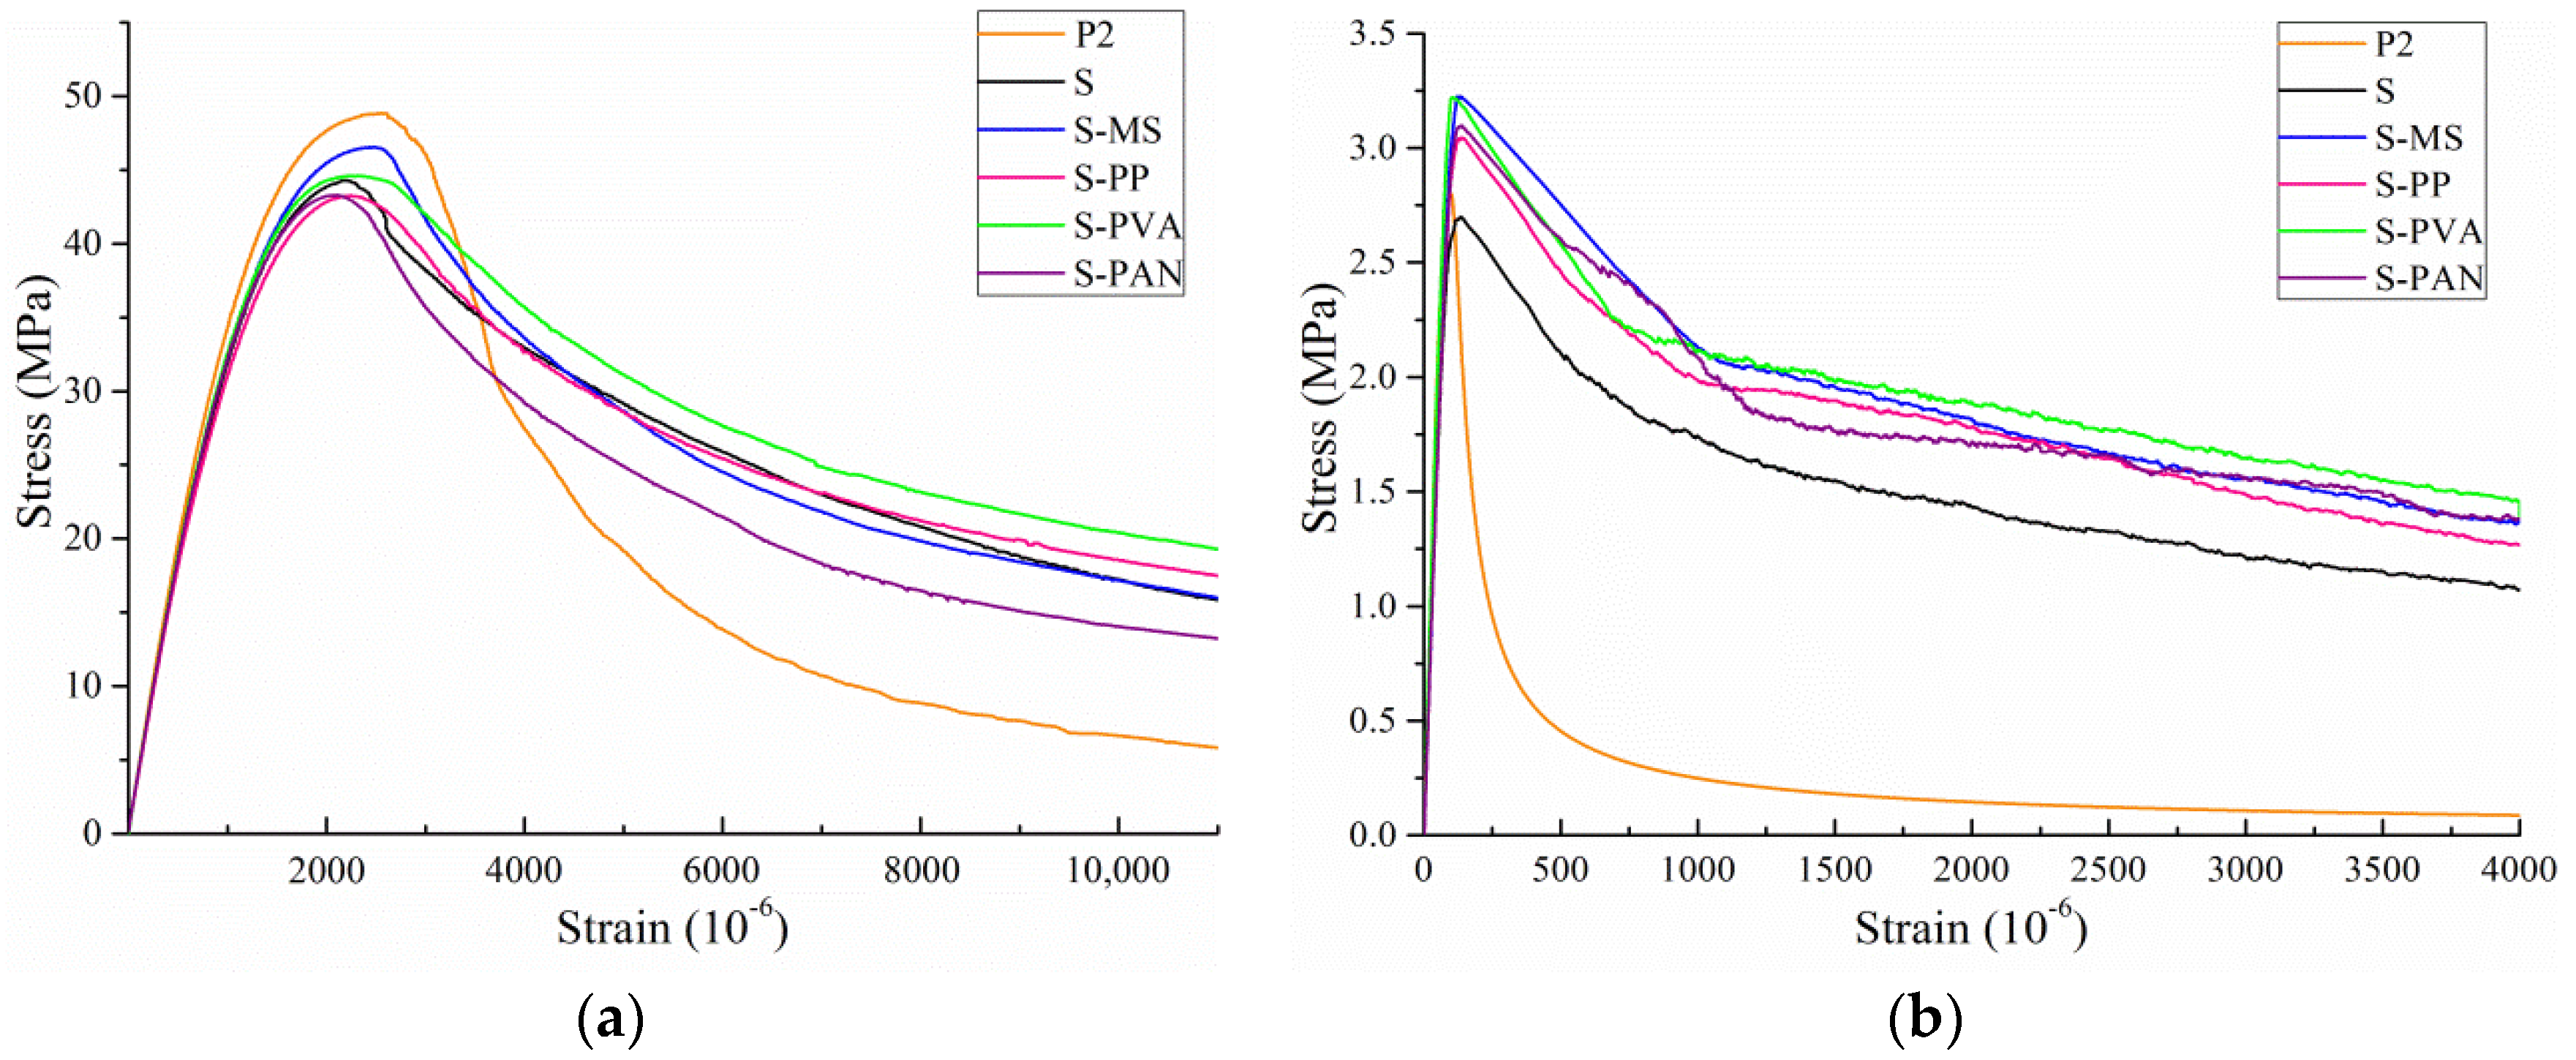
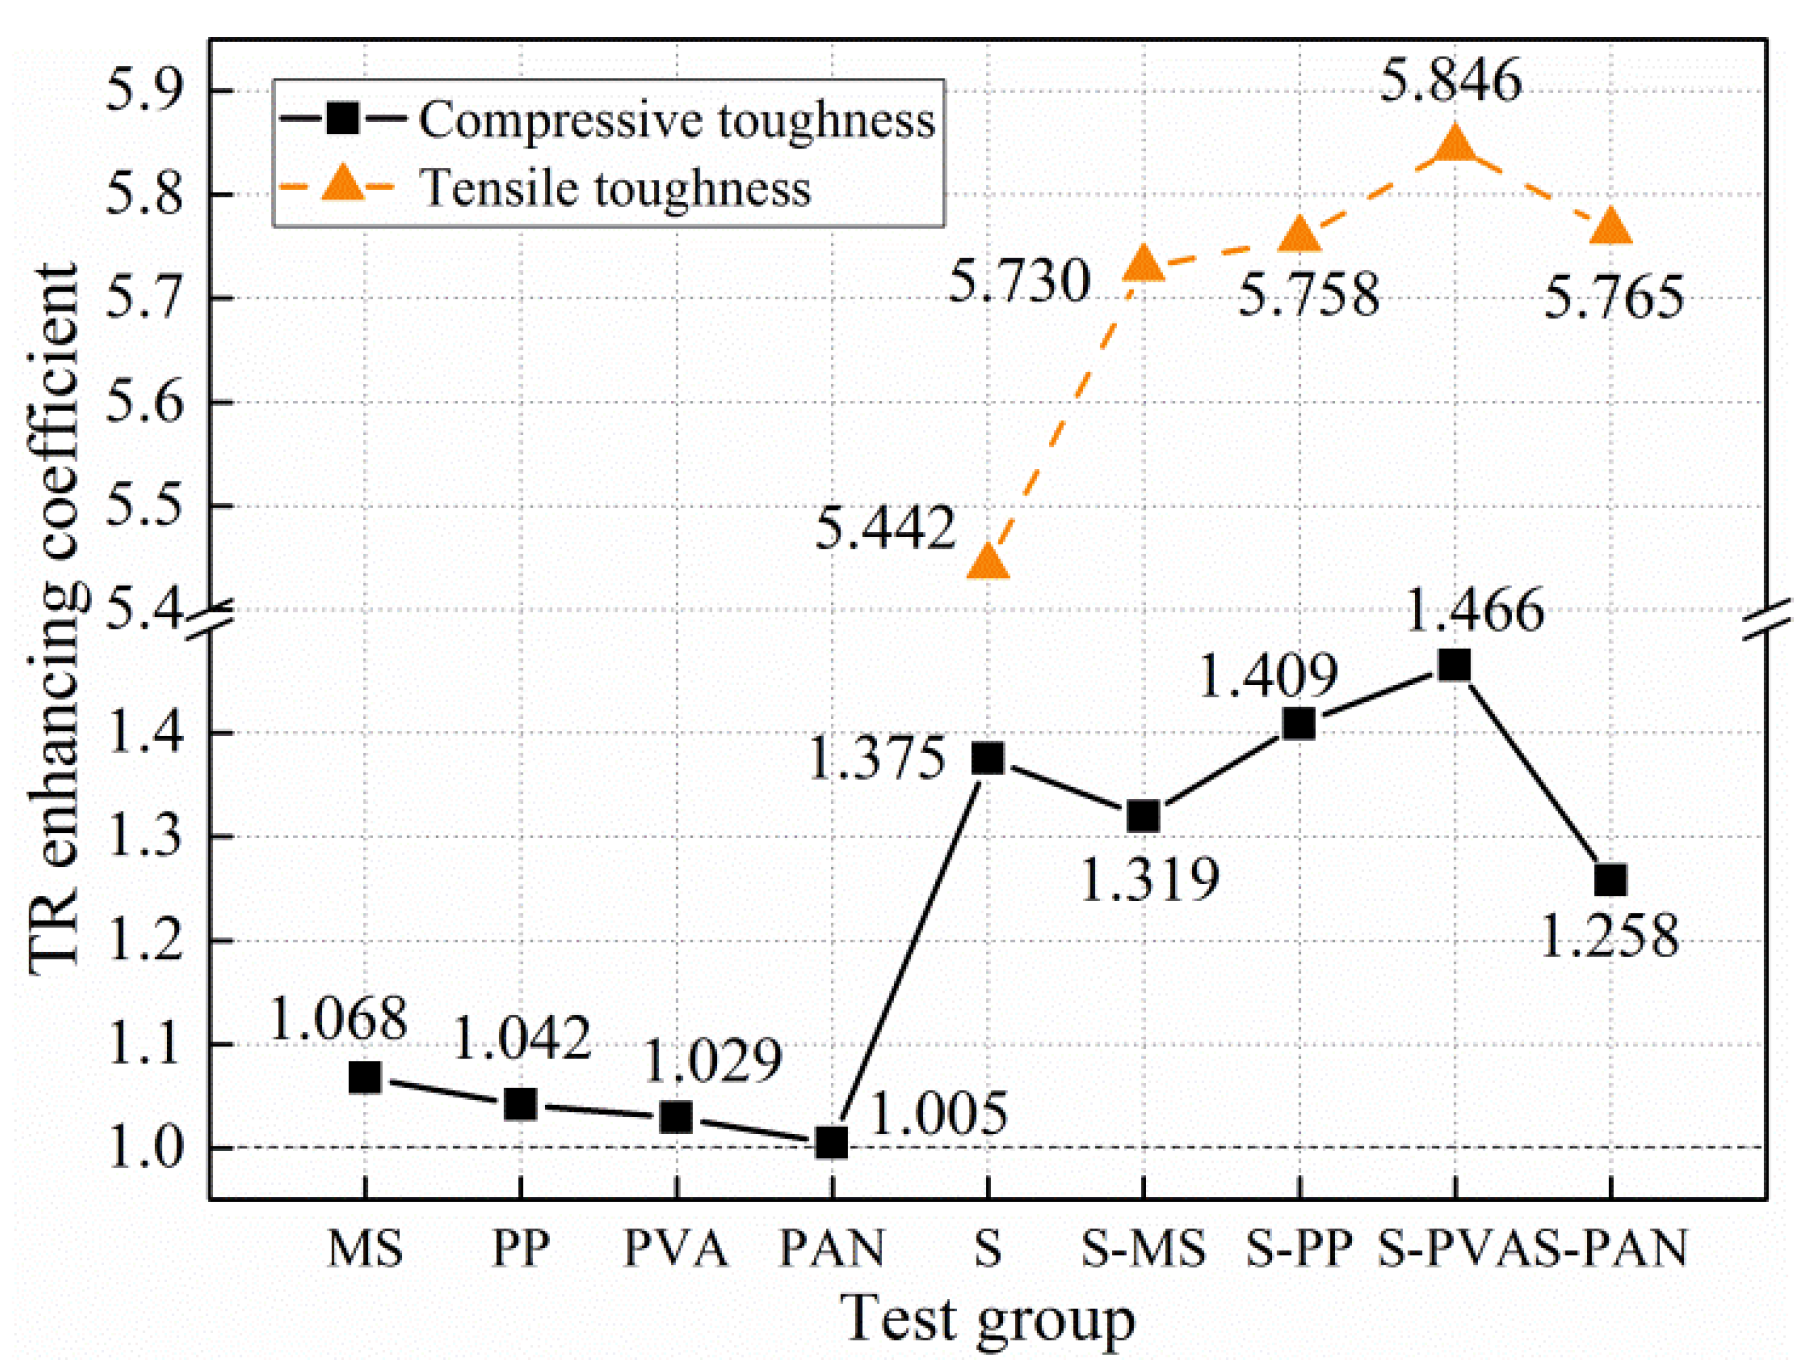
3.3.4. Stress–Strain Curve and Toughness

The compressive stress–strain curves and tensile stress–strain curve tests were conducted for all the test groups. However, only the stress–strain curves of the groups with S fiber are shown in Figure 9. Figure 9a illustrates the compressive stress–strain curves with each curve representing the average results of the four tests that were conducted at identical concrete ages and conditions. The strain measurement was limited to 1.1%. Figure 9b illustrates the tensile stress–strain curves with each curve representing the average results of the six tests. The strain measurement was limited to 0.4%. In the tensile stress–strain curve test, the descending stages of the microfiber FRC groups are not available, because the microfibers cannot transfer stress across the macrocracks and the specimen quickly losses its tensile capacity after forming a major crack. The plain concrete has the same problem. Therefore, the descending stage of the P2 curve in Figure 9b was computed in accordance with GB 50010-2010 [42].
To quantitatively describe the concrete post-cracking performance, the toughness ratio (TR) was defined. For the compressive test, the TR was obtained by dividing the area under the stress–strain curve up to a 1% strain by the area of the rectangle determined by the peak stress and 1% strain. For the tensile test, the maximum considered strain was 0.4%. Only the tensile TRs of the groups with S fiber are calculated. Figure 10 shows the enhancing coefficients of the compressive TR and the tensile TR.
In the groups without S fiber, the overall increase in the compressive TR is not significant. The most effective fiber is the MS fiber, whose enhancing coefficient is 1.068. The PAN fiber has almost no effect on the compressive TR (0.5% increase). In the groups with S fiber, the experimental results show a much higher compressive TR, and the tensile post-cracking performance is also significantly improved. For the compressive test, the incorporation of the S fiber improves the TR by 37.5%. When the S fiber is blended with the PP and PVA fibers, the enhancing coefficient of the TR becomes 1.409 and 1.466, respectively. However, unlike the case when they are mixed alone, MS and PAN reduce the compressive TR at the base of the S group to 1.319 and 1.258, respectively. For the tensile test, the S-PVA group has the highest TR, followed by the S-PAN, S-PP, and S-MS groups. All the HyFRCs show considerable increases in the tensile TR compared to that of the S group.

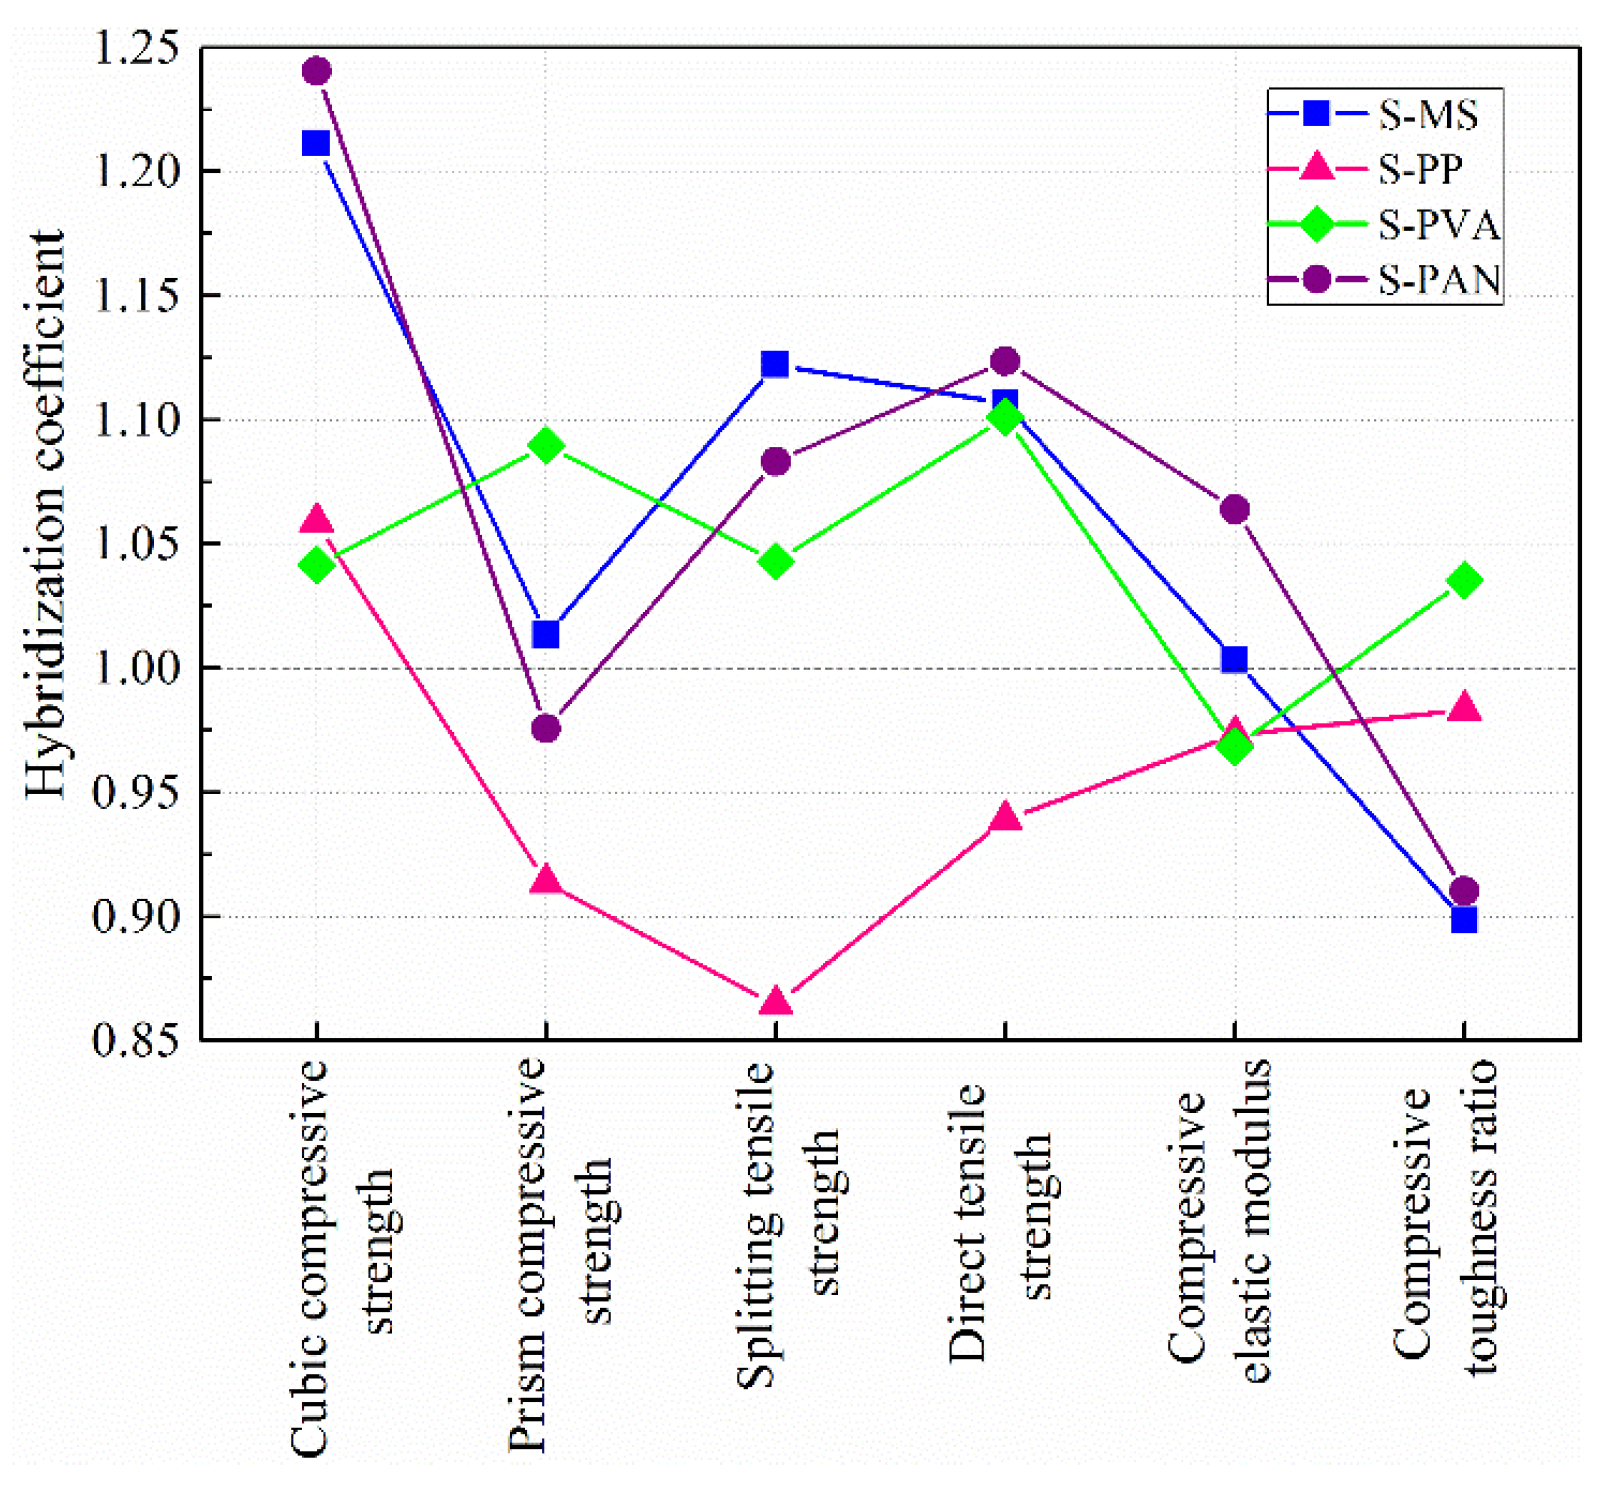
3.4. Hybridization Effect

A notable question in HyFRC technology is whether different types of fibers work more effectively together than separately. This effect is called the hybridization effect for two fibers, A and B, and can be measured using the hybrid coefficient HCA-B:
H C A - B = E C A - B E C A E C B
where EC is the enhancing coefficient. A HCA-B greater than 1 indicates a positive hybridization effect. The hybridization coefficients of the HyFRCs are shown in Figure 11. The hybridization coefficient in terms of tensile TR is not incorporated.

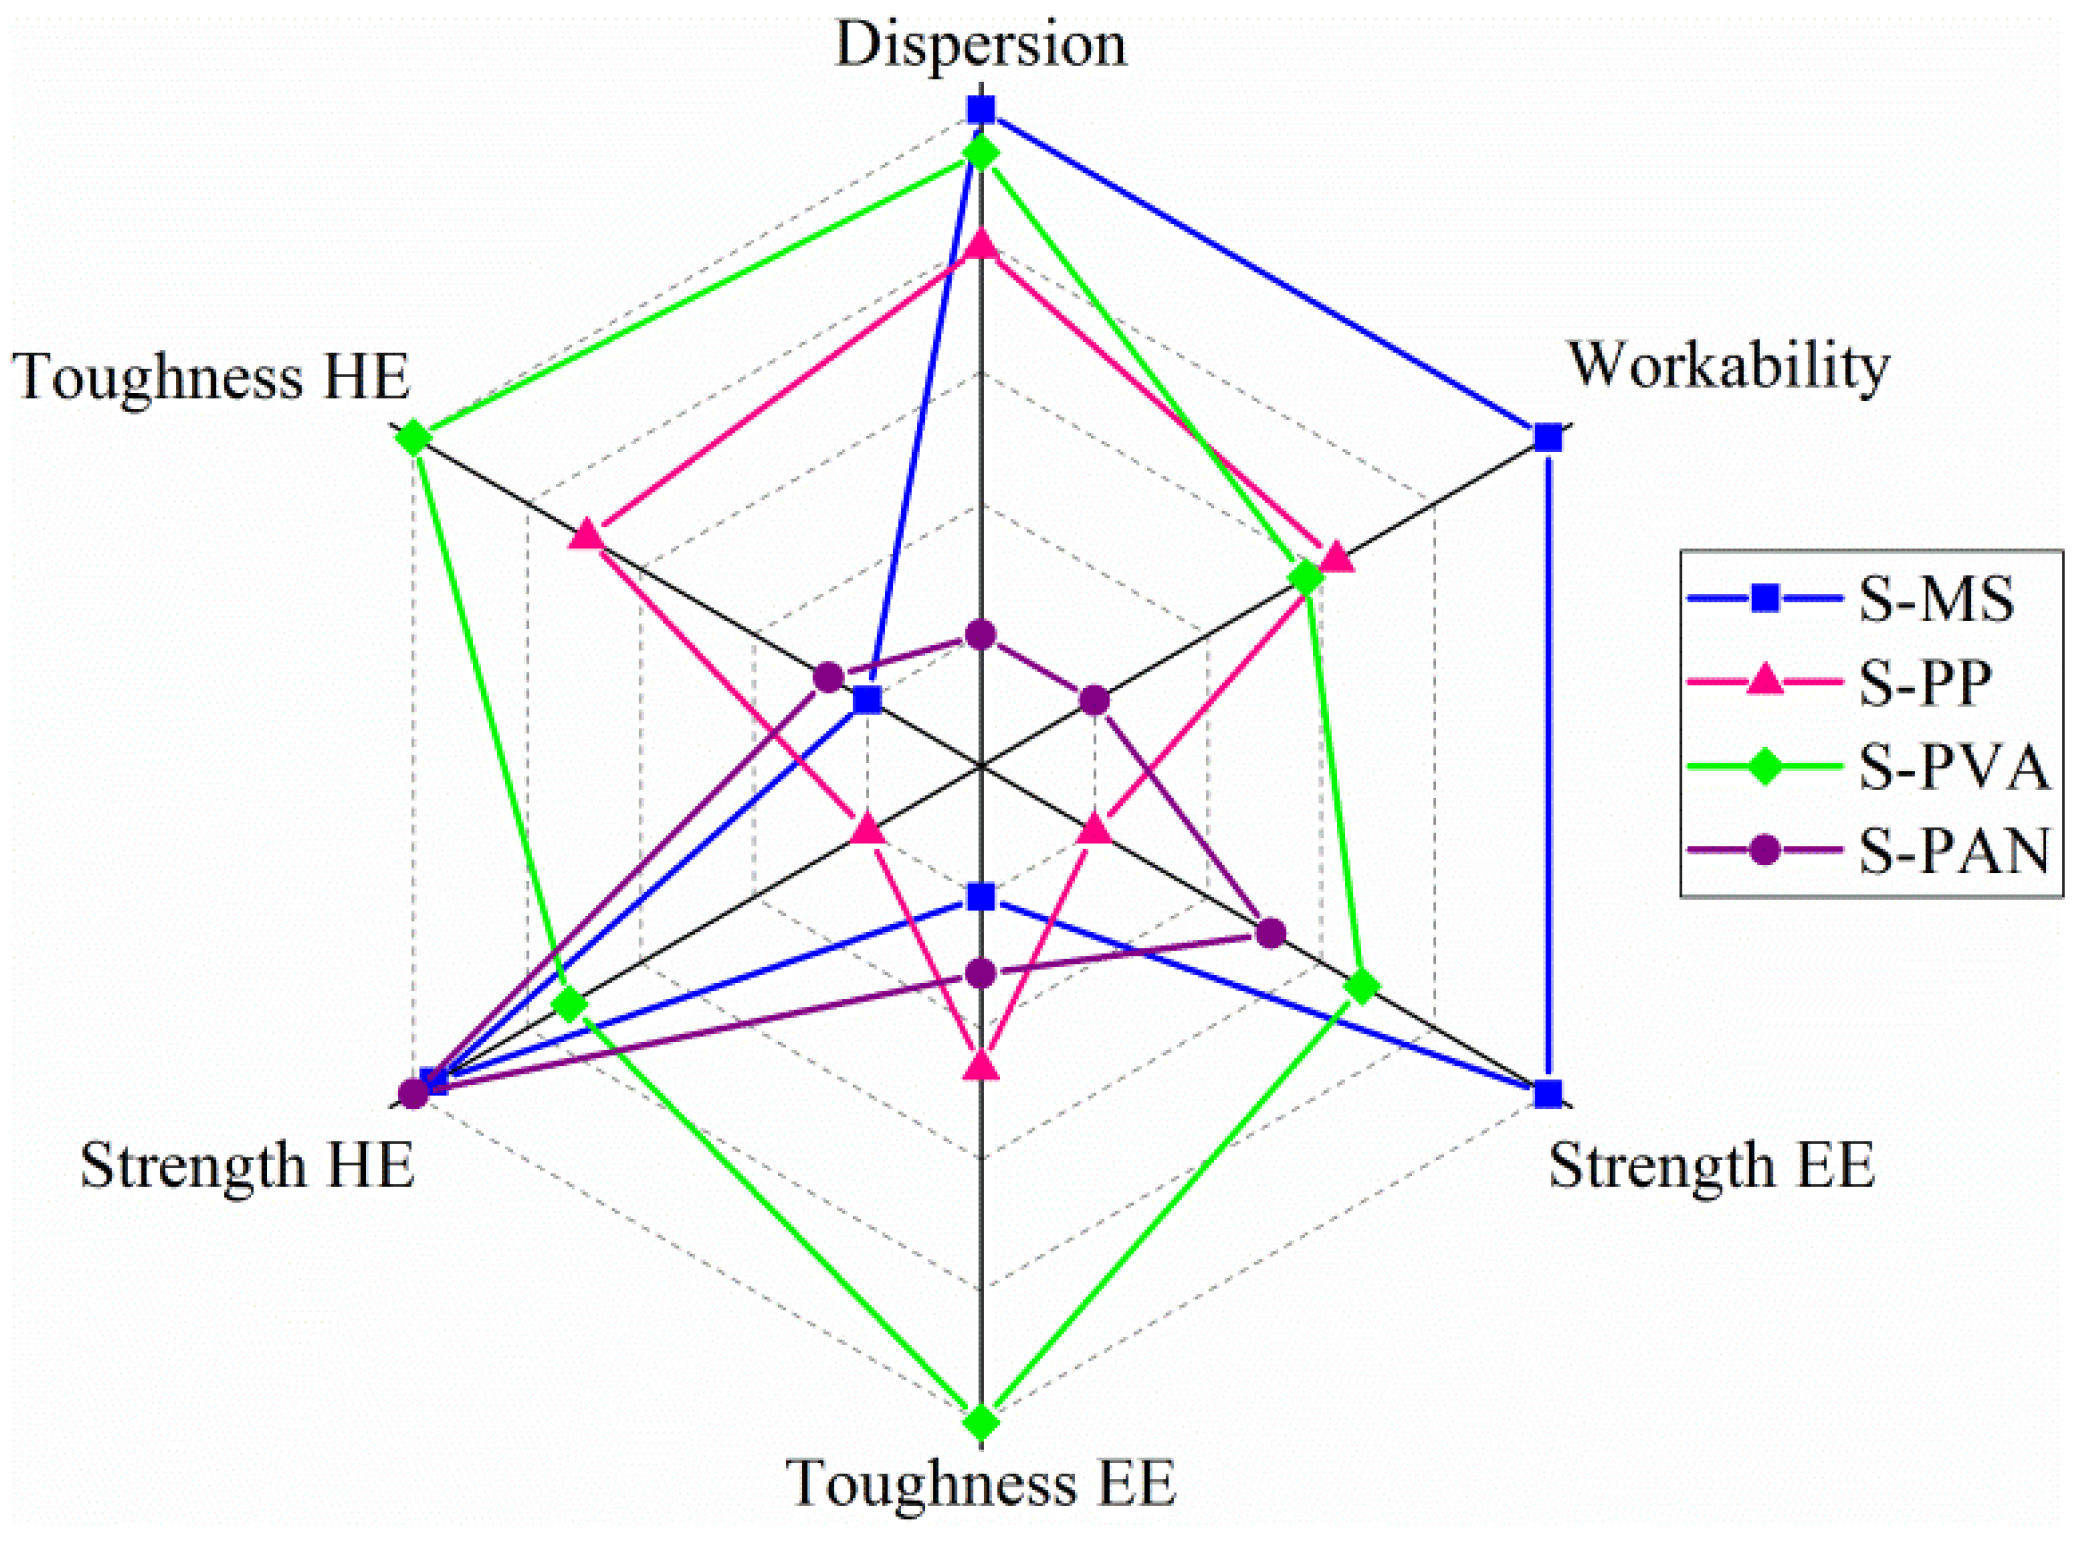
4. Optimal HyFRC Type Determination

In this section, the mixture properties are further rated into a six dimensional grading system including: fiber dispersion, mixture workability, strength enhancing effect, toughness enhancing effect, strength hybridization effect, and toughness hybridization effect. The steps are as follows:
(1)
Calculate the performance index (PI) for fiber dispersion of each type of HyFRC, PIdisp.
P I disp = C V S 2 + C V microfibre 2
where CVS is the CV for steel fiber and CVmicrofiber is the CV for the microfiber.
(2)
Calculate PI for mixture workability of each type of HyFRC, PIwork.
P I work = ( S l u m p 0.6 + S l u m p 0.9 ) / 2
where Slump0.6 is the slump for the HyFRC mixtures with 0.6% water-reducer and Slump0.9 is the slump for the HyFRC mixtures with 0.9% water-reducer.
(3)
Calculate PI for strength enhancing effect of each type of HyFRC, PIEE,strength.
P I EE , strength = E C fcc 2 + E C fpc 2 + E C fpt 2 + E C fdt 2 + E C E 2
where ECfcc, ECfpc, ECfpt, ECfdt, ECE are the enhancing effects of cubic compressive strength, prism compressive strength, splitting tensile strength, direct tensile strength, and elastic modulus, respectively.
(4)
Calculate PI for toughness enhancing effect of each type of HyFRC, PIEE,toughness.
P I EE , toughness = E C CTR 2 + E C TTR 2
where ECCTR, ECTTR are the enhancing effects of compressive TR and tensile TR, respectively.
(5)
Calculate PI for strength hybridization effect of each type of HyFRC, PIHE,strength.
P I HE , strength = H C fcc 2 + H C fpc 2 + H C fpt 2 + H C fdt 2 + H C E 2
where HCfcc, HCfpc, HCfpt, HCfdt, HCE are the hybridization effects of cubic compressive strength, prism compressive strength, splitting tensile strength, direct tensile strength, and elastic modulus, respectively.
(6)
Calculate PI for toughness hybridization effect of each type of HyFRC, PIHE,toughness.
P I HE , toughness = H C CTR
where HCCTR is the hybridization effect of compressive TR.
(7)
Scaling the six PIs into a grading system from score 1 to score 5, where the score 5 indicates the best behavior and the score 1 indicates the worst behavior. Equation (8) shows the scaling methodology for each PI, where the PIS-microfiber represents the PI for a type of S-microfiber HyFRC.
m a x P I = max ( P I S - MS , P I S - PP , P I S - PVA , P I S - PAN ) m i n P I = min ( P I S - MS , P I S - PP , P I S - PVA , P I S - PAN ) S c o r e S - microfibre = { P I S - microfibre m i n P I m a x P I m i n P I × 4 + 5           for   P I d i s p P I S - microfibre m i n P I m a x P I m i n P I × 4 + 1              for   the   rest   PIs
The results of Equation (8) are used in Figure 12 to intuitively illustrate HyFRCs’ behavior.
The following evaluations of the four types of HyFRC can be extracted from Figure 5, Figure 6, Figure 7, Figure 8, Figure 9, Figure 10, Figure 11 and Figure 12. For groups with PAN fiber, poor behaviors are observed in most of the properties, so the S-PAN is excluded from the candidate optimal HyFRC types. Although the PP fiber, when added alone, performs quite well in terms of the fiber dispersion, mixture workability, and mechanical properties, the S-PP HyFRC shows an ineffective enhancing effect and negative hybridization effect for most of the mechanical properties. For the groups with MS fiber, good fiber dispersion and mixture workability and strength are observed. However, the S-MS HyFRC shows the lowest scores in the both toughness enhancing effect and toughness hybridization effect. Because the post-cracking toughness is the most important mechanical property in fiber-reinforced concrete, MS cannot be recommended for use in the optimal type of concrete. Finally, the PVA fiber shows moderate to good behaviors in all the properties, generating an efficient enhancing effect and hybridization effect, especially in terms of the post-cracking toughness. Therefore, this study recommends that S-PVA is the optimal type of steel-microfiber HyFRC.

5. Conclusions and Remarks

5.1. Conclusions

Steel-microfiber reinforced concrete with low fiber content is one of the concrete mixtures that generates both high performance and acceptable workability. A systematic experimental study on the optimization of the HyFRC type is presented in this study. Various properties are investigated, including the fiber dispersion, mixture workability, and concrete compressive strength, spitting tensile strength, direct tensile strength, elastic modulus, compressive toughness, and tensile toughness, to achieve a comprehensive comparison. Three to six specimens per group are fabricated for each test property to ensure experimental accuracy. Test results show that the HyFRC mixtures generate overall higher performance than the mono FRC mixtures, and the steel fiber and microfiber are usually more efficient in HyFRCs than in FRCs because of the positive hybridization effects found in most cases. Therefore, the HyFRC mixtures have engineering application potential. In terms of the optimization of the HyFRC type, the following conclusions can be drawn:
  • A detailed wash-out test procedure for fiber dispersion studies is provided. Among all the fibers tested in this study, the MS fiber has the best dispersion index, followed by PVA, S, PP, and PAN. The S fiber and synthetic fibers in the HyFRC show a worse dispersion than those in the FRC because of the entanglement among different types of fibers.
  • The slump experimental results in the groups both without and with S fiber follow the same trend. The slump values have the following sequence: MS > PP > PVA > PAN. In addition, the water reducer is more efficient in improving the slump in the FRC than in the HyFRC.
  • In terms of the mechanical properties, the PAN fiber has the worst performance. The PP fiber generates high enhancing coefficients in the FRC but has poor hybridization with the S fiber. The MS group has a superior strength. However, a poor toughness performance is observed in the S-MS HyFRC. The PVA groups show moderate to good behaviors for all the properties in both FRC and HyFRC.
  • By estimating the performance of the four steel-microfiber reinforced concretes by testing the fiber dispersion, mixture workability, and mechanical properties, this paper recommends that the S-PVA HyFRC is the best type of steel-microfiber HyFRC.

5.2. Recommendations for Future Work

The issue to optimize HyFRC is a typical multi-factor and multi-objective optimization problem. The factors include fiber type, fiber content, and fiber size, et al. The objectives include fiber dispersion, mixture workability, and mechanical properties, et al. This paper investigated the influence of fiber type on the multi objectives by keeping the other factors identical (or similar) over the four HyFRCs, such as fiber content and fiber size. However, the optimized type of HyFRC stated in this paper might not be accepted in mixtures with different fiber contents or fiber sizes, because the interactions between factors can significantly affect mixture properties. Another test design methodology for obtaining the optimal type of HyFRC is to compare the HyFRC mixtures based on their optimized mixture design. Yet, in that method, the fiber type, fiber content, and fiber size vary in each mixture and it is difficult to quantify the effects of the fiber type.
Therefore, to obtain the optimal type of steel-microfiber HyFRC in a larger range of fiber contents and fiber sizes, future research is required to investigate the interactions between factors. This can be done by designing an orthogonal experiment in which the fiber type, fiber content, fiber size, and their interactions are incorporated.

Author Contributions

Conceptualization, Y.Z. and Z.L.; Data curation, Y.X. and A.G.; Funding acquisition, Y.Z.; Investigation, Y.X. and A.G.; Methodology, Z.L.; Supervision, Y.Z.; Writing, original draft, Y.X.; Writing, review & editing, Y.Z. and Z.L.

Funding

This study was funded by National Key Research and Development Program of China (Grant No. 2016YFC0701101) and State Key Laboratory of Disaster Reduction in Civil Engineering research project of China (Grant No. SLDRCE15-B-08).

Conflicts of Interest

The authors declare no conflict of interest.

References

  1. Etxeberria, M.; Vázquez, E.; Marí, A.; Barra, M. Influence of amount of recycled coarse aggregates and production process on properties of recycled aggregate concrete. Cem. Concr. Res. 2007, 37, 735–742. [Google Scholar] [CrossRef]
  2. Xiao, J.; Li, J.; Zhang, C. Mechanical properties of recycled aggregate concrete under uniaxial loading. Cem. Concr. Res. 2005, 35, 1187–1194. [Google Scholar] [CrossRef]
  3. Naaman, A.; Reinhardt, H. High performance fiber reinforced cement composites HPFRCC-4: International RILEM Workshop. Mater. Struct. 2003, 36, 710–712. [Google Scholar] [CrossRef]
  4. Mazanec, O.; Lowke, D.; Schießl, P. Mixing of high performance concrete: Effect of concrete composition and mixing intensity on mixing time. Mater. Struct. 2010, 43, 357–365. [Google Scholar] [CrossRef]
  5. Schröfl, C.; Snoeck, D.; Mechtcherine, V. A review of characterisation methods for superabsorbent polymer (SAP) samples to be used in cement-based construction materials: Report of the RILEM TC 260-RSC. Mater. Struct. 2007, 50, 197. [Google Scholar] [CrossRef]
  6. Banthia, N.; Gupta, R. Hybrid fiber reinforced concrete (HyFRC): Fiber synergy in high strength matrices. Mater. Struct. 2004, 37, 707–716. [Google Scholar] [CrossRef]
  7. Rossi, P. High Performance Multimodal Fiber Reinforced Cement Composites (HPMFRCC): The LCPC experience. ACI Mater. J. 1999, 94, 478–483. [Google Scholar]
  8. Blunt, J.D.; Ostertag, C.P. Deflection hardening and workability of hybrid fiber composites. ACI Mater. J. 2009, 106, 265–272. [Google Scholar]
  9. Hossain, K.M.A.; Lachemi, M.; Sammour, M.; Sonebi, M. Influence of polyvinyl alcohol, steel, and hybrid fibers on fresh and rheological properties of self-consolidating concrete. J. Mater. Civ. Eng. 2012, 24, 1211–1220. [Google Scholar] [CrossRef]
  10. Jen, G.; Trono, W.; Ostertag, C.P. Self-consolidating hybrid fiber reinforced concrete: Development, properties and composite behavior. Constr. Build. Mater. 2016, 104, 63–71. [Google Scholar] [CrossRef]
  11. ACI Committee 544. ACI 544.1R-96: State-of-the-Art Report on Fiber Reinforced Concrete; American Concrete Institute: Farmington Hills, MI, USA, 2002; Available online: https://www.concrete.org/store/productdetail.aspx?ItemID=544196&Format=DOWNLOAD&Language=English (accessed on 3 July 2018).
  12. Hassanpour, M.; Shafigh, P.; Mahmud, H.B. Lightweight aggregate concrete fiber reinforcement—A review. Constr. Build. Mater. 2012, 37, 452–461. [Google Scholar] [CrossRef]
  13. Xu, L.; Xu, H.; Chi, Y.; Zhang, Y. Experimental study on tensile strength of steel-polypropylene hybrid fiber reinforced concrete. Adv. Sci. Lett. 2011, 4, 911–916. [Google Scholar] [CrossRef]
  14. Park, S.H.; Kim, D.J.; Ryu, G.S.; Koh, K.T. Tensile behavior of ultra high performance hybrid fiber reinforced concrete. Cem. Concr. Compos. 2012, 34, 172–184. [Google Scholar] [CrossRef]
  15. Lawler, J.S.; Zampini, D.; Shah, S.P. Microfiber and macrofiber hybrid fiber-reinforced concrete. J. Mater. Civ. Eng. 2005, 17, 595–604. [Google Scholar] [CrossRef]
  16. Yao, W.; Li, J.; Wu, K. Mechanical properties of hybrid fiber-reinforced concrete at low fiber volume fraction. Cem. Concr. Res. 2003, 33, 27–30. [Google Scholar] [CrossRef]
  17. Kim, D.J.; Park, S.H.; Ryu, G.S.; Koh, K.T. Comparative flexural behavior of hybrid ultra high performance fiber reinforced concrete with different macro fibers. Constr. Build. Mater. 2011, 25, 4144–4155. [Google Scholar] [CrossRef]
  18. Huang, C.; Zhao, G. Properties of steel fibre reinforced concrete containing larger coarse aggregate. Cem. Concr. Compos. 1995, 17, 199–206. [Google Scholar] [CrossRef]
  19. Chung, D. Dispersion of short fibers in cement. J. Mater. Civ. Eng. 2005, 17, 379–383. [Google Scholar] [CrossRef]
  20. Hassan, A.M.T.; Jones, S.W.; Mahmud, G.H. Experimental test methods to determine the uniaxial tensile and compressive behaviour of ultra high performance fibre reinforced concrete (UHPFRC). Constr. Build. Mater. 2012, 37, 874–882. [Google Scholar] [CrossRef]
  21. Mo, K.H.; Goh, S.H.; Alengaram, U.J.; Visintin, P.; Jumaat, M.Z. Mechanical, toughness, bond and durability-related properties of lightweight concrete reinforced with steel fibres. Mater. Struct. 2017, 50, 46. [Google Scholar] [CrossRef]
  22. Prakash, A.; Srinivasan, S.M.; Rao, A.R.M. Application of steel fibre reinforced cementitious composites in high velocity impact resistance. Mater. Struct. 2017, 50, 6. [Google Scholar] [CrossRef]
  23. Zerbino, R.; Monetti, D.H.; Giaccio, G. Creep behaviour of cracked steel and macro-synthetic fibre reinforced concrete. Mater. Struct. 2015, 49, 3397–3410. [Google Scholar] [CrossRef]
  24. Rizzuti, L.; Bencardino, F. Effects of fibre volume fraction on the compressive and flexural experimental behaviour of SFRC. Contemp. Eng. Sci. 2014, 7, 379–390. [Google Scholar] [CrossRef]
  25. Bencardino, F.; Rizzuti, L.; Spadea, G.; Swamy, R.N. Implications of test methodology on post-cracking and fracture behaviour of steel fibre reinforced concrete. Compos. Part B Eng. 2013, 46, 31–38. [Google Scholar] [CrossRef]
  26. Abbass, W.; Khan, M.I.; Mourad, S. Evaluation of mechanical properties of steel fiber reinforced concrete with different strengths of concrete. Constr. Build. Mater. 2018, 168, 556–569. [Google Scholar] [CrossRef]
  27. Behnood, A.; Verian, K.P.; Gharehveran, M.M. Evaluation of the splitting tensile strength in plain and steel fiber-reinforced concrete based on the compressive strength. Constr. Build. Mater. 2015, 98, 519–529. [Google Scholar] [CrossRef]
  28. Zheng, Z.; Feldman, D. Synthetic fibre-reinforced concrete. Prog. Polym. Sci. 1995, 20, 185–210. [Google Scholar] [CrossRef]
  29. China Association for Engineering Construction Standardization. CECS 38: Technical Specification for Fiber Reinforced Concrete Structures; China Planning Press: Beijing, China, 2004. (In Chinese) [Google Scholar]
  30. Zhao, S.B.; Huo, H.Y.; Song, C.X.; Song, L.S. Binary superposition mix design method for SFRC Part I: Principle and evaluation. Adv. Mater. Res. 2011, 168, 2186–2190. [Google Scholar] [CrossRef]
  31. Huo, H.Y.; Zhao, S.B.; Song, L.S.; Song, C.X. Binary superposition mix design method for SFRC Part II: Flexural strength and toughness. Adv. Mater. Res. 2011, 168, 2191–2194. [Google Scholar] [CrossRef]
  32. Li, C.Y.; Song, L.S.; Sun, L.; Cao, C.J.; Xing, T. Experimental study on flexural toughness of SFRC. Adv. Mater. Res. 2012, 238, 33–36. [Google Scholar] [CrossRef]
  33. Huo, H.Y.; Song, L.S.; Sun, L.; Cao, C.J. Basic properties of SFRC designed by the binary superposition mix proportion method. Adv. Mater. Res. 2013, 438, 290–294. [Google Scholar] [CrossRef]
  34. Sun, L. Ternary Superposition Mix Design Method for Hybrid Fiber Reinforced Concrete. Master’s Thesis, North China University of Water Resources and Electric Power, Zhengzhou, China, 2013. (In Chinese). [Google Scholar]
  35. ASTM International. ASTM C1229-94: Standard Test Method for Determination of Glass Fiber Content in Glass Fiber Reinforced Concrete (GFRC) (Wash-Out Test); ASTM: West Conshohocken, PA, USA, 2015. [Google Scholar]
  36. Ferrara, L.; Meda, A. Relationships between fibre distribution, workability and the mechanical properties of SFRC applied to precast roof elements. Mater. Struct. 2006, 39, 411–420. [Google Scholar] [CrossRef]
  37. Kim, J.K.; Kim, J.S.; Ha, G.J.; Kim, Y.Y. Tensile and fiber dispersion performance of ECC (engineered cementitious composites) produced with ground granulated blast furnace slag. Cem. Concr. Res. 2007, 37, 1096–1105. [Google Scholar] [CrossRef]
  38. Zhou, L.J.; Ren, X.D.; Li, J. Experimental technical on uniaxial tensile behavior of concrete under dynamic loading. Struct. Eng. 2016, 32, 163–168. (In Chinese) [Google Scholar]
  39. Afroughsabet, V.; Ozbakkaloglu, T. Mechanical and durability properties of high-strength concrete containing steel and polypropylene fibers. Constr. Build. Mater. 2015, 94, 73–82. [Google Scholar] [CrossRef]
  40. Yan, H.; Sun, W.; Chen, H. The effect of silica fume and steel fiber on the dynamic mechanical performance of high-strength concrete. Cem. Concr. Res. 1999, 29, 423–426. [Google Scholar] [CrossRef]
  41. Afroughsabet, V.; Biolzi, L.; Ozbakkaloglu, T. High-performance fiber-reinforced concrete: A review. J. Mater. Sci. 2016, 51, 6517–6551. [Google Scholar] [CrossRef]
  42. Ministry of housing and urban-rural development of China. GB 50010-2010: Code for Design of Concrete Structures; China Building Industry Press: Beijing, China, 2015; Available online: http://www.zzguifan.com/webarbs/book/209/2438396.shtml (accessed on 3 July 2018). (In Chinese)
Figure 1. Shape and dimensions of different types of fiber.
Sustainability 10 02335 g001
Figure 2. Typical wash-out test process for the hybrid fiber-reinforced concrete (HyFRC) in this study.
Sustainability 10 02335 g002
Figure 3. Dispersion study using the wash-out test.
Sustainability 10 02335 g003
Figure 4. Mechanical property test setups.
Sustainability 10 02335 g004
Figure 5. Dispersion coefficient of variation (CV) results: (a) microfibers; (b) S fiber.
Sustainability 10 02335 g005
Figure 6. Slump results: (a) groups without S fiber; (b) groups with S fiber.
Sustainability 10 02335 g006
Figure 7. Enhancing coefficients of the compressive strengths and elastic modulus.
Sustainability 10 02335 g007
Figure 8. Enhancing coefficients of the tensile strengths.
Sustainability 10 02335 g008
Figure 9. Stress–strain curves of the groups with S fiber: (a) compression; (b) tension.
Sustainability 10 02335 g009
Figure 10. Toughness ratio (TR) enhancing coefficient.
Sustainability 10 02335 g010
Figure 11. Hybrid coefficients of the mechanical properties for different HyFRCs.
Sustainability 10 02335 g011
Figure 12. HyFRC comparison in terms of the six performance indexes (PIs).
Sustainability 10 02335 g012
Table 1. Fiber abbreviations and properties.
Fiber TypeSteel Fiber (3D 65/35BG)Microfilament Steel Fiber (OL 13/2.0)Polypropylene FiberPolyvinyl Alcohol FiberPolyacrylonitrile Fiber
AbbreviationSMSPPPVAPAN
Diameter (mm)0.550.20.0250.040.012
Length (mm)3513121212
Density (g/cm3)7.87.80.911.281.18
Tensile strength (MPa)134528505791560600
Elastic modulus (GPa)>200>2003.64112
Table 2. Fiber abbreviations and properties.
Test GroupWater (kg/m3)Cement (kg/m3)Coarse Aggregate (kg/m3)Fine Aggregate (kg/m3)Steel Fiber (kg/m3)Micro Fiber (kg/m3)Water-Binder RatioSand Ratio (%)Steel Fiber Volume ContentMicro Fiber Volume Content
P1178.0404.51086.5694.70.00.000.4439.0--
MS177.8404.11082.4692.60.07.800.4439.0-0.1%
PP177.8404.11085.0694.30.00.910.4439.0-0.1%
PVA177.8404.11084.9694.30.01.280.4439.0-0.1%
PAN178.8404.11084.9694.30.01.180.4439.0-0.1%
P2198.8451.8981.7677.60.00.000.4440.8--
S198.8451.8981.7677.678.00.000.4440.81%-
S-MS198.6451.4977.6675.578.07.800.4440.91%0.1%
S-PP198.6451.4980.2677.278.00.910.4440.91%0.1%
S-PVA198.6451.4980.1677.178.01.280.4440.91%0.1%
S-PAN198.6451.4980.1677.178.01.180.4440.91%0.1%
Note: P1 and P2 denote the two plain-concrete test groups. MS, PP, PVA, PAN denote the four microfiber FRC test groups. S denotes the steel FRC test group. S-MS, S-PP, S-PVA and S-PAN denote the four HyFRC test groups.

