1. Introduction
The optimization process is a never-ending activity in searching and finding the compromise, accepted by all players, for the considered optimal solution. The compromise situation—representing the conditions and what kind of optimum is obtained—is desired by any company for these reasons: making profit, ensuring sustainability or accepting a certain level of risks. One of the company indoor and outdoor bargaining elements in the optimization process is the quality level.
Generally, the optimization process shows that it is not necessary (or possible) to look for the best quality, but rather, for the “affordable quality”. In a product or process, quality comes with a price, the price that the customer is ready to pay for. The affordable (imposed) quality is ensured by the quality control as driving component for resources allocation and productivity control. Both elements are the result of “compromise”—the optimization process, and define the accepted risk for the resources allocation and the conditions that lead to desired productivity.
The accepted risk is the measure of the compromise (optimization), what can we win IF? and what can we lose IF? In the best scenario (win case) everybody is happy ignoring the difficulties that paved the way. But, in wishing for the best we have to look for the worst. In the worst situation the harmful effect of the risk is on the economic level that can affect not only the managerial staff (investors/owner, shareholders, etc.) and the company production capacity, but also the people that are in the company.
Even in the best situation, the risk exists, due to harmful effects on human health or to ecological systems in form of environmental stressors (chemical exposure, temperature, noise, fatigue, etc.) as a result of imposed productivity level. The conclusion is that in every situation, visible or not, there is a risk that affects the economic dimension, the social dimension and the environment dimension. The answer to the question: How can be diminished the risk level? is by considering a complex of components: technological and social research; education; responsible managerial decisions, risk assessment and risk management.
The comfort (ergonomic) level in an industrial activity within an imposed productivity, ensuring the affordable quality within an accepted risk, requires 3 types of essential activities: the productivity control, the quality control and the risk control. Any “installed” situation leads to new necessities and a new optimization process, with the related integrated improvements and interventions priorities, efficiently designed by having a correct evaluation of the productivity potential and the risks. That is only possible within a holistic life cycle management approach.
So far, in the everyday production or services activities, the economic impact or benefit of the holistic life cycle related activities is not always obvious. This work shows that an ergonomic managerial tool called LY-MIT (LifecYcle-Managerial Index Tool) has been developed and that this tool enables managers, as well as the industrial end-users, to sustainably assess and evaluate the productivity potentials and risks of possible life cycle related improvements to their installed base.
The “tool” has been developed and improved for industrial manufacturers as well as their customers, for a better and ergonomic process control. The monitoring interface of the LY-MIT consists in a spider diagram that considers 7 major axes (the technology, the human resources, implemented strategies, etc.) that enables the overall performance evaluation of the company on a scale from 0 to 100 (100 representing the best).
Different methods for grabbing the process data are used, from quantitative values machine status data, programming parameters, IoT protocols and transmission, to qualitative data from the related questionnaire, harmonized with related impact evaluation based on literature reviews, supplier information and customers’ satisfaction. Using a Likert scale ranging from one to five the capability metrics were considered for the tamed clusters, each assessment method including a few items to be checked against pre-defined evidence of attainment. The suppliers were provided with a simple self-assessment questionnaire, including N multiple choice questions designed to address the specified applied outcomes.
The core capabilities, grouped in clusters, were used to design the multiple choice answers. The choices for each question were linked to the rating scores on the SurveyMonkey or Google Forms platform, or expert’s decision after analyzing the internal status in accordance with the access granted by the company. The offered example considers the some “driven questions” addressed in a self-assessment applied questionnaire, or coming from investigation experts. The offered answers enable the scoring of the company status:
About the IT (Information Technology) infrastructure and conceptual structure, the questionnaire reveals:
Single servers, cluster of servers or a server center is used?
Cloud computing is an option or an already applied solution?
How old is the oldest server, the oldest workstation and the oldest laptop still in official use?
The information about the company data and the data management starts form considering the data sources and data storing facilities and therefore the hardware, as a tool, is a first considered element. But the management capability is given by the software packages so the next step is to be performed an analyze concerning:
The software combination and platforms for the system control?
The age of the acquisitioned software package?
The design of the maintenance process?
The frequency of the updating activities? etc.
Coming to the future, in the third step are analyzed elements concerning:
The software platform is still adequate for the actual activities?
If Yes, which is the latest release version on the market and how much is the difference between this and the one used within the company?
What other software platforms, for similar purpose, are on the market?
Is the used interfaced updated to the companies ‘system capabilities?
It is capable the software platform to be interfaced with new equipment, robots, and data flux management software, added to the company manufacturing facilities?
Regardless how modern the equipment is and how performant the software is, people are always needed to implement, operate and maintain the IT system and therefore they must be considered and following details must be identified within the fourth step:
How many process specialists are usually active within the company?
How is the trend for hire process specialists?
How intensive are they used (full-time, part-time, occasionally)?
What ratio is between white collars and blue collars?
How often and what type of retraining or updating programs are offered to the employee by the company?
How many people are following these upgrading programs?
Within the digital era the intercommunication between companies is 24/7 and must cover the entire planet. The product design, product simulation, tasks management and the supply chain management are based on syncron technologies, designed to be capable to interconnect in the same time specialist from the entire world 24/7. Therefore, the fifth set of questions are related to this topic:
The company communication infrastructure is available 24/7?
The communication is available 24/7?
The technical support is available 24/7?
The systems service and intervention is available 24/7?
For the company process control, the control system requires qualified peoples for implementation, operation and maintenance. But any control system is designed for the company technological attended stage and therefore the company sustainability implies a continuous development of the process control system. Usually that has not happened, with companies’ management preferring to updated the existing process controlled system based on planning horizons.
The LY-MIT customization is made for each company, after the interview with the company responsible and managers in a structured manner. In the end the company status is reflected on the LY-MIT interface, the medium and long term objectives being structured in the LY-MIT format. The generated benchmarking activity will show the change dimension, and integrated within the holistic life cycle of the process will support the change management activity. The deviations in the superposed spider diagrams deliver the basis for the necessary actions to be taken to reach (or to keep) the maximum life cycle success of the company over the considered life time horizon.
The LY-MIT initial was virtually tested on different forms of origins and then applied on almost 300 customer companies, being a domain or branch free tool, with the most important element being the customization on the company’s individual objectives. As an adjacent aspect, within the practical estimation, 5 major types of company operators are identified. This discovery was associated with the elaborated solution to identify the major hidden potential for each case, and to raise the life cycle profitability.
The success of LY-MIT is that in its absences, most of the companies managers fail on long-term (sometimes even on medium terms) to plan cycles that reach the full potentials of their company. On a first estimation the optimum planning horizon for life cycle related activities is from the perspective of 5 years (the average value of the identified interval from four to six years), enabling the end-users to establish an RFPC (Rolling Forecast Planning Calendar).
RFCP enables continuous life cycle monitoring, offering stability by reducing the risks and increasing the profitability in today’s rapidly changing times, also enabling the design for an according service level management portfolio meeting the customer demands.
2. A Lifecycle Index for Robotic and Automation Equipment
In today’s daily business life, we find a statement, or similar expressions such as:
“The first machine is sold by the sales people, the second one by the service department”.
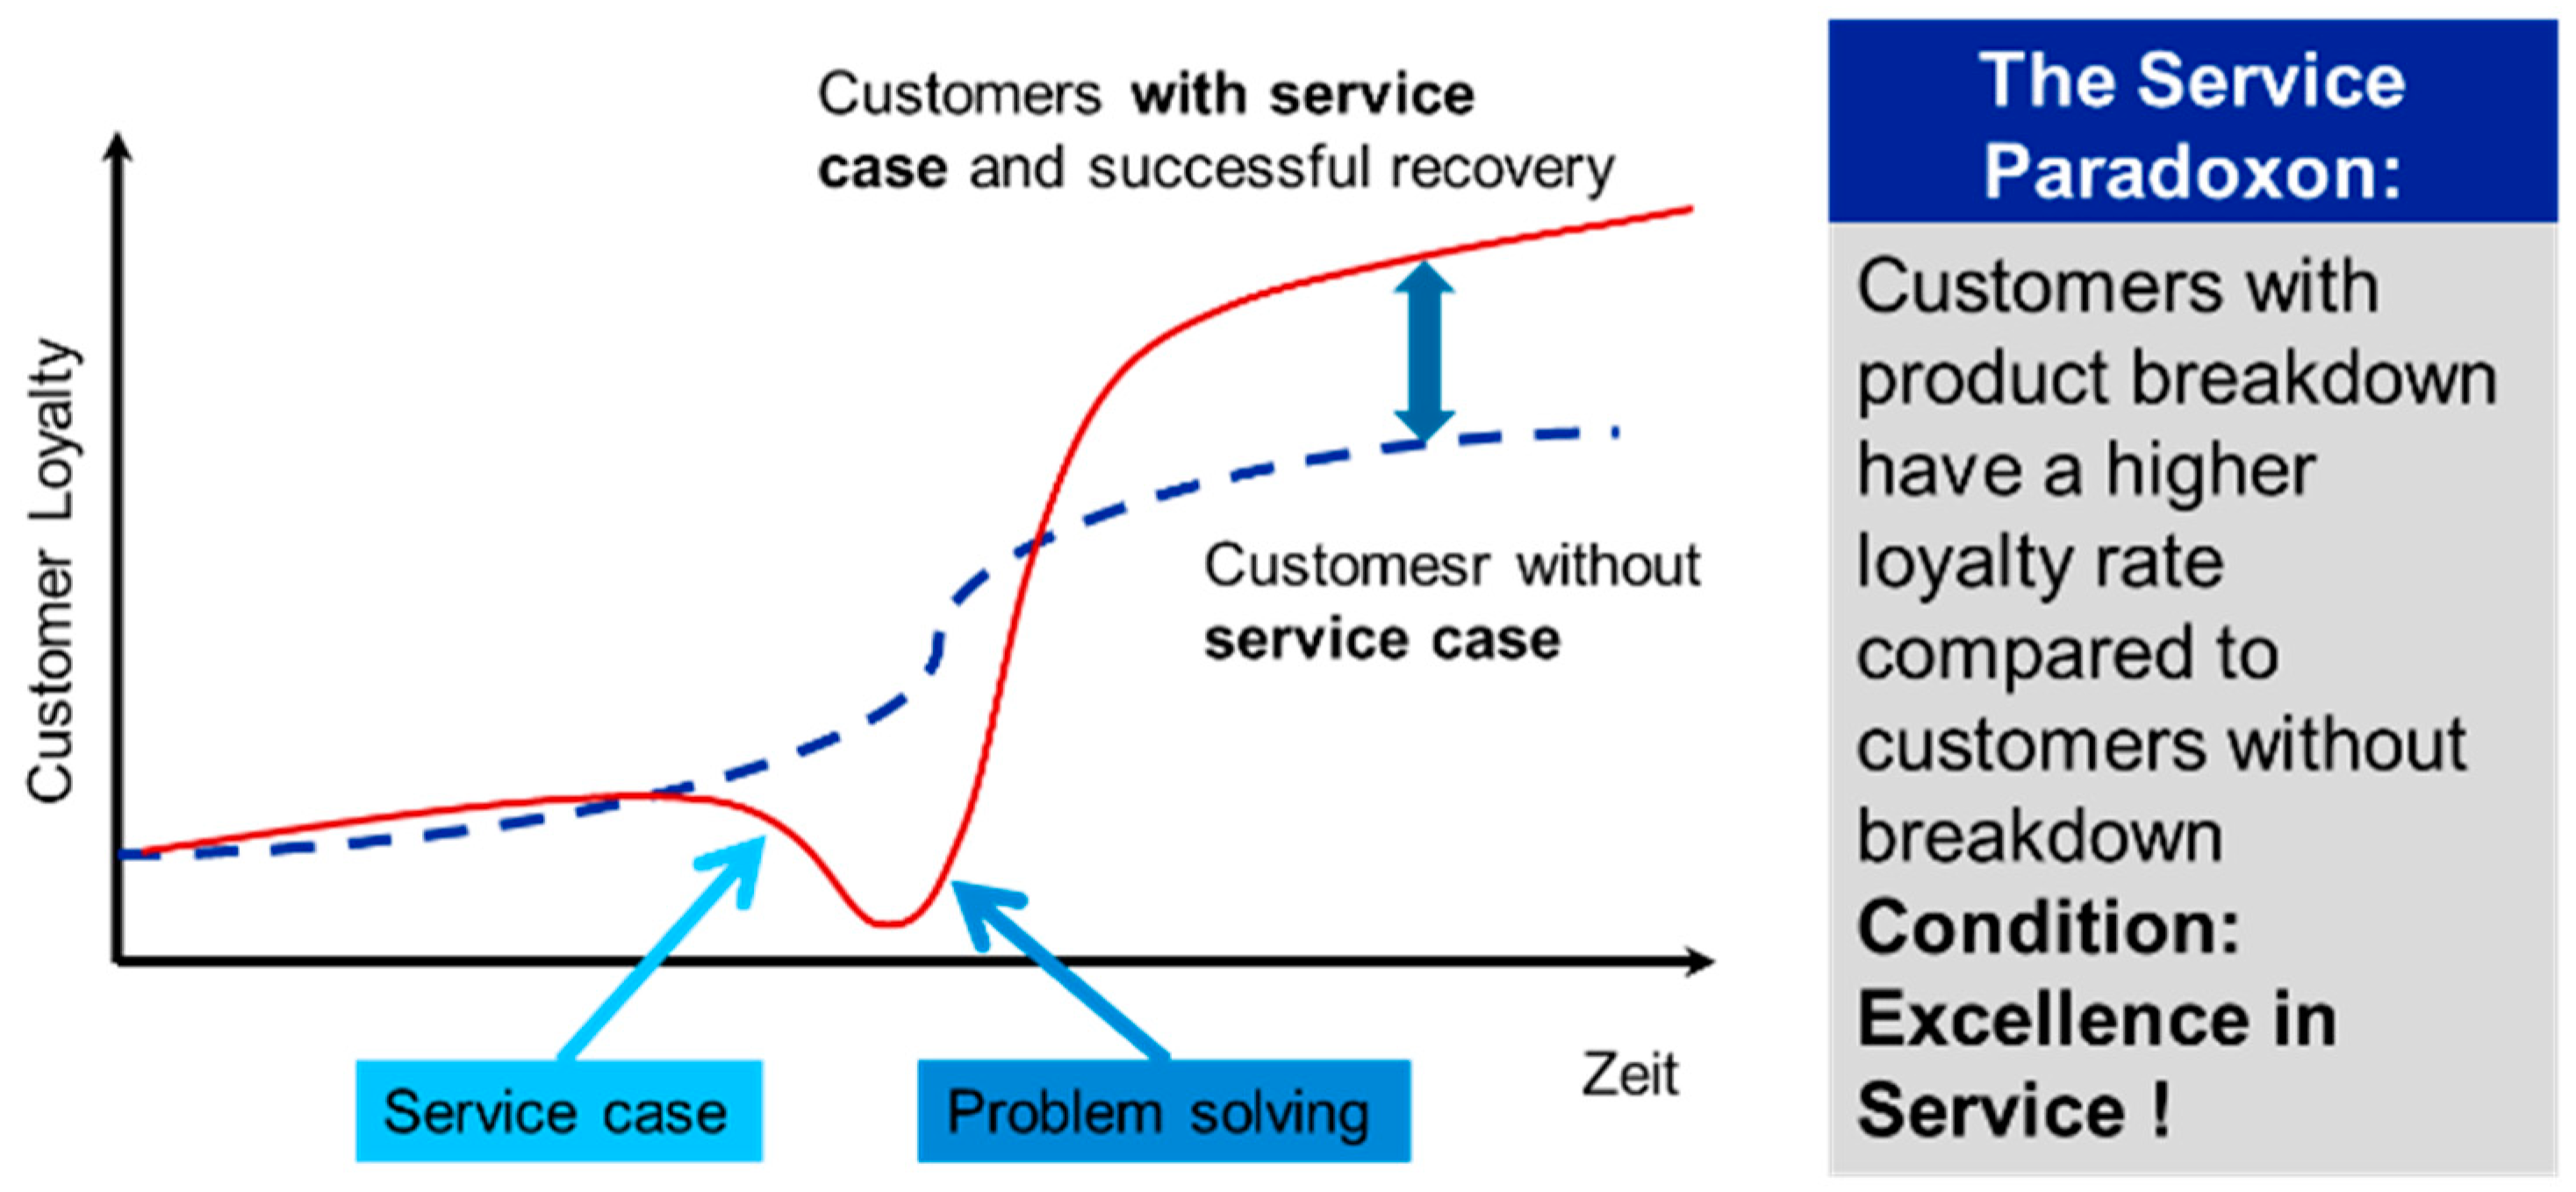
This shows that a successful service (recovery) is the key to long lasting customer partnerships. There are more than 30 years since Etzel and Silverman [
1] identified an interesting research field in the service and service recovery, as long as the service failure can lead to the customers (clients) dissatisfaction and negative disconfirmation the efforts in the service recovery may restore a dissatisfied customer reintroduce it in the satisfaction state.
This phenomenon has been termed by the two authors as “The service recovery paradox” [
1]. Their studies show that the customer loyalty to a product or company can be fostered and raised by delivering excellence in service after a breakdown. Customers might even think more highly of a company after it has corrected a failure with a prompt service response, compared to how he or she would regard the company if no service failure had happened,
Figure 1.
Industrial robots have existed since 1961 when General Motors introduced the UNIMATE robot on the production line. From the beginning it was known that, without numerical control, these systems could not exist. The two main components, the machine tool and the robot can be connected practically to any manufacturing system because they may switch from one product to another or reconfigure the product processing path by calling a new program without requiring further adjustments or preparatory activities.
For a controlled manufacturing system, one single command equipment or a single centralized numerical control is available for all machine tools and robots in the loop. For both machine tools and robots, there are over 600 specialized programming languages comprised of codes and instructions. In spite of the fact that the origin of these languages is the famous G Code (developed in the 1960s by the EIA—Electronic Industries Alliance), and that there was imposed an EIA standard that is still running parallel to the ISO programming standard, it is very difficult for managers to combine and plan the efficient mix of robots, machine tools, trained people and operational programming systems.
With the I4.0 (industry 4.0), robotics play a new role being classified into different categories, depending on their function and market needs. As long as the robotics is a technology at the cusp, long accepted by industry to improve factory quality, performance and efficiency, it is recognized that for at least three decades becomes a key technology in engineering industries such as aerospace, automotive, electronics, home appliances, etc. Once with the Industry 4.0, the degree of robotization and automation in a company increase and is expected a continuous growth. The increasing competitive pressures in many industries, coupled with declining perceptions of customer service and the introduction on larger scale of the service robots, have led to increased attention to service recovery.
The International Federation of Robotics (IFR) defines service robotics as “a robot that performs useful tasks for humans or equipment excluding industrial automation application.” While in general, industrial robots tend to be large arms or gantries and service robots tend to be smaller and mobile, the definition is dependent on the end application rather than the pure form or function of the robot. The IFR continues to refine robotics definitions and track industry statistics.
In the Industry 4.0 and co-robots (cobots) environment, the Service robots are at an inflection point, opening new contexts for productivity gains beyond what industrial robots have done, performing much more challenging tasks than those in the above applications. In the same way as the mobile phones and laptops have changed our daily lives, robots are poised to, sooner or later, become a part of everyday life, as our coworkers but also as appliances, servants and assistants, as our helpers and eldercare companions, assisting surgeons in medical operations, intervening in hazardous or life-critical environments for search and rescue operations, and operating in field areas like forestry, agriculture, cleaning, mining, freight transport, construction and demolition, etc.
Robots currently do many industrial automation repetitive tasks, such as assembly (that human workers often do not appreciate) where not much intelligence, but decision-making skills are necessary. The capacity to reshape in a more “intelligent” way the production models and facing an increasing of required personnel, service robots have the potential to fill this void in the coming years.
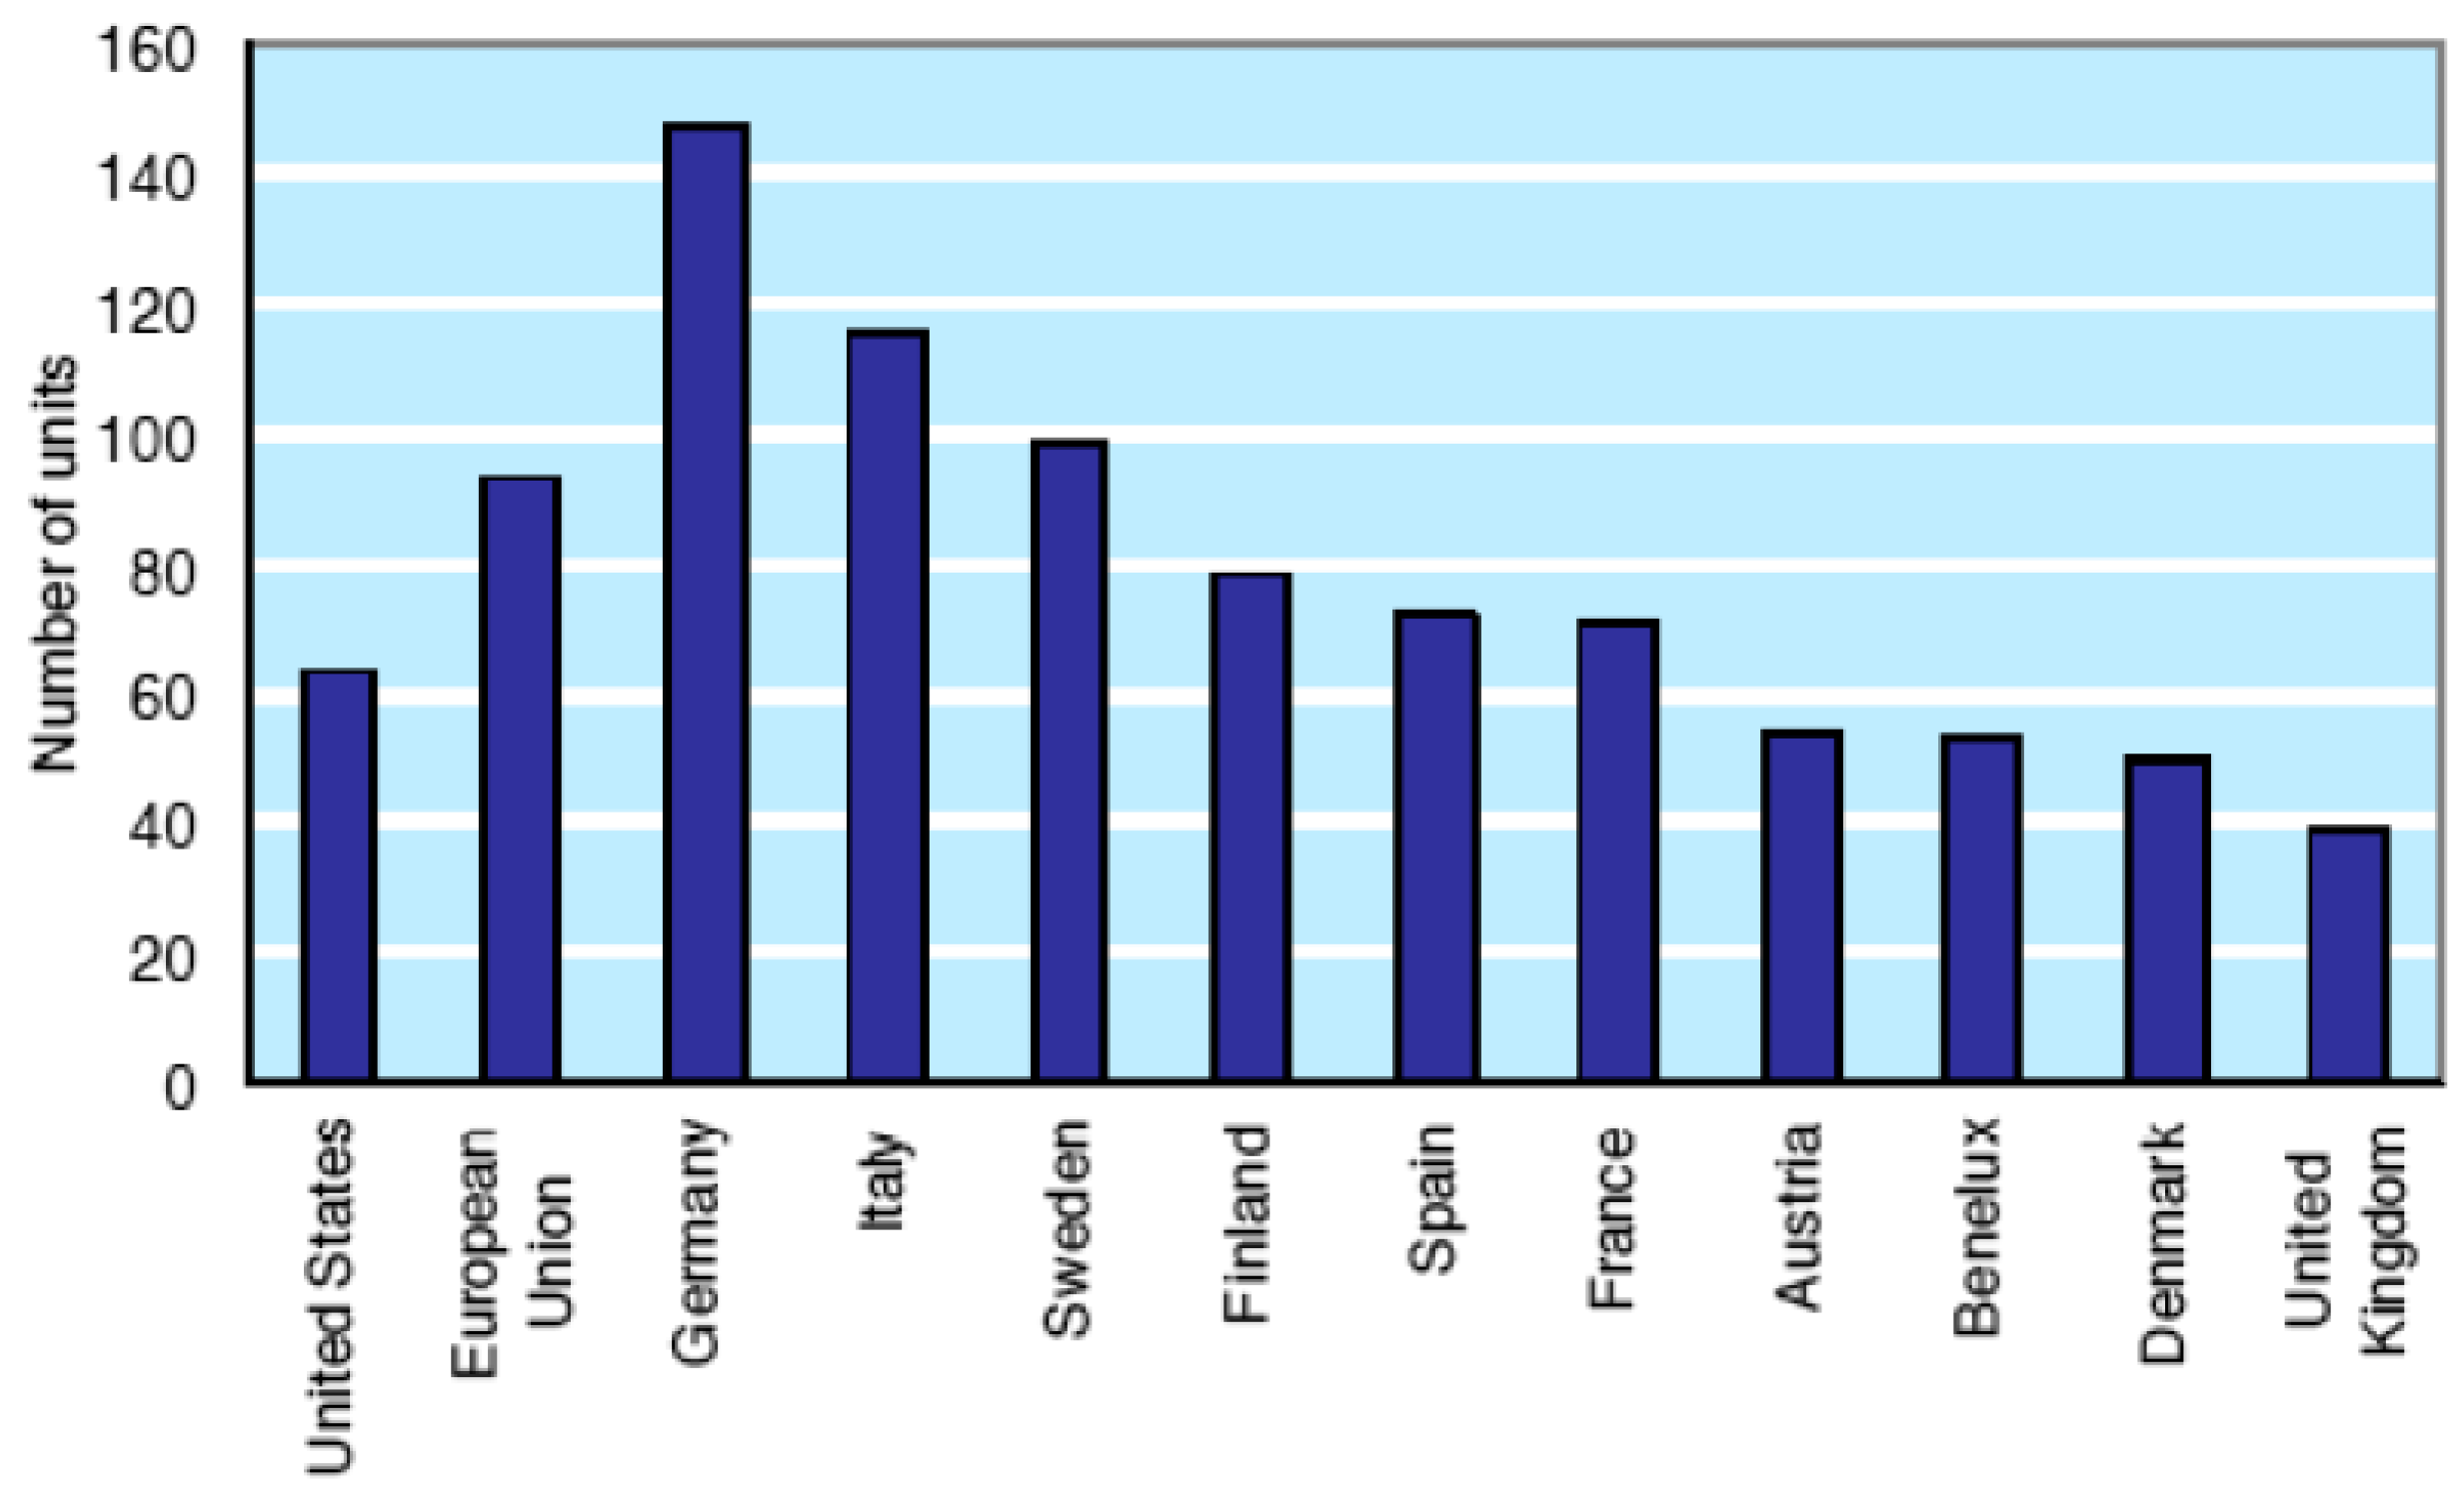
Figure 2 shows the present ratio of robot to human workers (robots at 10.000 employees) within the manufacturing industry in 2016, which is set to continue and increase.
From
Figure 2 we can see that Germany is in the most favorable position regarding the digitalization implementation in industrial manufacturing companies, that from the engineering and management research point of view, is an opportunity as long as these values are essentially influencing the European Union ratio index. In Europe, robotics is a very active research domain; it is estimated that some 250 universities and research institutes offer education and research in robotics.
For managers, the digitalization and the robot deployment is actually a must, in spite of the list of added problems, due to the trend (necessity) toward smaller and customized production volumes in parallel with increase in the products variety. As the volume of produced products decreases, hard automation investments become more expensive and robotics is the only alternative to manual production. Considering that the 3D technologies and larger availability of robotic structures brings easily new startups and competitors on the market, this is an accumulated “risk” that managers have to face, but the good news for managers is that in Europe it is created a wide basis in qualification and knowledge. Robotic networks such as EURON (
http://www.euron.org) and professional organizations like EUnited Robotics, (
http://www.roboticsonline.com) significantly contribute to improve the coordination of European research and innovation related activities. Based on this innovation and research strength, the good news for researchers is that the growing market of trained personnel and robotic applications has led European SMEs to invest more in the domain of industrial and service robotics.
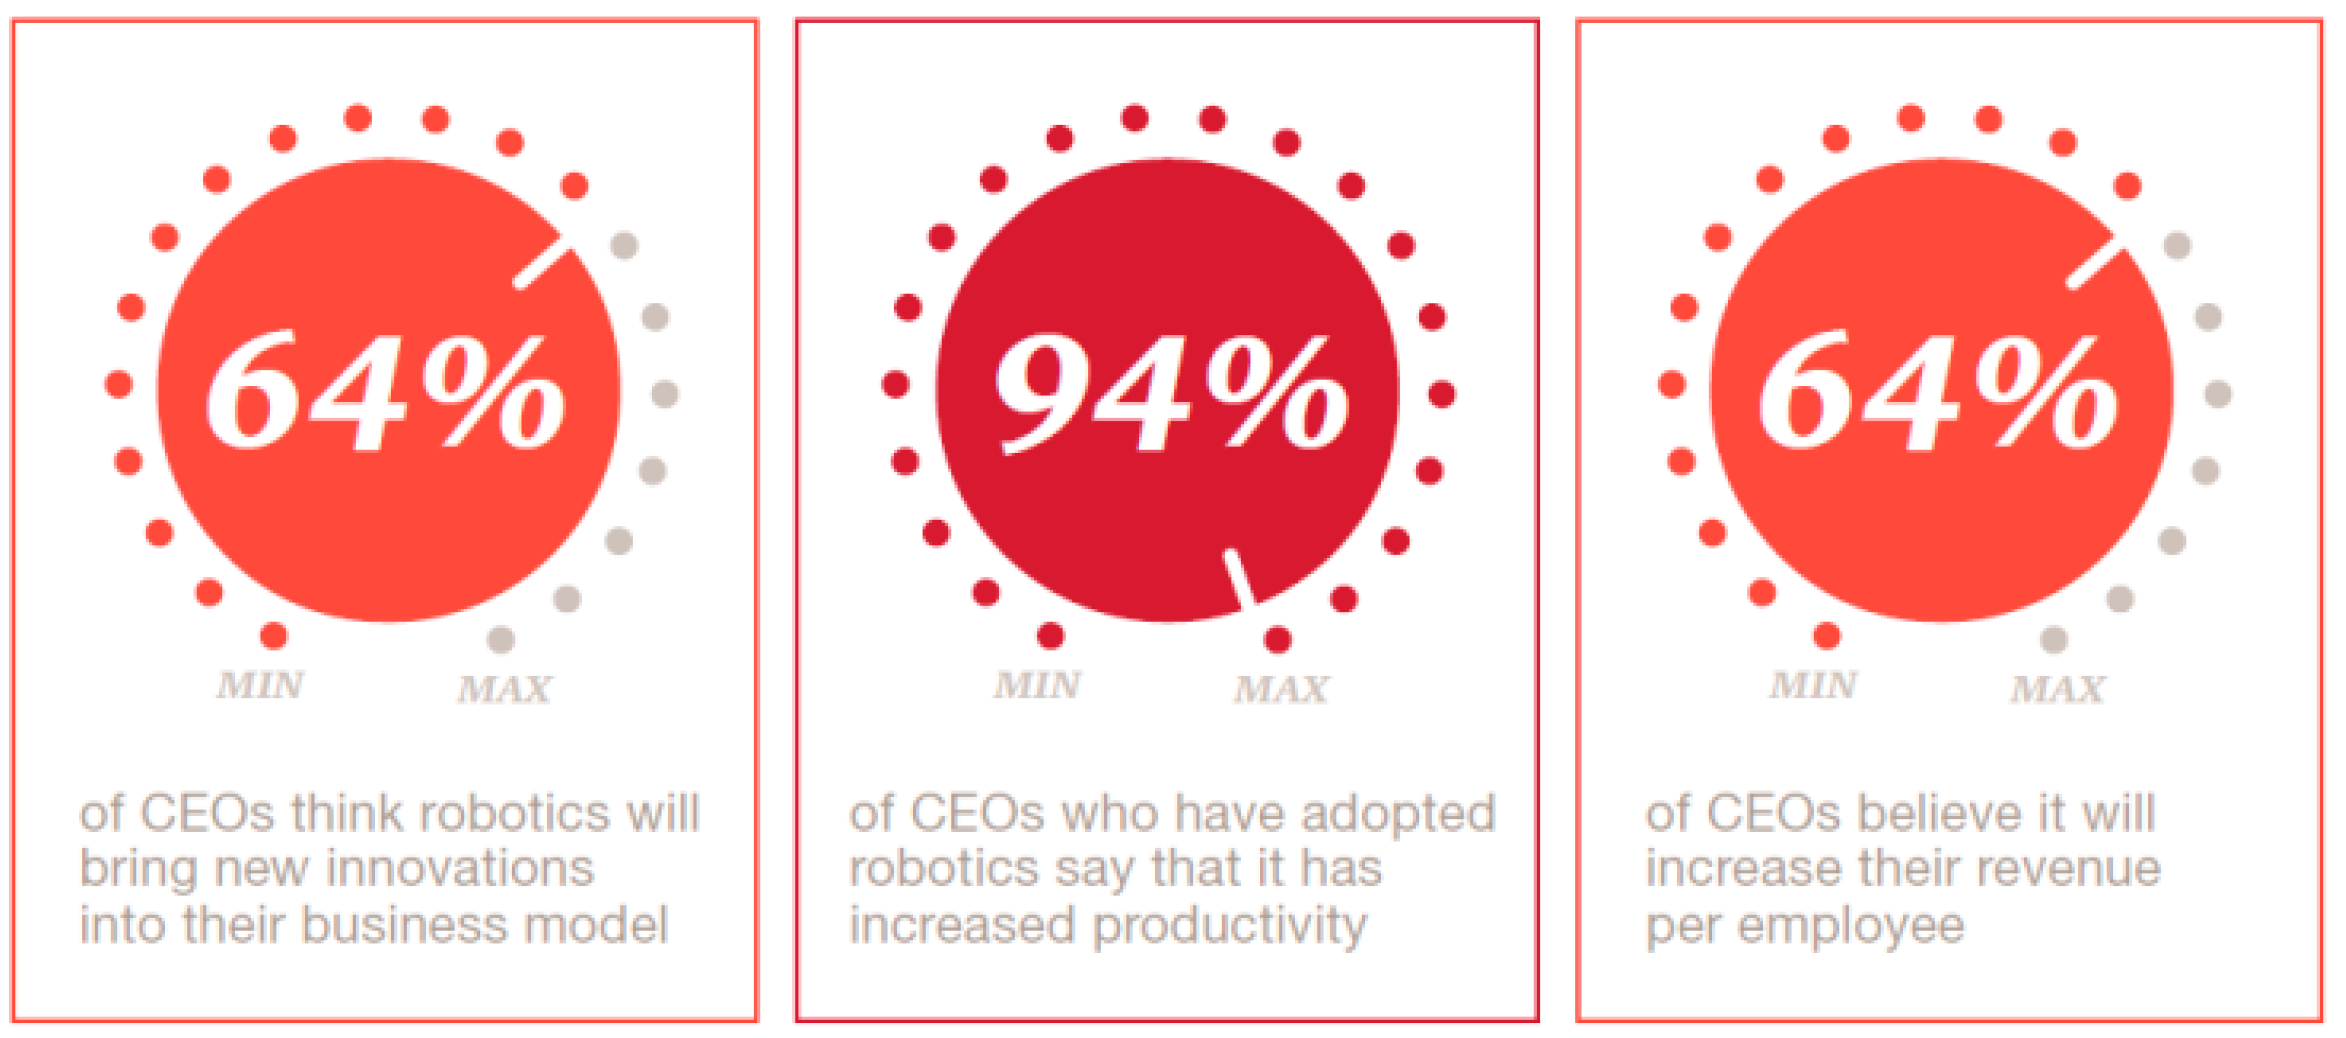
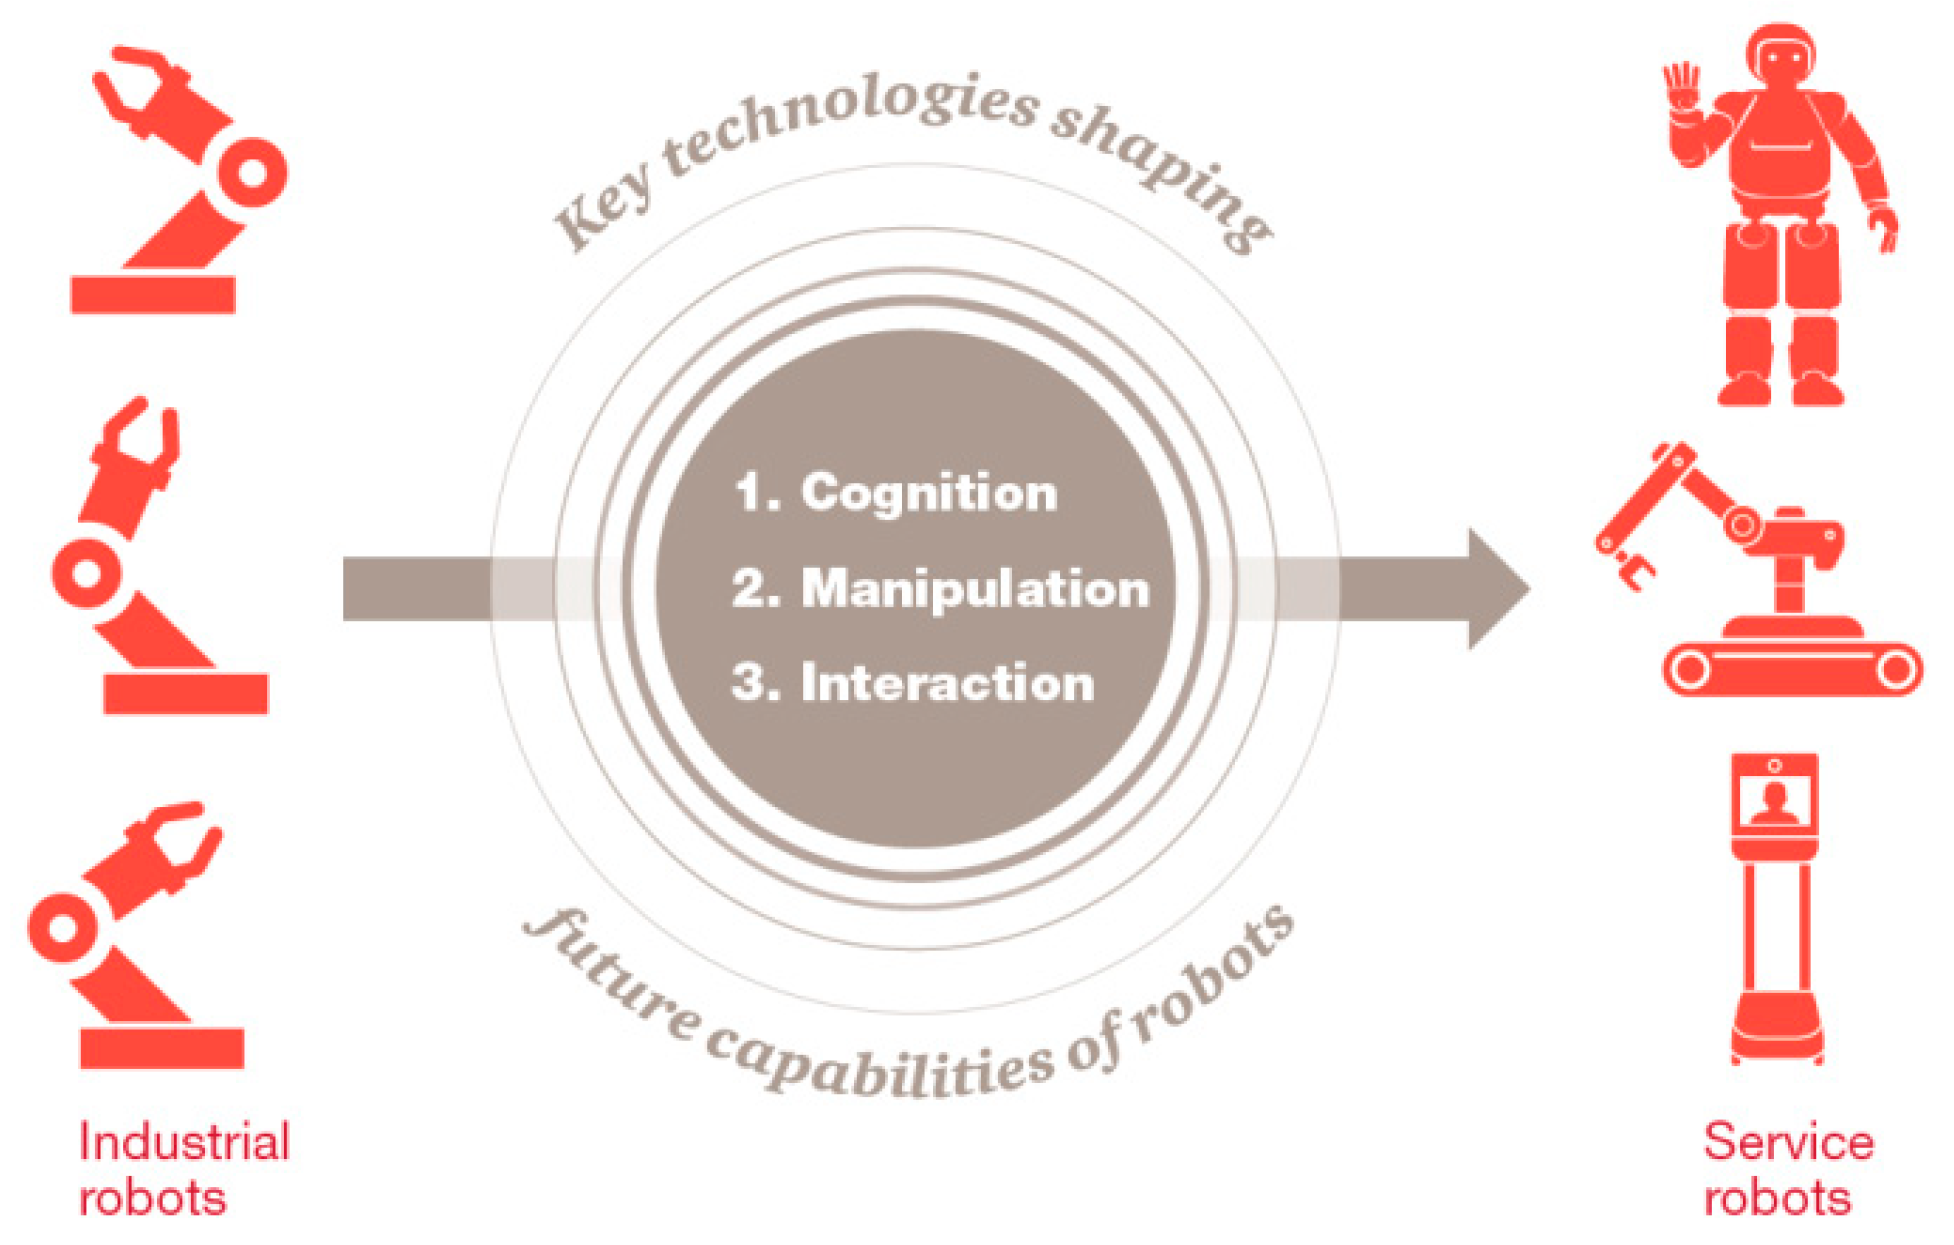
As PwC (PricewaterhouseCoopers) reviewed the fundamental challenges for advancing robotics, it became clear that they are not isolated topics (see
Figure 3 and
Figure 4). To reach the maturity level, the advancements are practically grouped in three technical domains:
The PwC CEOs have been upbeat about the productivity potential from robotics; the risk factor essentially diminished as 94% of the current robot users companies say they increased productivity in their business, largely from industrial robots in circumstances where a robot’s speed, strength, and consistency are ideal for working on dull, dirty, and dangerous tasks.
Systematic studies among different types of German companies, but mostly in the sector of machinery and plant construction, show that about 75% of possible service business is executed by competitors or third-party suppliers, with the manufacturers achieving only about 25% of the possible revenues in this market. The work shows how a multinational company in the area of process automation may improve its service business towards a proactive service partner for their customers over the entire life span of their products [
2,
3] and therefore, the primary conclusion that companies with the ability to react to service failures effectively and allocate the required resources to implement some form of service recovery will be in a much better position to retain profitable customers, as also shown
Figure 1. The complexity and the investment costs for machinery, robots and the process control systems nowadays define that the acquisition of this systems easily lead to a lifespan of more than 20 years—provided that they are looked after and maintained correctly.
Ready or not, the concentration is not only on the technical system and on the managerial procedures but also on the human managerial and leadership skills. The pressure coming from a company leadership (regardless of the company dimension) is on so-called leader demanded knowledge, that nowadays is accepted as a combination of natural competences and trained ones, both leading to better adaptability, and assessed through such tests as the NEO Personality Inventory.
The need to focus also on the personal managerial skills came from the fact that management for sustainability potentials and risks, considering the productivity and the lifecycle cycle holistic approach, is possible if the manager is not exclusively focused on the client but also on the employees as a major asset in the company. Within the proposed indexing tool the employee must be seen as payed-volunteers, a complex entity with motivation steered trough external but also internal factors. The cognitive, spiritual and emotional competences must be properly identified and exploited by the manager. The sustainability of the company actually depends on the manager’s capacity to instrument these three elements. In combination with the existing physical techno-economic environment the employees (as a mentioned element mix) confer stability by having a better realistic establishment in the objective definition, exploitation of the system flexibility and the control decentralization capacity.
At first, the manager must identify his or her own aptitudes and competences, and role as monitor, mentor, facilitator, inventor, broker or coordinator depending on the faced situation. In any role position, communication is essential and therefore we are back to the digitalized era and the data transfer (accurate, consistent and just in time) but are elements as accents, frequency, and speed are very dependent on the Manager temperament.
The work is considering the studies in leadership and managers training processes in developing the Lifecycle-Managerial Index Tool. In order to delegate tasks, the managers need the LY-MIT to avoid unnecessary stress and efforts and conscious relationship.
The change and change management can be a source of conflicts and therefore the transparency offered by LY-MIT in describing the goals and the necessity to reach these goals made of it a valuable tool, in forming performant working groups based on a new tactics in presenting the change process, training the personnel and the staff implication within the change in five stages: initiation/preparation for forming the target group; definition of the change vision, monitoring the staff reactions and evaluating the resistance level; the change; people motivation trough awards and publication of the effects of change detailing also the new links between departments and peoples and remaining problems; change evaluation for the company, reconsidering the staff emotions management, and building or consolidating the brand.
Thanks to the LY-MIT, the management operators can now record, assess and plan the productivity potential and risks of their control system installations in an objective manner [
4], within the process control the maintenance, service and post service activities are included.
The new developed tool must compete with other sustainable manufacturing assessment tools developed by different research groups. Generally, the “competitors” solutions are based on single reference particular solution considering (energies resources availability, cost and greenish; the supply chain together with the environmental impact; social based sustainability; or the application of advanced technologies within a classical manufacturing process.
The current empirical research and implementations reveals that generally, not the entire resources supply chain is considered and no specific capabilities are proposed. Therefore, there is still a need for managerial tools, such as the proposed Managerial Index Tool, applicable on a broad range of industries, associated with the company capabilities, to provide a real sustainability and controlled risk.
When it comes to process control systems, the company managers are increasingly assessing upgrades or new installations based on the: “contribution they make towards achieving long-term productivity targets” [
5]. In these approach the Life cycle management means “… not talking about forecasting the future, but shaping it…” [
6].
There are essentially two strategies: In some cases, the focus on an increase in productivity lies on maximum output whilst investing the same amount of materials and energy. However, more often, the company managers try to achieve the planned sales volume with minimal outlay. The more efficient use of resources is therefore an important motivating force for companies looking to achieve lasting competitive advantages [
7,
8].
3. Results Applied in the Implementation Process
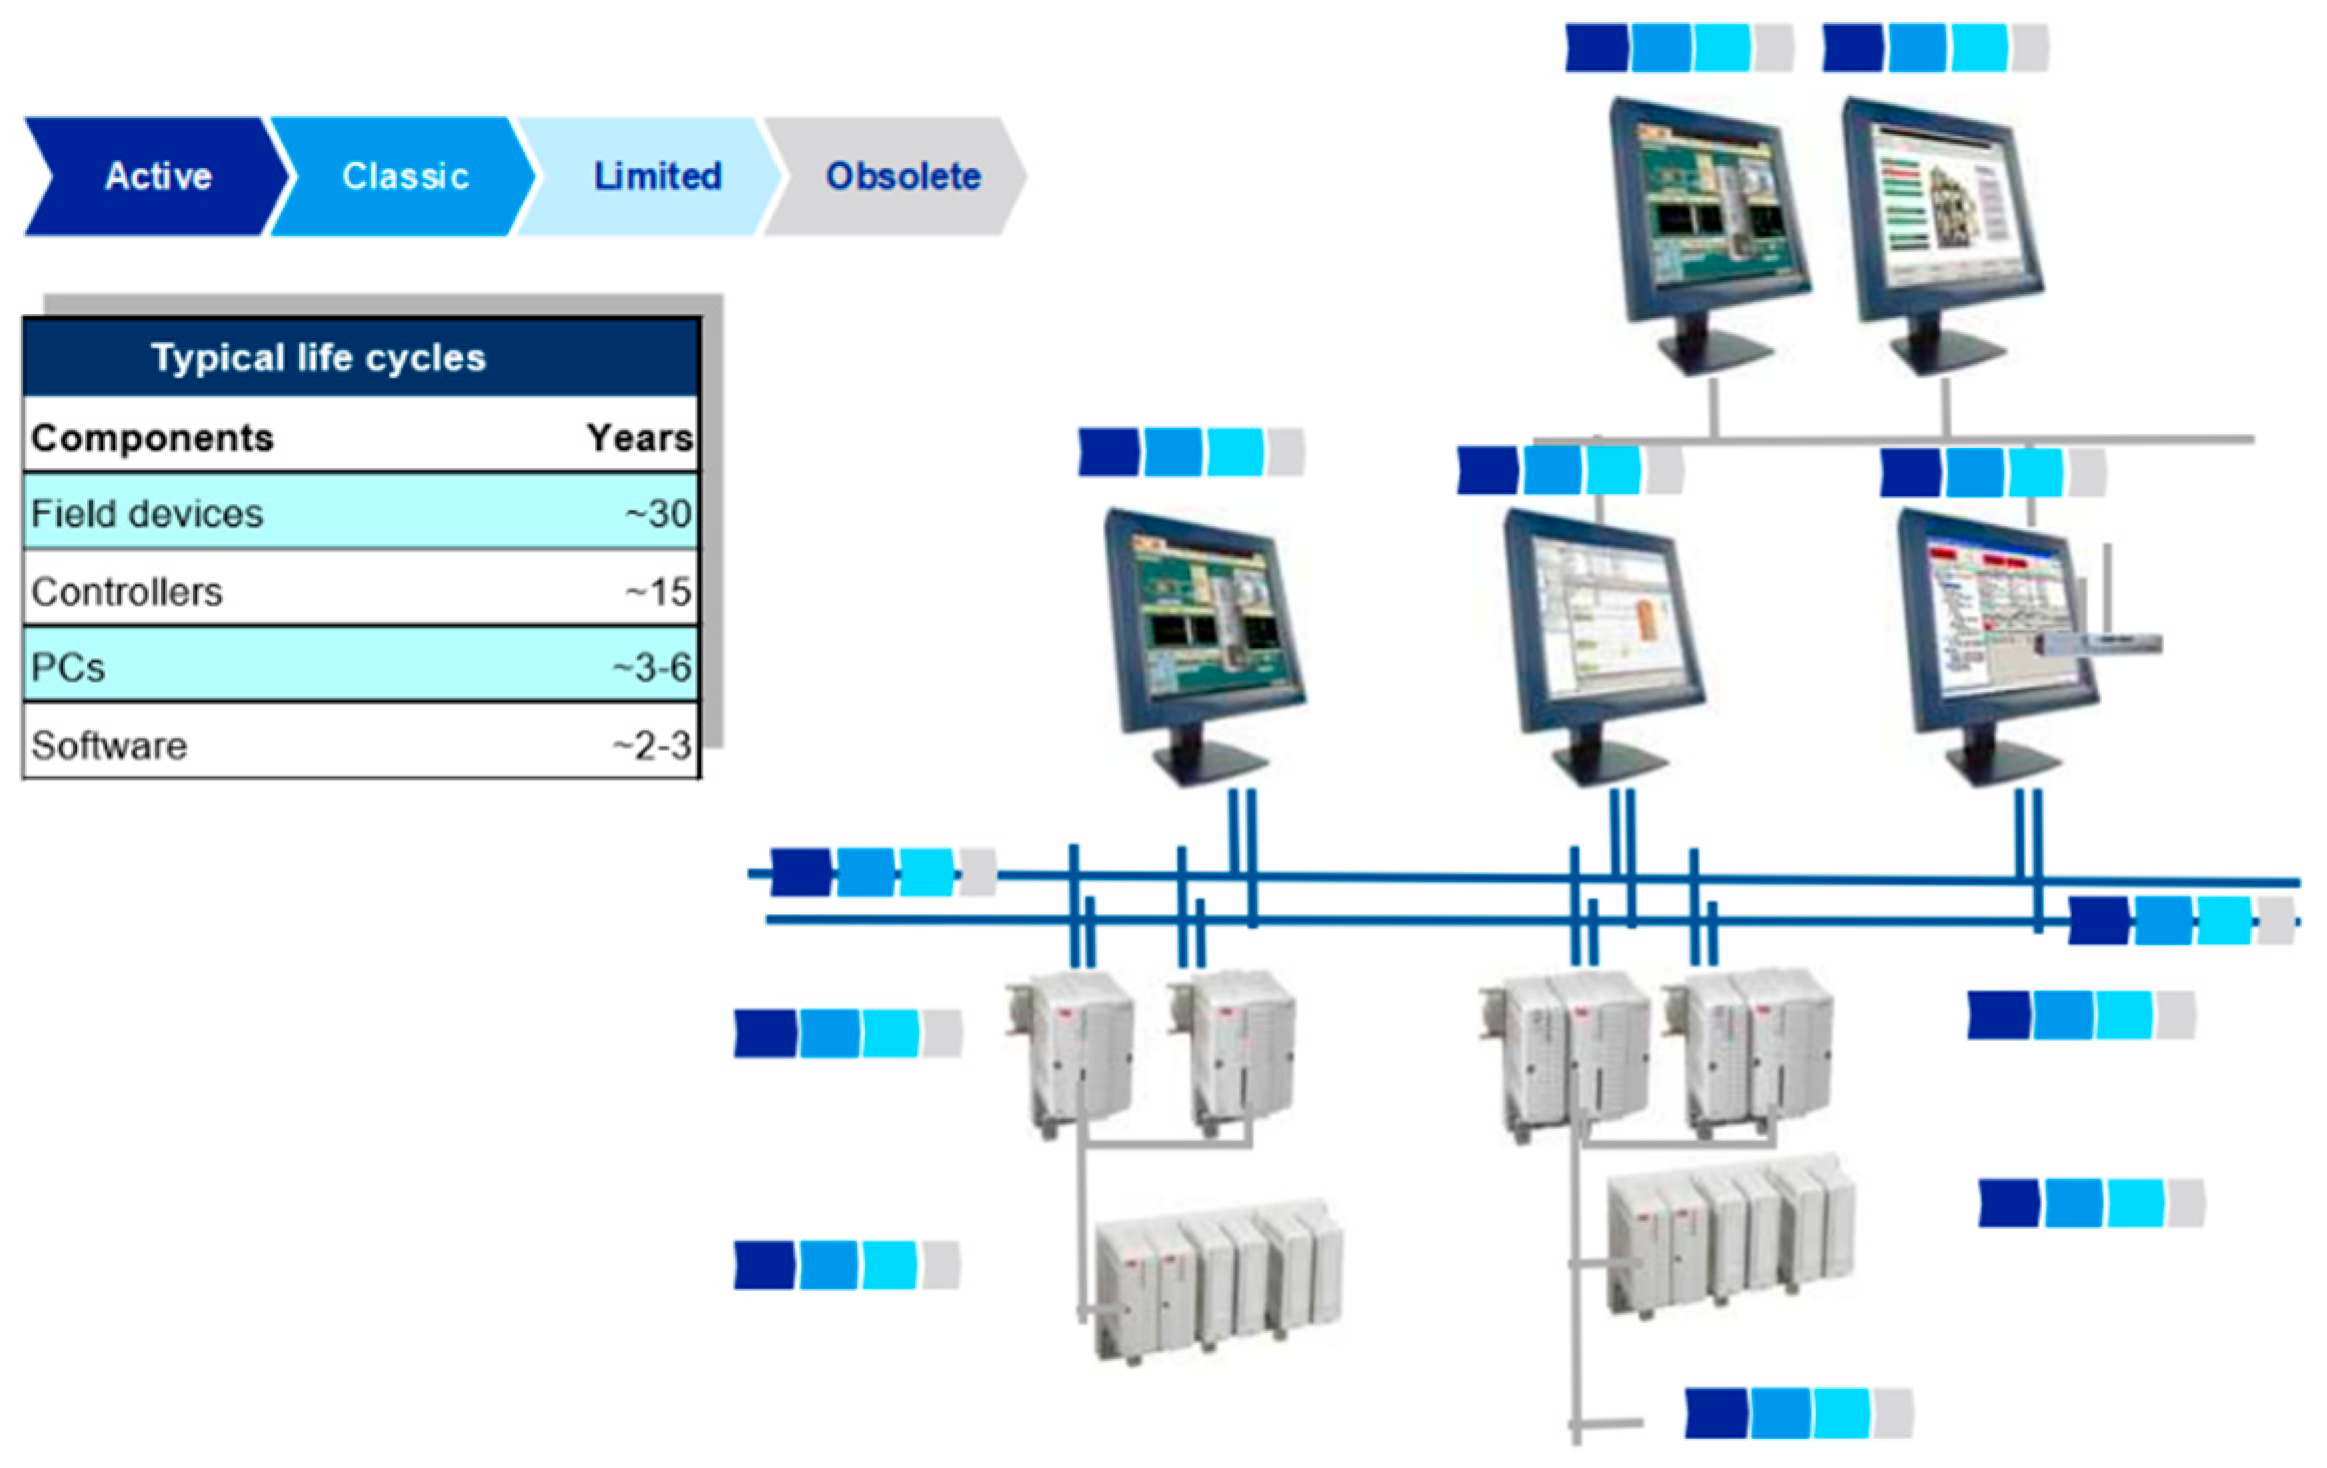
As far as the “minimal use of resources” is concerned, managers want to know which follow-up costs will be incurred after installation and how the control systems can help to ensure that processes are managed efficiently. Increasingly, they examine the entire life cycle of the production facility, which can often mean a period of more than 30 years. This poses major challenges for control system manufacturers, as the lifespan of the individual components which make up a control system can vary considerably,
Figure 5.
Only the cabling roughly matches the lifespan of the entire production facility, although I/O modules and controllers can have a lifespan of 20 and 15 years respectively, according to the machine-tools and installation renewable rates. Technical obsolescence and innovation cycles mean that computers and software remain economically viable for only three to five years. Successful life cycle management for process control systems must address this problem from the point of view of the compatibility of hardware and software components [
9]. Only in this way can companies protect their investments in automation technology on medium and long term and operate a user’s individual applications in a “future-proof” manner.
The manufacturer has put in place active life cycle management for each particular process control system, based upon a group-wide and standardized life cycle model which applies to all parts of a process control system, covering the hardware and the software used at the control level, the controllers, the network and the I/Os,
Figure 6.
Manufacturing involves continual management of inter-related activities and disciplines from product design, prototyping, processes and production planning, resources purchasing, staff management, legislation compliance and conflicts management, all together based on engineering: multi-criteria decision-making, sustainable manufacturing process, management comprehensive economic and risk avoiding decisions.
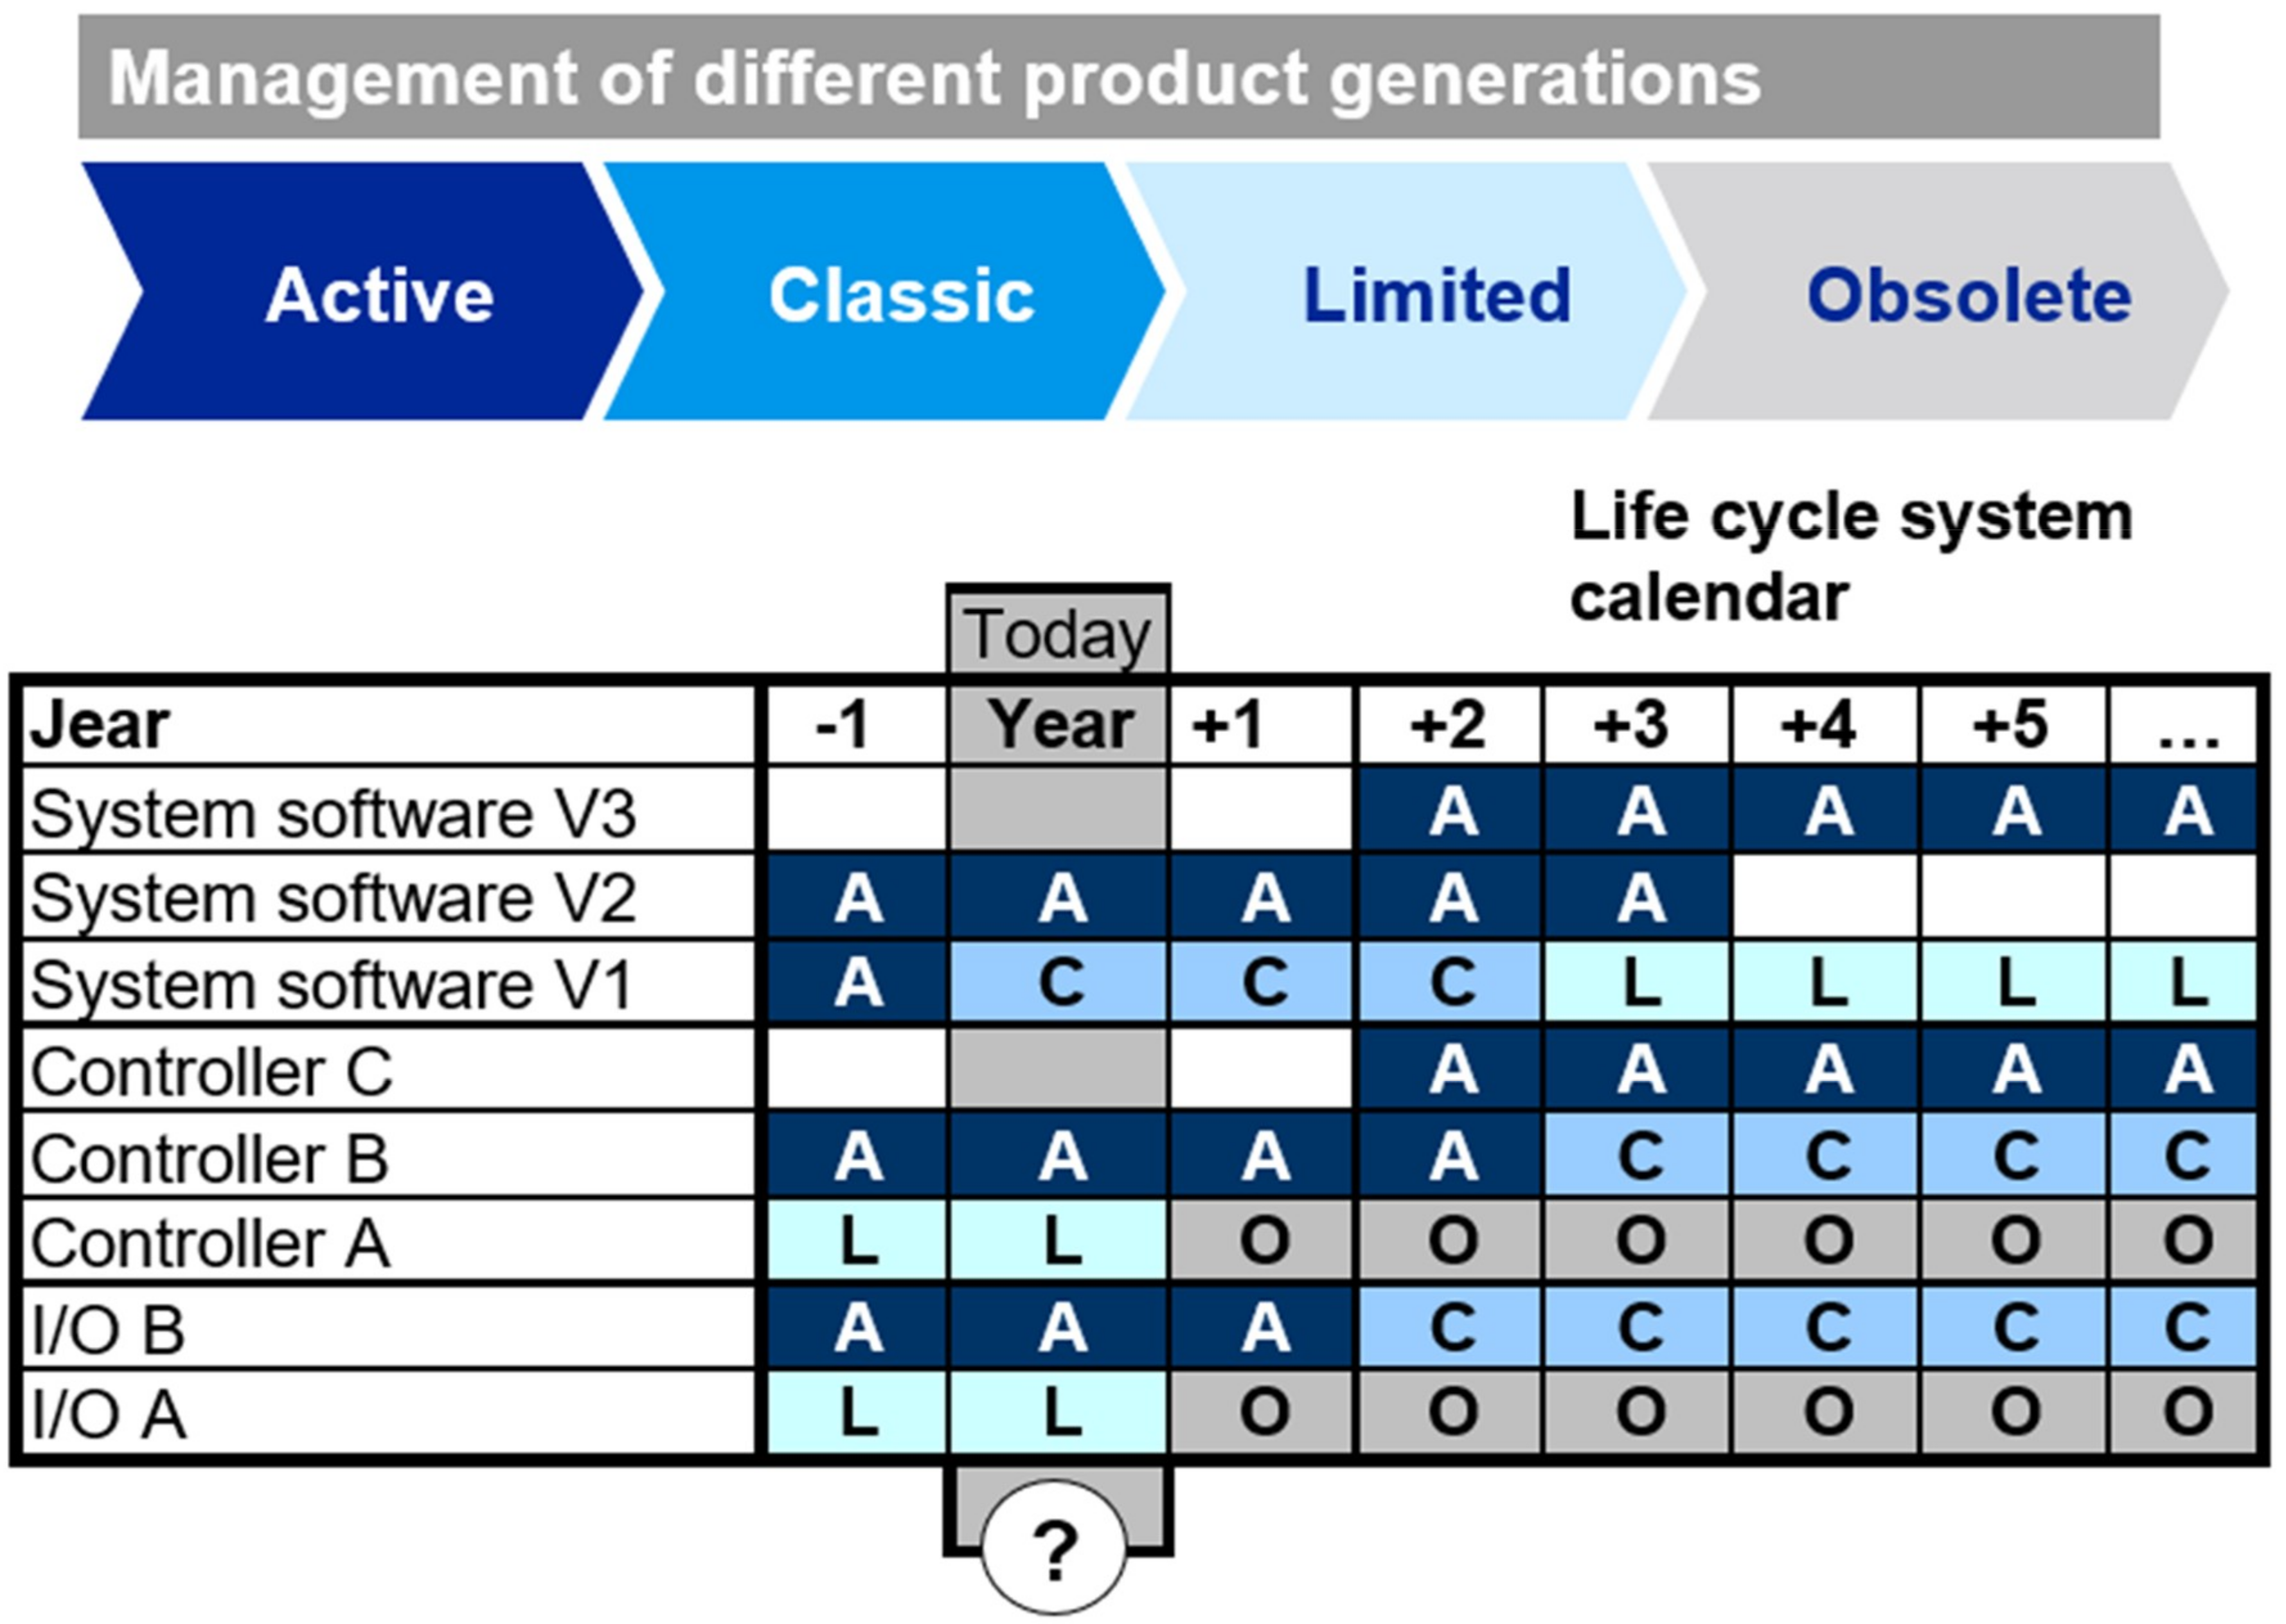
All of the manufacturer´s control systems are designed to allow continuous further development (the system evolution), but the useful life of the individual components differs, although they run through identical life cycles. Especially when a component is nearing the end of its designed life cycle, this principle allows migration to what is then the current product generation.
By synchronizing the various lifespans, the manufacturer is able to ensure that the entire process control system is technically up to date over its whole life cycle. The concept subdivides the life cycle of a product into four distinct phases: active (growing), classic (exploited), limited (still valuable) and obsolete. Every product goes through these phases, which differ in terms of the product support and available services. The modular structure of the I&C equipment and the staggered time plan offer two benefits: the life of the company can be supported on a long-term basis and the technological progress can be integrated into process control on an ongoing basis.
Moreover, the unequivocal allocation of the components to product life phases provides reliable information about the availability of spare parts and the product support the supplier can offer. This planning certainty not only increases the overall system reliability, but also improves the performance and availability of the company [
10,
11,
12]. The use of life cycle management for process control systems provides an important opportunity to optimize the benefits of the systems over their entire lifespan. In order to maintain or even increase the productivity of a company on a sustained basis, it must be possible to assess its performance over its entire life cycle.
The managerial—lifecycle managerial index tool—was developed in consultation with and for the manufacturer and extended then to costumers and participating suppliers, reviewing the sustainability targets in accordance with the implied local and EU legislation within the ISO standards. The framework comprises of seven levels termed clusters, applied outcomes, and capabilities. The LifecYcle-Managerial Index provides objective key data for analyzing, assessing, documenting and controlling the productivity status of a company. The key data reveal not only the potential strengths, but also productivity risks within the context of the performance targets set by the company management. The developed and applied by the manufacturer LY-MIT (LifecYcle-Managerial Index Tool) allows the measurement and assess the productivity status of the process control systems on an ongoing basis. The three stage approach is shown in
Figure 7.
The resulting index profile provides a basis for planning short-, medium- and long-term packages of measures for maintaining or increasing the company productivity. The LifecYcle-Managerial Index Tool is designed to offer an integrated assessment approach that takes into account automation technology and primarily the quality of the system management with respect to the processes and strategies in place for the life-cycle-oriented future planning, failure prevention and emergency measures [
13,
14]. The managerial index also assesses the qualifications of the staff members within the company.
From a technical point of view, experts extend the assessment to the age and the network condition, to controllers and the entire number of I/O components, not just to the equipment in use at the control level. The sub-index “personnel” takes into account aspects such as individual staff qualifications, their further needs for training and the ongoing training activities for the new recruits. After all, the special knowledge of technical staff in a company frequently offers great potential for achieving further increases in productivity. Conversely, inadequate staffing levels may necessitate long-term training measures in order to combat risks in achieving the required productivity, as a direct result from the lack of well-trained personnel.
However, the researcher experience and the extended studies across companies, shows that efficient system management is the most important factor when it comes to maintain and increase plant productivity. For this purpose, the index examines the effectiveness of the processes defined by the plant operator and records, e.g., the quality and response time for: the plant operator needs to provide its know-how for fault location; and to identify the required spare parts and organize their delivery if problems arise in the plant.
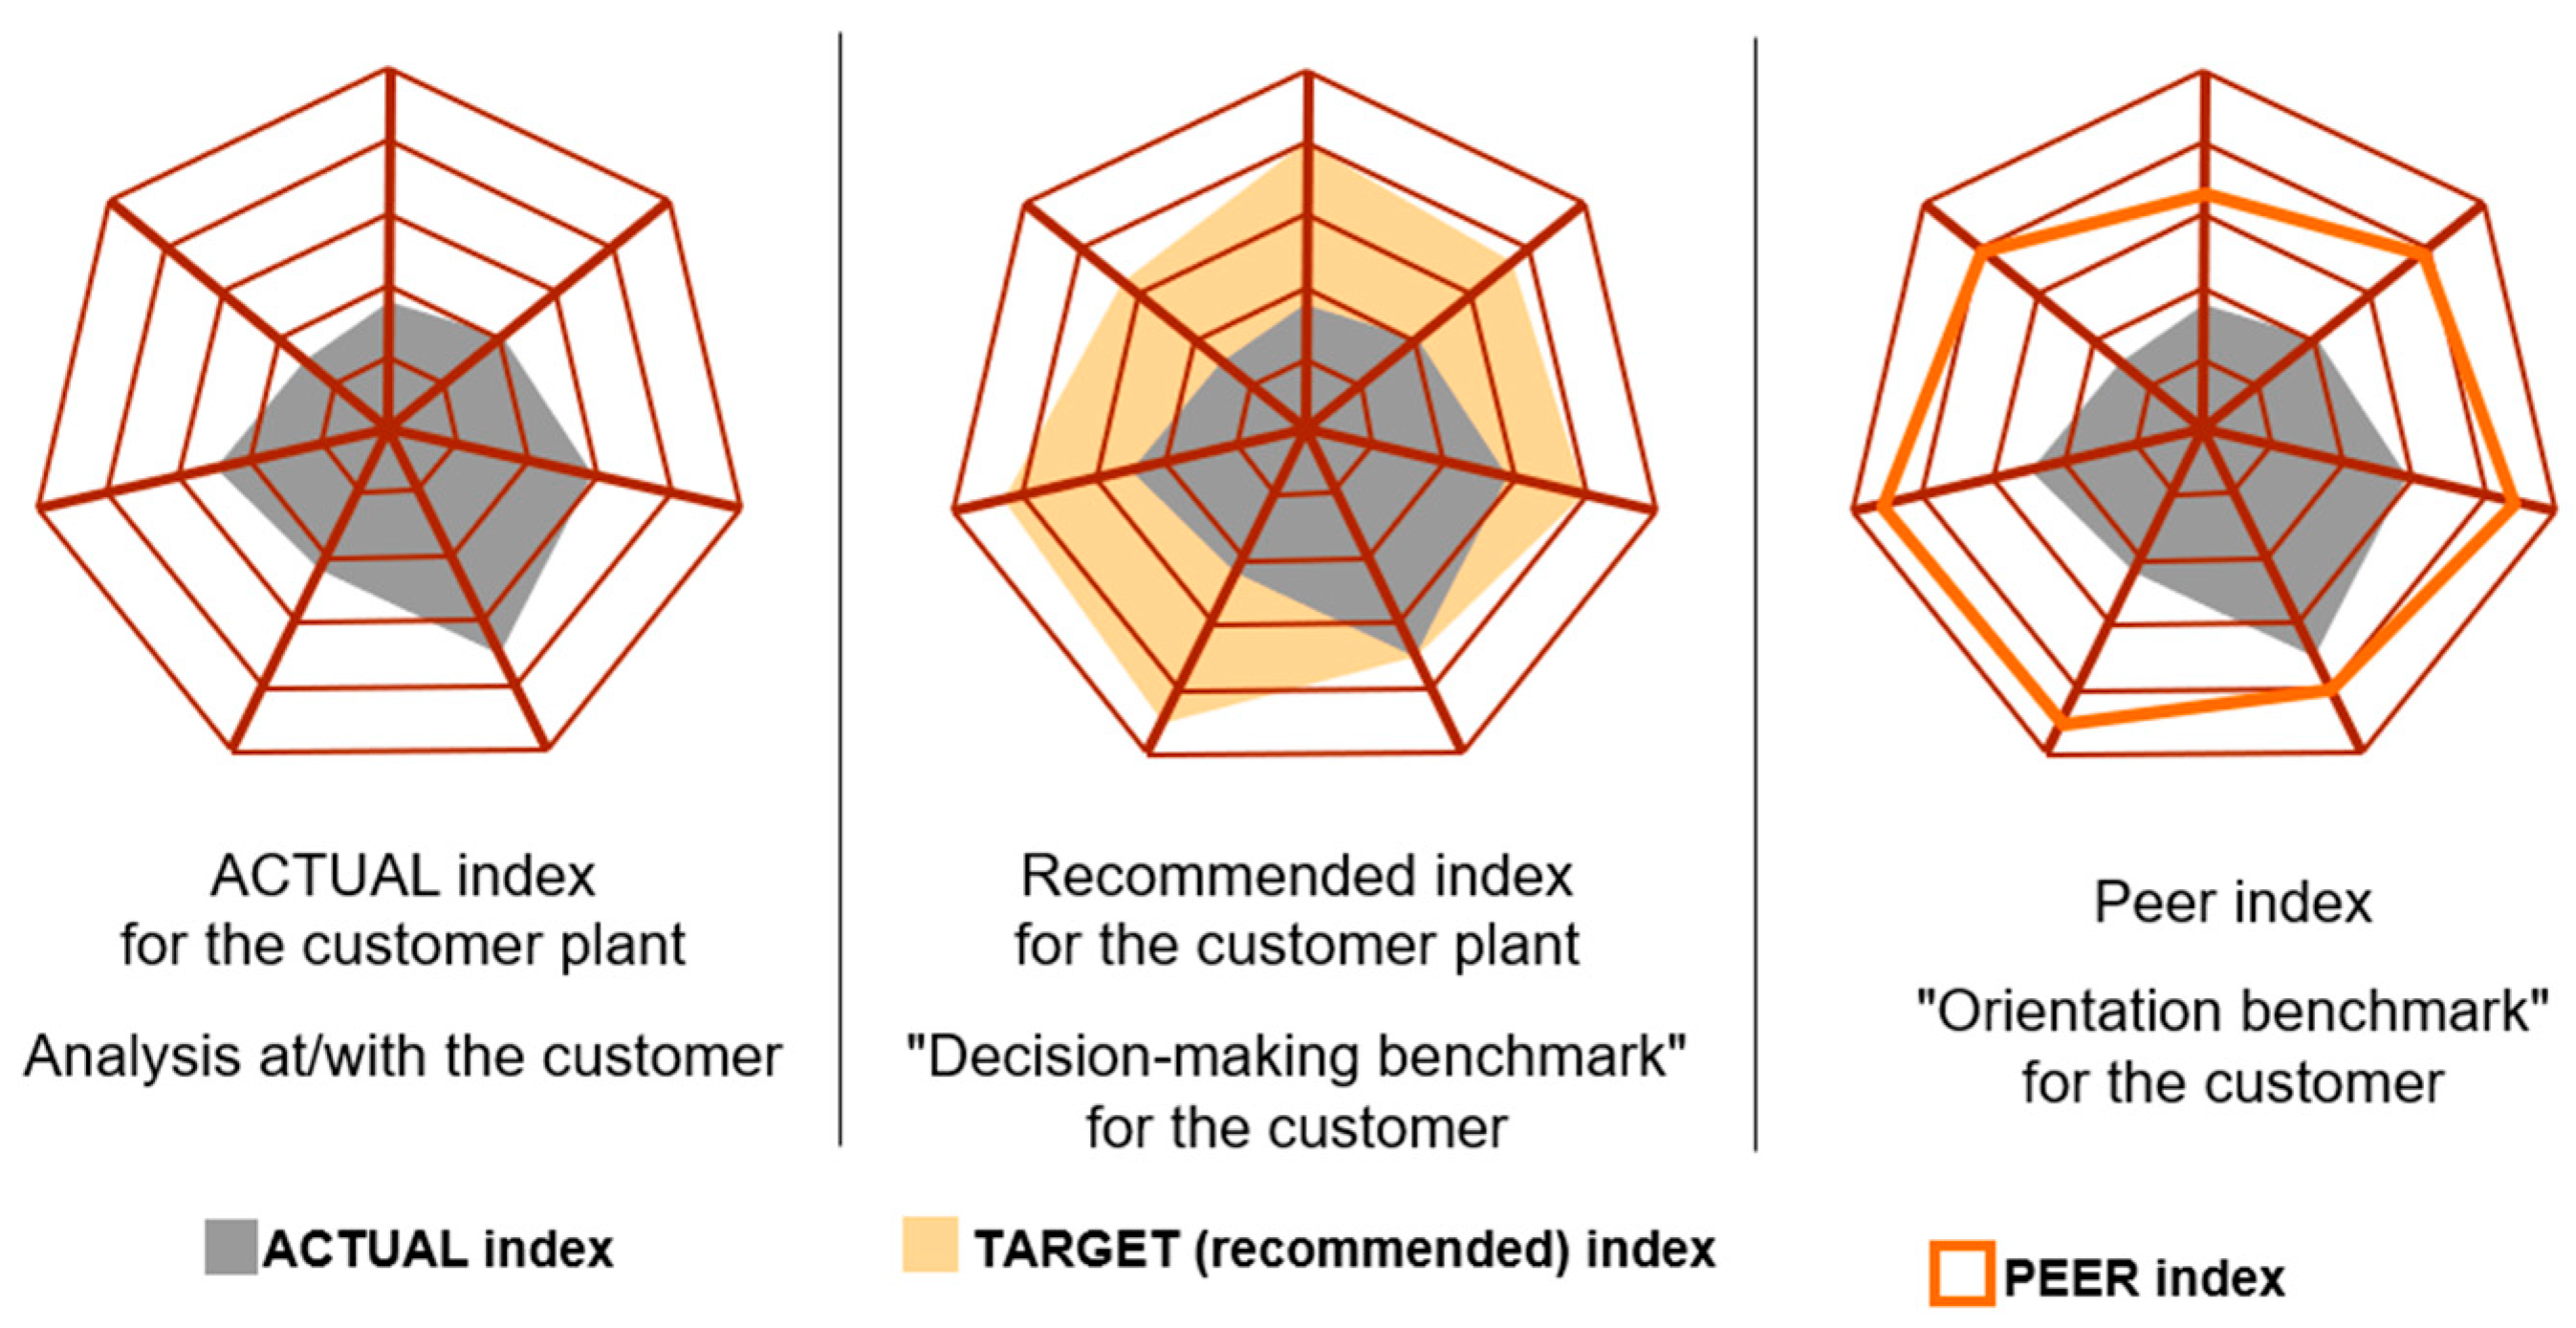
The index depicts not only these technical and logistical processes, but also the quality of the processes relevant to company management and strategy. The assessment includes aspects such as the company management’s planning and budgetary horizon or the effectiveness of the continuous improvement processes in place. There is often considerable hidden potential for increasing productivity in this area too. This can be directly exploited using coordinated measures such as consultancy services and software tools. Being part of the “company indexing process”, the LifecYcle-Managerial Index ensures that the company managers are provided with a detailed analysis of the strengths and weaknesses of their process control system, together with the current productivity status of their company. Thanks to the manufacturer´s many years of experience, now it is possible to provide anonymized index profiles to be use as a benchmark in determining the current position in relation to the sector average values or to relevant values in comparable companies.
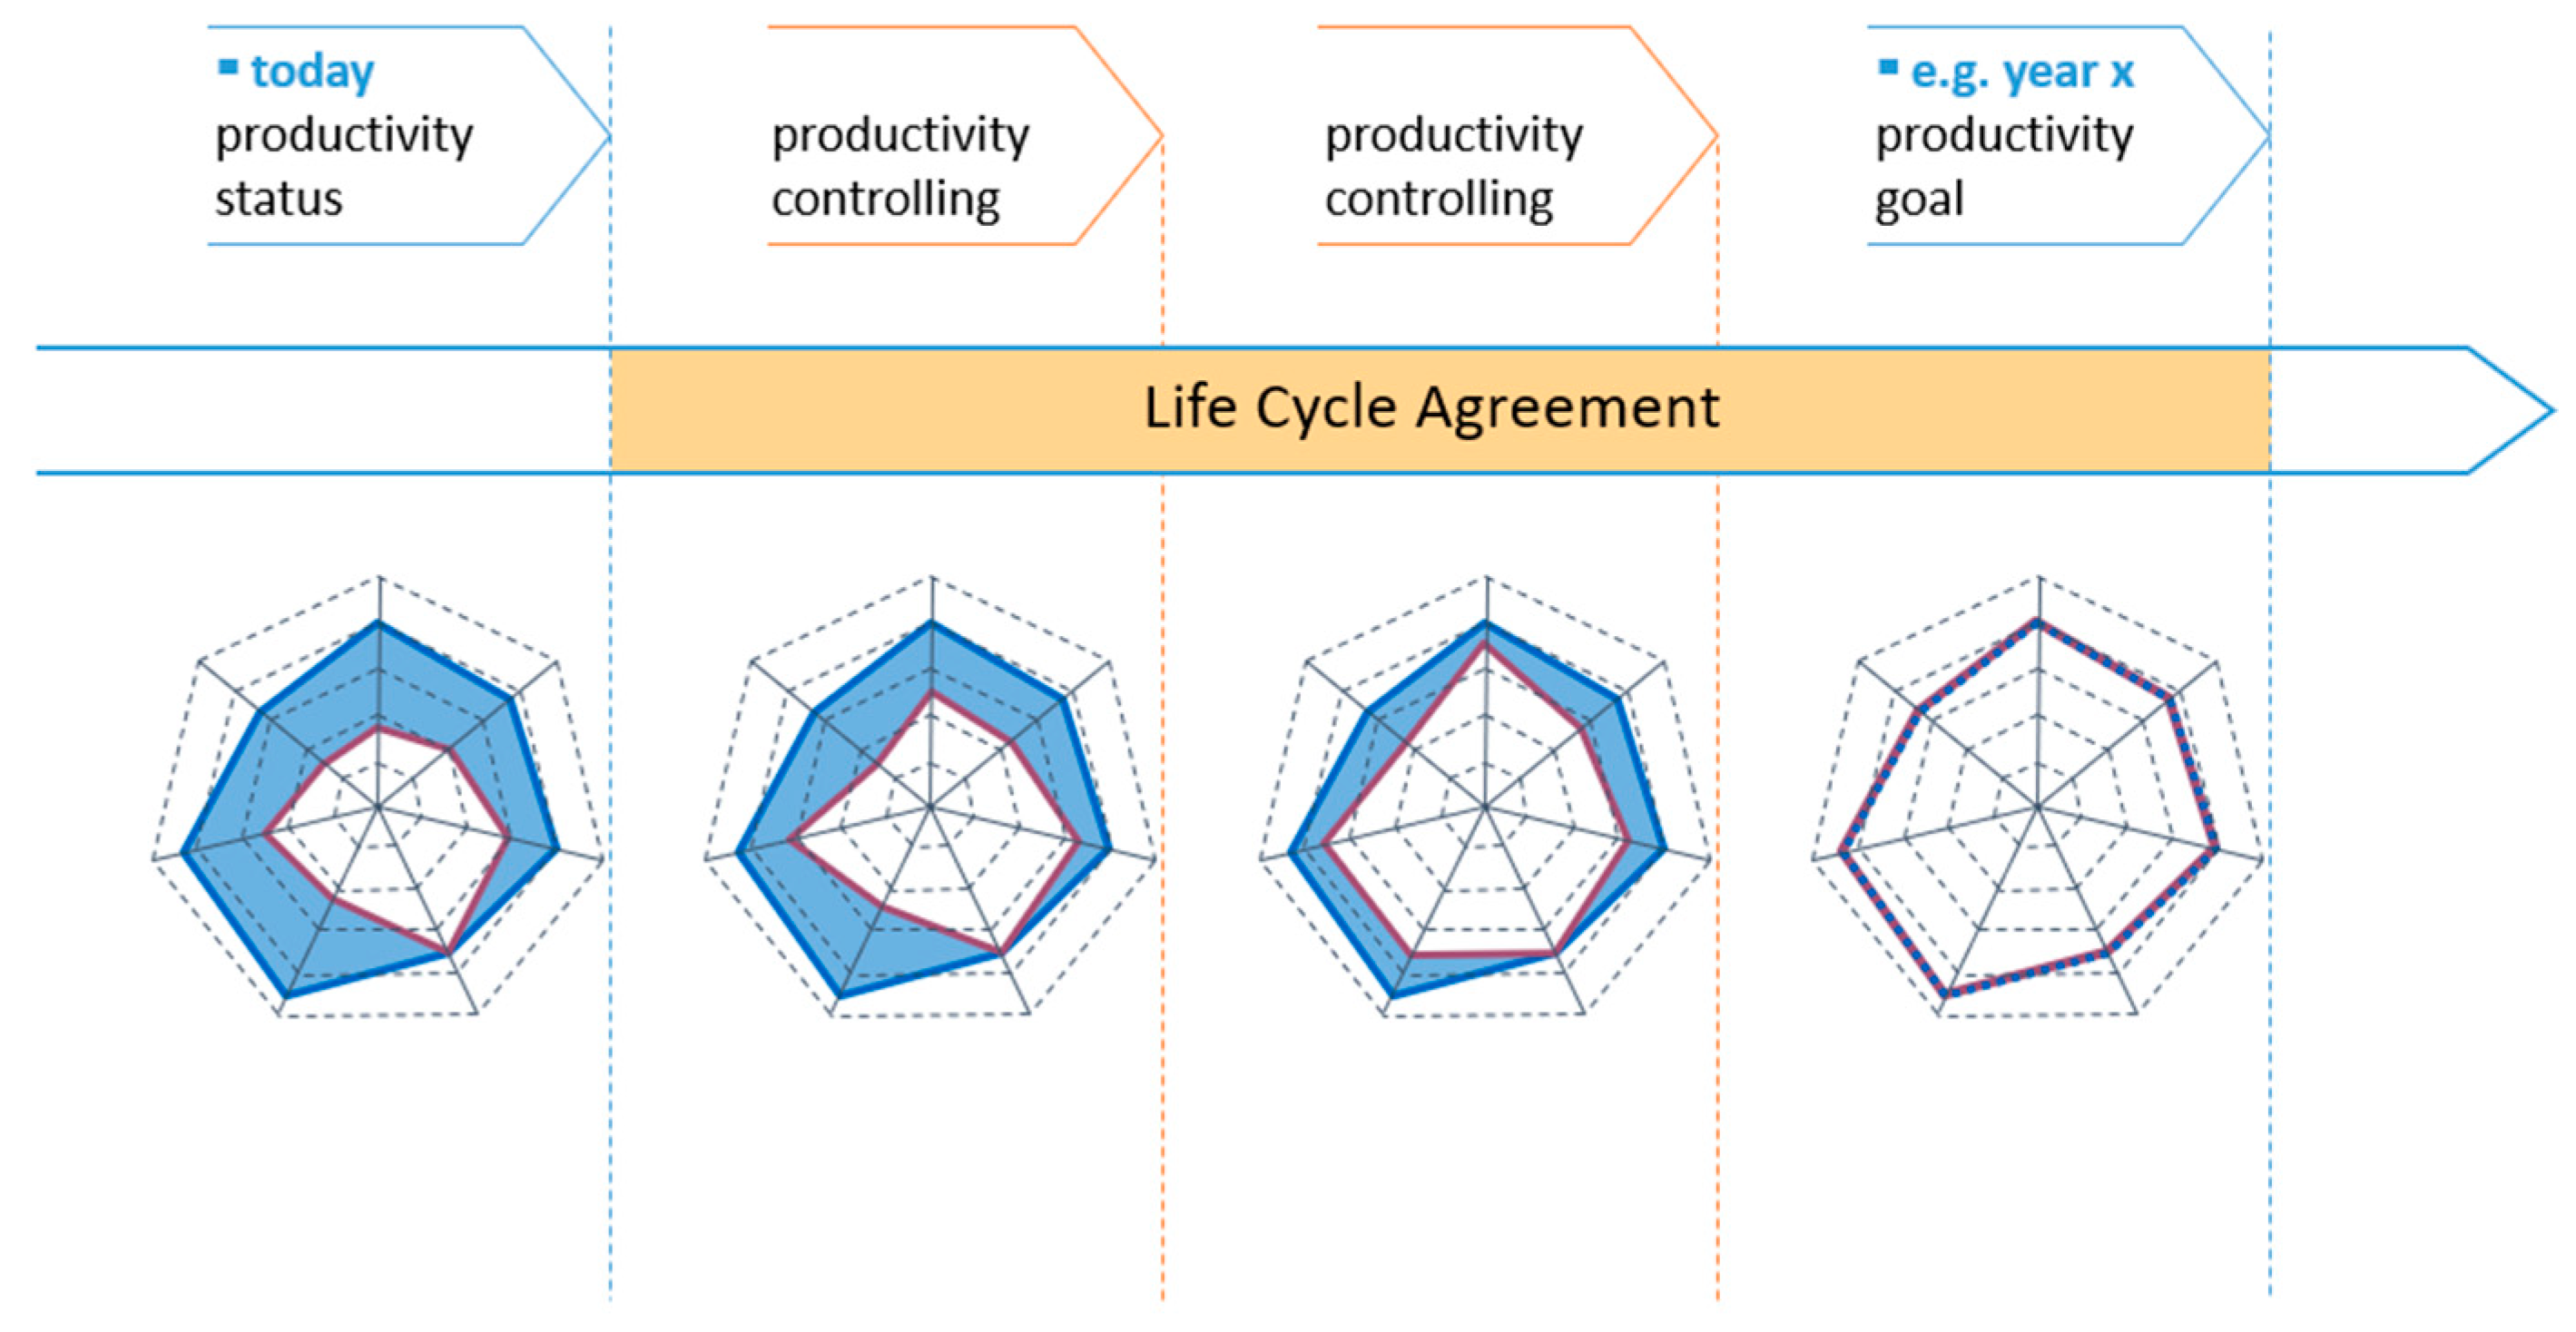
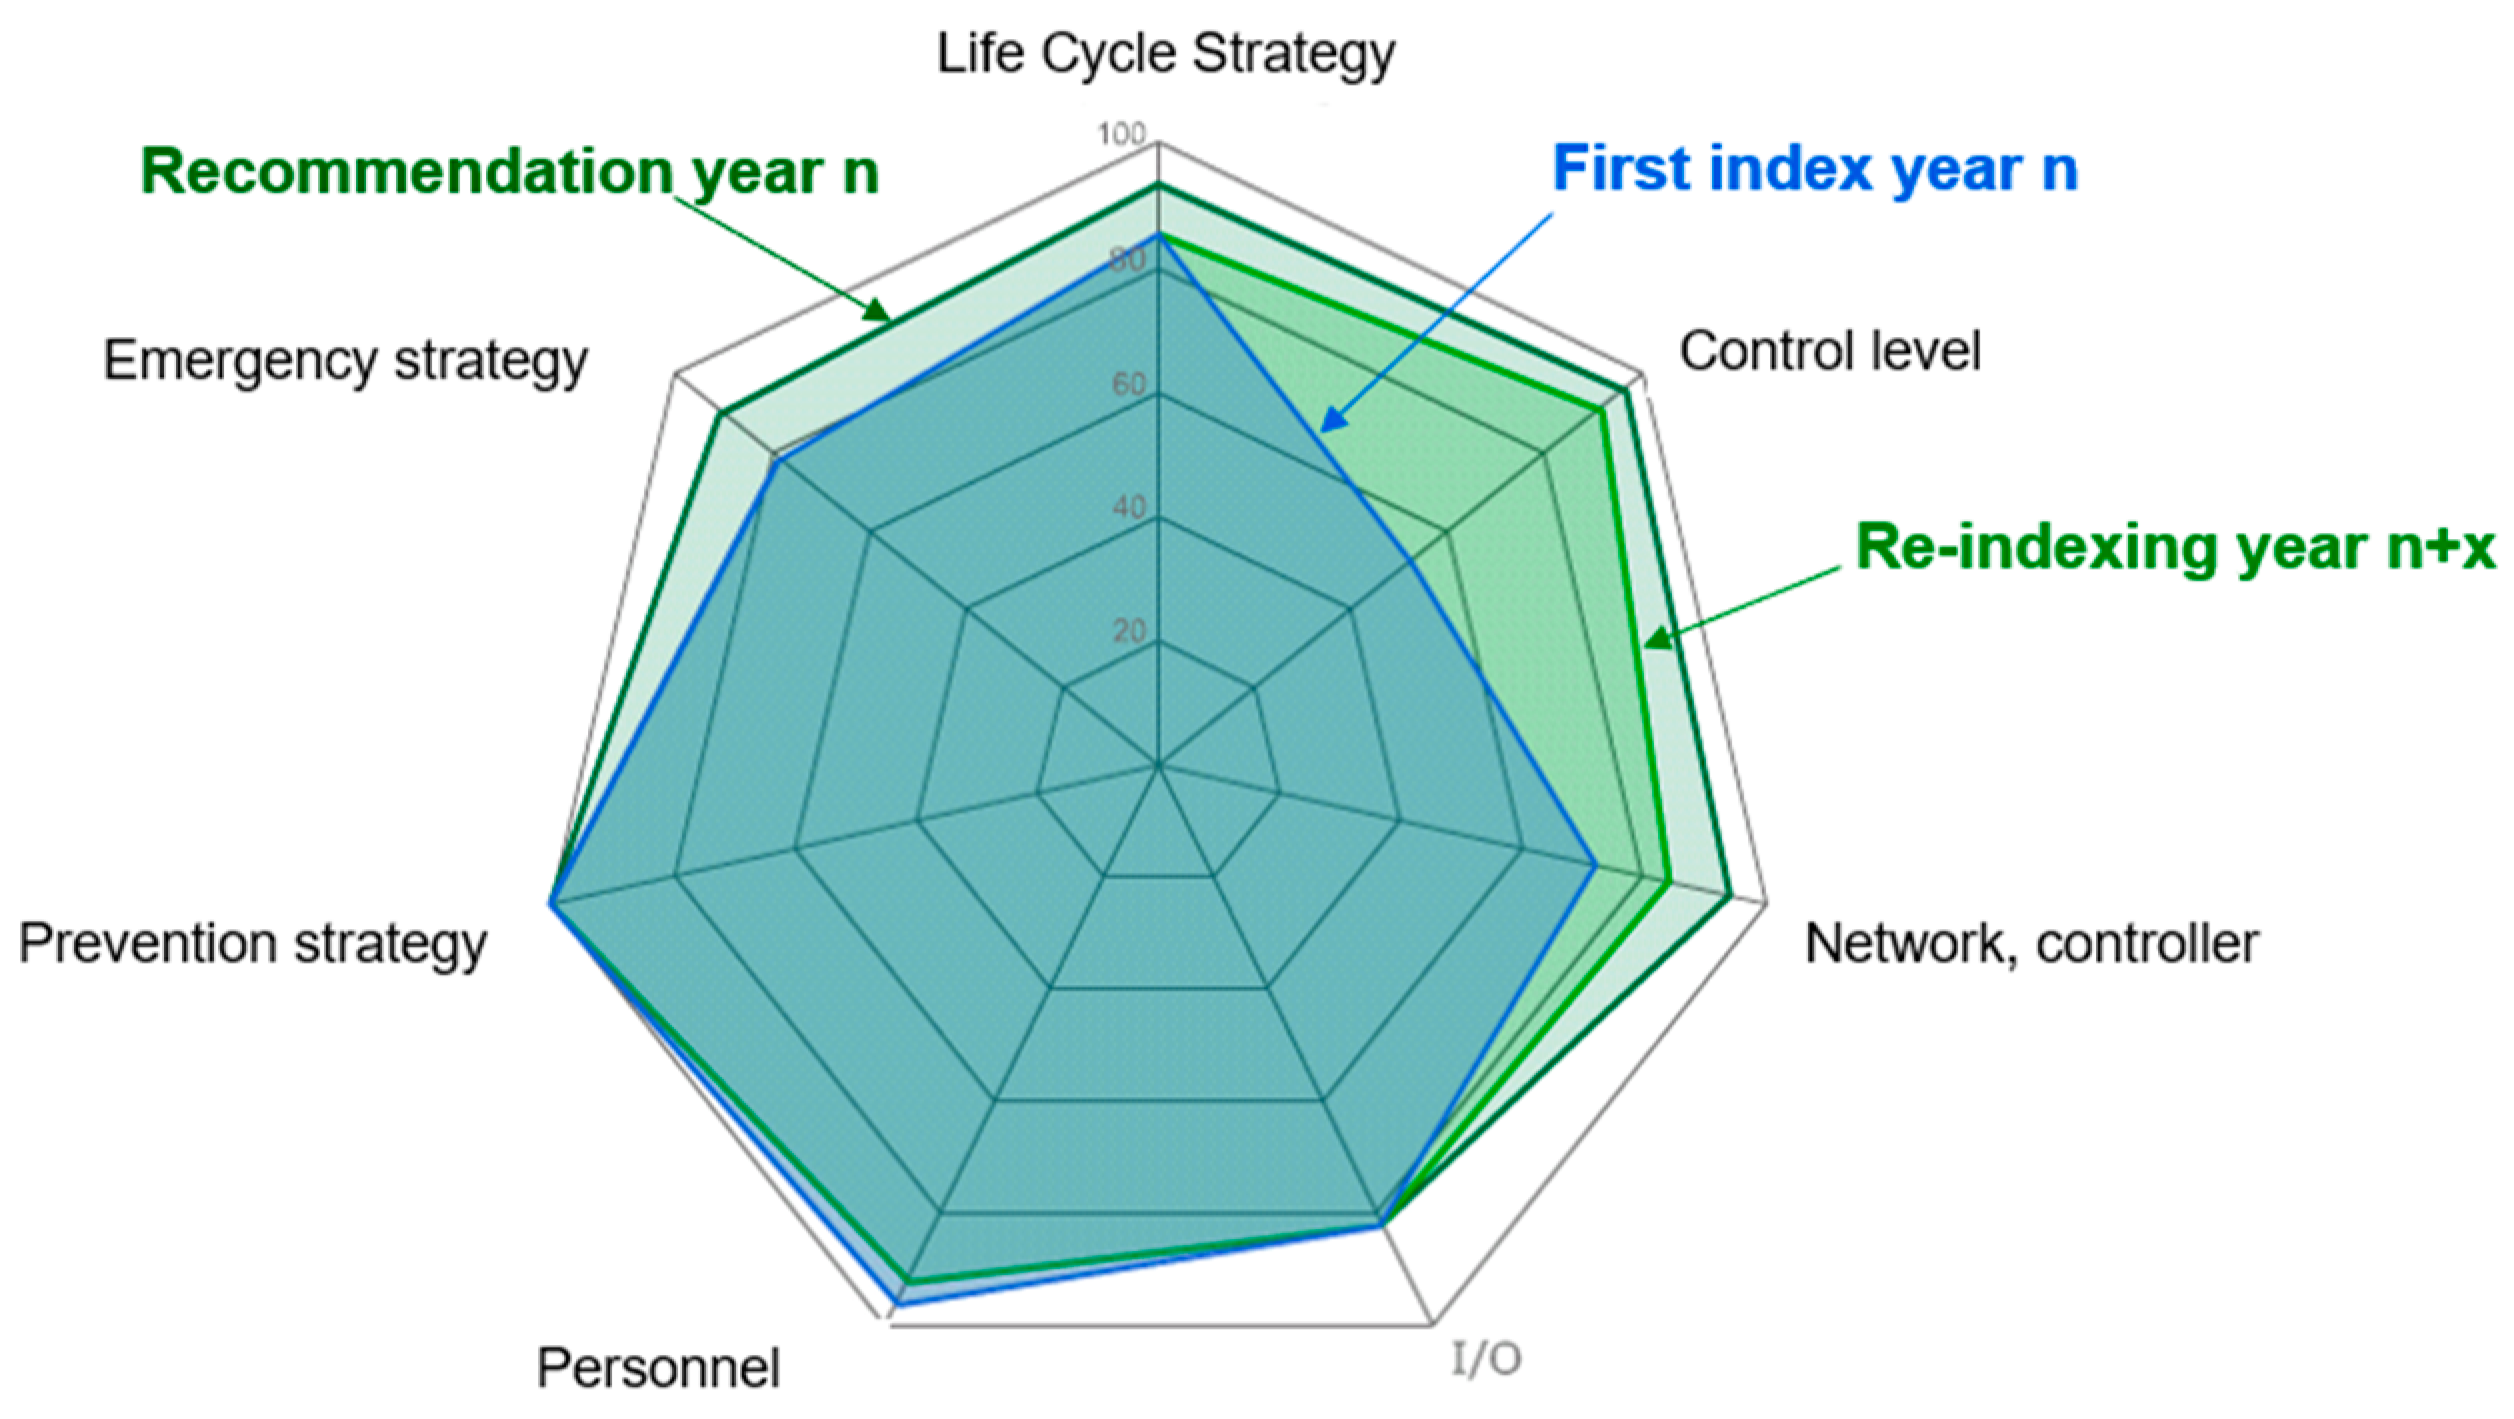
For a potential customer it is crucial to create his own “target index profile” which results from the company operation long-term objectives. Any differences between the target profile and the actual profile provide the starting points for the planning activity, implementation tasks and budgeting of the appropriate measures. In parallel that offers to managers the opportunity to visualize the effects of their coordinated measures or long-term life cycle agreements and to monitor continuously the reaching of their objectives, by means of future indexing.
To monitor the progress, a continuous re-indexing of customer companies can be established (“controlling”), shown in
Figure 8.
There is also the option of concluding life cycle agreements, which may have duration from three to ten years, depending on the customer’s requirements. The life cycle agreements contain predefined packages of measures, comprising software and the hardware upgrades together with other specific services with general fixed prices and implementation schedules.
The time, the activities and the cost plans ensure clarity as far as the follow-up costs of an investment are concerned. Planning the entire life cycle of all components is a difficult task but ensures that the considered sets of components remain future-proof, protecting the customer’s investment in his or her own control system (
Figure 8).
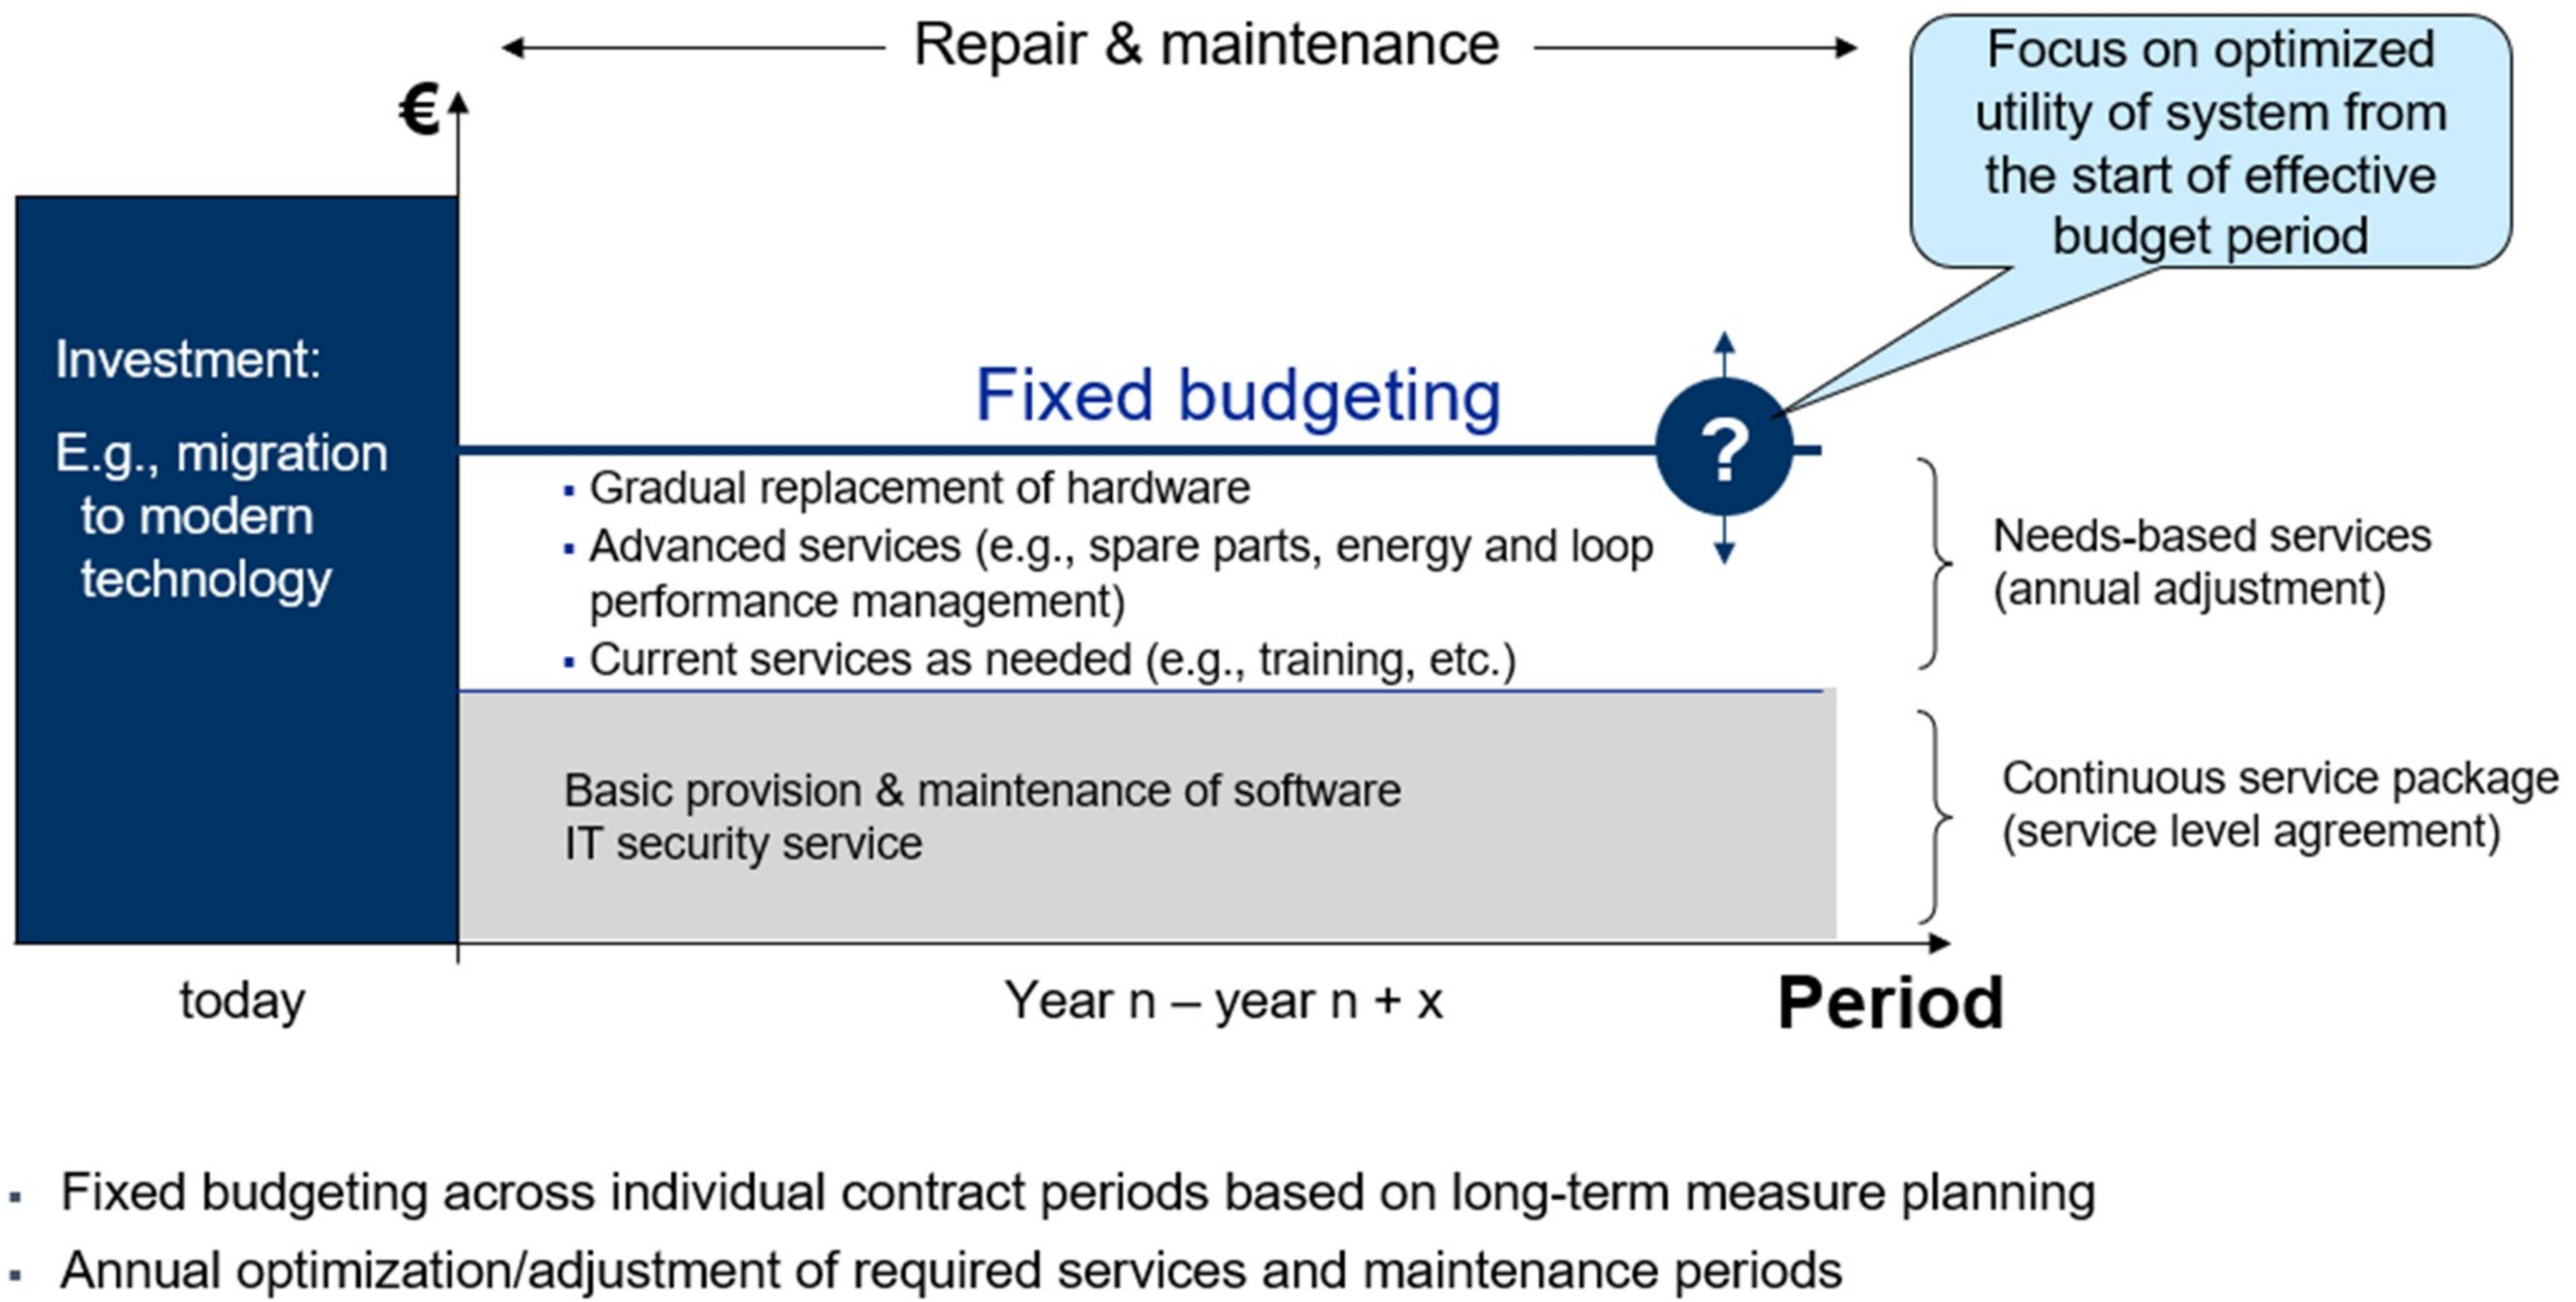
The capacity to provide some guaranteed costs, reduce risks and prevent any unpleasant surprises for the duration of the contract allowing the managers to draw up budgetary plans for a considered life cycle of their company, as shown in
Figure 9.
This foresighted planning approach allows the control systems to be kept up-to-date at all times and maximizes the benefit which the manager gains from the company by coordinating all necessary measures in the long term scenarios [
15,
16]. Planning with Life Cycle Budgets reduces costs by 10% to 30%, over the agreed contractual term compared to classic care schemes as is justified within the Siemens PLM platform, but requires a special trained life cycle manager, responsible for indexing customers’ companies, firstly by recording the actual plant status on the customer’s premises.
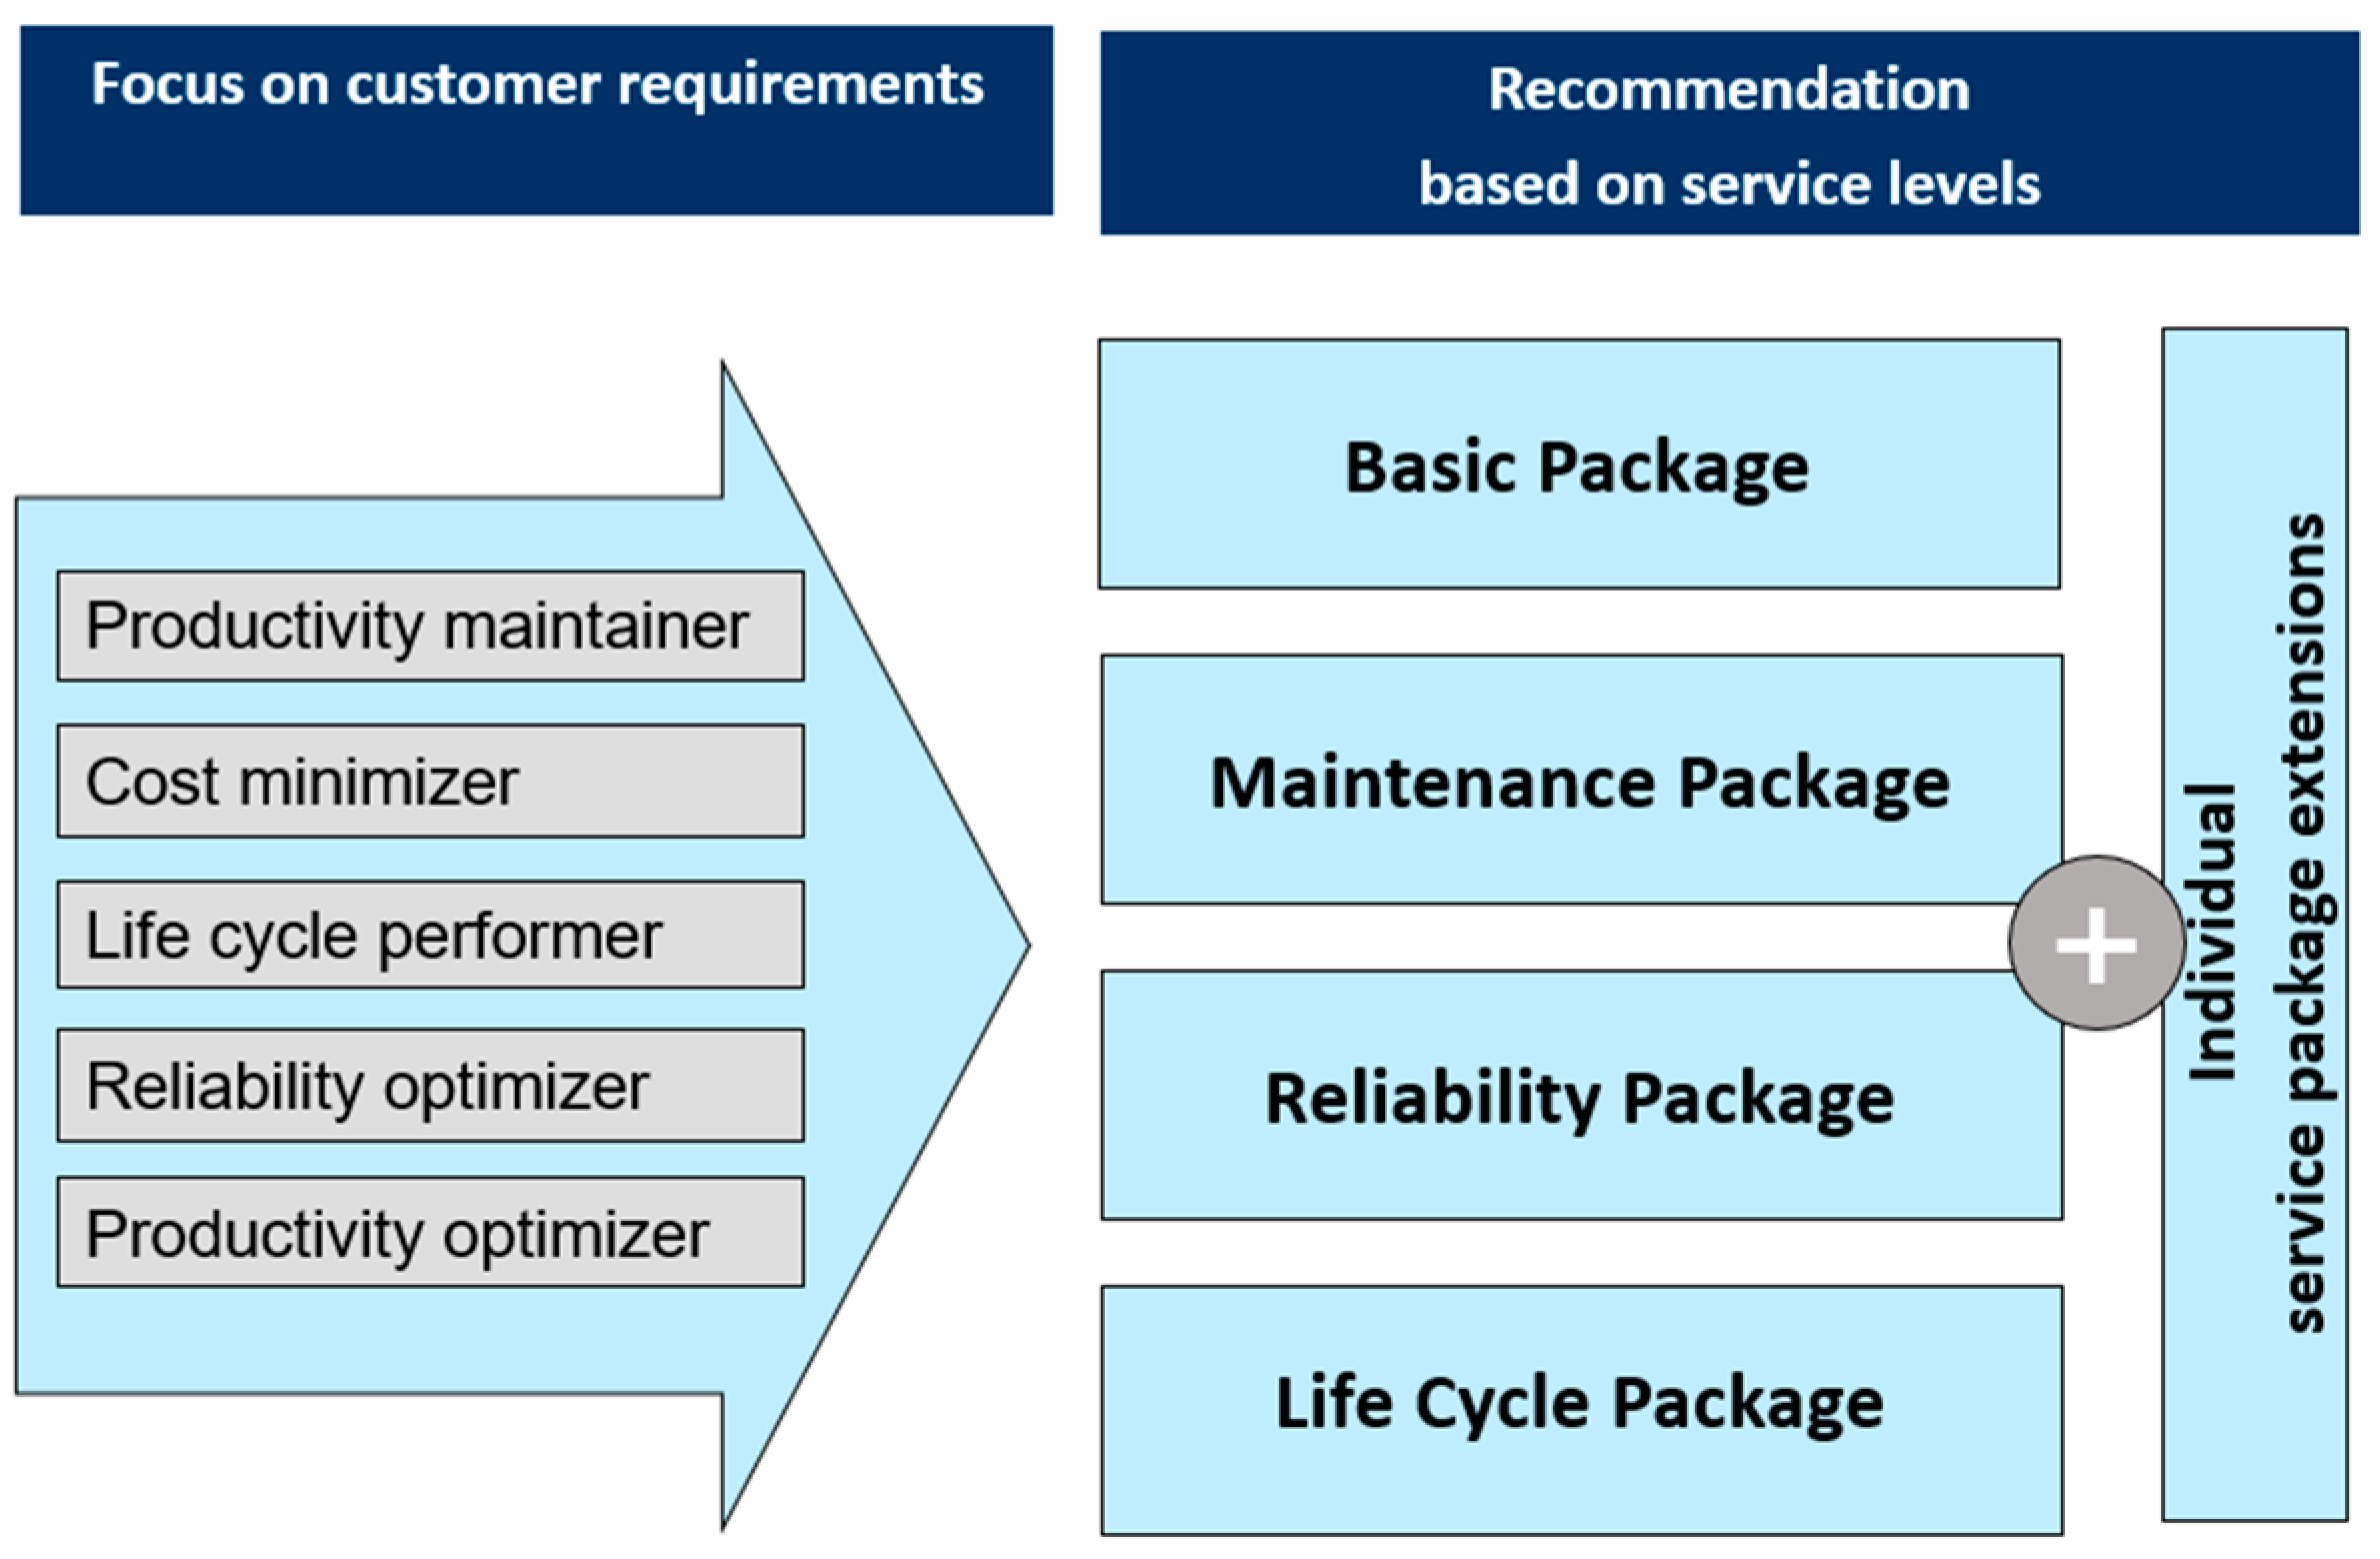
In order to allow detailed visualization of the company, the analysis of the strengths, weaknesses or productivity risks is subdivided into a total of seven axes. This form of recording the actual status and provides the basis for a list of recommendations, specific each company, adjusted to the company—specific target profile and taking into account the company’s individual objectives. The “actual profile” is prepared by collecting status and process data, consulting manufacturing specialists and structuring the information they received and processed in many years’ experience. The data and information evaluation is based on the customer’s long-term objectives, defined for the company operation. The necessary measures are prioritized and arranged on a time axis.
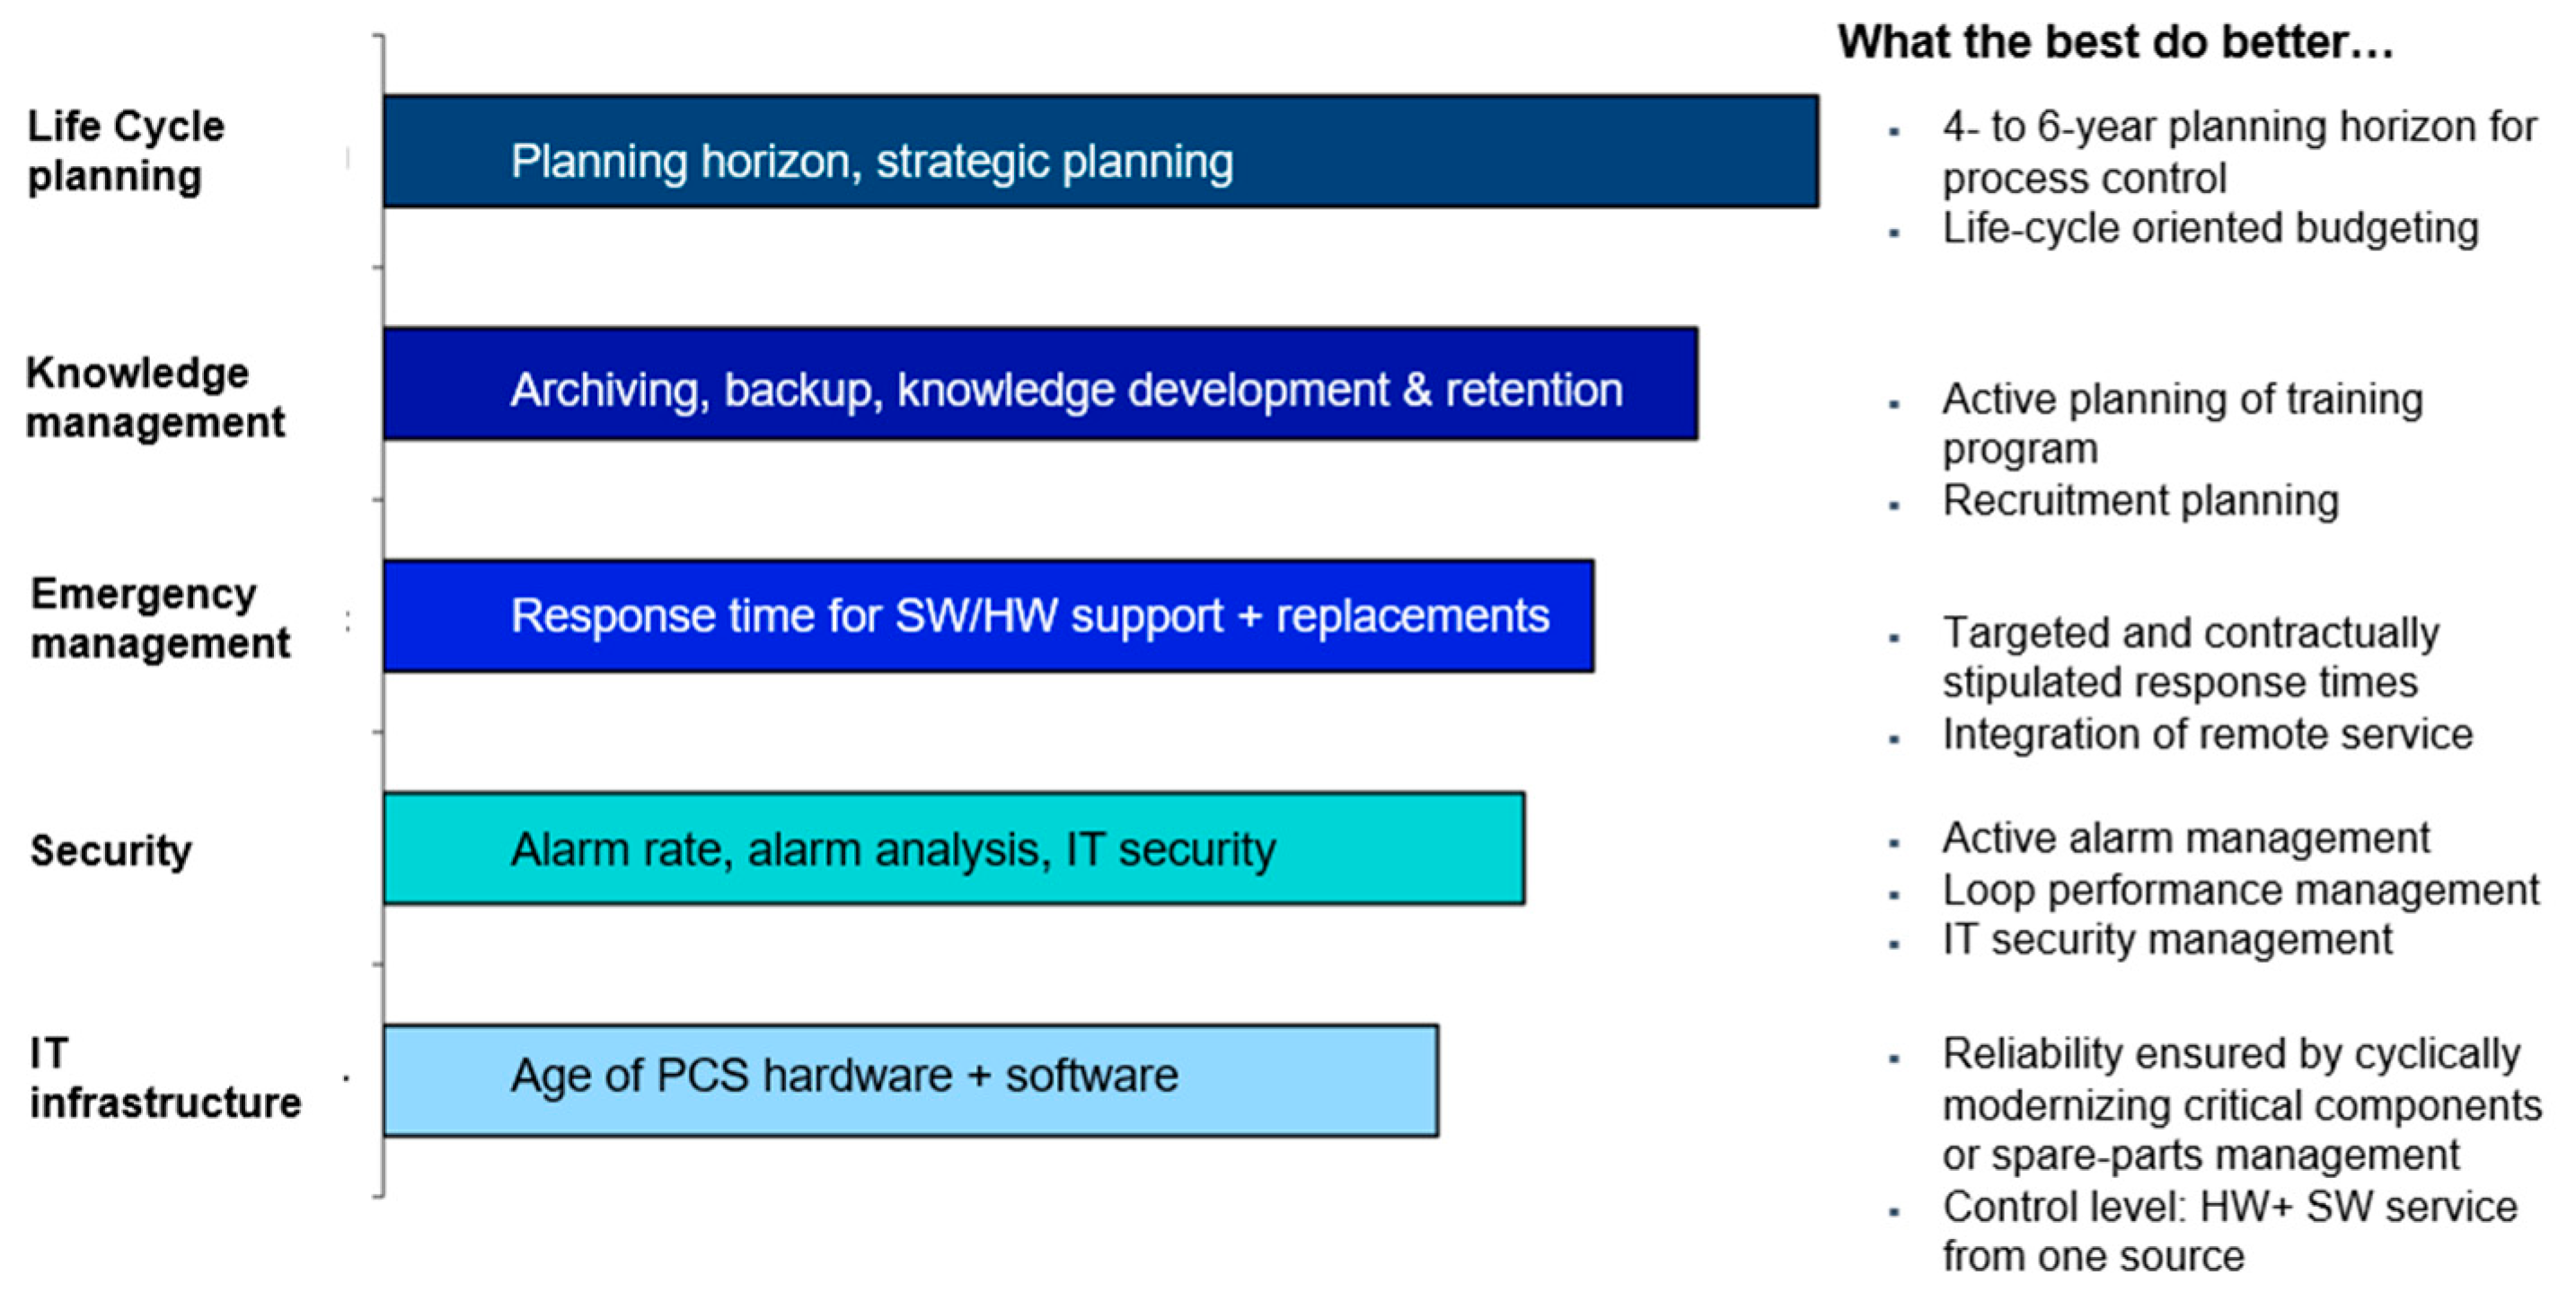
As a result of the “company indexing process”, customers are provided with a detailed analysis regarding the strengths and weaknesses of their process control system and therefore the productivity status of their company. During a second consultation, which usually takes place on customer’s premises, the results of the analysis as well as any recommendations are presented. Specific packages of measures are agreed with the customer that are developed during further subsequent discussions and used as a basis in offering specific services, as seen in
Figure 10.
The accumulated experience shows that life cycle planning is essential where users have ambitious plans in achieve constant increases in productivity. Previous indexing activity revealed that such dynamic companies invariably use life cycle management in order to realize their full productivity potential. The company managers have long-term approaches when it comes to automation and robotization planning and make particular use of modern IT systems and tools in order to develop further improvements based on the collected production data. In most cases, this is done by setting up effective control loops within the company organization. Faults and potential for improvement are analyzed and implemented thoroughly in ongoing improvement measures.
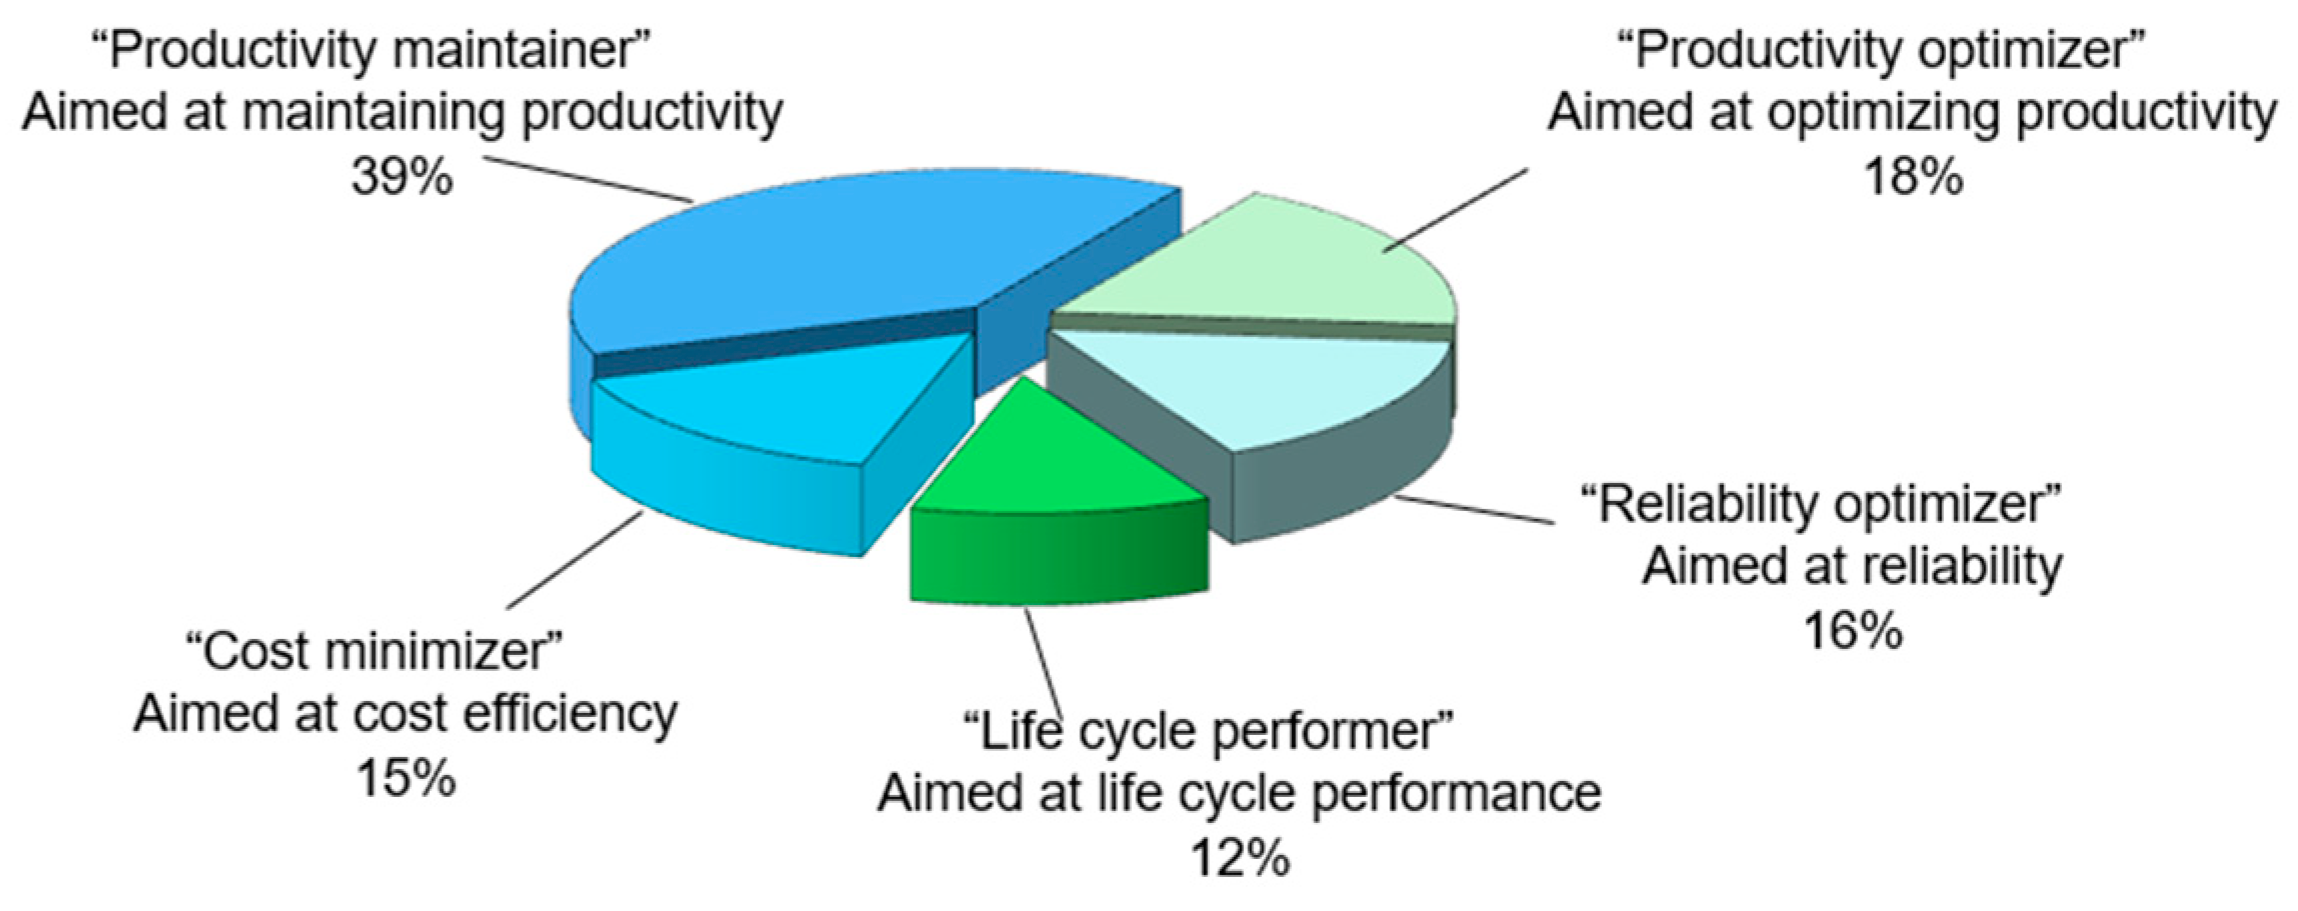
Based on specific business targets,
Figure 11 shows from an overall evaluation of almost 300 performed indexes, the typology for the companies’ managers in chemical, metal, pulp and paper, minerals oil and gas, automotive, medical devices, aerospace or glass industries. It was noticed that especially in chemical companies, managers tend towards productivity increases and life cycle performance.
Nevertheless, life cycle management is becoming increasingly important for those companies which are focused on maintaining productivity. Unlike ambitious companies that pursuit to increase the productivity, this group of users is primarily concerned with maintaining the status quo of their system components on long term. The life cycle extension agreements ensure long-term support (spare parts, software maintenance and service level) for the products already used including any preventive and emergency strategies which may be necessary,
Figure 12.
The Strategic Horizon Planning, which is an internal developed concept starting from the 2008 Three Horizons Theory (THT), is considered as the framework for debates regarding future innovation directions and long terms capabilities, beyond the focus considering the actual innovation activity. In the 1st Horizon are active the operators that increase the actual capabilities and extend the operational facilities; in the 2nd Horizon are active the Business developers that creates or discover new opportunities for development; 3rd Horizon is where the visionaries activate, being one step before everybody with completely new viable solutions or new options.
The drawback of the THT is that each Horizon needs a different approach and a different thinking frame. The people in the 1st Horizon tend to ignore future technological progress being focused on the actual on; people in the 2nd Horizon tend to ignore social aspects tending to adopt the market opportunities; and the people in the 3rd Horizon tend to ignore the actual potential in the favor of emerging technologies.
The authors’ research starts from the product or process lifecycle, and therefore not three but any number of horizons can be considered having the benefit of a “floating point horizon” meaning that based on defined tasks and referred resources result the Strategic Horizon Planning that forms the frame of the targeted evaluation indexes, including the most of the potential and enabling the possibility to apply Life cycle strategies.
Top devices and systems have a strong capacity of life cycle oriented planning, especially when driven by their competitors. Statistics demonstrates that in praxis a 4 to 6 years planning is an optimal planning time and therefore a 5 year (average time) planning design is considered to be convenient. A multiyear planning offers a good horizon for imagine results by offering at one hand sufficient optimization resources and possibilities to synchronize the tasks for taking measures to change, and on other hand a sufficient planning security for the future developments and technological improvements. The so-called “ideal solution” is to couple the Strategic Plan with the Budget Plan engaged for the same period of time, connecting the desired (planned or foreseen) measures with expected costs correlated as Life-Cycle Agreements.
In the best situation, there are Life Cycle Contractual Costs that easy the tasks of the Company Manager to establish the long and medium time planning for the company development. An extended Planning horizon enables the possibility of different strategic alternatives and in this case the LifecYcle-Managerial Index Tool, will provide its importance and utility to simulate different implementation, possibilities and foreseen results.
From the Company Targets Orientation point of view, this proactive approach ensure the results maximization of the selected Life Cycle Strategy but also a better risk management due to a larger flexibility in covering emergency situations and offering a better reactive ad-hoc, the “Firefighter strategy”. It is not a Miracle strategy, is a strategy that everybody likes to avoid by using a well-done planning process and an efficient resources allocation. But this strategy offers the advantage of using the Life Cycle Management in accordance with the facilities largely offered by the Industry 4.0 technologies (including robotization), applicable even in the so called Conservative Planning Approach Strategies (CPAS) where any potential change risk is covered with overcharge employees diagram, a large amount of spare parts, aggressive short manufacturing cycles, unchanged long lasting contracts with clients and suppliers, and a strict human resources migration control. From the usual 25% to 30% costs savings, in the CPAS, it is still possible to have a 5% to 10% costs savings by using the Technological Life Cycles, savings that are clearly foreseen and considered as planning targets in the process control.
The interesting side of using LifecYcle-Managerial Index Tool is the high rate of performance exactly in companies where the CPAS cost savings potential is greater that in the alternate situations. In most of the cases (almost 80%) the intensive use of the manufacturing system made the company managers to consider a limited planning horizon of 1–2 years and only some local resources availability. Together with maintenance and tooling cost this conditions are practically dictating the productivity parameters, totally eliminating the developing capacity aspects like new technologies and human resources within the process planning and control.
The “productivity” topic, as main consideration, is actually a trap for companies that are consider as Life Cycle periods less then 4 years. Once with large externalization of services and competences, managers start to ignore the physical and moral obsolete of the manufacturing systems, the needs of spare parts and the training of the service personnel. All together are leading, after a short “happy period” when things seems to be under control with an adequate profit (the planned horizon), to a catastrophic increase of cost that spread quickly all the accumulated capital. When people are in the equation, a stable situation, functional manufacturing systems and ensured quality, more than 10 years planning are required for the “specialist supply” considering over 90% of the existing manufacturing system. Engaging in new processes must be coupled with the personnel release in pension, maternity, availability through medical condition history, holidays and training in changed technologies. From year to year, the personnel training and continuity is an increasing problem. In some limits the LY-MIT is helping to deal with the problem, by offering in advance some windows of time, or the possibility to delay some required actions.
Efficient cooperation or personal replacement is offered by the automation and robotization process in more than 50% of the companies where the competences and experience are not appreciated, persons being kept busy with repetitive and dull tasks. This is a situation that offers the chance to gather no new or brighter experience, to repeat the same mistakes, or the unjustified increase the operation time. In this case, the trouble-shooting activities must be expended in spite of the fact that problem-solutions exists but are at a different level of expertise and competences and will remain unused. Regular data transfer and experience exchange over solutions documentations could be very helpful.
An observed (or alarm signaling element) in the LY-MIT, is continuous education, where the manager may invest a minimum of 5 days/year for gathering new and adequate knowledge in the process system control. At this moment only under 30% of the managers are aware about the training offered opportunities, about 40% made the last training process more than 3 years ago, and the rest (over 30%) are totally ignoring this possibility. All together, this situation leads not toward Industry 4.0 but to a critical situation. Training is imperatively required in topics like: process management, IT development, risks and safety systems management, ergonomics, error management in preventing emergency situations, etc. are important to organize with swift and positive effects. Depending on the company dimension and the company demands, the training could be organized by an external training consultants specialists or organizations, or can be made internal if exist a department specialized in training. Depending on the company profile, the training can be oriented to client needs, or client-problems solving, or more generally on knowledge enlargement. In extreme cases, there can even be company client training sessions.
As a first conclusion, the starting point for the overall success is the improvement of the data and knowledge management building, appropriate data storing and data backup, as the second hidden potential. The research shows that successful companies give a high attention and invest in quality data storing devices and supports, archiving and smart recovery strategies. In the digital company, if the informatics system fails, it is not just a matter of restarting the system, but the manufacturing systems stops, thereby adding not only production stop and downtime, but also financial losses and possible accidents. The personnel and financial safety measures are very important, as any prevention measure and recovery strategy is not obsolete in affecting the bottom line. In this context, the monitoring and documentation is a must, and specialists like to have fresh and updated data in an error free transferring procedure, and also integrated within the functions plan.
The reality looks different in case of faults or errors that are faced by the Maintenance and Service Team of a manufacturing system with thousands of I/O on tens of controllers with different specifications. In many cases periodical tests on data storage and data processing (CPU) including the status of the entire visible network are made. But “many cases” within the industrial environment means about 25% of the applications due to time requirements, complexity and the available technical personnel. This is offering also a view over the data protection problem and why the security systems could not be as secured as it seems.
With this image in mind, it is easier to understand the manager’s resistance to change, in spite of the awareness that without change on long term the company will have to lose. The backups and preventions upgrades are essential, an optimal correlation with the rest of the company tasks and resources allocation can be better correlated using the LifecYcle-Managerial Index Tool. The use of LY-MIT is defined by a detailed documentation as a key feature of a digital company or process. The detailed documentation is offering a swift view over the: status of the manufacturing process, machine-tools, robots and devices, software packages licensing and availability, network configuration, IT devices placement, role and functionality of transfer components, etc.
Personnel education in correlation with the process and documentation status represents the third hidden potential. Learning from errors is a god starting point in the staff training process, as the third hidden potential to increase the productivity. Education, formation, regular training of the employees is the area where the knowledge in how to control the process and the software packages that runs the process can be found. Intensive results are coming from splitting the knowledge management and dissemination for each group according to the specific activity, responsibilities and capacities. This approach leads to a better use of the operating system, safety components and network characteristics and settings.
In the case of technological change, the personnel training sessions are followed by a testing or examination process that simulate different operation condition to proof the depth of knowledge, the behavior and the reactions mode, before the real system are implemented. These procedures increase the system safeties, improve the detailed technology assimilation and open the capacity to extend the adopted technology or to accede other new technologies. The requirements of the Industry 4.0 technologies will improve the training planning capacity, as long as at least 50% of the actual managers have no imposed standards for trainings in their process system management. Regardless of whether there is an existing or new implemented training process and training planning, this must be connected with the Lifecycle Planning of the system process management within the manufacturing company, as a single success possibility to optimal influence the companies’ process data and process knowledge within the management process.
In a phrase: the management team may not use, in an optimal way, the process knowledge if they are not controlling the knowledge of the process system management. The LifecYcle-Managerial Index Tool advocates that only by correlating the knowledges, can an optimal productivity be obtained and minimize the downtime. That way success companies have all the data and knowledges recognized as production resources, integrated in the Strategic Planning, where education and training planning, personnel resources management and are sharing the data in the technology synchronous way.
The fourth hidden potential is represented by the capacity to manage the accidents and disturbances represented major factors in reducing the productivity. The efficiency quality in number and competences of the service team can be diminished or improved by the reaction time, availability of the spare parts and the capacity on resource allocation. The risk of increasing “by all means” the productivity is under control for the “best-in-class companies” because the advantage of the clearly define the plans, the people and the reaction time for different foreseen or accidental emergency cases. Actually, in these cases, the necessity of resource allocation will be smaller (more efficient managed). In most of these “emergency cases” the system devices, machines and robots are not optimal placed and operate. On other hand the intensive trend of externalization made that in some cases is required that 40–50% of the manufacturing system to be remotely controlled (i.e., cloud computing services) or connected directly to the manufacturer support (24/7 if possible) with professional service indication and guaranteed intervention reaction time. Unfortunately, that is important within digitalization industry but is far from overall achievements [
17].
The difference between very and less important devices, continuous or discontinuous functionality leads the managers to a different integration of the process components within the intervention plan and resources allocation. One of the risk management factors is the tolerance of the “no work” situation of a component, reflected in the chain reaction over the manufacturing system functionality and the costs curve. In this case, the LifecYcle-Managerial Index Tool can be of real help in defining the optimized operation goas and the contractual form for the optimized reaction time service that must be included in the budget as an important definition of cost in case of emergencies, process disturbances, maintenance, spare parts and damage costs, so in the worst case scenario a known maximal accepted service reaction time to be considered. The accepted service reaction time depends on the domain of application and on each company manufacturing system.
For larger companies, or critical production systems, it is advisable that the de facilities provider or a third part specialized company to be considered as a strategic partner that may offer all time support (a nonstop call center), a company service support that may also handle the spare parts management on fixed determined reaction times. The optimal maintenance or/and service activity is made with the support of alarm management, a relevant activity within IT applications, for risk management and prevention ensuring the sustainability of the entire system. In this sense the NAMUR the international user association of automation technology in process industries, gives a procedure for designing alarm management within a process control system starting from a global view of the process as a whole, the NAMUR 102:2008 [
18,
19].
In parallel with NAMUR is the EEMUA191 [
20], a guide to design management and procurement that since was first published in 1999 has become the globally accepted and leading guide to good practice for all aspects of alarm systems. With input from the Health and Safety, provide vital support in preventing, controlling and mitigating the effects of abnormal situations, as an essential part of the operator interfaces to large modern industrial facilities, includes guidance on implementing the alarm management philosophy in geographically distributed processes; and performance metrics and KPI (Key Performance Indicator), philosophy used also by LY-MIT. The international standards for the management of alarm systems dedicated to the process industries, the IEC 62682: 2015 and the ISA 18.2 (International Society of Automation), are aligned with EEMUA191. However, much of the guidance with appropriate interpretation can be applied in other sectors. For example, the guide has been used successfully as a basis for training in the rail and transport sectors, in the nuclear industry, and elsewhere, as the publisher mentioned.
The research showed that, for alarm management, about half of the searched companies do not have any type of conformity with EEMUA 191 or NAMUR 102 procedures, placing the company operators in a real steady state, but not in the desired one. This reveals an extraordinary safety niche due to the impending overload in the emergency cases and on other hand the optimization potential for the automation process alarms and errors management. The positive example is given by the “best in class” companies where continuous monitoring, the installed and functional systemic alarm management, evaluations and downstream process optimization offers the increase of the company safety and risk avoided position, rising the process potential and productivity as the result of aiming an optimized, digitalized, automation process.
Lately, the entire efficiency of these procedures is slightly diminished due to the IT security risks, but the companies’ managers have taken many actions for the data protection and against virus attacks. In all indexed components of the system, turned out to be critical the data evaluation in over 30%. After EEMUA consideration only six alarms/operator/hour are manageable in order to be properly understood and possibly fixed. An example to security IT risk exposure is the StuxNe, a computer malware first discovered in July 2010, believed that spread through infected USB flash drives and mainly targeting industrial software and equipment (also Windows PCs), including those involved in the manufacturing of industrial control systems, exploiting a zero-day vulnerability in Windows. The possible damage is related to the loss of confidential data, loss of production, or damaging the company image. The successor, Duqu, is a collection of computer malware discovered on 1 September 2011, created by Unit 8200 and having the name from the prefix “~DQ” it gives to the names of files it creates. Based on the modular structure, the Duqu looks for information that could be useful in attacking industrial control systems, not to be destructive but to gather information being able to attack any type of computer system with capabilities to delete all recent information entered on the system and even total deletion of the computer’s hard drive. Actually it steals digital certificates (and corresponding private keys, as the one used in PKC (public-key cryptography) from attacked computers to help future viruses appear as secure software. To smuggle data, encrypted dummy files or even JPEG pixel files are used as malware container [
21].
The high security remote maintenance solutions ensures the smooth operation of plant enabling to monitor the plant, the machineries and the IT systems via the Internet, for a quick reactions in emergency events but mostly to carry out preventive maintenance. The solution implies maintenance connections via rendezvous serves installed in a DMZ (demilitarized zone), blocking the one sided access to customers networks but generating VPNs (Virtual Private Network) a technology that creates a safe and encrypted connection over a less secure network, developed as a way to allow remote users and branch offices to securely access corporate applications and other resources. The access to the intranet is not available, even if the firewall is compromised, as long as the firewall is properly configured. To ensure safety, the IT security level must be continuously maintain end optimized. Within Data transfer the users must use authentication methods—including passwords, tokens and other unique identification methods—to gain access to the VPN and a screened subnet (known as a “triple-homed firewall”), a network architecture that uses a single firewall with three network interfaces:
the public interface and connects to the Internet;
one connects to a DMZ to which hosted public services are attached;
one connects to an intranet for access and release from the internal networks.
The safety reactions are possible only if the process control system is well-known. The volume and frequencies of process errors indicates the level of the process optimization, each feedback loop offering the possibility to identify the correct level of prioritization, in order to see from where the most error situation are coming: false operation limits, defaults state preservation, etc. very often the solving an early fault eliminates a flood of potential alarms that usually are acting in cascade blocking the process. The search shows up that to initiate the integration of digital technologies within the company is better if the individual controlled systems require less than 2500 I/O signals or data ports. Considering the best 1 µs/signal that is a 2.5 s (3 s) cycle for the process monitoring, acceptable time for the most regular processes [
22].
The fifth hidden potential includes the equipment of the IT infrastructure. The research reveals that in many companies old, obsolete and unassisted IT systems are in operation. This concern mostly the use of PC’s and the control system software, components that have very short technological cycles and therefore are aging very quick. The experience shows that for PC technology the failure rates increases abruptly after 3–4 years of use. In this period of time is diminished also the software support and increase the incompatibility between the actual and the next generation of software and hardware modules. The hardware-software implementation must be synchronized and coming from the same generation. The innovation short cycles having a hard word to say and rising problems on many levels are testing hard the managers decisions, showing how unprepared the managers are.
Just to show how new digital technology is not used at the real rationalization potential to increase productivity, could be a critical element especially if the competitors are implementing new facilities and process control, and here a key role is playing the partnership between the manufacturers and the beneficiaries. The short technological lifecycles for monitoring and operation (hardware and software) implies timely adjustments and updates in order to keep the failures and errors cost as low as possible. If the 30% of the facilities and software attend the “obsolete status” than the provider support cannot any more guarantee the functionality. Some first stages of research, within the indexing projects, have shown that the companies’ ambitious productivity objectives demand much more extensive system maintenance. This is reflected in the index values which are 30% higher than average. Almost all companies with major streamlining requirements operate their plants using up-to-date system technology and invest in failure prevention. The practical evaluation also showed that the “best-in-class” rely on a four up to six years planning horizon (again a five years optimal average time) when it comes to the planning of a life cycle strategy. The accurate planning horizon is at the intersection between de decreasing of the planning reliability over the time, and the tendency to increase the potential cost reduction once with the extension of the planning horizon. So 5 years seems to be the optimum between the desired potential of cost saving and a reliable planning horizon.

