Article

Comparing the Technology Trajectories of Solar PV and Solar Water Heaters in China: Using a Patent Lens

1
School of Public Policy and Management, Tsinghua University, Beijing 100084, China
2
KTH Royal Institute of Technology, 10044 Stockholm, Sweden
*
Author to whom correspondence should be addressed.
Sustainability 2018, 10(11), 4166; https://doi.org/10.3390/su10114166
Submission received: 10 October 2018 / Revised: 4 November 2018 / Accepted: 5 November 2018 / Published: 12 November 2018
(This article belongs to the Section Energy Sustainability)

Abstract

:
China invests more in renewable energy than any other countries, such as in solar energy. The traditional literature maintains that these government-supported industries are more innovative than grassroots industries such as solar or thermal, which leads to debate. This study uses mixed methods, combining qualitative and quantitative approaches to compare the technology trajectories of leading solar water heater (SWH) and solar photovoltaic (PV) firms in China. It concentrates on the following three aspects: trajectories of key technologies, patent citation network, and type of collaboration. Our analyses show that technology trajectories differ significantly between leading SWH firms and PV firms in China. We find that the Chinese SWH firms are core to international knowledge networks, and are following a market-driven innovation mode. In contrast, Chinese PV firms are close to the center of the network and government-driven. Research suggests that grassroots innovation, by doing, using, and interaction (DUI), can create short-term market development models relying on China’s traditional industry model, but cannot create a long-term international leading innovation model; only integrated science, technology, innovation modes (STI), and DUI innovation modes tend to result in international leadership in innovation.

1. Introduction

For achieving sustainable development, mitigating CO2 emissions requires the large-scale deployment of renewable resources technology, such as solar energy technology [1]. Global energy consumption has grown steadily in recent decades, putting a strain on fossil fuel resources and leading to environmental degradation and sustainability challenges [2]. China is the world’s largest energy user and the world’s largest emitter of CO2. At the same time, China belongs to the so-called Sun Belt countries [3], with total solar reserves of 1.47 × 10⁷ billion kWh per year, which is equivalent to 2.4 trillion tons of standard coal [4].
Against this backdrop, as the two major industries in the field of solar energy, the solar water heater (SWH) and solar photovoltaic (PV) industries have developed rapidly in the last few decades in China. SWH is a mature technology, and China leads the world in the use of solar thermal power in domestic water heating. China’s PV power accumulative installed capacity increased from 70 MW in 2005 to 130.25 GW in 2017 [5]. China is also the largest solar PV manufacturer, but domestic installation lags behind [6]. Chinese solar PV is predominantly produced for the export market. It relies on intellectual property-intensive technologies and has gotten a lot of political and financial support from the provincial and central governments [7]. SWH depends mainly on Chinese technologies, such as evacuated tube technology, and can be found everywhere across China, especially in rural areas [7].
Solar PV and SWH are both low-carbon technologies that contribute to China’s sustainable development. Yet, they have different technological, economic, and social characteristics and dynamics [7]. China is awakening to the need to fundamentally rethink the innovation pathways by which the two industries are developed and managed, for more effectively solving development bottlenecks, such as a lack of breakthrough innovations in the SWH industry and a lagging domestic market for the PV industry.
This study uses mixed methods, combining qualitative and quantitative research approaches to compare the technology trajectories of leading solar water heater (SWH) and solar photovoltaic (PV) firms in China.
This paper builds on previous research by Urban et al. [7] and uses patent analysis to examine the innovations of Chinese SWH and solar PV enterprises. Our main goal is to determine to what extent and how the PV and SWH patent knowledge bases differ in China.
There is some literature on patent analysis for solar PV development in China [8], but less on SWH, and a knowledge gap exists regarding firm-level [9,10,11] technology pathways and innovation from a comparative-analysis perspective. According to Hu and Wang [12], 95% of SWH in China has the evacuated tube design. China Greentech Initiative (CGTI) estimates that Chinese firms hold 95% of the patents for core technologies of SWH worldwide [13]. However, academic research underpinning these figures is scarce. To observe the impact of technological innovation on enterprise expansion and market shares, and to provide empirical evidence for policy recommendations, this paper also explores the relationship between sales income and patent degree centrality through empirical analysis to observe the impact of technological innovation on enterprise expansion and market share. This study measures firms’ knowledge bases in three ways: the trajectories of primary technologies (measured by patents), patent citation networks (knowledge flow and spillover), and university‒industry R&D collaboration and acquisition. Furthermore, this study discusses the possible drivers for the differences between Chinese SWH and PV industries’ technology development paths, such as industrial market orientation, innovation modes, and policy characteristics. Answering these questions can help us to understand how China can follow sustainable development pathways in the renewable energy industries.
The research first reviews the literature on indigenous innovation in China. Section 2 discusses the SWH and PV industries and their leading firms. Section 3 discusses the methodology. Section 4 presents the empirical analysis and case study. Section 5 analyzes the influence of patent degree centrality on sales income. Section 6 discusses the findings and presents the conclusions.

2. Literature Review

China’s new indigenous innovation strategy aims to transform its business systems and leapfrog to a leading position in a science-based and technology-oriented industry [14]. The development of the solar energy industry has been supported by a series of investment and industrial policies in China, including the Medium-term to Long-term Plan (MLP).

2.1. SWH Development

SWH represents one of the main applications of solar energy. The cumulated solar thermal capacity in the world by the end of 2017 was 472 GWth (the solar thermal energy of 106 square meters installed area is equal to 0.7 GWth, and 1 GWth = 109 W = 1,000,000,000 W), growing from 62 GWth in 2000 [10]. China has formulated standards for solar space-heating systems, which have supported its development [12]. China’s solar thermal heating accounted for about 80% of global production and 70.6% of global installed capacity in 2015 [15]. So China undoubtedly has the world’s largest SWH market. By the end of 2016, the vast majority of the total capacity in operation was installed in China (324.5 GWth), which was reported to save about 90.2 million tons of CO2 per annum [16]. With a global share of 71.6%, evacuated tube collectors were the predominant solar thermal collector technology in 2016 [16].
The SWH industry began with the development of China’s first solar water heaters at Tianjin University in 1958. In 1979, China began to attach importance to research on solar water heater technology, and broke through with the core evacuated tube technology in 1983. In 1986, Beijing Solar Energy Technology Co., Ltd. (Beijing, China) imported a copper‒aluminum composite solar strip production line from the Canadian Shantap International Corporation, greatly improving the productivity and quality of solar water heaters [17]. A large number of solar water heater manufacturers emerged to commercialize the evacuated tube technology in the middle to late 1990s [18]. Over the years, clusters of big enterprises with an annual output of one million units of solar water heaters have formed in China, including Himin, Shandong Linuo, and Jiangsu Huayang. These enterprises have mastered the core technologies of water heaters and quickly expanded their market share by taking advantage of low costs. However, as Yin (the inventor of the multi-layer gradient aluminum‒nitrogen/aluminum selective absorption coating all-glass evacuated solar collector tube) and Li pointed out in an interview [19], the low-tech threshold and low-cost market competition have stunted the solar water heater industry’s innovative potential, as technology shortages and products that lack innovation can hardly meet the increasingly complex needs of consumers. Many water-heater companies are realizing that technological innovation is the key to long-term market advantages.
The existing literature emphasizes the significance of sectoral-level conditions that shape technology pathways, including market settings, factor conditions, and government policies. Some researchers have proved the impact of innovation activities at the firm level or the sectoral level [20,21]. There is much heterogeneity, both at the sectoral and at the firm level. Urban et al. [7] conducted a qualitative analysis of pathways in the SWH and PV industries, but few quantitative studies provide a comparative analysis. Additionally, the patent lens has often been used to analyze the PV industry [22], but has been used less frequently for the SWH industry. This study addresses these issues by focusing on firm-level technology innovation, which may significantly shape a firm’s technology trajectories, and we combine quantitative and qualitative methods to analyze the development patterns of the SWH and PV industries.

2.2. Solar PV Development

According to the International Energy Agency, the cumulative installed capacity of solar photovoltaics in the world reached 402 GW at the end of 2017, an increase of 29% from 2016 [23]. It is estimated by Solar Power Europe that by 2021, the global photovoltaic installed capacity will be nearly 871 GW [24]. In recent years, due to continuous technological progress, production efficiency, and economies of scale, production costs have declined [25]. PV modules are now mass-produced in large-scale facilities, which is linked to declining costs. Before 2009, China enacted some major development programs to promote solar PV power for off-grid domestic use [26]. Now China’s photovoltaic industry ranks first in the world in terms of scale, and occupies more than 50% of the global market. In 2017, the cumulative installed capacity of photovoltaic power generation in China was 130.25 GW, accounting for 32.4% of the total installed PV capacity [27]. It is estimated that by the end of 2020, the total installed capacity of photovoltaic power generation in China will reach 250 GW [27]. However, due to anti-dumping charges made by the EU and the USA, China’s PV industry is restructuring and experiencing rapid market reconfiguration. In addition, despite strong financial and policy support, domestic market under-development remains an issue in China [28].
Research on solar cells in China began in 1958, and the first Chinese solar cell was created in 1959. China’s commercial PV industry started in the 1970s, and has developed rapidly since the 1990s [29]. Abundant literature has assessed the development trajectories of solar PV technology through various analytical perspectives, such as efficiency trends, the environment, R&D strategy, and markets [30,31,32]. Zhang and Gallagher examined the role of innovation and technology transfer in China’s solar PV industry, and identified the main drivers for solar PV technology transfer to China as being global market formation policy, international mobilization of talent, the flexibility of manufacturing in China, and belated policy incentives from China’s government. The development trajectory of the PV industry in China indicates that innovation in cleaner energy technologies can occur through both global and national innovation processes, as well as knowledge exchange along the global PV value chain [33].
With the support of the central government, China’s PV enterprises have witnessed rapid development and many enterprises have emerged, such as Yingli, Hanergy, and Trina Solar. These enterprises focus on technological innovation and international cooperation; they have made technological advances through acquisitions, innovation, and other means [33].

3. Theoretical Framework and Methodology

This paper used mixed methods, combining qualitative and quantitative research approaches to analyze the differences between the technology trajectories of Chinese SWH and PV industries. First, this study used patent analysis and a multiple-case study to compare the technology trajectories of the Chinese SWH and PV industries. It is found that there is a certain correlation between the technological innovation and the performance of the enterprise. Then we conducted a quantitative analysis to verify such a correlation in Section 5, in order to increase the generalizability of the research results.

3.1. Theoretical Analytical Framework

Previous studies show that knowledge bases are crucial to developing a competitive advantage, shaping sustainable development, and establishing market leadership [34,35], while technology innovations are considered to be key factors for economic growth [36]. Studies that examine the innovation positions of specific industries have mostly been based on qualitative inquiries such as case studies. Some recent literature has used patent analysis and bibliometrics to enhance the validity of innovation indicators. As an important output of innovation, patents can reflect knowledge flows and innovative activities. Patent data have long been used in economic analysis [37], and have been applied to technology assessment and forecasting in recent years.
In theoretical terms, acknowledging that technological innovation develops in a certain trajectory, Dosi (1982) put forward the concept of a technological trajectory [38]. Scholars usually adopt the technological trajectory theory to account for both continuous changes and discontinuities in technological innovation [39,40,41,42,43,44]. Based on this theory, this paper attempts to develop an analytical framework using patent data to analyze the technological trajectories of the SWH and PV industries. This paper reviewed the existing literature using a patent lens to determine which dimensions of technology trajectories can be measured by patent-based indicators, and how to measure them. Based on this, our research developed an analytical framework (Table 1) that focuses on the three major dimensions through a patent lens: trajectories of key technologies, patent citation network (knowledge flow and spillover), and type of collaboration (university‒industry R&D collaboration or firm‒firm collaboration).

3.2. Patent Analysis Method and Data

Until recently, the patent lens was frequently used in the literature to characterize knowledge bases [45,50,51,52]. Patent propensity has long been used as a well-founded proxy for evaluating technological innovations [36]. Patent citations are often taken as linkages between technology knowledge bases, between companies, and between science [53,54]. This paper analyzes the technology trajectories of these two industries in China through patent data, and examines the differences between them, including the impact of technological innovation on competitiveness, long-term development of enterprises, and policy support. We collected patent data from the enhanced database combined by the Derwent World Patents Index (DWPI) and Derwent Patents Citation Index (DPCI) databases under the TI framework (data matching is more than 99.9%). This study searched patent data up to October 2017, with the patenting year (the priority year of submissions) during the period from 1967 to 2016. To make valid comparisons, it is necessary to use the same timeframe to analyze multiple pathways.

3.2.1. First Set: Trajectories of Key Technologies

A patent is one possible output of scientific and technological development, revealing the intelligence that organizations consider worth protecting. A collection of patents in a certain discipline may represent part of its accumulated knowledge. The patent growth trajectory of a certain technology provides a good indication of its development status, including stages in its life-cycle and time to maturity [22]. We, however, acknowledge that innovation can also be present without filing for patents, particularly in the earlier years of Chinese clean technology development.
Solar cell technology [55] and evacuated tube technology are the key technologies of the solar PV industry and solar water heater industry, respectively. This paper extracts patents representing the two kinds of key technologies by data mining (shown in Table 2) and analyzes the innovation path of the solar PV industry and solar water heater industry by observing the key technology trajectories.

3.2.2. Second Set: Patent Citation Network (Knowledge Flow and Spillover)

Knowledge flows in the forms of learning and spillover are prominent in both the PV and SWH sectors [45]. The patent data showed that Japanese, American, and European firms began to develop their solar water heater industries in the 1960s and their solar PV industries in the 1990s. Thus, these firms first attained technical merit, which created spillover knowledge. Some studies argue that Chinese firms were latecomers to the solar industry, particularly PV [33]. In fact, some Chinese research institutes started researching solar water heaters much earlier than firms. Tsinghua University established a solar energy research team in 1979, and the Chinese Academy of Sciences started its solar water heater research in the early 1990s. However, since the public’s awareness was low in China’s solar water heater industry’s initial stage of development, there were fewer patent applications by institutes and firms [56].
Knowledge spillover can be considered a leakage, or a voluntary or involuntary exchange of knowledge spread across time. Scholars have shown empirically that quantitative data are systematically linked through patent analysis, which provides contextual information concerning nation- and technology-specific features in national and international frameworks and shows technology linkages and knowledge flows [57]. This research can show and analyze knowledge spillover through a patent citation network.
By analyzing the critical nodes, topology, and core networks, we can perceive the transmission of knowledge growth between countries, institutions, and firms [58]. Duguet and MacGarvie [59] directed a series of studies integrating patent citations with survey data, and concluded that patent citation analysis can clearly show the transfer of knowledge from one entity to another. This paper used the Thomson Data Analyzer (TDA) to draw the patent citation network, showing the cooperative relationship of the top 50 organizations, including firms and colleges, according to the selection criteria in Section 3.1. Here nodes represent the patent counts of assignees, and links between nodes denote cooperative relationships, as shown in Section 4.2. To study the knowledge-network structure, this paper applied several indicators, such as density, average distance, fragmentation, hybrid reciprocity, and out- and in-degree centrality [45], using the visualization software UCINET, as shown in Table 3, Table 4, Table 5 and Table 6.

3.2.3. Third Set: University‒Industry R&D Collaboration and Firm‒Firm Collaboration

University‒industry knowledge transfer is a broad concept identifying a wide set of interactions between firms and universities [47]. In particular, university‒industry research collaboration is a specific channel of inter-organizational knowledge flows and potential spillovers from (and to) academic research aimed at carrying out specific R&D projects, particularly involving pre-competitive and basic research [60]. To observe and compare the technological trajectories’ evolutionary process between the two industries, we selected eight organizations from each industry according to the selection criteria in Section 3.1, as shown in Figure 1.
Conceptually, firm‒firm collaborations provide a firm with economies of scale and increase its capacity to absorb, develop, and recombine knowledge in new ways, which contributes both to its short-term innovative performance and its long-term competitive advantage [48]. From a resource-based perspective, technological collaborations between firms improve the acquiring firm’s innovative performance. As a firm’s innovativeness is a function of its knowledge base, and the knowledge base of a firm can be extended through an R&D investment, some researchers state that grafting a “knowledge-rich” target onto a firm’s existing base offers greater benefit for a lower price [47]. Technological acquisitions enhance a firm’s asset base and organizational capabilities, which spurs innovation while allowing it to side-step the time-consuming process of internal accumulation.
Based on the above collaboration modes, this paper compares and analyzes the main ways to obtain technical innovation in China’s SWH and PV industries, and then analyzes the impact of the different cooperation modes on the two industries in Section 5.

3.3. Case Selection

This study conducted a qualitative analysis based on a cross-case study. It analyzed how the selected organizations attained their technology innovation, and examined the Chinese enterprises’ technology trajectories. Combining with a market analysis, it proposes policy recommendations to support the long-term and stable development of China’s solar energy firms.
This paper adopted a multi-case approach to study the technology trajectories of the two industries. Following Yin (2003) [61], four firms were selected as representative cases for in-depth study using a patent-based analysis. The analysis followed the methodological success of prior patent studies [30], focusing on the trajectories of key technologies, knowledge networks (knowledge flow and spillover), and collaboration forms (university‒industry R&D collaboration and firm‒firm collaboration). The selection process was purposive rather than random. A theoretical sampling procedure applied three case-selection criteria: (1) These firms are the leading SWH/PV manufacturers in China or their own countries, and focus on technological innovation; (2) their technology pathways are based on innovative products, and can be analyzed through patents; and (3) they rank at the top in terms of the number of patent. According to the case-selection criteria, this study selected the SWH firms Himin (China), Linuo (China), Panasonic (Japan), and A. O. Smith (America). Similarly, the solar PV firms Yingli (China), Hanergy (China), Canon (Japan), and First Solar (America) are selected. Our focus is on industry development in China, hence this research selected more Chinese enterprises, using the others for comparison.
We combined quantitative and qualitative research methods for this study. Qualitatively, we conducted 37 semi-structured, in-depth interviews in China with leading energy experts from research and academia, solar energy firms, business associations, government, and nongovernmental organizations (NGOs), including the Chinese Academy of Engineering, Tsinghua University, the Energy Research Institute, National Development and Reform Commission (NDRC), Ministry of Science and Technology (MOST), and solar energy firms such as Yingli, Trina Solar, Himin Solar, and Hanergy. Fieldwork was conducted at large-scale energy conferences in Beijing and Qingdao between August 2017 and June 2018, and on trips to Beijing, Dezhou, Tianjin, Baoding, and Shanghai between October 2014 and October 2016.

4. Empirical Analysis and Case Study

This section presents the findings of our empirical analysis.

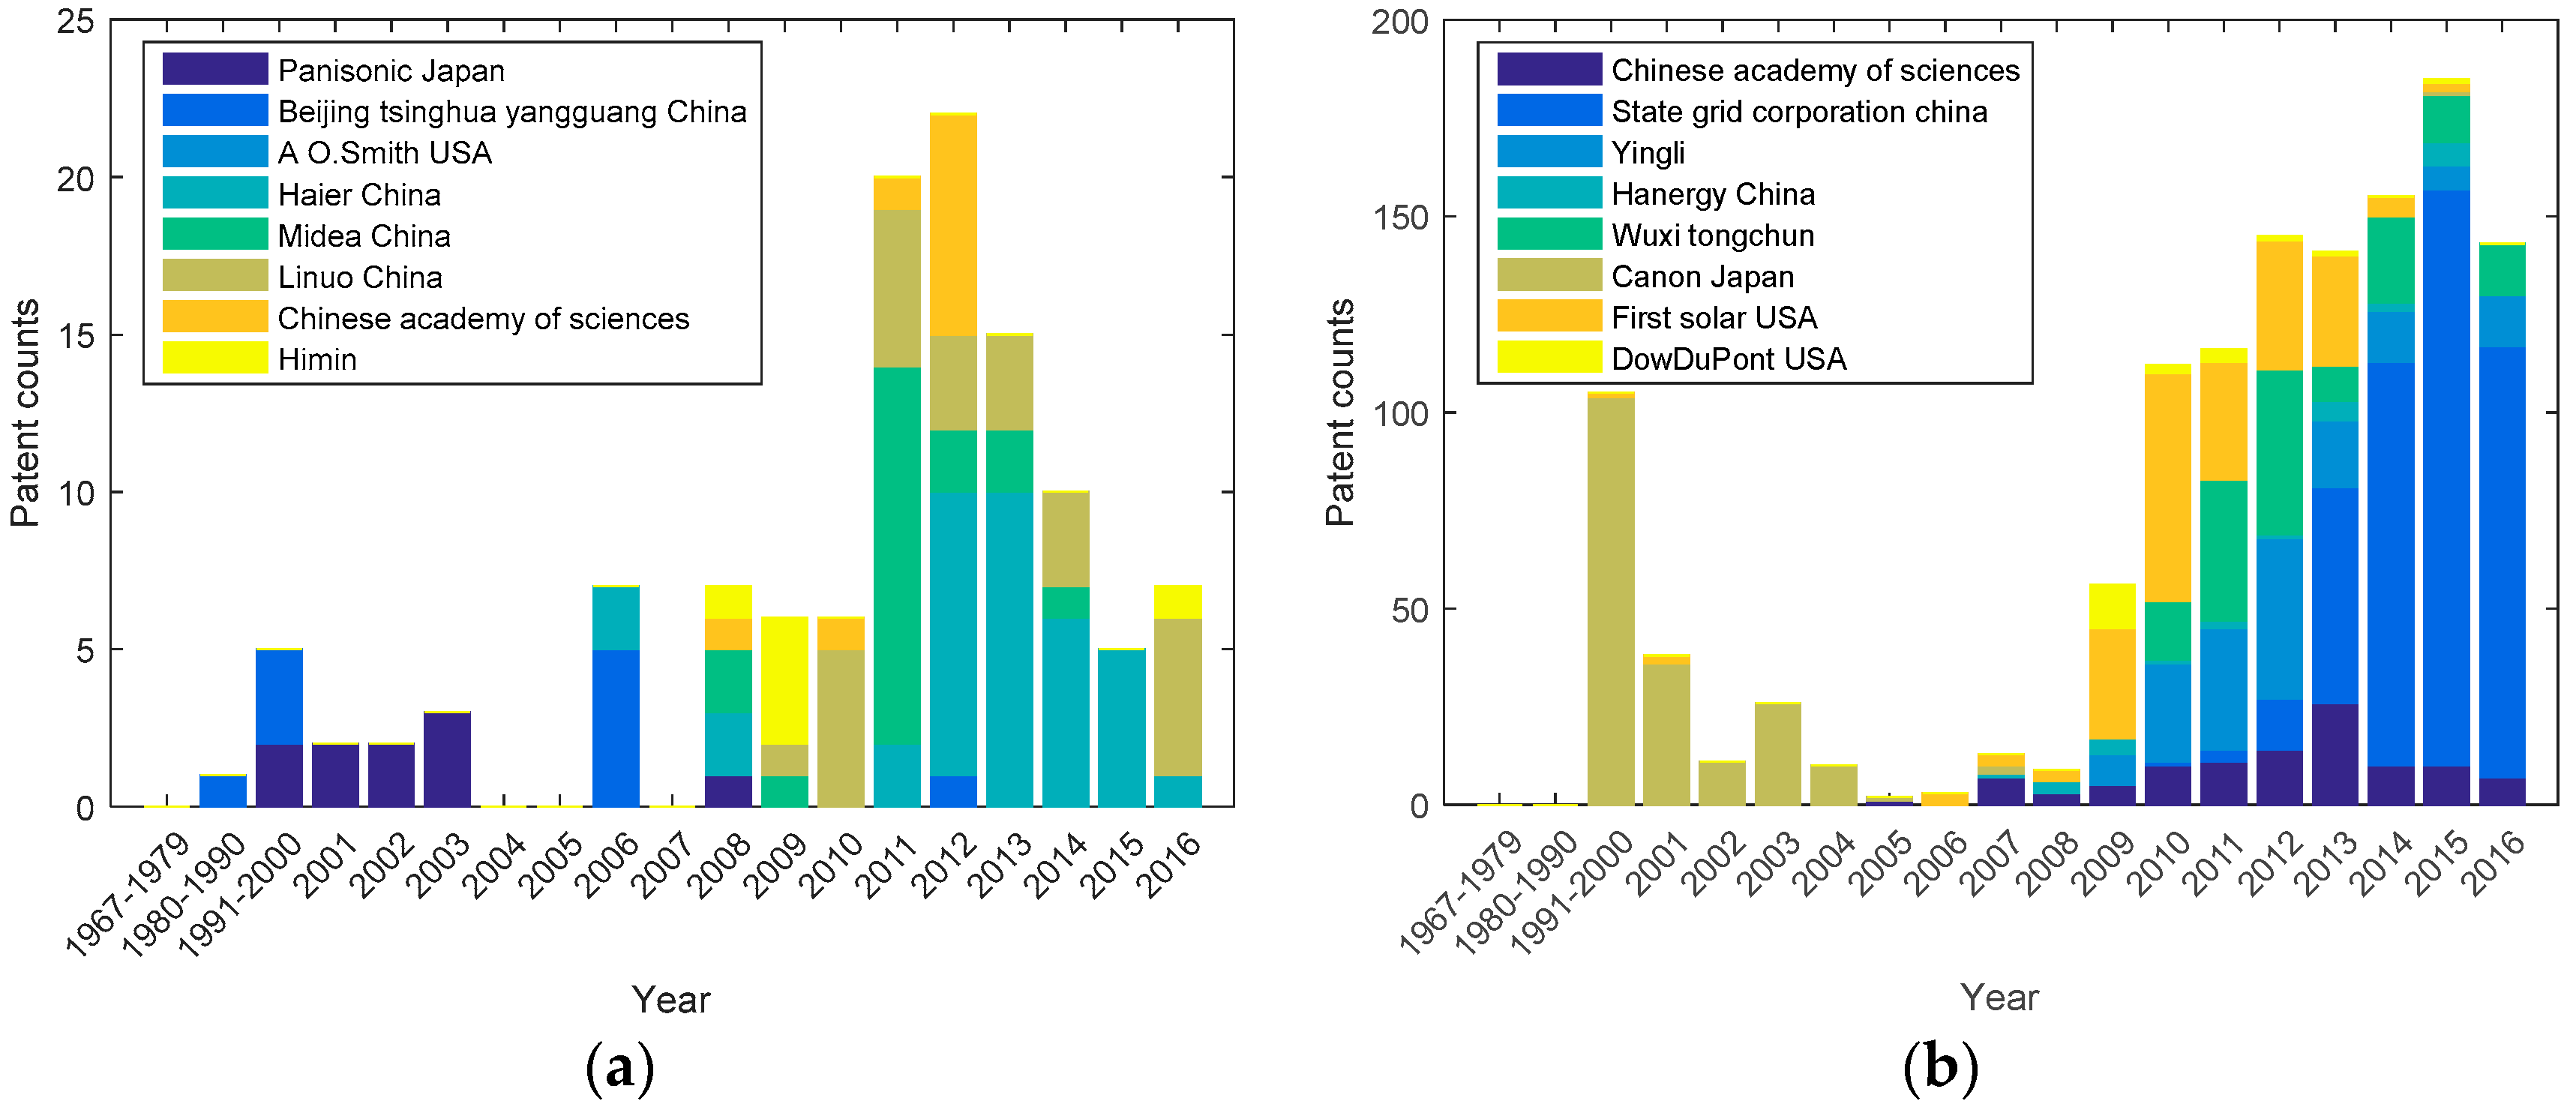
4.1. Trajectories of Key Technologies

Through data-mining, this study extracted the number of patents on key technologies in the two industries, as shown in Figure 2. Figure 2a shows that, since 2008, the number of patents for evacuated tubes by Chinese companies, including Himin, Haier, and Linuo, increased significantly, while the number of such patents from Japanese Panasonic steadily decreased.
In addition, Figure 1a shows that Beijing Tsinghua Yangguang and Panasonic started the SWH industry before 1990, while R&D at the Chinese Academy of Sciences started in the early 1990s. In fact, Tsinghua University started R&D on SWH as early as 1979, and invented the selective absorption coating all-glass evacuated solar collector tube in 1983, then applied a patent for this indigenous innovation in 1985, and established the Tsinghua University Solar Electronics Factory (renamed Beijing Tsinghua Yangguang Solar Co. Ltd. in 1998) in 1994, and commercialized the patent technology [18]. Other enterprises, including Chinese Haier, Himin, Linuo, Midea, and the American A. O. Smith, entered the solar water heater industry around 2005 and sped up after 2008. As for solar PV, Figure 2b demonstrates that the State Grid Corporation of China and Yingli rapidly innovated on PV battery technologies after 2008, whereas they had hardly innovated before. The Chinese Academy of Sciences started research in 2007 and maintained steady development. Again, Japanese Canon had more presence in the earlier period from the 1990s to 2005, but its patented research almost disappeared after 2005. American First Solar started research in 2006, and this intensified starting in 2008. Figure 1b shows that Japanese Panasonic and Canon entered the PV industry before 1990, the American DowDuPont and First Solar became active around 2004, the Chinese Academy of Sciences entered around 2006, and Chinese firms including Yingli, Hanergy, and State Grid Corporation of China became active around 2008.
Based on the analysis above and Section 3.2.2, the results can be summarized as follows: (a) It was not until 2008 that Chinese SWH and PV industries entered a stage of rapid development; (b) as a typical indigenous innovation technology in China, the SWH evacuated tube technology was originally developed by academia institutes, but PV key cell technology was almost simultaneously started by Chinese PV firms and the academia institutes; (c) the Chinese SWH industry reached technological advantage since the 1980s, while the Chinese PV industry obtained the key technology around 2008.

4.2. Patent Citation Network (Knowledge Flow and Spillover)

Following the methods outlined in Section 3.2.2, this paper created the patent citation network for SWH/PV patents (see Figure 3, Figure 4, Figure 5, Figure 6, Figure 7 and Figure 8) based on the cleaned patent data. To develop a better overview, we included all patents of the top 50 global SWH/PV firms, and all the case firms were included. In September 2007, China issued the Mid-term and Long-term Development Plan for Renewable Energy in China, and proposed a national renewable energy development target including wind, solar, and biomass energy. Around 2008, along with the global financial crisis, a series of consumer-promotion policies such as home appliances going to the countryside, promoting SWH, and trade-in replacements. Figure 1 and Figure 2 show that 2008 was a critical turning point for the solar energy industry. This may be because of the Eleventh Five-Year Plan of Renewable Energy Development promulgated in 2008, which promoted the development of the solar industry, particularly PV. Based on the above, our research divided the period (1995–2016) into two phases, making 2008 the cutoff year (in Section 3.2.3), to construct two sub-networks (1995–2008 and 2009–2016) and a full network (1995–2016). This allowed us to research the organizations’ growth changes over time. Table 3 and Table 5 show the evolution of the network structure’s key indicators for the different periods.

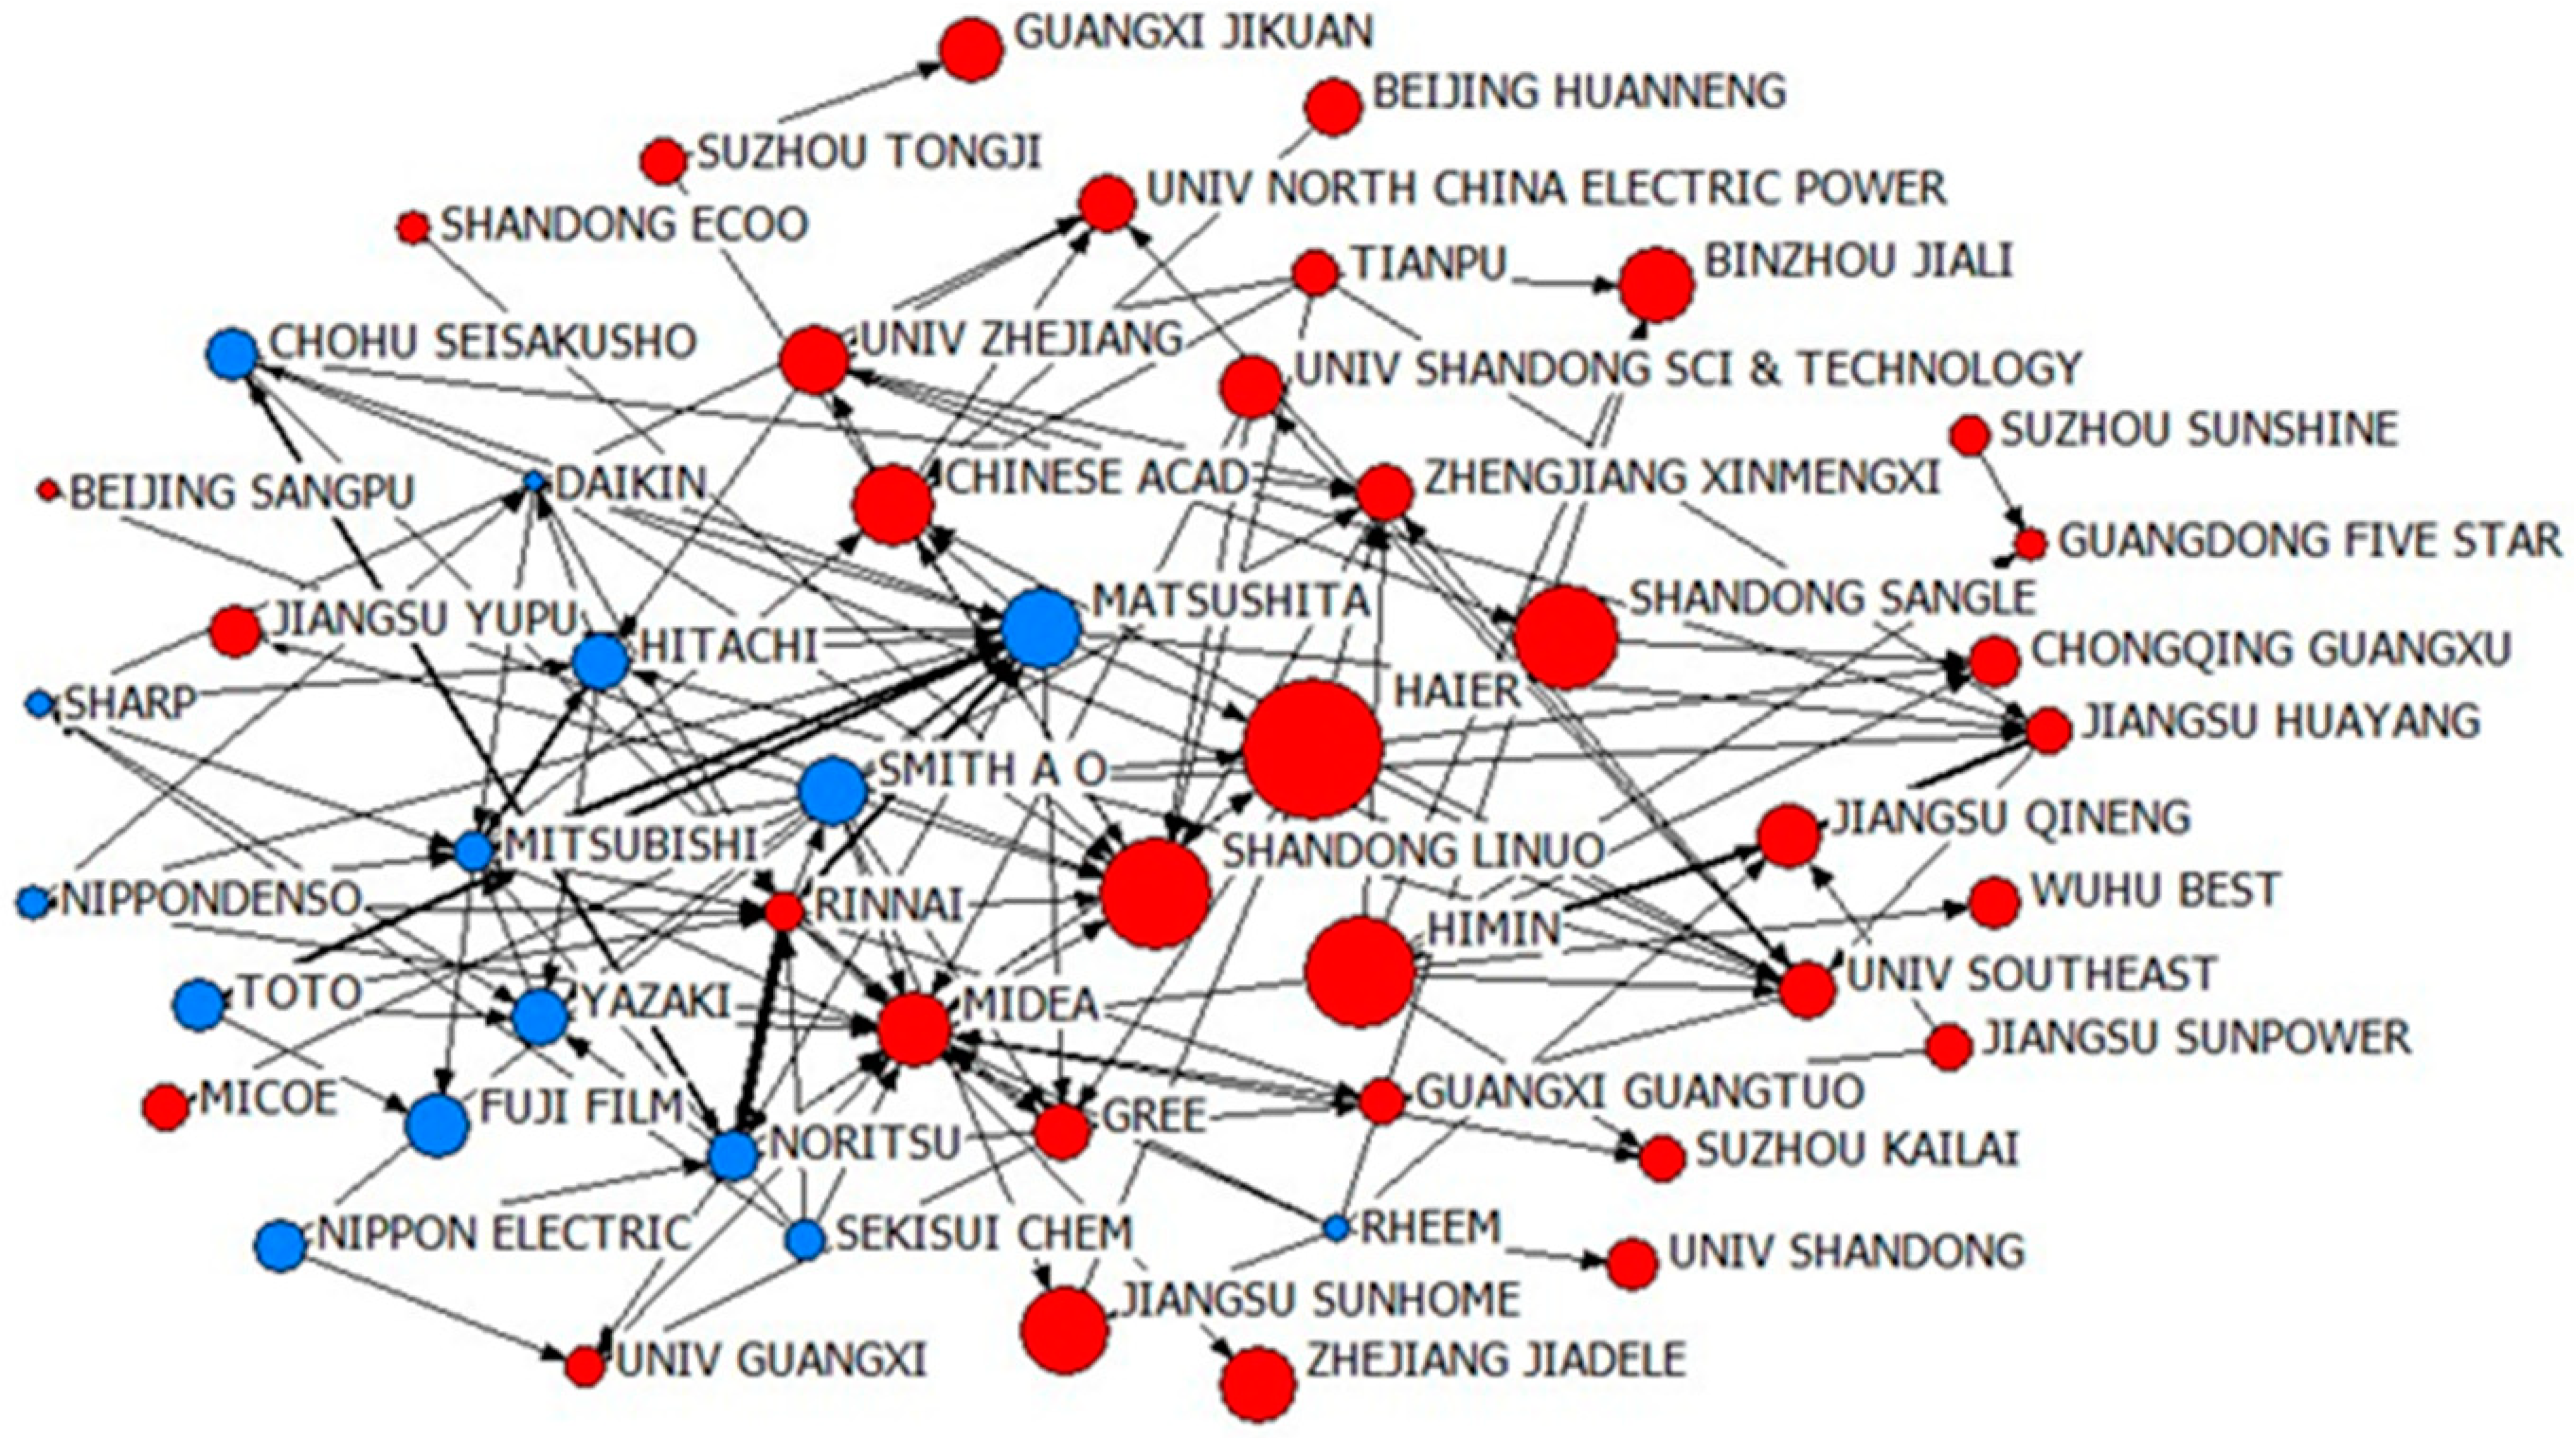
4.2.1. SWH Patent Citation Network Analysis

As Table 3 shows, the increase in network density (total patents/total citations) is consistent with the exponential growth in patent citations of SWH firms after 2008, while the total number of patents also increased, which means the knowledge flows (citations) appear to have increased within the network. The average distance means the shortest average paths between key nodes. The rise of average distance values suggests that knowledge diffuses faster in the 2009–2016 network compared with the earlier network (1995–2008), as more and more actors are emerging and the network is more complex. In addition, the decrease in fragmentation (proportion of firms/nodes that could not reach each other) means that the number of isolated islands within the SWH patent network has decreased. The obvious increase in reciprocity (full-time network) indicates that the producers and consumers of knowledge have changed significantly over time in the SWH industry, which means that after the innovation leaders spilled over knowledge before 2008, the latecomers learned and absorbed much, and some may have grown into knowledge spillers. Next, the minor value of distance-based cohesion in the network (1995–2008) means the competition level is low in the Chinese SWH industry before 2008, but the obvious increase in cohesion (compactness) means the SWH industry is growing quickly, and more inter-firm knowledge flow occurs. In-degree centrality increased more than out-degree centrality after 2008, indicating more and more latecomers, but the conspicuous change after 2008 means that new dominant leaders are emerging, hence knowledge competition may have matured in the SWH industry and no stronger competition emerges in the later network.
Figure 3, Figure 4 and Figure 5 illustrate the resulting network of SWH organizations. The lines represent the cumulative citations in both directions: the thicker the line, the more citations between two firms. The size of a node is determined by the patent count. The core/periphery structure of the three network diagrams represents each company’s position in the network. The red nodes represent Chinese firms or colleges, while the blue ones represent overseas entities.
First, we observed that the core companies (the larger circles) in all three networks included traditional Japanese leaders such as Panasonic, Mitsubishi, and American A. O. Smith. The Chinese Haier also appeared to be a core firm, which may be due to its diversified development mode and rich knowledge base. In the later network (2009–2016), some Chinese firms, such as Himin, Shandong Linuo, and Shandong Sangle, grew into technology leaders. The positions of them in the network were transferred from the periphery to the center area, suggesting that increasing numbers played significant roles in knowledge flows. Comparing networks (1995–2008 and 2009–2016), more Chinese firms appeared, indicating the quick development of the Chinese SWH market. The data reveal that Chinese SWH firms were already in a core position in the solar water heater international knowledge network after 2008.
Second, the circles representing the leading Chinese firms in the core positions were generally larger (more patents), indicating that they learned through knowledge flows. Conversely, the Japanese and American companies did not change much, indicating that they did not consider SWH business as a key development target. Meanwhile, Chinese research institutes, such as the Chinese Academy of Science, Southeastern University, and Shandong University, appeared in the later and full-time networks, which means they were attracted by the growing SWH industry in China, and focused on technology importation and innovation. The research found some other interesting features. For example, some Chinese leading firms that that opened up large market territories, such as Shangdong Ecoo, Micoe and Gree, are still positioned on the edge of the later network.
Third, the network figures reveal that although the circles representing Chinese firms became obviously larger in 2009–2016 and 1995–2016, the lines between them and the others were thicker in 2009–2016, showing that they were frequently cited. Thus, it is found that Chinese firms have developed into creators of solar water heater technologies and there was related knowledge spillover. In other words, Chinese firms are the foundation of the solar water heater industry, and the leading Chinese firms have grown into core companies through years of knowledge importation. This is consistent with our analysis in Section 4.1.
Table 4 shows the key indicators for the SWH sample organizations in networks (Table A1 shows the indicators for 50 SWH organizations). The net citation counts indicate the net knowledge producers (positive) and net knowledge consumers (negative) [45]. Panasonic contributed significantly to the world, with by far the highest net citation count in 2009–2016, but with a large drop in in-degree value.
Table A1 indicated that the Chinese leading SWH firms, such as Himin, Sunpower and Tianpu, have grown from knowledge absorbers with negative net citations in 1995–2008 to knowledge creators with highly positive net counts in 2009–2016. Most Chinese SWH firms had a very limited presence in terms of both citing and being cited in 1995–2008. However, since 2008, many have become more active in both directions. Some, such as Jiangsu Qineng, Guangdong Fivestar, and Chongqing Guangxu, developed into knowledge absorbers in 2008–2016, although they never appeared in knowledge flows in 1995–2008. Table 4 also shows that Chinese firms have fewer net citations than leading Japanese SWH firms. This may be partly because until recently Chinese research was mainly published only in the Chinese language. However, leading Japanese firms’ net citations decreased from 2009–2016 to 1995–2008, while Chinese firms’ citation counts increased. An interesting phenomenon can be observed: some Chinese leading firms, such as MICOE, Beijing Sangpu, and Shandong Ecoo, have a limited presence despite their large market share, and they are still on the periphery of the network (2009–2016) in Figure 4. Some other core SWH firms, like Midea and Linuo, were net knowledge consumers with negative net citations, acting positively in knowledge flow with high indegree centrality, which meant they absorbed more knowledge than they produced. All this indicates that the rapid development of the Chinese SWH industry is driven by the market, mainly learning new knowledge from others to expand the market.
Table A1 also reveals that some Chinese research institutes, such as the Chinese Academy of Sciences, had a high betweenness centrality (after 2008), which indicated that they played an important intermediary role in the knowledge flow.
Based on the above analysis, the results can be summarized as follows: (a) The Chinese SWH industry has increased its competitive intensity since 2008, but has not yet reached the level of competition that can stimulate more breakthrough innovations; (b) Chinese SWH firms have developed from knowledge consumers into knowledge producers since 2008, and they are core to international knowledge networks; (c) the Chinese leading SWH firms are following a market-driven innovation mode based on knowledge that was previously acquired from others; (d) under the current situation of insufficient competition, Chinese SWH leading firms will still act as knowledge spillovers instead of knowledge creators.

4.2.2. PV Patent Citation Network Analysis

As Table 5 shows, the increase in network density (total patents/total citations) means that patent citations between PV firms grew quickly during 1995–2016. Comparing networks (2009–2016 to 1995–2008), an obvious increase in average distance means the distances between organizations was gradually increasing after 2008, which indicates that there were more organizations emerging and a stronger knowledge flow in the network in 2009–2016. The increase in cohesion (compactness) and patents, plus the decrease in fragmentation (proportion of firms/nodes that cannot reach each other), represents the reduced number of isolated islands, hence a more frequent knowledge flow within the PV patent network. In addition, the reciprocity has remained stable, which may indicate that the producers and consumers of knowledge have not changed significantly over time in the PV industry, as the innovation leaders are still spilling over knowledge and latecomers are still learning and absorbing. Comparing 2009–2016 to 1995–2008, we can observe a small decrease in out-degree centrality and a small increase in in-degree centrality. There is no obvious change in 1995–2016 compared to 1995–2008, which means there are no new innovation technology leaders emerging, hence knowledge competition has not yet matured in the PV industry.
Figure 6, Figure 7 and Figure 8 illustrate the resulting network of PV organizations, with the red nodes representing the Chinese organizations and the blue ones representing ones from other countries. First, it can be observed that the core companies in all three networks included traditional Japanese leading companies like Matsushita and Mitsubishi, as well as American First Solar. This research also found that more Chinese firms appeared after 2008, which may be attributed to the energetic support from China’s central government. State Grid Corporation China grew into a much larger core leader in 2009–2016, occupying a dominating position in patent counts. State Grid Corporation of China is a state-owned company directly managed by the central government with branches all over the country; its rapid development confirms the positive role of government support in the development of the PV industry. In addition, the American IBM, General Electric, and DowDuPont grew quickly into leading firms after 2008, which meant the PV industry had developed into an important and rapidly developing industry all over the world, attracting more and more firms. Second, it can be found that despite some foreign firms still being innovation leaders in the solar PV industry, the leading Chinese PV companies, such as Yingli and Hanergy, have grown into important members near the center of the later network, partly due to Yingli’s strategic cooperation with North China Electric Power University and Hanergy’s acquisition strategy. Third, the network figures also revealed that those firms in core positions were closer to each other, and the ties between them were much stronger, especially in 1995–2016, indicating frequent knowledge flow and fierce competition in the PV industry.
Table 6 shows the key indicators for the PV samples in networks (Table A2 shows the indicators for 50 PV organizations). It can be observed that the leading Japanese firms still acted as knowledge producers in the two networks. Some Japanese firms, such as Canon and Panasonic, contributed significantly to PV innovation. The American firm Applied Materials also acted as an important knowledge spiller in 2009–2016. First Solar was a net knowledge consumer but had high numbers of both backward out-degree and in-degree in the two networks, indicating active knowledge flows. All the above meant that the PV leading firms from abroad were carrying out technological innovations in these timeframes, and the PV industry was still a fiercely competitive field.
In addition, the leading Chinese firm, Hanergy, had grown into a knowledge spiller during 2009–2016, with highly positive net citations, while Yingli was still a knowledge absorber but very active in knowledge flow. Focusing on negative net citations, although many Chinese firms were still knowledge learners, many had more presence in terms of both citing and being cited since 2008, which meant they were creating more and more knowledge while absorbing. Observing only out-degree centrality, we found the values of some Chinese PV firms, such as GCL and Yingli, rising from 0 in 1995–2008 to 44 and 49, respectively, in 2009–2016, and they had more presence in in-degree centrality in the later network. At the same time, some, such as QC Suzhou, had grown into knowledge spillers in 2009–2016. Others, like Wuxi-based Suntech and Changzhou-based Trina, had a large decrease in in-degree centrality and a significant increase in out-degree centrality. All this meant that Chinese PV firms increased their presence and became much more active both in terms of citing and being cited since 2008. Table 6 also reveals that some Chinese research institutes, such as the Chinese Academy of Sciences, had high betweenness centrality after 2008, indicating that they played an important intermediary role in knowledge flow. In addition, Table A2 shows that almost all Chinese PV firms with large market shares play actively in international knowledge flow since 2008, which means Chinese PV firms developed in terms of technological innovation, rather than blindly pursuing market expansion.
Based on the above, the results can be summarized as follows: (a) competition in the Chinese PV industry has become more and more intense since 2008; (b) Chinese PV firms have grown from knowledge absorbers into knowledge spillers after 2008, bringing them close to the center of the international knowledge networks; (c) the leading Chinese PV firms are following an innovation-driven mode for long-term development; (d) the Chinese PV industry continues to be a thriving field with fierce global competition, and Chinese PV leading firms will develop into knowledge creators based on continuous innovations.

4.3. University‒Industry R&D Collaboration and Firm‒Firm Collaboration

University‒industry knowledge transfer is a broad concept identifying a wide set of interactions between firms and universities. In particular, university‒industry research collaboration is a specific channel of inter-organizational knowledge flows and potential spillovers from (and to) academic research aimed at carrying out specific R&D projects [47]. Firm‒firm collaboration is an important path to improve technological innovation capability [62], especially technological acquisitions, i.e., acquisitions of a firm for its technological knowledge or capabilities [48]. This study provides a few examples below. As one of the leading SWH firms, Himin established a cooperation agreement with Gyeongsang National University in 2008 and signed a strategic cooperation agreement with Anxia group in 2013. To further optimize training and promote cooperation between industry, universities, and research institutes, on 14 May 2012, the School of Management Engineering of Anhui Polytechnic University signed a school‒enterprise strategic cooperation agreement with Chinese Midea Wuhu Refrigeration Equipment Co. Ltd., which specializes in solar-powered air-conditioning systems. Furthermore, on 6 March 2017, Midea Group and Huazhong University of Science and Technology signed a strategic cooperation agreement. This was in addition to three acquisitions by Midea, including Japanese electronics giant Toshiba Corporation’s white goods business, Italy’s famous central air conditioning company Clivet (80% equity), and the German firm KUKA. Through this series of actions, Midea has achieved diversified development, enhanced its innovative capabilities, and expanded into overseas markets. Linuo Group and Shandong Construction University signed a strategic cooperation agreement in 2007, and this school‒enterprise cooperation has resulted in China’s first undergraduate major in solar power. In the same year, Linuo Group and Tsinghua University jointly established the Tsinghua Linuo Energy Optoelectronics Research Institute.
One of the leading PV firms, Yingli Group, signed strategic cooperation agreements with North China Electric Power University in 2013, Hebei University in 2014, and Shijiazhuang Tiedao University in 2015. School‒enterprise cooperation is implemented to promote the integration of production, learning, and research, and collaborative innovation is used to guide and promote the building of an innovative firm. Based on these agreements, the Yingli Group broke down barriers between innovative entities, bringing together innovation resources and elements, expanding their market reach, and consolidating their leading position in the PV industry. In the same way, Hanergy Holding Group chose global technology acquisition and integration to quickly enter the thin-film solar industry. From a global perspective, after tracking and screening hundreds of thin-film solar technology companies, Hanergy successively acquired four leading overseas thin-film solar technology companies, including Solibro in Germany, MiaSolé, Global Solar Energy, and Alta Devices in the USA, between 2012 and 2014. As a result, Hanergy has mastered copper indium gallium selenide (CIGS) and gallium arsenide (GaAs) solar technology, and established the world’s leading equipment production line technologies and R&D capabilities. As latecomers, China’s solar PV firms hope to use others’ advanced knowledge to bolster their technological innovation capabilities, building a defendable position in a growing market.
The above shows the analysis results as follows: (a) The university‒industry R&D and firm‒firm collaboration are two important ways for SWH and PV companies to spur technological innovation. In Section 5, we will use empirical analysis to explore their impact on the industry; (b) university‒industry knowledge transfer may have played an important role in bridging knowledge flows in the two industries, especially in the solar water heater industry.

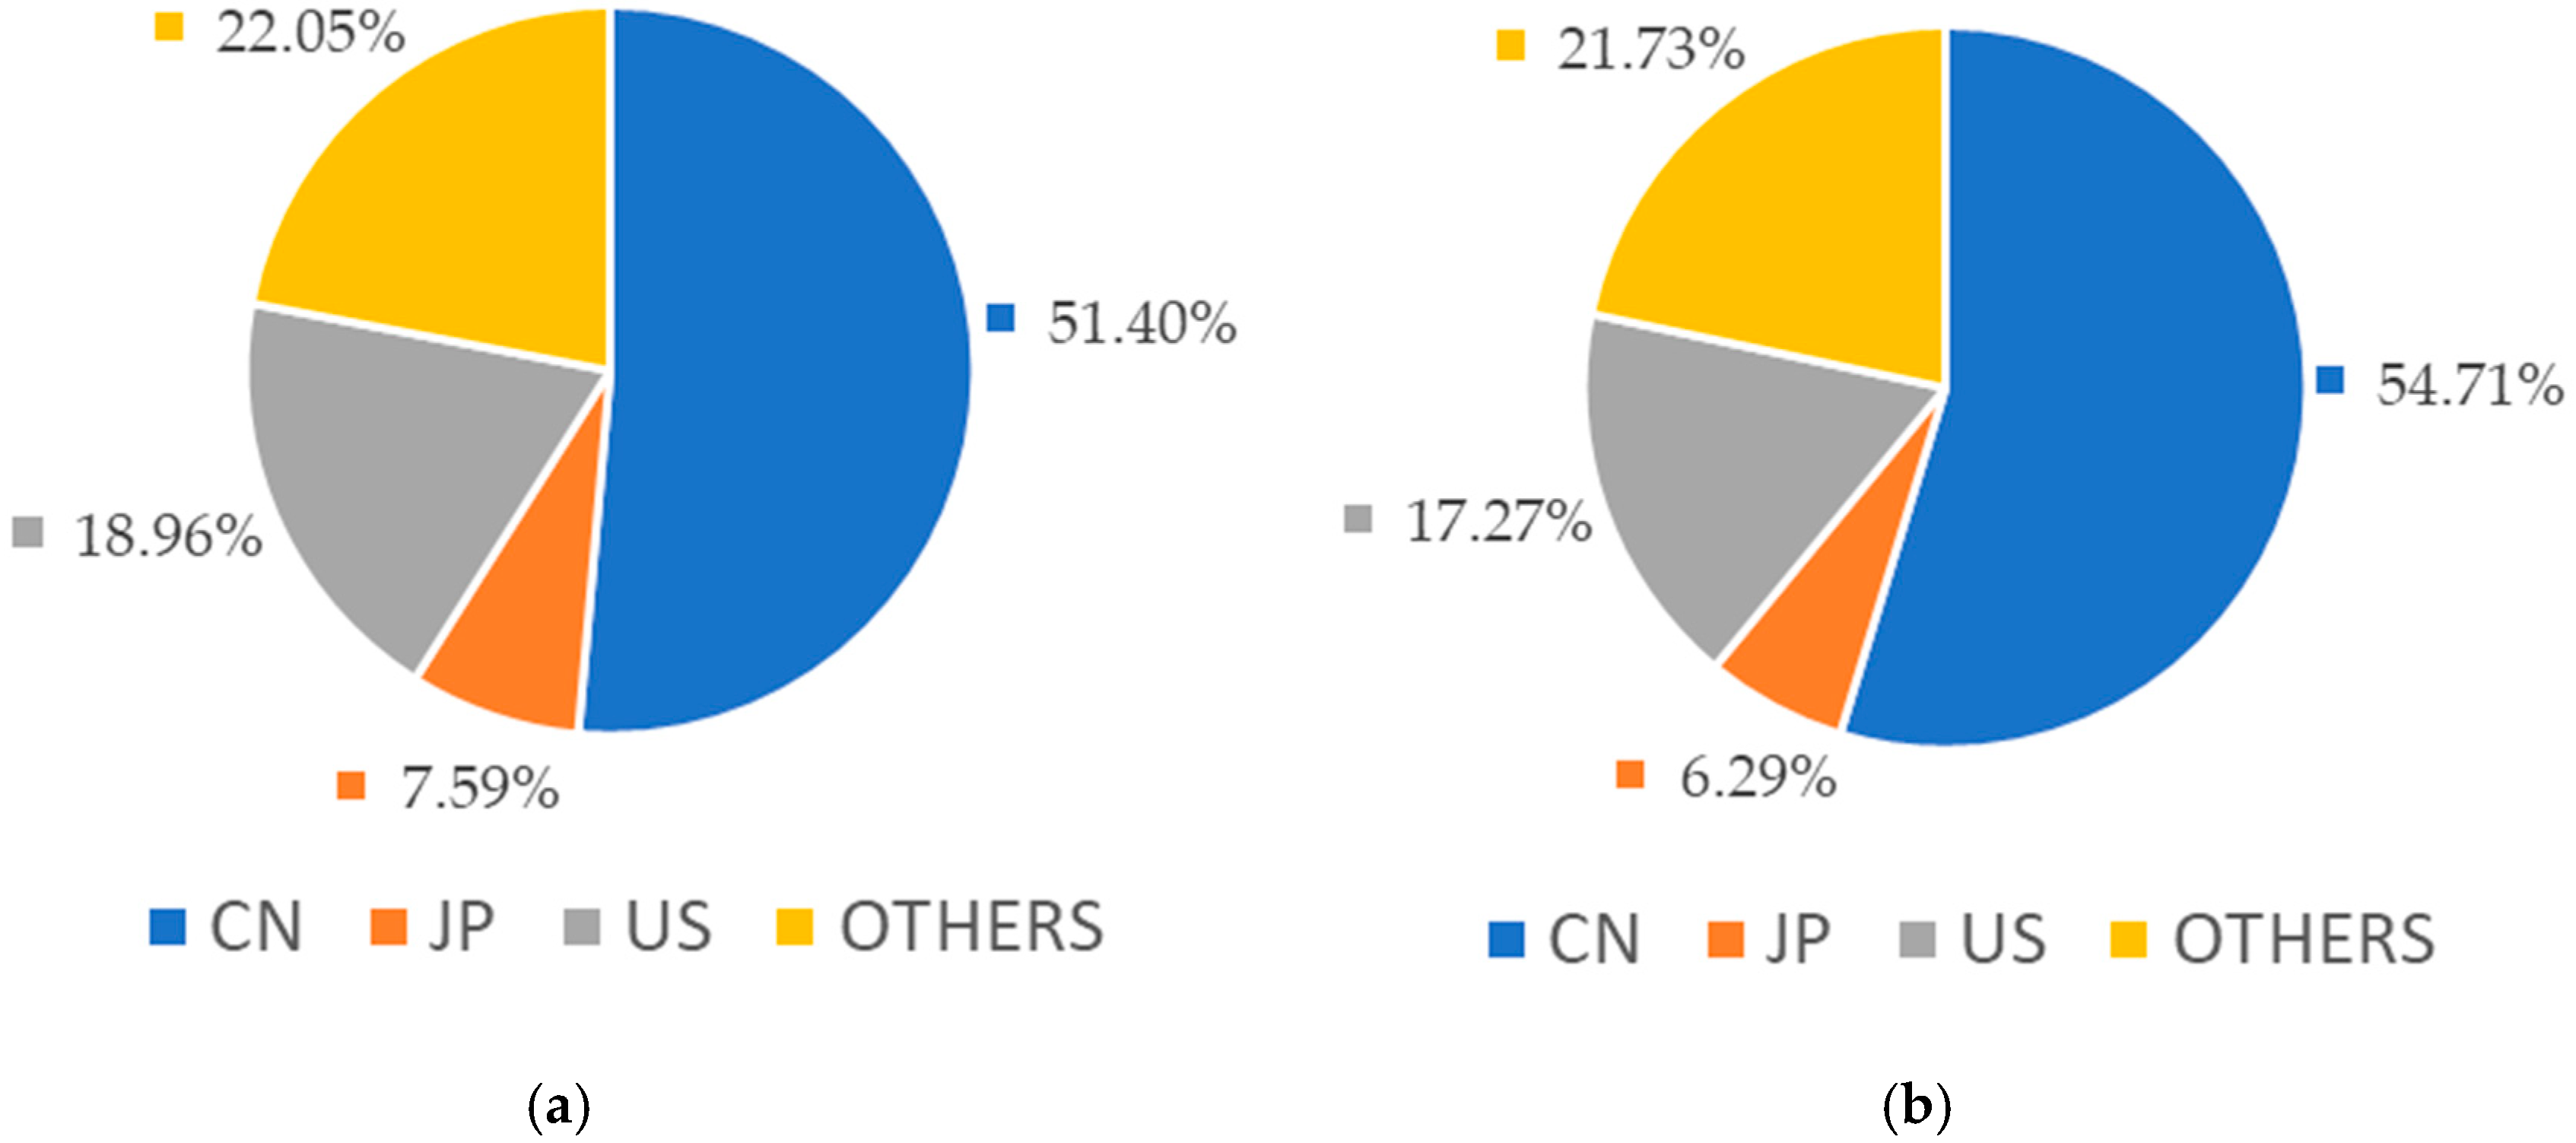
4.4. Comprehensive Comparison of the Chinese SWH and Solar PV Industries

According to the analysis above, this section provides a brief synthesis of the main results of the paper, connecting trajectories of key technologies, patent citation network, and type of collaboration to the different industrial development trajectories that were observed in China’s SWH and PV sectors (see Table 7). These outcomes are examined in a detailed discussion in Section 6.1 for the possible explanations.

5. Influence of Patent Degree Centrality on Sales Income

Schumpeter [63] stated that the activity of enterprise innovation can construct a new production function, which includes new input elements, setting new production material conditions and new constituent elements. On the basis of classical growth theory, Romer [64] and Lucas [65] proposed the theory of endogenous growth, which was helpful in exploring possible long-term business growth based on firms’ technological innovation. Based on the theories above, scholars have demonstrated that technological innovation has a positive impact on business performance [66]. There has been limited research on the relationship between patents and firms’ sales income. Patents can be considered to represent technological innovation, and therefore this study tries to test the correlation between the patent counts and sales income to analyze the influence of firms’ technological innovation on performance.
This paper uses degree centrality instead of patent counts to reduce endophytism. The outdegree represents the time of patents’ being cited, while the indegree measures their time of citation. The indegree—university and indegree—firm measures the time of citation for a university (or research institution) and a firm, respectively. Fixed-asset total, the age of a firm, and the industry type are also considered as control variables. For the dummy variable of Industry, SWH firms are assigned to be “0,” while solar PV firms are assigned to be “1.” In addition, the effects of cross terms between the indegree—university (or indegree—firm) and industry are tested to capture any possible heterogeneous between the SWH industry and PV industry. In summary, the proposed regression model is shown below.
Y sales i n c o m e = a 0 + a 1 X o u t deg r e e + a 2 X i n deg r e e u n i v e r s i t y + a 3 X i n deg r e e f i r m + a 4 X i n deg r e e u n i v e r s i t y P i n d u s t r y + a 5 X i n deg r e e f i r m P i n d u s t r y + β 1 P f i x e d a s s e t t o t a l + β 2 P a g e + β 3 P i n d u s t r y + ε
where, X, Y, and P represent the independent, dependent, and control variables, respectively. Based on the Chinese industrial enterprises database and the Osiris database, this study conducted a regression analysis using Stata (Table 8) and obtained a figure for the sales income gap between the solar water heater and solar PV industries, as shown in Figure 9.
Table 8 states that both the fixed-asset total and the age of a firm have a significant positive influence on its sales income in Models 1–3. Model 3 shows that the variable Indegree—firm has a significant positive impact on a firm’s sales income in both the SHW and PV industries, which means that the technological innovation obtained by citing patent technologies of other companies can help SWH/PV firms increase sales income. Obviously, the SHW/PV firms’ patent technologies have already been tested by the market. Therefore, technological innovations based on these technologies can develop new products that are more adaptable to the market, resulting in increased sales income. However, the figure −0.288 * in Model 3 demonstrates an obvious difference between the SWH and PV industries, shown in Figure 9, from which it can be observed that the slope of the line representing the solar water heater industry is higher than the line of solar PV industry. This means that Indegree—firm has a significantly larger positive impact on the solar water heater industry than on the PV industry.

6. Conclusions and Policy Implications

6.1. Discussion

6.1.1. Analysis of the Main Results

Renewable energy technology helps a society transition from fossil fuels to renewables, such as solar energy technology [67]. Our study shows that there are differences between the Chinese SWH and PV industries in terms of the trajectories of key technologies, the patent citation network, and the type of collaboration based on patent data and extensive expert interviews. The main results of our study are as follows.
First, Figure 10 and Figure 11 show that China held the majority of the solar energy patents in the world; moreover, the SWH industry has an obvious advantage over the PV industry in terms of the percentage of patents. However, comparing the SWH network (Figure 5) and the PV network (Figure 8), we can observe that the SHW network is much less dense than the PV network. In addition, the number of PV patents is much higher than the number of SWH patents. Combinrf with the previous analysis, this indicates that SWH technology has matured, while technological innovation activities in the PV field are still active and highly competitive.
Secondly, Lundval et al. [68] divided the corporate learning models into STI (science, technology, innovation) mode and DUI (doing, using, interacting) mode. Jensen et al. [69] proposed that companies that use both models synthetically are more likely to create new products and services than those relying on only one mode. Based on the analysis in previous sections and Table 7, this study finds that the Chinese PV industry pays more attention to creative technology innovation developed on its own and knowledge absorbed from others, which means the China PV industry has integrated its STI and DUI innovation modes for technology innovation, growing into an IP-intensive technology industry. The case analysis in Section 4.3 shows that the PV firms mainly use the firm‒firm mode to leapfrog in technology and carry out knowledge-innovation activities, which has been confirmed by empirical research in Section 5. Chinese SWH firms are already in the core position in the knowledge network, and the empirical analysis in Section 5 shows that technological innovations expand the SWH firms’ market share. In other words, the SWH industry follows the market-driven and applied-innovation modes, which means the Chinese SWH industry is following the DUI innovation mode.
Third, Section 4.3 shows that Chinese SWH mainly use the university‒industry innovation mode; meanwhile, the Chinese PV industry adopts both university‒industry and firm‒firm patterns. However, the empirical study results in Section 5 reveal that only the firm‒firm collaboration mode can create the market expansion in both sectors, especially in the Chinese SWH industry.

6.1.2. Driving Factors: Market Orientation, Innovation Modes, and Policy Characteristics

Urban et al. [7,49] point out that SWH consists of a set of technologies that are relatively low-cost and abundantly available in China, and in many rural areas in China, it has become an accepted method, although it is far less common in urban areas. Technical features have led to the domestic-oriented market pattern of the Chinese SWH industry. In addition, key policies that have supported the deployment of SWH include the policy of household appliances going to the countryside, which introduced a subsidy for SWH equal to 13% of the wholesale price [12]. Central government support has in recent years been limited, but policy support at the provincial and municipal levels includes low-cost loans, tax rebates, and research grants. Hence, SWH enterprises have rapidly developed in China and opened the domestic market, which is confirmed by the empirical research in Section 5. However, a large part of the SWH industry in China relies on selling mass products at low prices instead of developing differentiated products following the DUI mode. To spur more innovation, Chinese SWH companies could integrate STI and DUI innovation modes for technological innovation and then develop new products to ensure market advantages and long-term development. However, this will only work for leading firms, not smaller firms.
Chinese PV companies have invested much money and effort in technological innovation, but the industry is still export-oriented and operating at high-tech, large-scale, and industrial-scale levels [7] without complementary policy support for creating a domestic market. One of the main problems is the high cost of technology in the Chinese PV industry, resulting in a low domestic market share. However, the strong support of the central government has increased the level of technological innovation and overseas market shares in the Chinese PV industry. Meanwhile, the integration of DUI and STI innovation mode promotes sustainable technology innovation in the Chinese PV industry.

6.2. Policy Implications

Urban et al. [7,49] compared the Chinese domestic policies for solar PV and SWH and found there has been more central government support for the solar PV industry. To strengthen innovation in both the SWH and solar PV industries in China, our study recommends the following policies.
First, there is a need to strengthen central government support for technological innovation in both industries. The government must actively promote subsidy policies and financial support for SWH firms to further their technological innovation and ensure the long-term development of the industry. On the other hand, continuing policy support for PV companies is needed to develop new products suitable for the domestic market based on the characteristics of different areas in China while reducing installation and use costs.
Second, help is needed for SWH firms to expand to urban and overseas markets, and for PV firms to expand their domestic market. At the market level, the government should issue supporting policies to introduce SWH to urban areas according to local conditions. Further incentives are needed to reduce the costs of SWH so that poorer families can purchase them. In addition, the government could play a facilitative role to help SWH companies expand to overseas markets, such as by helping companies obtain overseas marketing rights, reducing export taxes, and creating opportunities for overseas collaborations.
Third, support policy is required to strengthen the innovation mechanism of university‒industry collaboration and make full use of the knowledge base and innovation capabilities in academia, particularly for SHW firms.

6.3. Conclusions and Future Research

6.3.1. Conclusions

In this mixed-methods study we combined qualitative and quantitative research approaches to compare the technology trajectories of the Chinese SWH and PV industries. First, we used a set of patent-based methods to analyze the two industries’ specific organizations in terms of the trajectories of key technologies, patent citation network (knowledge flow and spillover), and type of collaboration (university‒industry R&D collaboration and firm‒firm collaboration). Integrating these patent methods allows for a robust assessment of firms’ technology trajectories. We find that there is a certain correlation between the technological innovation and the performance of the enterprise. Then we conducted a quantitative analysis to verify such a correlation in Section 5, in order to increase the generalizability of the research result.
Using mixed methods, our systematic analysis generated interesting insights that provided some surprising contrasts to the conventional wisdom about Chinese SWH and PV industries’ technology trajectories and provided empirical validation for some prior analysis results (see Section 4). Our main conclusions are as follows.
First, combining the discussion in Section 6.1.1 and the previous analysis, it can be found that the Chinese SWH industry technology has matured with low competition, while the competition for technological innovations in the PV field is still highly active. This study suggests that, although China’s SWH industry started R&D earlier and has opened up a large domestic market, it has encountered a bottleneck to development due to the low density of new creative knowledge. In contrast, the PV industry has maintained long-term, stable development on active technological innovation activities.
Secondly, using a patent lens, this paper compares the technology trajectories between the Chinese SWH and PV industries in terms of trajectories of key technologies, patent citation network (knowledge flow and spillover), and type of collaboration (university‒industry R&D collaboration or firm‒firm collaboration). Based on the results in Table 7 and the discussion in Section 6.1.1, this research argues that China’s PV industry follows the integrated STI and DUI mode, thereby creating innovative approaches. On the other side, the Chinese SWH industry mostly follows the DUI mode, mainly relying on market-driven innovation approaches.
Third, through our empirical study in Section 5, it is also found that Indegree—firm, representing the frequency of the organization citing patents from other firms, has a significant positive impact on a firm’s sales income in both the SHW and PV industries, but it has a far stronger impact on the SWH industry. When combining the results with the analysis in Section 4.3, this study suggests that the patent commercialization from academic institutes is very low in both the Chinese SWH and PV industries, which give us guidance in our practical work.
Based on the above, this study concludes that grassroots innovation (DUI innovation mode) can create a short-term market development model relying on China’s traditional industry model, but cannot create a long-term leading innovation model on the international level. Only integrated STI and DUI innovation models can produce a result in such a leading position. In addition, the Chinese SWH and PV industries need to attach more importance to the university‒industry mode to take advantage of academic knowledge.
Since this paper has studied two core renewable energy industries, it is reasonable to propose that other renewable energy industries in China have similar knowledge flows. Therefore, the conclusions of our research can be extended to the entire renewable energy industry. Finally, our research confirms the importance of the solar energy industry in China, both for solar PV and SWH. They both play significant roles in advancing low-carbon energy transitions, contributing to climate change mitigation, and promoting sustainable development [70,71].

6.3.2. Limitations and Future Research

As is true of all studies, our research has limitations while also providing directions for future research. First, the 50 organizations used for the empirical analysis were mainly selected based on the number of patents. The selected samples were mainly in regions with a developed solar energy industry, such as Shandong and Beijing, which may not represent all regions. As spatial context may have an important influence on a firm’s technological innovation, further research is needed to compare our findings in different contexts.
Next, there are a few drawbacks to the use of patent data as an indicator of technological knowledge flow, involving the fact that not all inventions are patented and patentable and not all patents become innovations [72]. Many recently developed methods for solar PV and SWH are actually not registered through patents. Especially in the current big-data era, data-mining [73] and machine learning methods are more and more used for optimizing solar PV and solar water heaters in China and many other countries, which has prompted tremendous developments in recent decades. Liu et al. [67] designed a high-performance water-in-glass evacuated tube solar water heater by high-throughput screening based on machine learning. Wu et al. [68] proposed a novel intelligent fault diagnosis approach for photovoltaic (PV) array, based on an improved radial basis function (RBF) kernel extreme learning machine (ELM) optimized by a simulated annealing algorithm.
Therefore, the current data-mining method proposed in this paper may miss some state-of-the-art technologies that are not registered as patents yet. This study therefore draws the system boundaries here and acknowledges that machine learning methods and the latest non-patented solar technologies are beyond the scope of this paper. This could be an interesting step for the next stage of research.

Author Contributions

Conceptualization, Y.W., F.U. and Y.Z.; Data curation, L.C.; Formal analysis, Y.W.; Funding acquisition, Y.Z. and L.C.; Investigation, Y.W. and F.U.; Methodology, Y.W.; Project administration, Y.Z.; Resources, F.U. and Y.Z.; Supervision, Y.Z.; Validation, Y.Z.; Visualization, Y.W.; Writing—original draft, Y.W.; Writing—review & editing, F.U. and Y.Z.

Funding

This research is supported by the National Natural Science Foundation of China (91646102, L1724034, L16240452, L1524015, 71203117, 71704165), the MOE (Ministry of Education in China) Project of Humanities and Social Sciences (Engineering and Technology Talent Cultivation) (16JDGC011), the National Science and Technology Major Project “High-end Numerical Control and Fundamental Manufacturing Equipment” (2016ZX04005002), Beijing Natural Science Foundation Project (9182013), the Chinese Academy of Engineering’s China Knowledge Centre for Engineering Sciences an Technology Project (CKCEST-2018-1-13, CKCEST-2017-1-10, CKCEST-2015-4-2), the UK-China Industry Academia Partnership Programme (UK-CIAPP\260), as well as the Volvo-supported Green Economy and Sustainable Development Tsinghua University (20153000181) and Tsinghua Initiative Research Project (2016THZW). The research was also funded by the U.K. Economics and Social Research Council (ESRC) under the project “Low Carbon Innovation in China—Prospects, Politics and Practice” [ES/K006002/1].

Acknowledgments

We acknowledge Xiaolin Tong, Xiao Zhang, Zhiwang Chen, and Siyuan Wu for their support in data processing.

Conflicts of Interest

The authors declare no conflict of interest.

Appendix A

Table A1. Centrality indicators for the top 50 SWH organizations.
Firms1995–20082009–2016
BetweennessOut-Degree CentralityIndegree CentralityNet CitationsBetweennessOut-Degree CentralityIndegree CentralityNet Citations
NORITSU16.25202189.667523
PANASONIC67.125139422.512111
MITSUBISHI7.5429274.518−7
HITACHI37.875818−102014−3
TOTO13.667826001−1
RINNAI2.552354.5633
HAIER040431.383541
SMITH A. O.2.62531242.7817
NIPPON ELECTRIC03030101
CHOHU SEISAKUSHO02020303
DAIKIN KK11.528−60505
RHEEM14.33329−70404
MIDEA020257.167219−17
NIPPO-NDENSO23.58326−40404
SHARP01012440
CHINESE ACAD010197.38346−2
FUJI FILM002−20000
HIMIN004−4011011
JIANGSU QINENG0000009−9
JIANGSU YUPU0000002−2
CHONGQING GUANGXU0000004−4
GUANGXI GUANGTUO005−52124−2
JIANGSU SUNHOME00000101
JIANGSU SUNPOWER002−20303
BEIJING HUANNENG00000101
GUANGXI JIKUAN0000001−1
JIANGSU HUAYANG005−529.683532
SEKISUI CHEM002−20404
SHANDONG ECOO00000101
SHANDONG LINUO000065.55111−10
SHANDONG SANGLE001−114.5110
GREE00002.16723−1
GUANGDONG FIVE STAR0000002−2
SUZHOU KAILAI0000012−1
SUZHOU SUNSHINE00000101
SUZHOU TONGJI003−30303
TIANPU00000505
BINZHOU JIALI0000003−3
UNIV GUANGXI0000214−3
UNIV NORTH CHINA ELECTRIC POWER000010.515−4
UNIV SHANDONG0000001−1
UNIV SHANDONG SCI and TECHNOLOGY002−218.583312
UNIV SOUTHEAST0000114.4752
UNIV ZHEJIANG0000114.3534−1
WUHU BEST NEW0000001−1
YAZAKI00003.5330
ZHEJIANG JIADELE00000000
ZHENGJIANG XINMENGXI000066.96726−4
BEIJING SANGPU00000202
MICOE0000001−1

Appendix B

Table A2. Centrality indicators for the top 50 PV organizations.
Firms1995–20082009–2016
BetweennessOutdegree CentralityIndegree CentralityNet CitationsBetweennessOutdegree CentralityIndegree CentralityNet Citations
CANON24.6113086160292616.4201182301152
PANASONIC32.3462638841179774.3641188425763
SHARP43.1082027906112125.175937215722
MITSUBISHI25.194145874571347.055660392268
SIEMENS38.7971351316103535.950564220344
GENERAL ELECTRIC48.98390474116345.806805511294
HITACHI23.69787839148737.040465234231
UNIV CALIFORNIA9.3877914033885.797224110114
SAMSUNG33.5787431161−41826.211451471−20
DUPONTDOW9.6376671202−53529.214357491−134
SUNPOWER25.7845251244−71931.027499957−458
IBM31.0275161064−54854.466290887−597
MERCK PATENT GMBH6.271498466321.8341747599
APPLIED MATERIALS22.639486939−45316.984452152300
FIRST SOLAR29.9984191221−80232.013299866−567
HANERGY6.830417936−51949.65637530471
SCHOTT12.176411314973.12121264148
SHINETSU CHEM10.1283641891759.4821321284
GUARDIAN0.340262357−955.95821395118
LG23.6512391456−121725.175286813−527
COMMISSARIAT ENERGIE ATOMIQUE11.250194565−37124.014123355−232
BASF3.802173206−332.2881337558
BOSCH11.364107402−29531.395107263−156
SMA11.26175213−13820.427263293−30
STION1.47668588−5200.87860155−95
SOLARCITY11.55544452−40812.596191476−285
CHINESE ACAD0.65111358−34772.24270229−159
GTAT08505−4972.40017152−135
UNIV SOUTHEAST0.457449−4537.1771036142
WUXI SUNTECH04182−17816.1205155−4
QC SUZHOU0012−124.69722715
CHANGZHOU TRINA00221−22163.01446128−82
CHANGSHU FRIENDS005−5017−6
SHENZHEN IDEAL0070−700073−73
SHANGHAI CONVERTERGY0011−110051−51
STATE GRID CORP CHINA0075−75115.16290468−378
GCL0034−3410.3651446−32
SUNGROW0070−7038.84144189−145
CHENGDU JUHE0027−270.301259−57
SUZHOU TONGTAI0021−21 044−44
TAITONG TAIZHOU006−61.631838−30
CEEG0020−2013.8762644−18
UNIV HOHAI0038−3830.51044140−96
NIV NORTH CHINA ELECTRIC POWER0051−5130.21056126−70
JIANGSU YONGNENG0030−3015.9661340−27
JINKO0030−302.793763−56
WUXI TONGCHUN009−90.374322−19
YINGLI0054−5491.02149145−96
ZHEJIANG AIFEISHENG006−601266
ZHUHAI GREE006−65.0836102−96

References

  1. Awan, A.; Zubair, M.; Praveen, P.; Abokhalil, A. Solar energy resource analysis and evaluation of photovoltaic system performance in various regions of saudi arabia. Sustainability 2018, 10, 1129. [Google Scholar] [CrossRef]
  2. Fouad, M.M.; Shihata, L.A.; Morgan, E.I. An integrated review of factors influencing the performance of photovoltaic panels. Renew. Sustain. Energy Rev. 2017, 80, 1499–1511. [Google Scholar] [CrossRef]
  3. Hang, Q.; Jun, Z.; Xiao, Y.; Junkui, C. Prospect of concentrating solar power in China—The sustainable future. Renew. Sustain. Energy Rev. 2008, 12, 2505–2514. [Google Scholar] [CrossRef]
  4. Zhao, R.; Zhao, L.; Deng, S.; Zheng, N. Trends in patents for solar thermal utilization in China. Renew. Sustain. Energy Rev. 2015, 52, 852–862. [Google Scholar] [CrossRef]
  5. National Energy Administration. The Cost of Photovoltaic Generation in China Has Dropped by 90%. For 10 Years. Available online: http://www.nea.gov.cn/2018-04/13/c_137108373.htm (accessed on 13 April 2018). (In Chinese)
  6. Zhao, X.G.; Zeng, Y.P.; Zhao, D. Distributed solar photovoltaics in China: Policies and economic performance. Energy 2015, 88, 572–583. [Google Scholar] [CrossRef]
  7. Urban, F.; Geall, S.; Wang, Y. Solar pv and solar water heaters in China: Different pathways to low carbon energy. Renew. Sustain. Energy. Rev. 2016, 64, 531–542. [Google Scholar] [CrossRef]
  8. Zhou, Y.; Pan, M.; Urban, F. Comparing the international knowledge flow of China’s wind and solar photovoltaic (pv) industries: Patent analysis and implications for sustainable development. Sustainability 2018, 10, 1883. [Google Scholar] [CrossRef]
  9. Chen, L.; Xu, J.; Zhou, Y. Regulating the environmental behavior of manufacturing smes: Interfirm alliance as a facilitator. J. Clean. Prod. 2017, 165, 393–404. [Google Scholar] [CrossRef]
  10. Chen, L.; Zhou, Y.; Zhou, D.; Xue, L. Clustering enterprises into eco-industrial parks: Can interfirm alliances help small and medium-sized enterprises? J. Clean. Prod. 2017, 168, 1070–1079. [Google Scholar] [CrossRef]
  11. Kong, D.; Feng, Q.; Zhou, Y.; Xue, L. Local implementation for green-manufacturing technology diffusion policy in China: From the user firms’ perspectives. J. Clean. Prod. 2016, 129, 113–124. [Google Scholar] [CrossRef]
  12. Hu, R.Q.; Sun, P.J.; Wang, Z.Y. An overview of the development of solar water heater industry in China. Energy Policy 2012, 51, 46–51. [Google Scholar] [CrossRef]
  13. Crachilov, C.; Hancock, R.; Sharkey, G. The China Greentech Report 2009. Available online: http://www.china-greentech.com/sites/default/files/CGTR2009-FullReport.pdf (accessed on 1 April 2009).
  14. Cao, C.; Suttmeier, R.P.; Simon, D.F. China’s 15 year science and technology plan. Phys. Today 2006, 59, 38–43. [Google Scholar] [CrossRef]
  15. Weiss, W.; Spörk-Dür, M.; Mauthner, F. Solar Heat Worldwide: Global Market Development and Trends in 2014; Solar Heating & Cooling Programme; International Energy Agency, AEE—Institute for Sustainable Technologies: Gleisdorf, Austria, 2015. [Google Scholar]
  16. Weiss, W.; Spörk-Dür, M. Solar Heat Worldwide: Global Market Development and Trends in 2017/Detailed Market Figures 2016; Solar Heating & Cooling Programme; International Energy Agency, AEE—Institute for Sustainable Technologies: Gleisdorf, Austria, 2018. [Google Scholar]
  17. Wang, P. China’s first copper-aluminum composite solar collector production line put into operation. Sol. Energy 1987, 3, 5. [Google Scholar]
  18. Li, D.J. Review of all-glass evacuated solar collector tube and the development of solar water heaters in China. Sol. Energy 2013, 4, 27. [Google Scholar]
  19. Yin, Z.U.T.; Beijing, China; Li, D.; Tsinghua University, Beijing, China. Personal communication, 2018.
  20. Faria, L.G.D.; Andersen, M.M. Sectoral patterns versus firm-level heterogeneity—The dynamics of eco-innovation strategies in the automotive sector. Technol. Forecast. Soc. Chang. 2017, 117, 266–281. [Google Scholar] [CrossRef]
  21. Fan, W.; Zhu, F.S.; Moen, P. Micro-level experiences of macro-level change: A cohort perspective on China’s shift away from state-sector employment. Adv. Life Course Res. 2018, 35, 77–86. [Google Scholar] [CrossRef]
  22. Liu, J.S.; Kuan, C.H.; Cha, S.C.; Chuang, W.L.; Gau, G.J.; Jeng, J.Y. Photovoltaic technology development: A perspective from patent growth analysis. Sol. Energy Mater. Sol. Cells 2011, 95, 3130–3136. [Google Scholar] [CrossRef]
  23. IEA Photovoltaic Power Systems Programme. A Snapshot of Global PV. Available online: http://www.iea-pvps.org/index.php?id=266 (accessed on 3 May 2018).
  24. SolarPowerEurope. Global Market Outlook 2018–2022. Available online: http://www.solarpowereurope.org/global-market-outlook-2018-2022/ (accessed on 27 June 2018).
  25. Issaadi, W.; Issaadi, S.; Khireddine, A. Comparative study of photovoltaic system optimization techniques: Contribution to the improvement and development of new approaches. Renew. Sustain. Energy Rev. 2018, 82, 2112–2127. [Google Scholar] [CrossRef]
  26. D’Agostino, A.L.; Sovacool, B.K.; Bambawale, M.J. And then what happened? A retrospective appraisal of China’s renewable energy development project (redp). Renew. Sustain. Energy Rev. 2011, 36, 3154–3165. [Google Scholar] [CrossRef]
  27. Guang, X. A Brief Analysis of China’s PV Installed Data in 2017. Available online: http://guangfu.Bjx.Com.Cn/news/20180208/879829.Shtml (accessed on 8 February 2018).
  28. Negro, S.O.; Alkemade, F.; Hekkert, M.P. Why does renewable energy diffuse so slowly? A review of innovation system problems. Renew. Sustain. Energy Rev. 2012, 16, 3836–3846. [Google Scholar] [CrossRef]
  29. Zhang, J.; Da, L.; Yang, P.; Xu, Z.; Zhou, S. Development trend analysis of photovoltaic power generation. Renew. Energy Resour. 2014, 32, 127–132. [Google Scholar]
  30. Green, M.A. Third generation photovoltaics: Solar cells for 2020 and beyond. Phys. E Low-Dimens. Syst. Nanostructures 2002, 14, 65–70. [Google Scholar] [CrossRef]
  31. Jager-Waldau, A. Status of thin film solar cells in research, production and the market. Sol. Energy 2004, 77, 667–678. [Google Scholar] [CrossRef]
  32. Hoffmann, W. Pv solar electricity industry: Market growth and perspective. Sol. Energy Mater. Sol. Cells 2006, 90, 3285–3311. [Google Scholar] [CrossRef]
  33. Zhang, F.; Gallagher, K.S. Innovation and technology transfer through global value chains: Evidence from China’s pv industry. Energy Policy 2016, 94, 191–203. [Google Scholar] [CrossRef]
  34. Garcia-Almeida, D.J.; Klassen, N. The influence of knowledge-based factors on taxi competitiveness at island destinations: An analysis on tips. Tour. Manag. 2017, 59, 110–122. [Google Scholar] [CrossRef]
  35. Pavitt, K.; Pavitt, P.; Granstrand, O. Multi-technology corporations: Why they have distributed rather than distinctive core competencies. Calif. Manag. Rev. 1997, 39, 8–25. [Google Scholar]
  36. Burhan, M.; Singh, A.K.; Jain, S.K. Patents as proxy for measuring innovations: A case of changing patent filing behavior in indian public funded research organizations. Technol. Forecast. Soc. Chang. 2017, 123, 181–190. [Google Scholar] [CrossRef]
  37. Griliches, Z. Patent statistics as economic indicators: A survey. J. Econ. Lit. 1990, 28, 1661–1707. [Google Scholar]
  38. Dosi, G. Technological paradigms and technological trajectories: A suggested interpretation of the determinants and directions of technical change. Res. Policy 1982, 11, 147–162. [Google Scholar] [CrossRef]
  39. Castellacci, F. Technological paradigms, regimes and trajectories: Manufacturing and service industries in a new taxonomy of sectoral patterns of innovation. Res. Policy 2008, 37, 978–994. [Google Scholar] [CrossRef] [Green Version]
  40. Martinelli, A. An emerging paradigm or just another trajectory? Understanding the nature of technological changes using engineering heuristics in the telecommunications switching industry. Res. Policy 2012, 41, 414–429. [Google Scholar] [CrossRef] [Green Version]
  41. Xu, G.; Wu, Y.; Minshall, T.; Zhou, Y. Exploring innovation ecosystems across science, technology, and business: A case of 3d printing in China. Technol. Forecast. Soc. Chang. 2018, 136, 208–221. [Google Scholar] [CrossRef]
  42. Liu, P.; Zhou, Y.; Zhou, D.K.; Xue, L. Energy performance contract models for the diffusion of green-manufacturing technologies in China: A stakeholder analysis from smes’ perspective. Energy Policy 2017, 106, 59–67. [Google Scholar] [CrossRef]
  43. Zhou, Y.; Zhang, H.; Ding, M. How public demonstration projects affect the emergence of new industries: An empirical study of electric vehicles in China. Innov.-Manag. Policy Pract. 2015, 17, 159–181. [Google Scholar] [CrossRef]
  44. Zhou, Y.; Xu, G.; Minshall, T.; Liu, P. How do public demonstration projects promote green-manufacturing technologies? A case study from China. Sustain. Dev. 2015, 23, 217–231. [Google Scholar] [CrossRef]
  45. Zhou, Y.; Li, X.; Lema, R.; Urban, F. Comparing the knowledge bases of wind turbine firms in asia and europe: Patent trajectories, networks, and globalisation. Sci. Public Policy 2016, 43, 476–491. [Google Scholar] [CrossRef]
  46. Nordensvard, J.; Zhou, Y.; Zhang, X. Innovation core, innovation semi-periphery and technology transfer: The case of wind energy patents. Energy Policy 2018, 120, 213–227. [Google Scholar] [CrossRef]
  47. Scandura, A. University-industry collaboration and firms’ R&D effort. Res. Policy 2016, 45, 1907–1922. [Google Scholar] [CrossRef]
  48. McCarthy, K.J.; Aalbers, H.L. Technological acquisitions: The impact of geography on post-acquisition innovative performance. Res. Policy 2016, 45, 1818–1832. [Google Scholar] [CrossRef]
  49. Urban, F.; Wang, Y.; Geall, S. Prospects, politics, and practices of solar energy innovation in China. J. Environ. Dev. 2018, 27, 74–98. [Google Scholar] [CrossRef]
  50. Pan, M.; Zhou, Y.; Zhou, D.K. Comparing the innovation strategies of Chinese and European wind turbine firms through a patent lens. Environ. Innov. Soc. Transit. 2017. [Google Scholar] [CrossRef]
  51. Wang, B.; Liu, Y.; Zhou, Y.; Wen, Z. Emerging nanogenerator technology in China: A review and forecast using integrating bibliometrics, patent analysis and technology roadmapping methods. Nano Energy 2018, 46, 322–330. [Google Scholar] [CrossRef]
  52. Li, X.; Zhou, Y.; Xue, L.; Huang, L. Roadmapping for industrial emergence and innovation gaps to catch-up: A patent-based analysis of OLED industry in China. Int. J. Technol. Manag. 2016, 72, 105–143. [Google Scholar] [CrossRef]
  53. Braun, T. Keeping the Gates of Science Journals. Handbook of Quantitative Science and Technology Research. The Use of Publication and Patent Statistics in Studies of s&t Systems; Kluwer Academic Publishers: Dordrecht, Nederland, 2005; Volume 63, pp. 95–114. [Google Scholar]
  54. Zhou, Y.; Pan, M.J.; Zhou, D.K.; Xue, L. Stakeholder risk and trust perceptions in the diffusion of green manufacturing technologies: Evidence from China. J. Environ. Dev. 2018, 27, 46–73. [Google Scholar] [CrossRef]
  55. Li, X.; Zhou, Y.; Xue, L.; Huang, L. Integrating bibliometrics and roadmapping methods: A case of dye-sensitized solar cell technology-based industry in China. Technol. Forecast. Soc. Chang. 2015, 97, 205–222. [Google Scholar] [CrossRef]
  56. Zhang, T. Research on technical innovation ability of evacuated tube based on patent in China. Enterp. Technol. Dev. 2015, 34, 4–7. [Google Scholar]
  57. Chen, C.M. Patents, citations & innovations: A window on the knowledge economy. J. Assoc. Inf. Sci. Technol. 2003, 54, 802–803. [Google Scholar] [CrossRef]
  58. Sharma, P.; Tripathi, R.C. Patent citation: A technique for measuring the knowledge flow of information and innovation. World Pat. Inf. 2017, 51, 31–42. [Google Scholar] [CrossRef]
  59. Duguet, E.; MacGarvie, M. How well do patent citations measure flows of technology? Evidence from French innovation surveys. Econ. Innov. New Technol. 2005, 14, 375–393. [Google Scholar] [CrossRef]
  60. D’Este, P.; Fontana, R. What drives the emergence of entrepreneurial academics? A study on collaborative research partnerships in the UK. Res. Eval. 2007, 16, 257–270. [Google Scholar] [CrossRef]
  61. Yin, R.K. Case Study Research: Design and Methods; Sage: Thousand Oaks, CA, USA, 2003; Volume 5, p. 11. [Google Scholar]
  62. Alexiev, A.S.; Volberda, H.W.; Van den Bosch, F.A.J. Interorganizational collaboration and firm innovativeness: Unpacking the role of the organizational environment. J. Bus. Res. 2016, 69, 974–984. [Google Scholar] [CrossRef]
  63. Schumpeter, J.A. The Theory of Economic Development; Harvard University Press: Cambridge, MA, USA, 1912. [Google Scholar]
  64. Romer, P.M. Increasing returns and long-run growth. J. Political Econ. 1986, 94, 1002–1037. [Google Scholar] [CrossRef]
  65. Lucas, R.E. On the mechanics of economic development. J. Monet. Econ. 1988, 22, 3–42. [Google Scholar] [CrossRef]
  66. Sharma, B. R&D strategy and Australian manufacturing industry: An empirical investigation of emphasis and effectivness. Technovation 2003, 23, 929–937. [Google Scholar] [CrossRef]
  67. Walters, J.; Kaminsky, J.; Gottschamer, L. A systems analysis of factors influencing household solar PV adoption in Santiago, Chile. Sustainability 2018, 10, 1257. [Google Scholar] [CrossRef]
  68. Lorenz, E.; Lundvall, B.A. How Europe’s economies learn. Ind. Corp. Chang. 2007, 16, 1175–1210. [Google Scholar]
  69. Jensen, M.B.; Johnson, B.; Lorenz, E.; Lundvall, B.A.; Lundvall, B.A. Forms of Knowledge and Modes of Innovation; Anthem Press: London, UK, 2016; pp. 155–182. [Google Scholar]
  70. Liu, Z.; Li, H.; Liu, K.; Yu, H.; Cheng, K. Design of high-performance water-in-glass evacuated tube solar water heaters by a high-throughput screening based on machine learning: A combined modeling and experimental study. Sol. Energy 2017, 142, 61–67. [Google Scholar] [CrossRef]
  71. Wu, Y.; Chen, Z.; Wu, L.; Lin, P.; Cheng, S.; Lu, P. An intelligent fault diagnosis approach for PV array based on SA-RBF kernel extreme learning machine. Energy Procedia 2017, 105, 1070–1076. [Google Scholar] [CrossRef]
  72. Choe, H.; Lee, D.H.; Seo, I.W.; Kim, H.D. Patent citation network analysis for the domain of organic photovoltaic cells: Country, institution, and technology field. Renew. Sustain. Energy Rev. 2013, 26, 492–505. [Google Scholar] [CrossRef]
  73. Kong, D.; Zhou, Y.; Liu, Y.; Xue, L. Using the data mining method to assess the innovation gap: A case of industrial robotics in a catching-up country. Technol. Forecast. Soc. Chang. 2017, 119, 80–97. [Google Scholar] [CrossRef]
Figure 1. (a) Patent counts of solar water heater technologies in a sample of leading firms (the Chinese Academy of Sciences is a research institute; the others are firms); (b) patent counts of PV technologies in a sample of leading firms.
Sustainability 10 04166 g001
Figure 2. (a) SWH evacuated tube technologies patent counts of a sample of leading organizations; (b) PV cell technology patent counts of a sample of leading organizations.
Sustainability 10 04166 g002
Figure 3. Solar water heater firm network for 1995–2008. Note: In Figure 3, Figure 4, Figure 5, Figure 6, Figure 7 and Figure 8, nodes in the networks represent key organizations, while links are the cumulative citations in between, meaning the knowledge flows between organizations in terms of citations (excluding self-citations). Moreover, the number of patents is used to represent the node size (i.e., the larger the node, the larger the number of patents), and the frequency of citations is adopted to illustrate the thickness of lines (links) (i.e., the thicker the link, the greater the frequency of patent citations). The red nodes represent Chinese firms or colleges, while the blue ones represent overseas entities.
Sustainability 10 04166 g003
Figure 4. Solar water heater firm network for 2009–2016.
Sustainability 10 04166 g004
Figure 5. Solar water heater firm network for 1995–2016.
Sustainability 10 04166 g005
Figure 6. PV firms’ network for 1995–2008.
Sustainability 10 04166 g006
Figure 7. PV firms’ network for 2009–2016.
Sustainability 10 04166 g007
Figure 8. PV firms’ network for 2009–2016.
Sustainability 10 04166 g008
Figure 9. Relationship between X (Indegree—firm) and Y (sales income) in SWH/PV industries.
Sustainability 10 04166 g009
Figure 10. (a) SWH patent pie chart in 1967–2016; (b) SWH patent pie chart in 2009–2016.
Sustainability 10 04166 g010
Figure 11. (a) PV patent pie chart in 1982–2016; (b) PV patent pie chart in 2009–2016.
Sustainability 10 04166 g011
Table 1. Analytical framework of technology trajectory dimensions based on patent methods.
Technology Trajectory DimensionsPatent Methods (Indicators)Existing Literature
Trajectories of key technologiesPatent counts; Patent data-miningZhou et al. (2015) [45]; Liu (2011) [22]
Patent citation network (knowledge flow and spillover)Patent counts; Patent citation frequencyZhou et al. (2016) [45]
Nordensvard et al. (2018) [46];
Zhou et al. (2018) [8]
University‒industry or firm‒firm relationsExperts’ interpretations;
Patent network
Scandura (2016) [47]; McCarthy and Aalbers (2016) [48]; Urban et al. (2016) [7];
Urban et al. (2018) [49]
Table 2. Key technologies of PV/SWH industries.
IndustryCategoryKeywords
Solar PVPV cell technologyStorage battery; silicon cell; silicon battery; solar cells; poly cell; solar cell; photovoltaic battery; thin film cell; thin film battery; thin film solar cell amorphous silicon; thin film silicon; single crystalline silicon; polycrystalline silicon; compound solar cell; compound thin film solar cell; wafer; screen print; silk screen printing; silkscreen; stencil printing; cementation; sintering; phosphorous diffusion; plasma enhanced vapor deposition; diode; diodes; graphene; ingot; ingot casting; lamination; EL test
Solar SWHEvacuated tube technologyVacuum; vacuum tube; evacuated tube; vacuum heat collection tube; evacuated collector tube; evacuated; vacuum tube coating; tube coat
Table 3. Changes in knowledge network: descriptive comparative data (SWH).
IndicatorsTime
1995–2008 Network2009–2016 NetworkFull-Time Network
Density (containing self-citations)0.02560.05290.1016
Density (excluding self-citations)0.02480.04720.0816
Average distance2.0212.6983.434
Distance-based cohesion(compactness)0.0510.1030.198
Distance-weighted fragmentation (breadth)0.9490.8970.802
Hybrid reciprocity (percentage of reciprocated total links)0.07690.06730.3697
Outdegree centrality4.95%6.64%4.86%
Indegree centrality4.41%11.60%3.93%
Note: In Table 3 and Table 5, density means the ratio of actual links to all possible links in the network. Average distance means the average shortest paths between key nodes. Distance-based cohesion indicates the proportion of nodes that reach to each other, the larger values indicate greater cohesiveness. Distance-weighted fragmentation measures the proportion of nodes that cannot reach each other. Degree centrality is further categorized into in-degree and out-degree based on the direction of links. Citations indicate the number of times a patent is cited by its patent-affiliated organization and others, and this study uses the citations, excluding self-citations, to focus on the knowledge flow between different organizations.
Table 4. Centrality indicators for SWH samples.
Firms1995–20082009–2016
Between-nessOut-Degree CentralityIndegree CentralityNet CitationsBetween-nessOut-Degree CentralityIndegree CentralityNet Citations
PANASONIC67.125139422.512111
MIDEA020257.167219−17
CHINESE ACADEMY OF SCIENCES010197.38346−2
HIMIN004−4011011
SHANDONG ECOO00000101
SHANDONG LINUO000065.55111−10
BEIJING SANGPU00000202
MICOE0000001‒1
Note: In Table 4 and Table 6, degree centrality is further categorized into in-degree and out-degree based on the direction of links. Net citation count equals out-degree centrality minus in-degree, which differentiates the net producers from the net consumers.
Table 5. Changes in knowledge network: Descriptive comparative data (PV).
IndicatorsTime
1995–2008 Network2009–2016 NetworkFull-Time Network
Density (containing self-citations)0.40000.50760.5556
Density (excluding self-citations)0.39670.49920.5482
Average distance1.3471.5281.472
Distance-based cohesion (compactness)0.4980.7100.735
Distance-weighted fragmentation (breadth)0.5020.2900.265
Hybrid reciprocity (percentage of reciprocated total links)0.45070.46120.4710
Out-degree centrality23.712%17.723%23.344%
In-degree centrality9.390%13.466%10.574%
Table 6. Centrality indicators for PV samples.
Firms1995–20082009–2016
Between-nessOutdegree CentralityIndegree CentralityNet CitationsBetween-nessOutdegree CentralityIndegree CentralityNet Citations
CANON24.6113086160292616.4201182301152
PANASONIC32.3462638841179774.3641188425763
APPLIED MATERIALS22.639486939−45316.984452152300
FIRST SOLAR29.9984191221−80232.013299866−567
HANERGY6.830417936−51949.65637530471
QC SUZHOU0012−124.69722715
GCL0034−3410.3651446−32
YINGLI0054−5491.02149145−96
Table 7. Comprehensive comparison of the Chinese SWH and solar PV sectors.
DimensionsIndicatorsChinese SWH IndustryChinese PV Industry
1995–20082009–20161995–20082009–2016
Trajectories of key technologies1. Technological lifecycleslow-development stage, but having key technology by indigenous innovationfast-development stagelow-development stagefast-development stage
2. Type of organization that originally developed key technologiesacademia institutes (universities and science research institutes)both academia institutes and firms
3. Start time to develop the key technologiesin 1980saround 2008
Patent citation network intense1. Network positionperipherycoreperipheryclose to the center
2. Network roleknowledge consumersknowledge spilloversknowledge consumersknowledge spillovers
3. Competition levellowordinarylowintense
4. Driving forcemarkettechnology innovation
5. Future competition rolesknowledge spilloverstechnology innovators and global leaders
Type of collaboration1. University‒industry R&D collaborationmainly university‒industry modeboth university‒industry R&D and firm‒firm modes
2. Firm‒firm collaboration
Table 8. Results of fixed-effects regression.
VariableSales Income (ln)
ControlsModel 1Model 2Model 3
Fixed-asset total (ln)0.736 *** (0.03)0.731 *** (0.034)0.720 *** (0.035)
Age0.015 * (0.01)0.019 ** (0.01)0.020 ** (0.01)
Industry (dummy)0.554 *** (0.203)0.39 * (0.231)−0.222 (0.248)
Predictors
Outdegree −0.006 (0.006)−0.005 (0.01)
Indegree 0.001 (0.003)
Indegree-university 0.434 (0.605)
Indegree-firm 0.300 * (0.163)
Indegree—university*industry −0.416 (0.616)
Indegree—firm*industry −0.288 * (0.16)
R20.7940.800.81
N159159159
Note: In Table 8, coefficients marked ***, **, and * are statistically significant at the 1, 5 and 10 percent levels respectively.

