Do Tourists’ Preferences Match the Host Community’s Initiatives? A Study of Sustainable Tourism in One of Africa’s Oldest Conservation Areas


 ,
, 
Abstract
1. Introduction
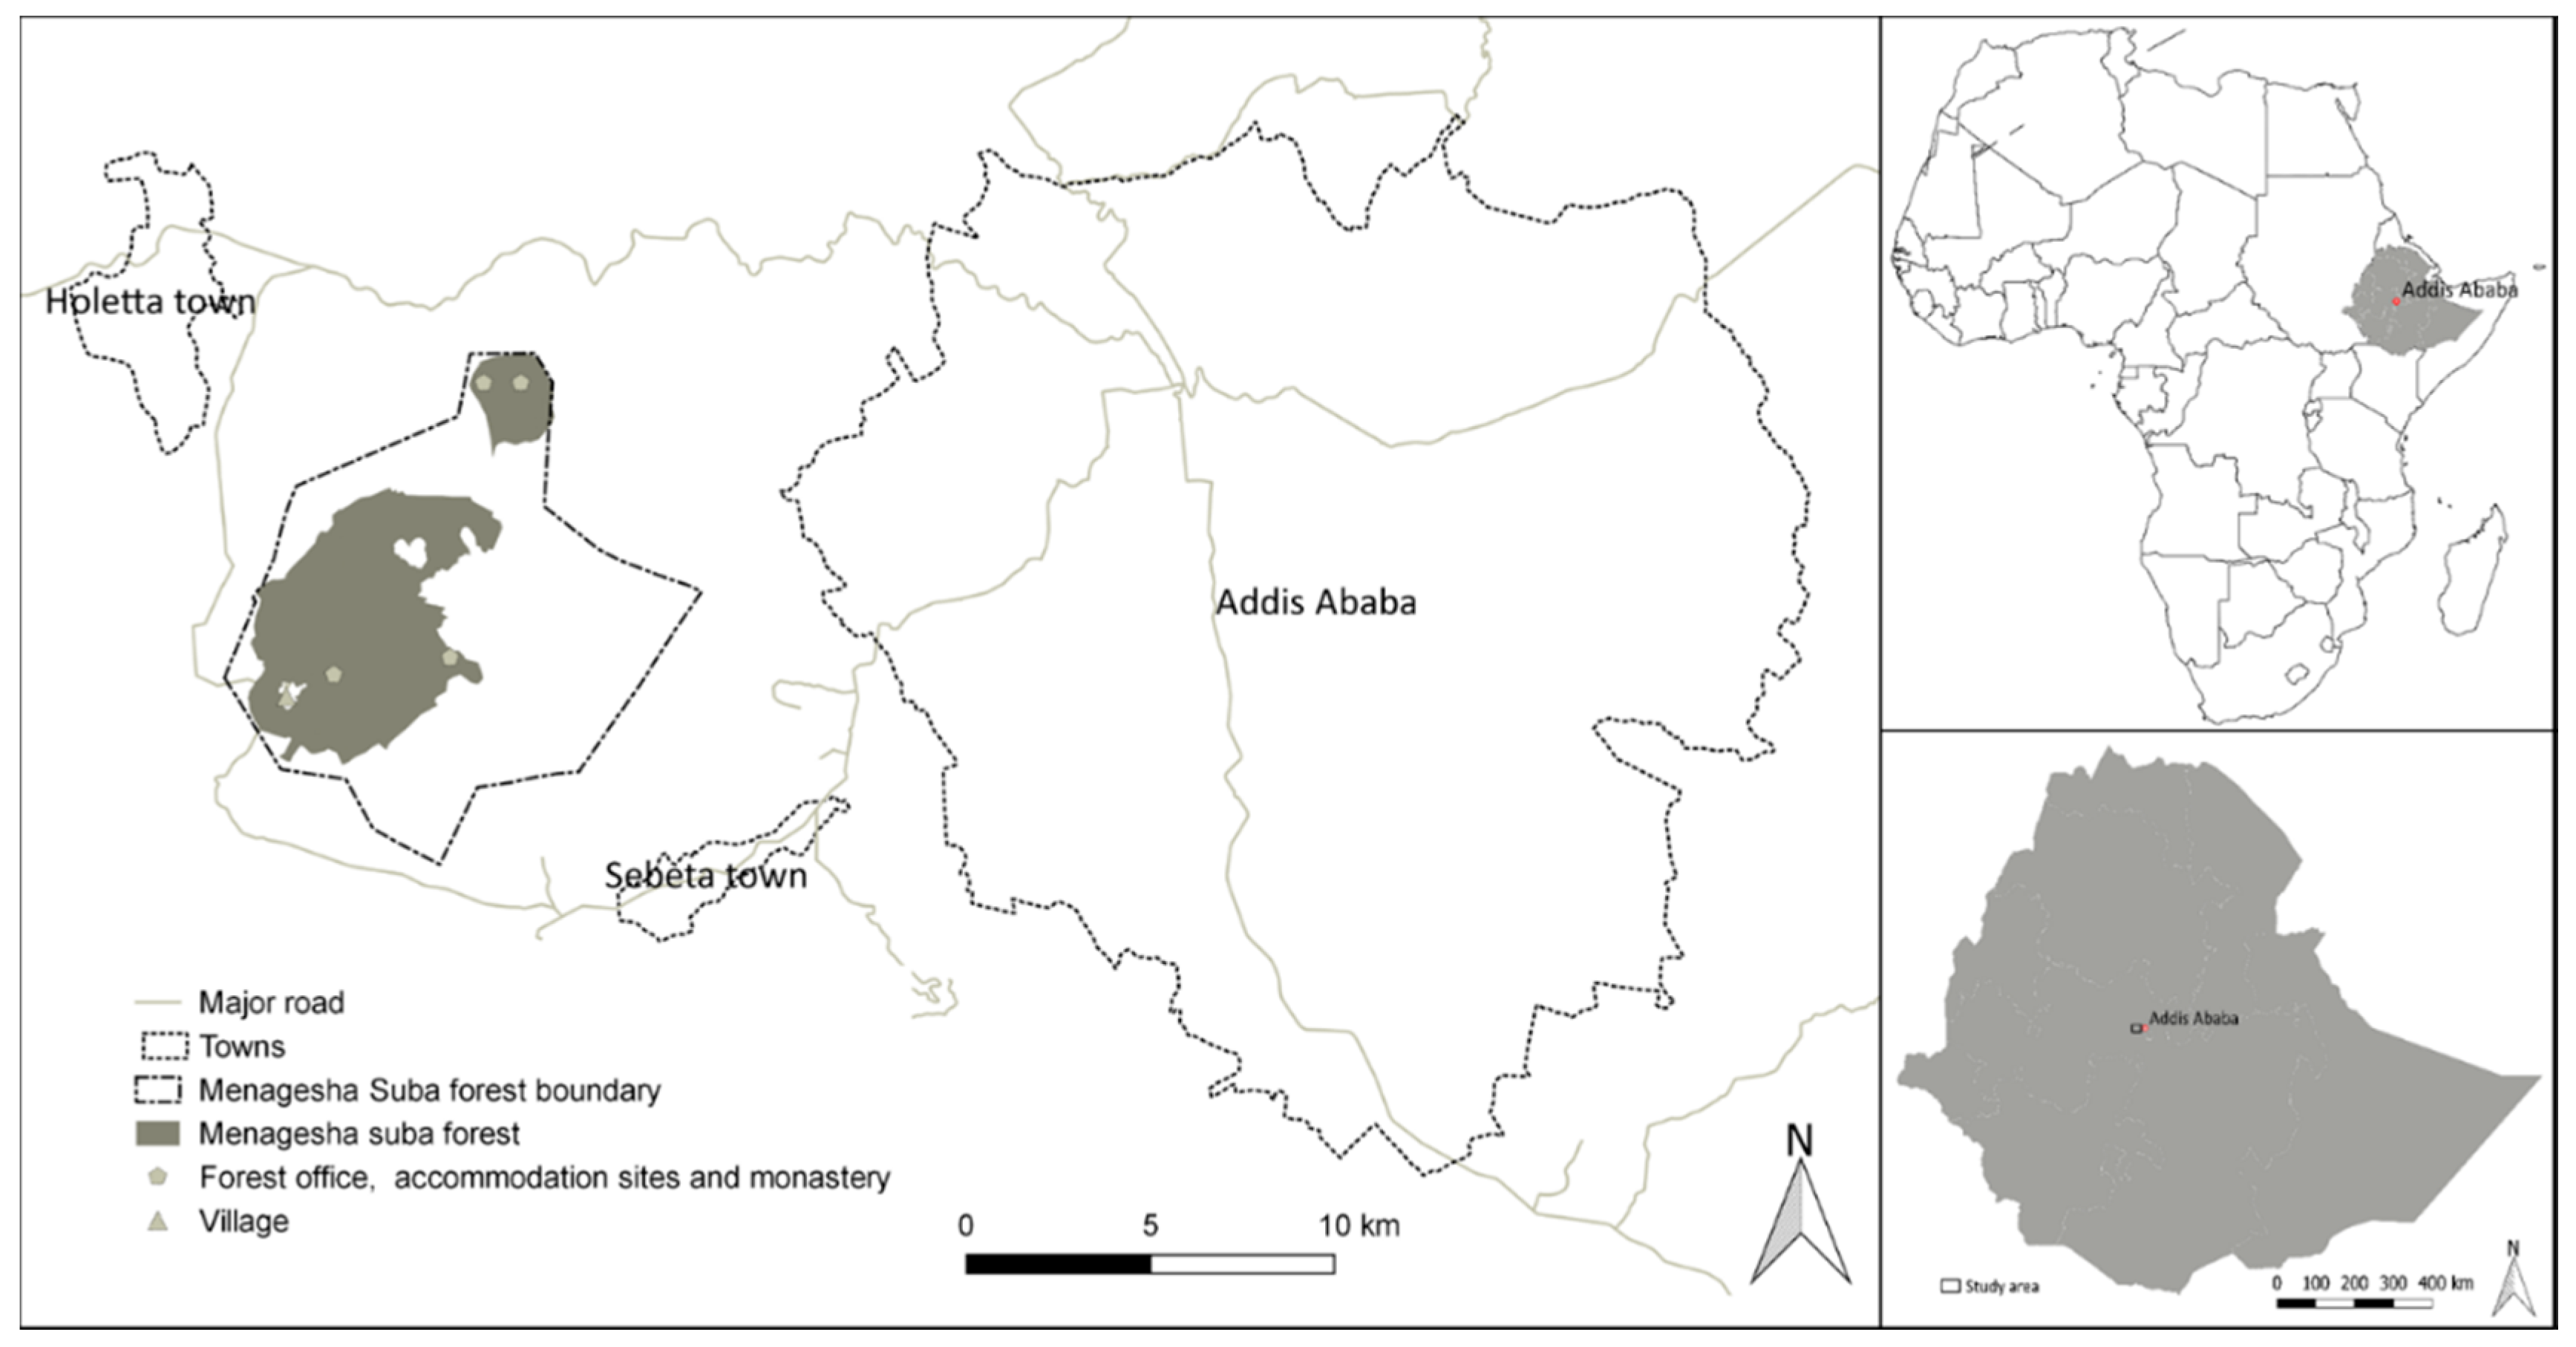
2. The Study Area
3. Methods
3.1. Statistical Choice Model
3.2. Design of the Choice Experiments (CE)
3.3. Data Collection
3.4. Empirical Analysis
4. Results
4.1. Tourist Socioeconomic Characteristics
4.2. Results of the Choice Experiment
4.2.1. Mixed Logit (MXL) Model
4.2.2. Latent Class Model (LCM)
Latent Class Model for Community Participation in Tourism
Latent Class Model for Infrastructure Improvement in the Forest
5. Discussion
6. Conclusions
Author Contributions
Funding
Acknowledgments
Conflicts of Interest
References
- Borges, M.A.; Carbone, G.; Bushell, R.; Jaeger, T. Sustainable Tourism and Natural World Heritage: Priorities for Action; IUCN: Gland, Switzerland, 2011; ISBN 978-2-8317-1339-7. [Google Scholar]
- Fennell, D. A Content Analysis of Ecotourism Definitions. Curr. Issues Tour. 2001, 4, 403–421. [Google Scholar] [CrossRef]
- World Tourism Organization (WTO). World Ecotourism Summit Final Report; WTO: Madrid, Spain, 2002. [Google Scholar]
- Twining-Ward, L. Opinion Piece: Towards sustainable tourism development: Observations from a distance. Tour. Manag. 1999, 20, 187–188. [Google Scholar]
- Parra, C.; Moulaert, F. La nature de la durabilité sociale: Vers une lecture socioculturelle du développement territorial durable. Développement Durable et Territoires 2011, 2. [Google Scholar] [CrossRef]
- Hardy, A.; Pearson, L.J. Determining Sustainable Tourism in Regions. Sustainability 2016, 8, 660. [Google Scholar] [CrossRef]
- Donaldson, T.; Preston, L.E. The stakeholder theory of the corporation: Concepts, evidence, and implications. Acad. Manag. Rev. 1995, 20, 65–91. [Google Scholar] [CrossRef]
- Clarkson, M.B. A stakeholder framework of analyzing and evaluating corporate social performance. Acad. Manag. Rev. 1995, 20, 92–117. [Google Scholar] [CrossRef]
- Grimble, R.; Wellard, K. Stakeholder methodologies in natural resource management: A review of concepts, contexts, experiences and opportunities. Agric. Syst. 1997, 55, 173–193. [Google Scholar] [CrossRef]
- Byrd, E.T.; Bosley, H.E.; Dronberger, M.G. Comparisons of stakeholder perceptions of tourism impacts in rural eastern North Carolina. Tour. Manag. 2009, 30, 693–703. [Google Scholar] [CrossRef]
- Stylidis, D.; Biran, A.; Sit, J.; Szivas, E.M. Residents’ support for tourism development: The role of residents’ place image and perceived tourism impacts. Tour. Manag. 2014, 45, 260–274. [Google Scholar] [CrossRef]
- Weaver, D.B.; Lawton, L.J. Visitor attitudes toward tourism development and product integration in an Australian urban-rural fringe. J. Travel Res. 2004, 42, 286–296. [Google Scholar] [CrossRef]
- Nicholas, L.; Thapa, B. Visitor perspectives on sustainable tourism development in the Pitons Management Area World Heritage Site, St. Lucia. Environ. Dev. Sustain. 2010, 12, 839–857. [Google Scholar] [CrossRef]
- Yuksel, F.; Bramwell, B.; Yuksel, A. Stakeholder interviews and tourism planning at Pamukkale, Turkey. Tour. Manag. 1999, 20, 351–360. [Google Scholar] [CrossRef]
- Lepp, A. Residents’ attitudes towards tourism in Bigodi village, Uganda. Tour. Manag. 2007, 28, 876–885. [Google Scholar] [CrossRef]
- Liang, Z.-X.; Hui, T.-K. Residents’ quality of life and attitudes toward tourism development in China. Tour. Manag. 2016, 57, 56–67. [Google Scholar] [CrossRef]
- Jamal, T.; Getz, D. Community Roundtables for Tourism-related Conflicts: The Dialectics of Consensus and Process Structures. J. Sustain. Tour. 1999, 7, 290–297. [Google Scholar] [CrossRef]
- Miller, G. The development of indicators for sustainable tourism: Results of a Delphi survey of tourism researchers. Tour. Manag. 2001, 22, 351–362. [Google Scholar] [CrossRef]
- Choi, H.; Sirakaya, E. Measuring Residents’ attitude towards Sustainable Tourism: Development of Sustainable Tourism Attitude Scale. J. Travel Res. 2005, 43, 380–394. [Google Scholar] [CrossRef]
- Kim, S. World Heritage Site Designation Impacts on a Historic Village: A Case Study on Residents’ Perceptions of Hahoe Village (Korea). Sustainability 2016, 8, 258. [Google Scholar] [CrossRef]
- Muresan, I.; Oroian, C.; Harun, R.; Arion, F.; Porutiu, A.; Chiciudean, C.; Todea, A.; Lile, R. Local Residents’ Attitude toward Sustainable Rural Tourism Development. Sustainability 2016, 8, 100. [Google Scholar] [CrossRef]
- Lee, W.; Moscardo, G. Understanding the Impact of Ecotourism Resort Experiences on Tourists’ Environmental Attitudes and behavioural Intentions. J. Sustain. Tour. 2005, 13, 546–565. [Google Scholar] [CrossRef]
- Ballanyne, R.; Packer, J.; Falk, J. Visitors’ learning for environmental sustainability: Testing short- and long-term impacts of wildlife tourism experiences using structural equation modelling. Tour. Manag. 2011, 32, 1243–1252. [Google Scholar] [CrossRef]
- Becken, S. Operators’ Perceptions of Energy Use and Actual Saving Opportunities for Tourism Accommodation. Asia Pac. J. Tour. Res. 2003, 18, 72–91. [Google Scholar] [CrossRef]
- Godfrey, K. Attitudes towards ‘sustainable tourism’ in the UK: A view from local government. Tour. Manag. 1998, 19, 213–224. [Google Scholar] [CrossRef]
- Brown, G.; Raymond, C.M. The relationship between place attachment and landscape values: Toward mapping place attachment. Appl. Geogr. 2007, 27, 89–111. [Google Scholar] [CrossRef]
- Fallon, L.D.; Kriwoken, L.K. Community involvement in tourism infrastructure—The case of the Strahan Visitor Centre, Tasmania. Tour. Manag. 2003, 24, 289–308. [Google Scholar] [CrossRef]
- Puczko, L.; Ratz, T. Tourists and Resident Perceptions of the Physical Impacts of Tourism at Lake Balaton, Hungary: Issues for Sustainable Tourism Management. J. Sustain. Tour. 2000, 8, 458–478. [Google Scholar] [CrossRef]
- Kuvan, Y.; Akan, P. Conflict and agreement in stakeholder attitudes: Residents and hotel managers’ views of tourism impacts and forest-related tourism development. J. Sustain. Tour. 2013, 20, 571–584. [Google Scholar] [CrossRef]
- Marshall, N.; Marshall, P.; Abdullah, A.; Rouphael, T.; Ali, A. Preparing for climate change: Recognising its early impacts through the perceptions of dive tourists and dive operators in the Egyptian Red Sea. Curr. Issues Tour. 2011, 14, 507–518. [Google Scholar] [CrossRef]
- Chen, J. Tourism stakeholders’ attitudes toward sustainable development: A case in the Arctic. J. Retail. Consum. Serv. 2015, 22, 225–230. [Google Scholar] [CrossRef]
- Lew, A.A. Authenticity and sense of place in the tourism development experience of older retail districts. J. Travel Res. 1989, 27, 56–59. [Google Scholar] [CrossRef]
- Getz, D.; Timur, S. Stakeholder involvement in sustainable tourism: Balancing the voices. In Global Tourism, 3rd ed.; Theobald, W., Ed.; Butterworth Heineman: Oxford, UK, 2005; pp. 230–247. [Google Scholar]
- Hardy, A. Using Grounded Theory to Explore Stakeholder perceptions of Sustainable Tourism. J. Tour. Cult. Chang. 2005, 3, 108–133. [Google Scholar] [CrossRef]
- Ryan, C. Equity, management, power sharing and sustainability—Issues of the ‘new tourism’. Tour. Manag. 2002, 23, 17–26. [Google Scholar] [CrossRef]
- Hunter, W.C. Understanding resident subjectivities toward tourism using Q method: Orchid Island, Taiwan. J. Sustain. Tour. 2013, 21, 331–354. [Google Scholar] [CrossRef]
- Lim, C.; Mostafa, N.; Park, J. Digital Omotenashi: Toward a Smart Tourism Design Systems. Sustainability 2017, 9, 2175. [Google Scholar] [CrossRef]
- Grafakos, S.; Flamos, A.; Enseñado, E.M. Preferences Matter: A Constructive Approach to Incorporating Local Stakeholders’ Preferences in the Sustainability Evaluation of Energy Technologies. Sustainability 2015, 7, 10922–10960. [Google Scholar] [CrossRef]
- Mawby, R.I.; Tecău, A.S.; Constantin, C.P.; Chițu, I.B.; Tescașiu, B. Addressing the Security Concerns of Locals and Visitors for the Sustainable Development of Tourist Destinations. Sustainability 2016, 8, 524. [Google Scholar] [CrossRef]
- Gössling, S. Global environmental consequences of tourism. Glob. Environ. Chang. 2002, 12, 283–302. [Google Scholar] [CrossRef]
- Liu, Z. Sustainable Tourism Development: A Critique. J. Sustain. Tour. 2003, 11, 459–475. [Google Scholar] [CrossRef]
- Saarinen, J. Traditions of sustainability in tourism studies. Ann. Tour. Res. 2006, 33, 1121–1140. [Google Scholar] [CrossRef]
- Lane, B. Implementing sustainable tourism in Scotland: An interview. J. Sustain. Tour. 2009, 17, 747–752. [Google Scholar] [CrossRef]
- Buckley, R. Sustainable tourism: Research and reality. Ann. Tour. Res. 2012, 39, 528–546. [Google Scholar] [CrossRef]
- Narloch, U.; Pascual, U.; Drucker, A.G. Collective action dynamics under external rewards: Experimental insights from Andean farming Communities. World Dev. 2012, 40, 2096–2107. [Google Scholar] [CrossRef]
- Pascual, U.; Muradian, R.; Brander, L.; Gómez-baggethun, E.; Martín-lópez, B.; Verma, M.; Armsworth, P.; Christie, M.; Cornelissen, H.; Eppink, F.; et al. The economics of valuing ecosystem services and biodiversity. Econ. Ecosyst. Biodivers. Ecol. Econ. Found. 2010, 183–255. [Google Scholar] [CrossRef]
- Jamal, T.B.; Getz, D. Collaboration Theory and Community Tourism Planning. Ann. Tour. Res. 1995, 22, 186–204. [Google Scholar] [CrossRef]
- Trakolis, D. Local People’s Perceptions of Planning and Management Issues in Prespes Lakes National Park, Greece. J. Environ. Manag. 2001, 61, 227–241. [Google Scholar] [CrossRef] [PubMed]
- Ioannides, D. Planning for international tourism in less developed countries: Toward sustainability? J. Plan. Lit. 1995, 9, 235–254. [Google Scholar] [CrossRef]
- Briassoulis, H. Sustainable tourism and the question of the Commons. Ann. Tour. Res. 2002, 29, 1065–1085. [Google Scholar] [CrossRef]
- Robson, J.; Robson, I. From shareholders to stakeholders: Critical issues for tourism marketers. Tour. Manag. 1996, 17, 533–540. [Google Scholar] [CrossRef]
- Waligo, V.; Clarke, J.; Hawkins, R. Embedding stakeholders in sustainable tourism strategies. Ann. Tour. Res. 2015, 55, 90–93. [Google Scholar] [CrossRef]
- Ketema, T.D. Development of community based ecotourism in Wenchi Crater Lake, Ethiopia: Challenges and prospects. J. Hosp. Manag. Tour. 2015, 6, 39–46. [Google Scholar] [CrossRef]
- Breitenbach, F.; Koukol, J. Menagesha state forest. A description of the forest, its management and its future development including the national park project. Ethiop. For. Rev. 1962, 3, 17–34. [Google Scholar]
- Maingi, S.W.; Manyara, G. Towards a Sustainable Tourism Industry in East Africa: Opportunities and Challenges; UNECA SRO-EA Tourism Study; UNECA: Addis Ababa, Ethiopia, 2011; 130p. [Google Scholar]
- Bush, G.; Colombo, S.; Hanley, N. Should all Choices Count? Using the Cut-Offs Approach to Edit Responses in a Choice Experiment. Environ. Resour. Econ. 2009, 44, 397. [Google Scholar] [CrossRef]
- Ministry of Agriculture (MOA). Menagesha Suba State Forest; MOA: Addis Ababa, Ethiopia, 1998.
- Duguma, L.A.; Hager, H.; Gruber, M. The community-state forest interaction in Menagesha suba area, Ethiopia: The challenges and possible solutions. For. Trees Livelihoods 2009, 19, 111–128. [Google Scholar] [CrossRef]
- Louviere, J.J.; Hensher, D.A.; Swait, J.D.; Adamowicz, W. Stated choice methods: Analysis and application. In Stated Choice Methods; Cambridge University Press: Cambridge, UK, 2000; Volume 89, pp. 227–251. ISBN 0304-4076. [Google Scholar]
- Hoyos, D. The state of the art of environmental valuation with discrete choice experiments. Ecol. Econ. 2010, 69, 1595–1603. [Google Scholar] [CrossRef]
- Carson, R.T.; Louviere, J.J. A Common Nomenclature for Stated Preference Elicitation Approaches. Environ. Resour. Econ. 2011, 49, 539–559. [Google Scholar] [CrossRef]
- McFadden, D. Conditional logit analysis of qualitative choice behavior. In Frontiers in Econometrics; Academic Press: New York, NY, USA, 1974; Volume 1, pp. 105–142. [Google Scholar]
- Scarpa, R.; Thiene, M.; Marangon, F. Using flexible taste distributions to value collective reputation for environmentally friendly production methods. Can. J. Agric. Econ. 2008, 56, 145–162. [Google Scholar] [CrossRef]
- Volkmann, J. Strategy on Income Generating Schemes from Non-Timber Forest Products and Identification of Marketing Structures in Participatory Forest Management Intervention Areas in Oromia; Evolve-Consulting for Sustainable Development: Addis Ababa, Ethiopia, 2011. [Google Scholar]
- Hanley, N.; Shogren, F.; White, B. Introduction to Environmental Economics, 2nd ed.; Oxford University Press: Oxford, UK, 2013; 324p, ISBN 9780199568734. [Google Scholar]
- Fadden, D.M.C.; Train, K. Mixed MNL Models for discrete response. J. Appl. Econom. 2000, 15, 447–470. [Google Scholar] [CrossRef]
- Greene, W.H.; Hensher, D.A. A latent class model for discrete choice analysis: Contrasts with mixed logit. Transp. Res. Part B Methodol. 2003, 37, 681–698. [Google Scholar] [CrossRef]
- Scarpa, R.; Thiene, M. Destination choice models for rock climbing in the North-eastern Alps: A latent-class approach based on intensity of preference. Land Econ. 2005, 85, 426–444. [Google Scholar] [CrossRef]
- Colombo, S.; Hanley, N.; Louviere, J. Modeling preference heterogeneity in stated choice data: An analysis for public goods generated by agriculture. Agric. Econ. 2009, 40, 307–322. [Google Scholar] [CrossRef]
- Mark, T.L.; Swait, J. Using stated preference and revealed preference modeling to evaluate prescribing decisions. Health Econ. 2004, 13, 563–573. [Google Scholar] [CrossRef] [PubMed]
- Hole, A.R. Fitting mixed logit models by using maximum simulated likelihood. Stata J. 2007, 7, 388–401. [Google Scholar]
- Pacifico, D. Estimating nonparametric mixed logit models via EM algorithm. Stata J. 2010, 284–298. [Google Scholar]
- Bell, S.; Morse, S. Rich pictures: A means to explore the “sustainable mind”? Sustain. Dev. 2013, 21, 30–47. [Google Scholar] [CrossRef]
- Saufi, A.; O’Brien, D.; Wilkins, H. Inhibitors to host community participation in sustainable tourism development in developing countries. J. Sustain. Tour. 2014, 22, 801–820. [Google Scholar] [CrossRef]
- Carter, R.W.; Thok, S.; O’Rourke, V.; Pearce, T. Sustainable tourism and its use as a development strategy in Cambodia: A systematic literature review. J. Sustain. Tour. 2011, 23, 797–818. [Google Scholar] [CrossRef]
- Kanchanapibul, M.; Lacka, E.; Wang, X.; Chan, H.K. An empirical investigation of green purchase behaviour among the young generation. J. Clean. Prod. 2014, 66, 528–536. [Google Scholar] [CrossRef]
- Zhao, H.H.; Gao, Q.; Wu, Y.P.; Wang, Y.; Zhu, X.D. What affects green consumer behavior in China? A case study from Qingdao. J. Clean. Prod. 2014, 63, 143–151. [Google Scholar] [CrossRef]
- Chiu, Y.T.H.; Lee, W.I.; Chen, T.H. Environmentally responsible behavior in ecotourism: Antecedents and implications. Tour. Manag. 2014, 40, 321–329. [Google Scholar] [CrossRef]
- Hunt, C.A.; Durham, W.H.; Driscoll, L.; Honey, M. Can ecotourism deliver real economic, social, and environmental benefits? A study of the Osa Peninsula, Costa Rica. J. Sustain. Tour. 2015, 23, 339–357. [Google Scholar] [CrossRef]
- Tosun, C. Host perceptions of impacts: A comparative tourism study. Ann. Tour. Res. 2002, 29, 231–253. [Google Scholar] [CrossRef]
- Sharpley, R. Tourism, Tourists and Society, 5th ed.; Routledge: Oxford, UK, 2018; 37p, ISBN 10 9781138629394. [Google Scholar]
- Cole, S. Information and empowerment: The keys to achieving sustainable tourism. J. Sustain. Tour. 2006, 14, 629–644. [Google Scholar] [CrossRef]
- Waligo, V.M.; Clarke, J.; Hawkins, R. Implementing sustainable tourism: A multi-stakeholder involvement management framework. Tour. Manag. 2013, 36, 342–353. [Google Scholar] [CrossRef]
- Choi, H.C.; Murray, I. Resident attitudes toward sustainable community tourism. J. Sustain. Tour. 2010, 18, 575–594. [Google Scholar] [CrossRef]
- Bimonte, S.; Punzo, L.F. Tourism, residents’ attitudes and perceived carrying capacity with an experimental study in five Tuscan destinations. Int. J. Sustain. Dev. 2011, 14, 242–261. [Google Scholar] [CrossRef]
- Bimonte, S. The “tragedy of tourism resources” as the outcome of a strategic game. A new analytical framework. Ecol. Econ. 2008, 67, 457–464. [Google Scholar] [CrossRef]


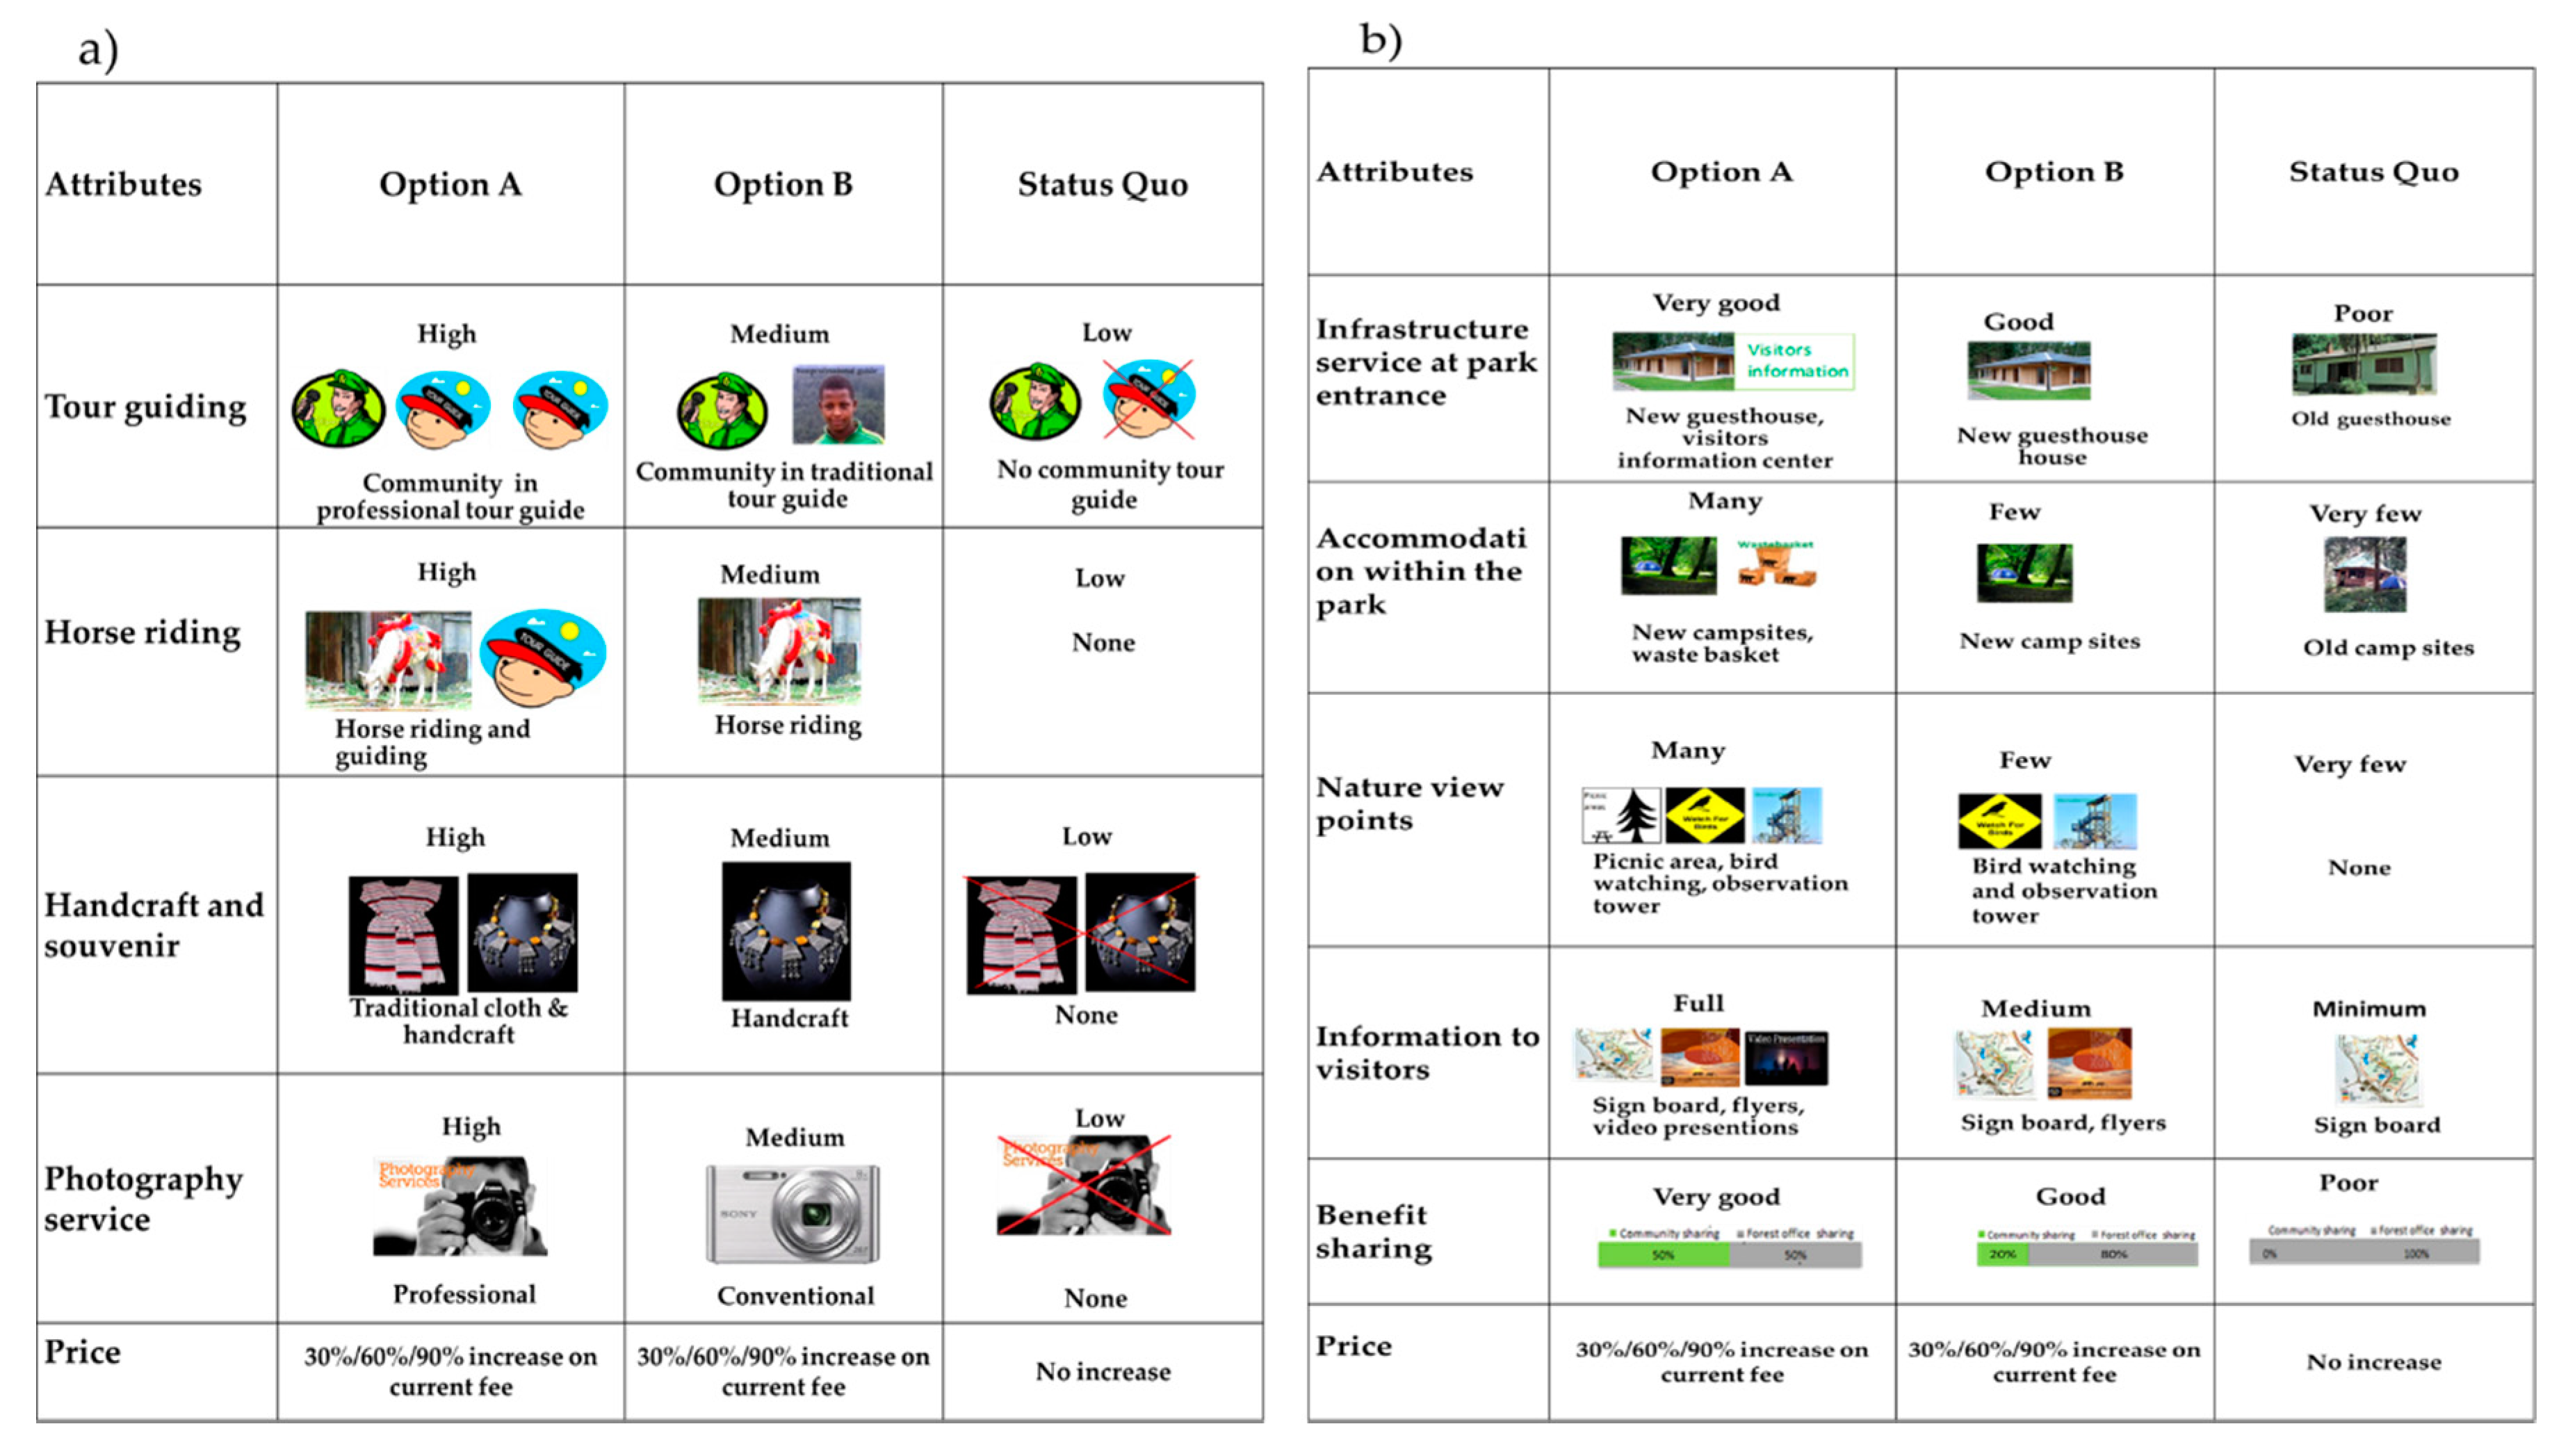
| Community Participation in the Park | Infrastructures Improvement in the Park | ||
|---|---|---|---|
| Attributes | Levels and Its Description | Attributes | Levels and Its Description |
| Tour guiding: Local community giving guiding services in the forest park | High: Professional guide from the community Medium: Traditional guide from the community Low: Park guide | Accommodation: Availability of information center and guest house at the park entrance | Very good: New guest house and information center Good: New guest house Poor: Old guest house |
| Horse riding: Horse riding and guiding services by the community | High: Tour guide and horse ride service Medium: Horse ride service only Low: None | Facilities: Recreational conveniences like campsites and waste bin in the visitor’s site | Many: New camp sites, waste baskets Few: New camp sites Very few: Old campsites |
| Handcraft and souvenir: Community supplying handmade items to visitors | High: Traditional clothes and handicraft Medium: Handcraft Low: None | Nature viewpoints: Location of picnic, bird watching, and observation tower areas | Many: Picnic area, bird watching, and observation tower Few: Bird watching and observation tower Very few: None |
| Photography service: Photography services provided by the local community | High: Professional photography Medium: None professional photography Low: None | Information to visitors: Written and oral information presented to visitors | Full: Interpretive sign board, flyers, video presentation Medium: Interpretive sign board, flyers Minimum: Interpretive sign board |
| Entrance fee: Visitors paying entrance fee to be in the park | 30%, 60%, and 90% increase on the current entrance fee | Benefit-sharing: Benefit sharing channeled to the community | Very good: 50% of the tourism income share goes to the community Good: 20% income share to the community Poor: No share |
| Entrance fee: Visitors paying entrance fee to be in the park | 30%, 60%, and 90% increase on the current entrance fee | ||
| Characteristics | All Tourist | Foreign Tourist | Foreign Resident | Local |
|---|---|---|---|---|
| Tourists profile | 18% (n = 43) | 40.3% (n = 97) | 41.7% (n = 100) | |
| Mean age in years and standard deviation | 36.5 (10.9) | 39.3 (9.7) | 38.3 (9.3) | 32.7 (10.6) |
| % Male | 61 | 56 | 50 | 75 |
| Finding about the forest: Word of mouth | 52.7 | 28 | 62 | 52 |
| Traveled from Addis Ababa | 92.5 | 88 | 97 | 90 |
| Full/half day stay | 73 | 91 | 68 | 70 |
| Mixed Logit Model | |||||
|---|---|---|---|---|---|
| Community Participation | Forest Infrastructure Improvement | ||||
| Coefficient Estimate | SD | Coefficient Estimate | SD | ||
| ASC | 1.388 (0.43) *** | ASC | 0.928 (0.28) *** | ||
| Entrance fee | 1.091 (0.28) *** | Entrance fee | −0.520 (0.18) *** | ||
| Tour guide (High) | 0.625 (0.25) ** | −0.223 (1.23) | Accommodations Very good | 0.658 (0.20) *** | 1.929 (0.89) ** |
| Tour guide (Medium) | 0.642 (0.36) * | 1.785 (1.14) | Accommodations Good | 0.573 (0.16) *** | −0.078 (0.14) |
| Horse ride (High) | −2.857 (7.69) | 40.973 (60.28) | Campsite Many | 0.787 (0.19) *** | −0.004 (0.03) |
| Horse ride (Medium) | 0.112 (0.22) | −0.004 (0.05) | Campsite Few | 0.434 (0.17) *** | 0.057 (0.15) |
| Handicraft (High) | 0.204 (0.23) | 0.002 (0.19) | Nature viewpoints Many | 0.231 (0.14) | −0.289 (0.81) |
| Handicraft (Medium) | 0.274 (0.36) | −1.146 (1.79) | Nature viewpoints Few | 0.077 (0.14) | 0.048 (0.08) |
| Photography (High) | 0.097 (0.29) | 0.114 (0.24) | Information to visitors Full | 0.562 (0.17) *** | −0.045 (0.08) |
| Photography (Medium) | −0.137 (0.30) | −0.094 (0.24) | Information to visitors Medium | 0.342 (0.16) ** | −0.054 (0.21) |
| Benefit sharing Very good | 0.042 (0.14) | 0.043 (0.30) | |||
| Benefit sharing Good | −0.256 (0.18) | −1.159 (1.01) | |||
| Model summary statistics | Model summary statistics | ||||
| Sample size | 240 | Sample size | 240 | ||
| Observation | 2160 | Observation | 2880 | ||
| Waldchi2 | 48.44 | Waldchi2 | 85.56 | ||
| p | 0 | p | 0 | ||
| Log likelihood | −715.78 | Log likelihood | −856.89 | ||
| Mcfadden’ R2 | 0.01 | Mcfadden’ R2 | 0.003 | ||
| Number of Classes | Community Participation in Tourism | Infrastructure Improvement in the Park | ||
|---|---|---|---|---|
| BIC | AIC | BIC | AIC | |
| 2 | 1380.60 | 1448.86 | 1689.34 | 1789.75 |
| 3 | 1307.50 | 1299.19 | 1595.36 | 1598.32 |
| 4 | 1412.78 | 1493.45 | 1744.04 | 1819.61 |
| 5 | 1301.40 | 1305.49 | 1601.33 | 1579.44 |
| Variables | Class 1A | Class 2A | Class 3A |
|---|---|---|---|
| No Community Involvement Supporters | Moderate Community Involvement Supporters | Community-Based Tourism Supporters | |
| ASC | −0.480 | 2.743 *** | 1.382 * |
| (0.858) | (0.646) | (0.827) | |
| Tour guide high | −1.068 | 0.256 | 0.361 |
| (0.880) | (0.533) | (0.310) | |
| Tour guide medium | 0.0153 | 1.039 ** | 0.704 ** |
| (0.782) | (0.410) | (0.325) | |
| Horse ride high | 0.00920 | −0.0472 | 0.567 ** |
| (0.722) | (0.440) | (0.279) | |
| Horse ride medium | −0.881 | −0.386 | 1.114 *** |
| (0.862) | (0.533) | (0.320) | |
| Handicrafts high | −1.102 | −0.408 | 0.462 * |
| (0.812) | (0.328) | (0.269) | |
| Handicrafts medium | −1.924 ** | −0.713 | 0.763 ** |
| (0.849) | (0.561) | (0.308) | |
| Photography high | 0.350 | −0.785 * | 0.760 * |
| (0.652) | (0.436) | (0.405) | |
| Photography medium | −2.559 | −1.728 *** | 1.156 *** |
| (1.641) | (0.592) | (0.444) | |
| Entrance Fee | −0.165 | 0.0363 | −0.467 * |
| (0.698) | (0.237) | (0.280) | |
| Class membership variables: Socio demographics | |||
| Constant | −0.107 | 0.258 | |
| (0.610) | (0.889) | ||
| Foreign resident | −0.229 | 0.232 | |
| (0.603) | (0.763) | ||
| Local | −1.845 *** | −1.616 * | |
| (0.667) | (0.842) | ||
| Class share | 18% | 35% | 47% |
| Observations | 2,160 | ||
| Sample size | 43 | 84 | 113 |
| Log likelihood | −614.52 | ||
| Pseudo R2 | 0.2 | ||
| Attribute | Class 1B | Class 2B | Class 3B |
|---|---|---|---|
| Infrastructure Development Supporters | Local Development Supporters | Infrastructure and Local Development Supporters | |
| ASC | −1.5760 | −3.2775 *** | 3.2035 *** |
| (−1.9656) | −12.069 | (0.4519) | |
| Accommodation Very good | 0.8429 | 0.7036 | 0.6071 *** |
| (0.6454) | (0.6187) | (0.1349) | |
| Accommodation Good | 2.4241 *** | 1.2471 ** | 0.3580 *** |
| (0.8818) | (0.5736) | (0.1279) | |
| Facilities Many | 3.9892 *** | 0.7552 | 0.4460 *** |
| −14.175 | (0.5304) | (0.1317) | |
| Facilities Few | 2.2162 ** | 1.0995 ** | 0.1916 |
| −10.791 | (0.5104) | (0.1266) | |
| Nature viewpoints Many | −11.543 | 0.1815 | 0.2118 * |
| (0.7954) | (0.5293) | (0.1255) | |
| Nature viewpoints Few | −0.6255 | 0.3190 | −0.1716 |
| (0.6594) | (0.5414) | (0.1225) | |
| Information to visitors Full | −1.3735 * | 0.2189 | 0.3614 *** |
| (0.7231) | (0.4950) | (0.1238) | |
| Information to visitors Medium | −0.3001 | 0.0378 | 0.1426 |
| (0.8586) | (0.4560) | (0.1232) | |
| Benefit sharing Very good | 0.8284 | 1.1365 ** | 0.4623 *** |
| (0.7930) | (0.5506) | (0.1335) | |
| Benefit sharing Good | 0.6865 | 0.6891 | 0.4709 *** |
| (0.7886) | (0.5410) | (0.1281) | |
| Entrance fee | 1.6951 * | −0.3027 | −0.6016 *** |
| (0.8737) | (0.2953) | (0.1125) | |
| Class membership variables socio-demographics | |||
| Constant | −1.4837 ** | −1.0315 ** | |
| (0.5860) | (0.4111) | ||
| Foreign resident | 0.6341 | −0.2360 | |
| (0.6315) | (0.5068) | ||
| Local | −13.9797 | −1.4303 ** | |
| (413.5673) | (0.5764) | ||
| Class share (%) | 12.7 | 14 | 73.3 |
| Observations | 2.880 | ||
| Sample size | 30 | 34 | 176 |
| Log likelihood | −752.32762 | ||
| Pseudo R2 | 0.12 | ||
| Community Participation | Infrastructure Improvement | |||||
|---|---|---|---|---|---|---|
| Class 1A | Class 2A | Class 3A | Class 1B | Class 2B | Class 3B | |
| Sample size, N | 43 | 84 | 113 | 30 | 34 | 176 |
| Gender (% of male) | 54.6 (0.03) | 64.3 (0.02) a | 61.9 (0.01) | 58.9 (0.01) | 54.8 (0.03) | 69.8 (0.07) c |
| Age (mean age in years) | 37.6 (0.54) | 38.5 (0.45) | 35 (0.31) b | 37.6 (0.27) | 36 (0.49) | 34.3 (0.34) b |
| Undergraduate degree | 27 (0.02) | 33 (0.02) | 44 (0.02) b | 37.5 (0.03) | 25.7 (0.02) | 40.8 (0.01) c |
| Graduate level degree | 57 (0.02) b | 57 (0.01) c | 42 (0.02) | 59.4 (0.02) b | 65.7 (0.02) c | 44 (0.004) |
| Monthly household net income ($) | ||||||
| <1000 USD | 18 (0.02) | 28 (0.02) | 44 (0.01) b,c | 8 (0.01) | 9 (0.20) | 68.3 (0.02) b,c |
| 1000–3000 | 25 (0.02) | 24 (0.02) | 21 (0.01) | 30 (0.02) | 23 (0.02) | 30.2 (0.02) |
| >3000 USD | 35 (0.02) b | 34 (0.01) c | 24 (0.01) | 35 (0.03) | 45 (0.02) a | |
| I don’t want to give this information | 22 (0.02) a,b | 14 (0.02) | 11 (0.01) | 27 (0.06) b | 23 (0.02) | 1.5 (0.01) |
| Tourist profile | ||||||
| Foreign tourist | 27.3 (0.02) b | 21.4 (0.02) | 18.3 (0.01) | 18.8 (0.02) | 25.7 (0.02) a,b | 16.2 (0.01) |
| Foreign resident | 47.7 (0.03) b | 41.4 (0.02) | 29.2 (0.01) | 59.4 (0.03) b | 42.9 (0.03) | 36.4 (0.01) |
| Local | 25 (0.02) | 37.14 (0.02) | 52.5 (0.01) b | 21.8 (0.02) | 31.4 (0.02) | 47.4 (0.01) b,c |
| Purpose of the visit | ||||||
| Trekking/hiking | 43.2 (0.02) | 48.6 (0.02) a,b | 42.9 (0.01) | 48 (0.02) | 48.4 (0.03) | 35 (0.02) b,c |
| Camping | 20 (0.03) | 13.6 (0.01) | 22.1 (0.02) | 27.5 (0.06) | 18 (0.02) | 19.9 (0.02) |
| Others (trees, birds, wildlife) | 36.8 (0.03) | 37.8 (0.02) | 35 (0.01) | 24.5 (0.01) | 33.6 (0.04) | 45.1 (0.02) b,c |
| Community Participation in Tourism | Infrastructure Development | ||
|---|---|---|---|
| Infrastructure Development Supporters | Local Development Supporters | Infrastructure and Local Development Supporters | |
| No community involvement supporters | 3.33 (0.18) | 9.17 (0.29) a | 7.5 (0.26) b |
| Foreign | 0.83 (0.09) | 2.5 (0.16)a,c | 0.42 (0.0.06) |
| Foreign resident | 2.5 (0.16) | 4.58 (0.21) a | 4.58 (0.21) c |
| Locals | 0 | 2.08 (0.14) | 2.5 (0.16) b,c |
| Moderate community involvement supports | 2.5 (0.16) | 1.25 (0.11) | 4.17 (0.2) b,c |
| Foreign | 1.25 (0.11) | 0.42 (0.06) | 0.83 (0.09) |
| Foreign resident | 0.83 (0.09) | 0.42 (0.06) | 1.25 (0.11) |
| Locals | 0.42 (0.06) | 0.42 (0.06) | 2.08 (0.14) b,c |
| Community-based tourism supporters | 7.5 (0.26) | 12.5 (0.33) a | 53.33 (0.5) b,c |
| Foreign | 0.42 (0.06) | 1.25 (0.11) | 8.75 (0.28) b,c |
| Foreign resident | 4.58 (0.21) | 5.83 (0.23) | 17.5 (0.38) b,c |
| Locals | 2.5 (0.16) | 5.42 (0.23) | 27.08 (0.44) b,c |
© 2018 by the authors. Licensee MDPI, Basel, Switzerland. This article is an open access article distributed under the terms and conditions of the Creative Commons Attribution (CC BY) license (http://creativecommons.org/licenses/by/4.0/).
Share and Cite
Tekalign, M.; Groot Zevert, N.; Weldegebriel, A.; Poesen, J.; Nyssen, J.; Van Rompaey, A.; Norgrove, L.; Muys, B.; Vranken, L. Do Tourists’ Preferences Match the Host Community’s Initiatives? A Study of Sustainable Tourism in One of Africa’s Oldest Conservation Areas. Sustainability 2018, 10, 4167. https://doi.org/10.3390/su10114167
Tekalign M, Groot Zevert N, Weldegebriel A, Poesen J, Nyssen J, Van Rompaey A, Norgrove L, Muys B, Vranken L. Do Tourists’ Preferences Match the Host Community’s Initiatives? A Study of Sustainable Tourism in One of Africa’s Oldest Conservation Areas. Sustainability. 2018; 10(11):4167. https://doi.org/10.3390/su10114167
Chicago/Turabian StyleTekalign, Meron, Nicole Groot Zevert, Amanuel Weldegebriel, Jean Poesen, Jan Nyssen, Anton Van Rompaey, Lindsey Norgrove, Bart Muys, and Liesbet Vranken. 2018. "Do Tourists’ Preferences Match the Host Community’s Initiatives? A Study of Sustainable Tourism in One of Africa’s Oldest Conservation Areas" Sustainability 10, no. 11: 4167. https://doi.org/10.3390/su10114167
APA StyleTekalign, M., Groot Zevert, N., Weldegebriel, A., Poesen, J., Nyssen, J., Van Rompaey, A., Norgrove, L., Muys, B., & Vranken, L. (2018). Do Tourists’ Preferences Match the Host Community’s Initiatives? A Study of Sustainable Tourism in One of Africa’s Oldest Conservation Areas. Sustainability, 10(11), 4167. https://doi.org/10.3390/su10114167