Article

Model-Based Exploration of Co-Creation Efforts: The Case of Solar Photovoltaics (PV) in Skåne, Sweden

by
Sujeetha Selvakkumaran
* and
Erik O. Ahlgren
Energy Technology, Chalmers University of Technology, 412 96 Göteborg, Sweden
*
Author to whom correspondence should be addressed.
Sustainability 2018, 10(11), 3905; https://doi.org/10.3390/su10113905
Submission received: 18 June 2018 / Revised: 11 October 2018 / Accepted: 24 October 2018 / Published: 26 October 2018

Abstract

:
Co-creation in the societal sphere is becoming important in many parts of the world. However, empirical analysis of co-creation in local energy transitions has been understudied. This paper aims to contribute to the field of local energy transitions by integrating a model-based approach with the municipal co-creation efforts in a local energy transition setting. The study uses a mixed-methods approach, with both quantitative and qualitative methods underpinning the approach. A System Dynamics (SD) model is built to analyse the feedback loops created by the co-creation efforts of the municipalities in Skåne, Sweden to increase the uptake of household solar photovoltaics. Simultaneously, the model is conceptualized and built in coordination with the municipality actors, and qualitative validation provided by them. An iterative process is implemented, consisting of three steps: interaction with the municipality actors (MAs), developing the causal relationships between the model variables and model development. The suggestions and discussions with the MAs were very useful in understanding the social factors and processes which help in the diffusion of a technologically innovative product, such as solar PV. The MAs said that they found the explanation of the modelling variables useful in undertaking the co-creation efforts.

1. Introduction

The need for societies to be innovative to tackle the challenges of the 21st century is increasing which in turn has led to research and development funding going towards the creation of resilient and innovative societies. This is inherently connected to co-creation and social innovation, especially in the public sphere in welfare states. To this effect, there is evidence that both the OECD [1] and the European Commission [2] deem social innovation and co-creation important.
Energy and the broader sustainability transitions research has emerged in the last two decades as a response to the dire need to change the systems of production and consumption in place. Transition scholars agree that energy transitions are systemic socio-technical transitions, which result in transformations of societal and technological systems. Over the last two decades, there have been sustained and transformative changes in energy systems, mostly driven by renewable energy technologies [3]. These renewable energy technologies are only partly driven by established incumbent players; with the rest being spurred on by decentralised renewable energy installations.
An emerging phenomenon in the decentralised renewable energy transition has been the proliferation of grass-roots energy initiatives [4] or community energy initiatives [5]. These energy initiatives are often localized and have emerged as a direct response to traditional “large energy companies” [6]. The proliferation of these energy initiatives may be postulated and assessed as local energy transitions, in the view of technologies they use, the way they are owned and operated and their challenging of the status quo [7]. In European welfare states such as Sweden, there is an established history of devolved decision-making in energy and environmental matters, especially at the local and regional scales [8,9]. Notwithstanding that, other European countries are also seeing a proliferation of renewable community energy projects leading the way to local energy transitions [10,11,12]. The citizens and municipal authorities are getting involved in the adoption of renewable energy technologies in innovative ways [13,14]. This phenomenon justifies turning the attention to local energy transitions. Here, we use the term “local” to mean a specific sub-national scale. Thus, there is reasonable justification for looking at local level energy transitions, especially local transitions being co-created [15]. Given the progress and impetus on co-creation, especially in Europe and the climate leadership position Europe hopes to occupy in the upcoming years, the question of how co-creation can affect real-world energy transitions, especially local energy transitions are becoming important.
The energy transitions research is divided into three main approaches; the socio-technical approach, socio-institutional approach and the socio-ecological approach. The socio-technical approach to the study of energy transition places the emphasis on the technological innovation, and its roots lie in innovation studies and science and technology studies. The main analytical lenses are frameworks such as multi-level perspective and technological innovation systems [16,17,18]. These frameworks are sometimes criticized for being too general and abstract [19]. Especially, they lack in identifying the causal relationships driving the transitions and hence do not adequately lead to better understanding of said transitions [20]. Energy transitions are also inherently dynamic and mostly non-linear, which are not adequately captured by the frameworks. Thus, transitions scholars have called for better integrated methods to study transitions [21,22], such as quantitative models which can tackle the pathway dynamics and the non-linearity and give a deeper understanding of energy transitions.
Formal modelling of socio-technical transitions has been reviewed extensively in [19,22,23,24,25], and sustainability transitions modelling is a niche field which has shown an affinity to multiple simulation-based modelling methods such as system dynamics and agent-based modelling, as noted by [23]. Sustainability transitions models can be built for many purposes, such as understanding the transitions and the underlying complexities, providing case-specific policy advice and facilitating stakeholder perspectives, according to Halbe et al. [22]. Modelling and simulation studies can lend itself to theory-building, as expressed by many studies [24,25,26]. Transitions modelling can be undertaken as an explorative modelling exercise, if at an initial stage. The explorative modelling is a common method to understand and formalize situation-descriptions that are conceivable in a domain, as explained by [27]. Simply put, explorative modelling is a tool to understand and conceive certain situations that can be imagined or need to be explained. Thus, explorative transitions modelling is a possible avenue of investigation in the case of sustainability transitions.
Local energy transitions are considered a sub-set of energy transitions, or characterized as being experiment-based transitions [28] happening in a geographically constrained setting. Selvakkumaran and Ahlgren [7,29] pointed out that local energy transitions may be considered explicitly as complex socio-technical transitions in themselves, with special characteristics distinguishing them from general energy transitions. That is to say, local energy transitions are important and significant to the regime-change the world needs and studying local energy transitions specifically is important. Local energy transitions are gaining prominence in the energy transitions research field, with many publications studying the phenomena of their emergence [15,30,31], governance [32,33] and ownership [14,34]. While these studies use socio-technical transition theories and socio-institutional approaches to explain the transitions process at the local scale, none of them explore and explain the dynamics underpinning the transitions process through a systems perspective given the different innovative processes underpinning the local transitions [35].
In summary, we point out that the confluence of three factors necessitate our study: (1) the proliferation of community-involved local energy transitions; (2) the theorizing approach in studying energy transitions not adequately covering local energy transitions, and the lack of model-based studies for local energy transitions; and (3) the lack of incorporation of co-creation into the energy transitions studies. Thus, the primary question our study aims to answer is how co-creation efforts can be integrated into a model-based exploration of local energy transition.
The objective of this paper is to explore the co-creation in the context of local energy transitions, using a model. Specifically, the contribution of this paper is that it studies the ways co-creation efforts in a local energy transitions case can be explored through a model.
In this study, with the aid of a local energy transitions case, we explore co-creation and examine how co-creation in energy transitions conforms to existing theories or concepts. Furthermore, we contribute by adding to the corpus of work supporting the model-based theory building approach.
Moreover, we build on the works of studies such as [20] in the field of energy transitions, where simulation models were built to explore certain situations, such as what we are aiming to do in this study. In the case of this study, exploration of co-creation in the context of local energy transitions is done through model-building. As such, an explorative model-building study to examine a hitherto unexamined phenomenon in local energy transitions is a novel way of pushing the boundary.
The rest of the paper is organized as follows: Section 2 explains what co-creation is and gives the state-of-the-art of co-creation in energy transitions. Section 3 presents the methods and models we have used in this study while Section 4 presents the outcomes of model development process. Section 5 discusses key insights and conclusions.

2. What Is Co-Creation, and How Can It Be Explained in the Context of Local Energy Transitions?

This section presents the theories and concepts of co-creation and co-creation in the context of energy transitions and tries to present the research gap that this study is aiming to fulfil.

2.1. Co-Creation: Theories and Concepts

Simply put, co-creation is creating something together with another person or entity. However, many researchers have pointed out that the formal definition is quite vague, leaving much room for ambiguities [36,37]. In undertaking a comprehensive review of co-creation and co-production, Voorberg et al. [38] clarified that co-creation is the creation of common solutions with the end users or actors involved. One of the main conclusions regarding the definition of co-creation that they arrived at is that co-creation is where creation of a solution happens with the citizen/or end-user being considered as a valuable partner in product or service delivery. In the public service, this same concept of co-creation gets pivoted to include the citizens/residents as important partners and as end users, while in the private sector and in firms, co-creation happens when the end-user takes over the creation of the product or service, thus ensuring efficient delivery of the product.
According to Voorberg et al. [38], co-creation has four aspects:
  • Co-creation’s objective is to give lasting solutions to the parts of society that requires it; a society which has needs and challenges. Thus, it looks beyond technological innovations and then the focus shifts to how co-creation creates value.
  • It changes the social relationships between the stakeholders, in that it changes the context in which existing practices used to happen.
  • Pursuant to the first point, to create or give solutions that matter and are relevant to the society’s needs, relevant stakeholders are involved in the design, implementation or adoption of an innovation. This corresponds with the concept of open innovation.
  • Co-creation is not just the production of solutions/outcomes but also the process of innovation. This is neither institutionalized innovation such as in an R&D in a lab nor limited to the entrepreneurial ability of a single person, but rather groups of stakeholders cooperating, sharing, and exchanging vital resources. However, this open innovation process is an embedded process, which takes place in a specific local and institutional context.
De Koning et al. [39] provided a seminal work classifying the existing models of co-creation, in both private and public spheres, and tried to frame meta-models. The authors framed a meta-model whereby they placed the co-creation models on the spectrum of co-creation, which is made of the level of influence on one axis and the level of collaboration on the other axis. Then, they characterized high level of influence and high levels of collaboration as “co-creation as a design method”, which is possible in customizing the design of your product. On the other hand, low levels of influence and high levels of collaborations signify co-creation as an innovation approach. This meta-model helps distinguish the different types of co-creation possible, within the delineations of public and private spheres.
Many interesting aspects are attached to co-creation. Here, looking at co-creation strictly within the public sphere, Verschuere et al. [40] put forward reasons co-creation is interesting in an inter-disciplinary point of view. Co-creation implies that many actors voluntarily give their time and effort to create a product or service. Co-creation also then implies that these varied actors will have different motives and objectives in their participation. Co-creation also changes the traditional view of end users as passive consumers into active participants. Thus, the dynamics and impacts of co-creation in the product or service delivery are fundamentally changed, and therein lies the crux of interest, especially in transitions studies.

2.2. Co-Creation within the Context of Energy Transitions

Empirically, co-creation has not been studied in connection to energy transitions or energy services provision, according to Voorberg et al. [38]. However, epistemically, there are significant links between co-creation and local-level grassroot based bottom-up initiatives which characterize energy transitions in a considerable number of countries. Even though the term co-creation is not used to describe the literature dealing with energy transitions, given the work done to define and explain co-creation, one may postulate that some local energy transitions are indeed co-created.
Local energy transitions involving energy communities and grass-roots initiatives include the active participation of residents and citizens to co-create a common energy service. Süsser et al. [6] looked at six co-owned community power plants, each having been “co-created” by joint efforts of the people involved. Going by the definitions and explanations in the previous sector, this is clearly an act of co-creation. In the study by Trutnevyte et al. [41], actors from academia, local citizens and local governmental authorities clearly engaged in planning the energy system of the future, through the local energy services the citizens are involved in. Reinsberger et al. [42] mentioned that bottom-up initiatives are social innovations, in that they foster a novel way of providing energy service, which is co-produced. Chilvers and Longhurst [14] sought to re-conceptualize local energy transitions as being co-produced, since civil society participation in energy services provision is clearly a social innovation.
Recently, Puerari et al. [43] analysed the co-creation dynamics in urban living labs. They found that active participation of actors, the ownership of the co-creation process, the spaces and places in co-creation and the different motivations and incentives for co-creation all catalysed the energy transitions process through the different urban living lab cases.
Clearly, there is overt and implicit co-creation in local energy transitions and understanding the impact co-creation has on local energy transitions processes is important to steer and manage the said transitions. However, none of the studies explore the dynamics underpinning the co-creation efforts, and their impacts on local energy transitions processes or explore co-creation in the local energy transitions processes through a model-based study and this study tries to fill this particular gap.

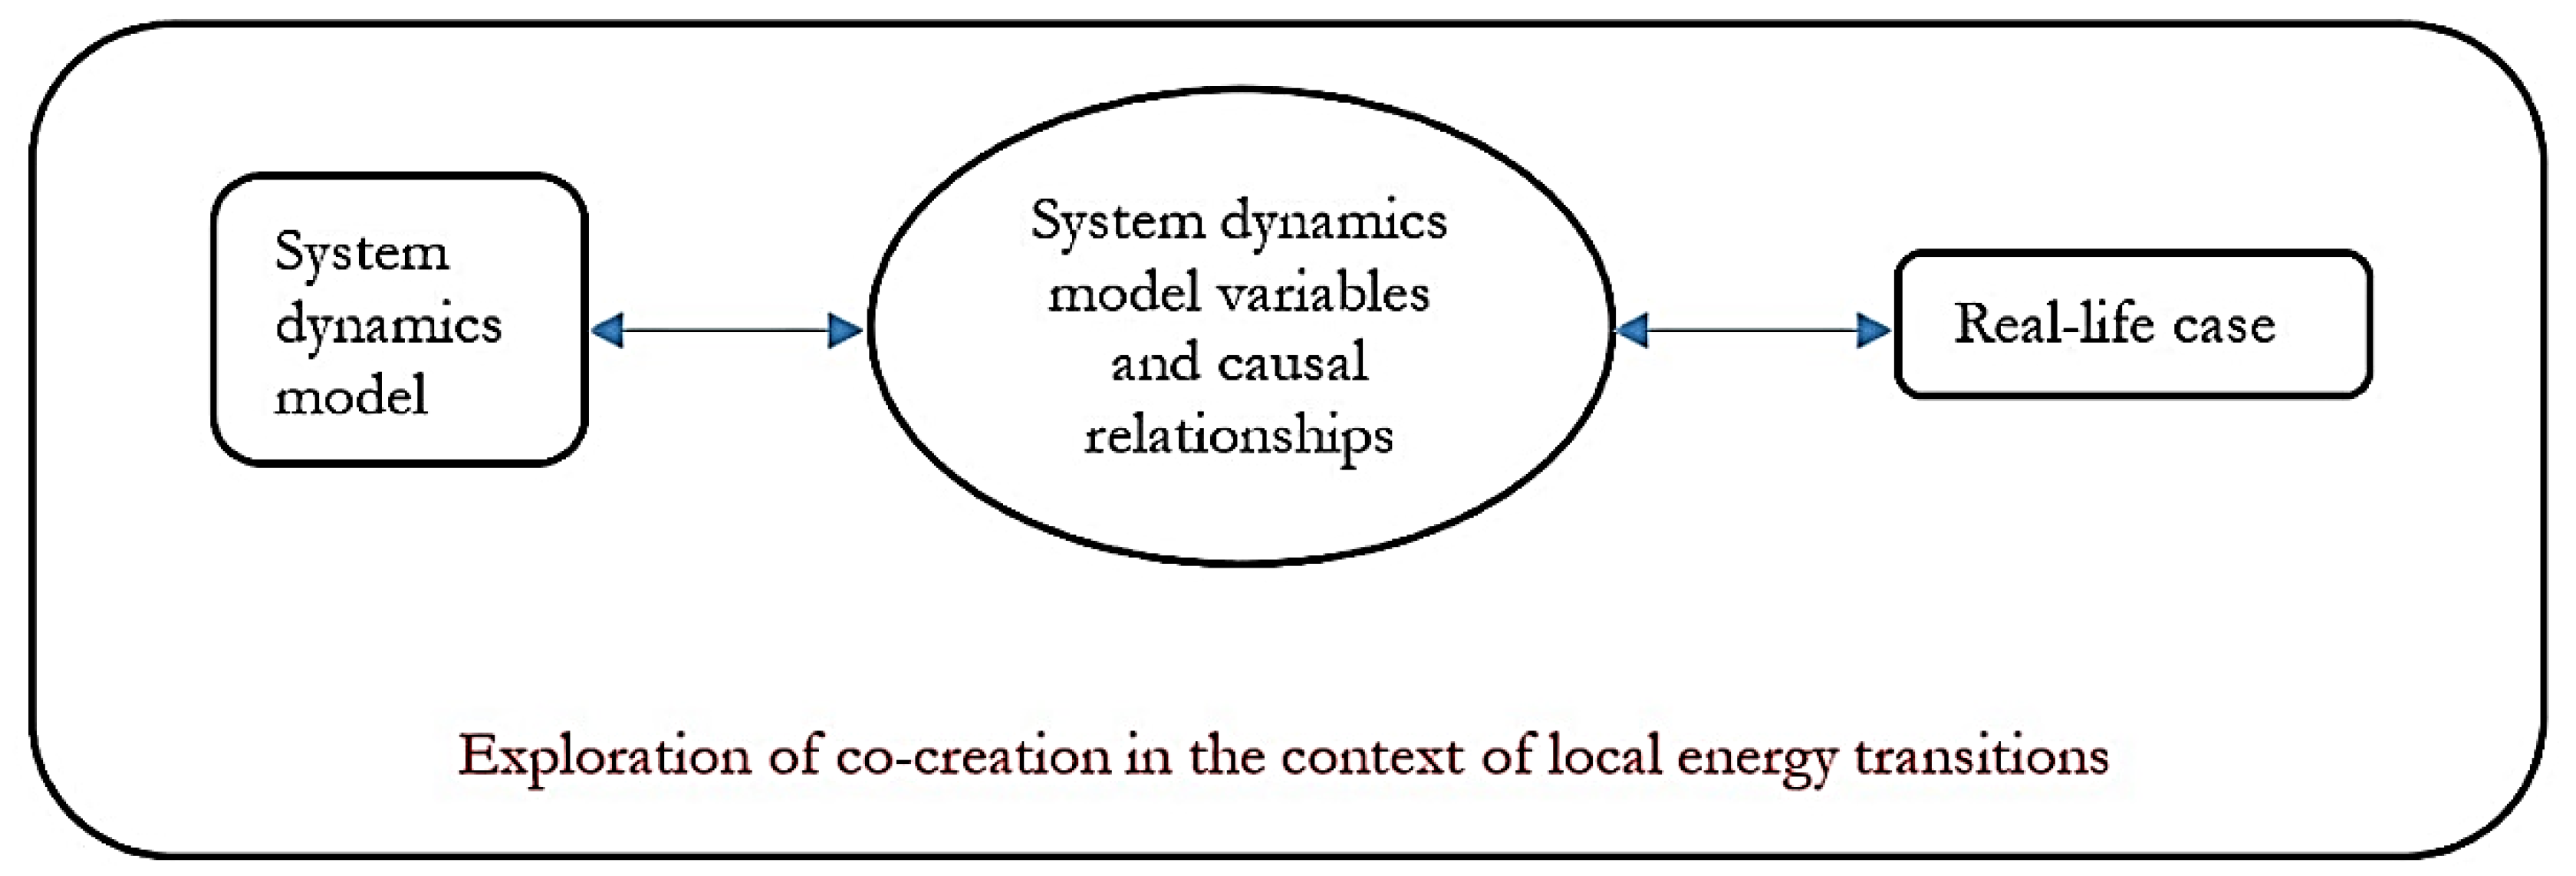
3. Methods and Models

This section gives the descriptions of the methods and models used in the study we have done. These methods and models form the basis of the process of exploring the possible impacts of co-creation in a local energy transitions case.
The overall method used in this study is shown in Figure 1, which depicts our attempt to explore the real-life case through a System Dynamics (SD) model. However, a SD model can only be built via the thorough understanding of the model’s important variables and the causal relationships between them, which is apparent through the real-life case. Thus, Figure 1 shows that we have linked the real-life case to the SD model variables and linked the model variables to the SD model.
The bi-directional arrows signify that the real-life case gave rise to the SD model variables and their relationship, which in turn were converted into an SD model that we then compared with the real-life case. Here, we need to emphasize that the information flow between the real-life case and the model variables and the SD model occurred both ways.
We observed and interact with an on-going project, municipality actors (MAs) doing co-creation activities. Then, we converted the project happenings into model variables, which acted as the model-based representation of the real-life case. We determined and developed the variables and the causal relationships between the different variables, by asking the MAs, which led to the development of the SD model.
In Figure 2, we have disaggregated the simple process shown in Figure 1. As can be seen, the overall method is not a one-step process, but rather an iterative process, which moves between interactions with the MAs, and developing the causal relationships between the model variables and model development.
Potentially, we can have multiple iterations of interactions with the MAs, leading to the development of the causal relationships between the model variables, in turn to the model development process, and finally to us communicating the model thus developed to the MAs.
Thus, it is important to note that the model development process, at every stage, had these three distinct components: interactions with MAs, the identification of causal relationship, and model development.
Furthermore, the SD model development can be broken down into distinct steps, as shown in Figure 3. The steps are elaborated in the following sections.
In summary, Figure 1 depicts the overall method undertaken by us in this study: interaction with the MAs engaged in co-creation to understand the causal relationships underpinning the adoption of solar PV panels in Skåne. Figure 2 is the disaggregated version of Figure 1, showing the iterative process of the overall method. Figure 3 specifically brings into focus the model development phase of the method.
In the following sections, we explain the three phases of the method flow (Figure 2) in detail.

3.1. Interaction with the Municipality Actors

The interactions with the MAs were driven by us, primarily to gather information about the co-creation efforts and to explicitly find the MAs’ mental models on how co-creation efforts influence the diffusion of solar PV panels in Skåne. This phase was also connected to the data collection process in the model development phase (Figure 3). Most interactions were directed by the authors through semi-structured interviews, where we asked directed questions to elicit answers that were relevant to the second phase: determining the causal relationships.

3.2. Determining the Causal Relationships

Determining the causal relationships between the variables in the model built on our as well as the MA’s initial mental models. Our initial mental model was based on Bass’ diffusion of a technologically advanced product. We envisioned the solar PV panel adoption rate being influenced by two distinct factors which can be, without loss of generality, be termed as contact rate and adoption rate.
Following this, the process of determining the factors was dependent on the information we gathered from the MAs, regarding their co-creation efforts.

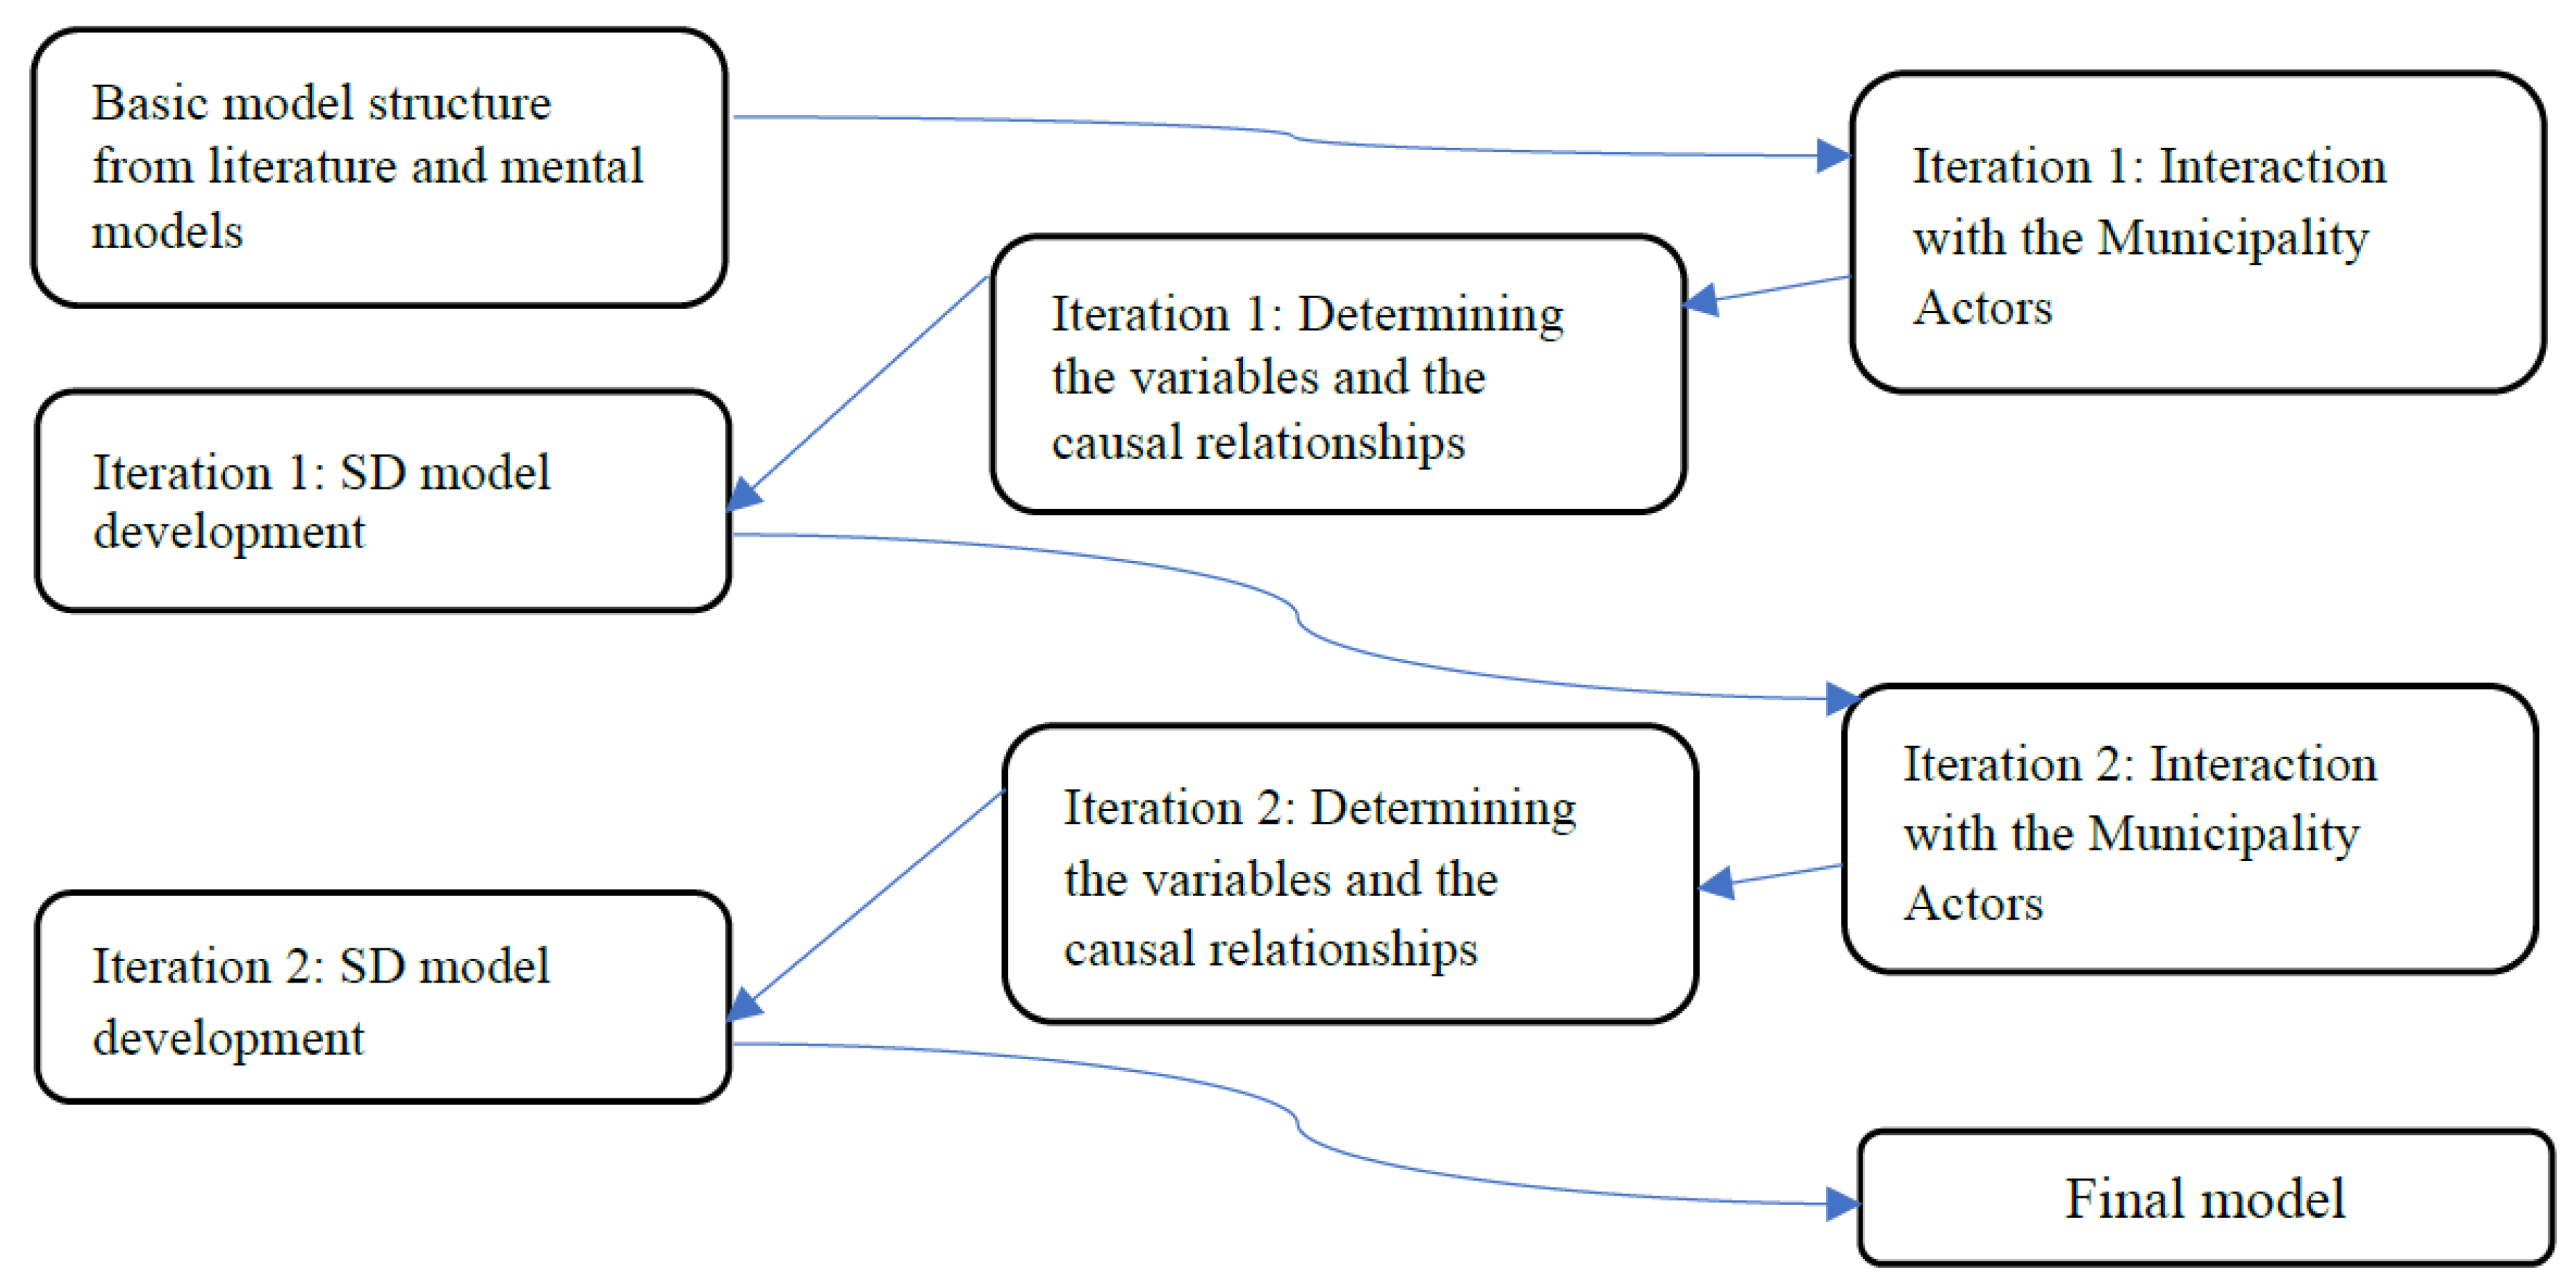
3.3. Model Development

The model development phase is depicted in Figure 3. As mentioned before, Step 1 is linked to the interactions we had with the MAs in the overall method work flow.

3.3.1. Step 1. Data Collection

We primarily used a mixed-methods approach for data collection, with both primary and secondary research components. An overview of the mixed-methods approach for data collection can be seen in Table 1. Data collection acts as the first step in the model development process, helping us intuit about the adoption/diffusion process and the mental models regarding the co-creation efforts.
To satisfactorily factor in co-creation activities happening on the ground and to include the techno-economic aspects of diffusion, we decided to incorporate a mixed-methods approach. The explanations regarding the qualitative and quantitative aspects of the method is espoused below.

Primary Qualitative Methods

We used non-structured and semi-structured interviews as a means of gauging the co-creation process and activities that happened in the project. We spoke to the two municipality actors involved in the project in Skåne, Sweden. The interviews happened in both formal and informal settings. We conducted the interviews in person and used a recording device such as a mobile phone. The consent of the municipality actors was explicitly sought and obtained before the conversation was recorded. These interviews were manually transcribed by the authors and inductively analysed. We performed three interviews of average time length of one hour each with each municipality actor.
The joint model discussion sessions happened both in person and via telecommunication media, specifically voice-over-internet protocol (VOIP) technology. Such sessions were recorded with the explicit consent of the two municipality actors. The content was manually listened to by the authors and suggestions were inductively analysed and considered in the modelling process. In this paper, for simplicity’s sake, we have named the municipal actors Municipality Actor 1 (MA) 1 and MA 2.

Secondary Qualitative Methods

We inductively analysed the project documents, which were the monthly (or bi-monthly) project status reports as well as other documentations of the project activities which our project partners provided us. We could gauge the frequency of the co-creation activities, as well as the type of co-creation activities, and, through the presentation documents, the nature of the activities as well as the information given out to the participants of the co-creation activities.

Secondary Quantitative Methods

The secondary quantitative methods entailed desk research about the installed solar PV panels in Sweden, along with the techno-economic details of solar PV panels in Sweden. The required data were collated from [44,45,46]. The specific number of solar PV installations in Skåne was obtained from project documents.

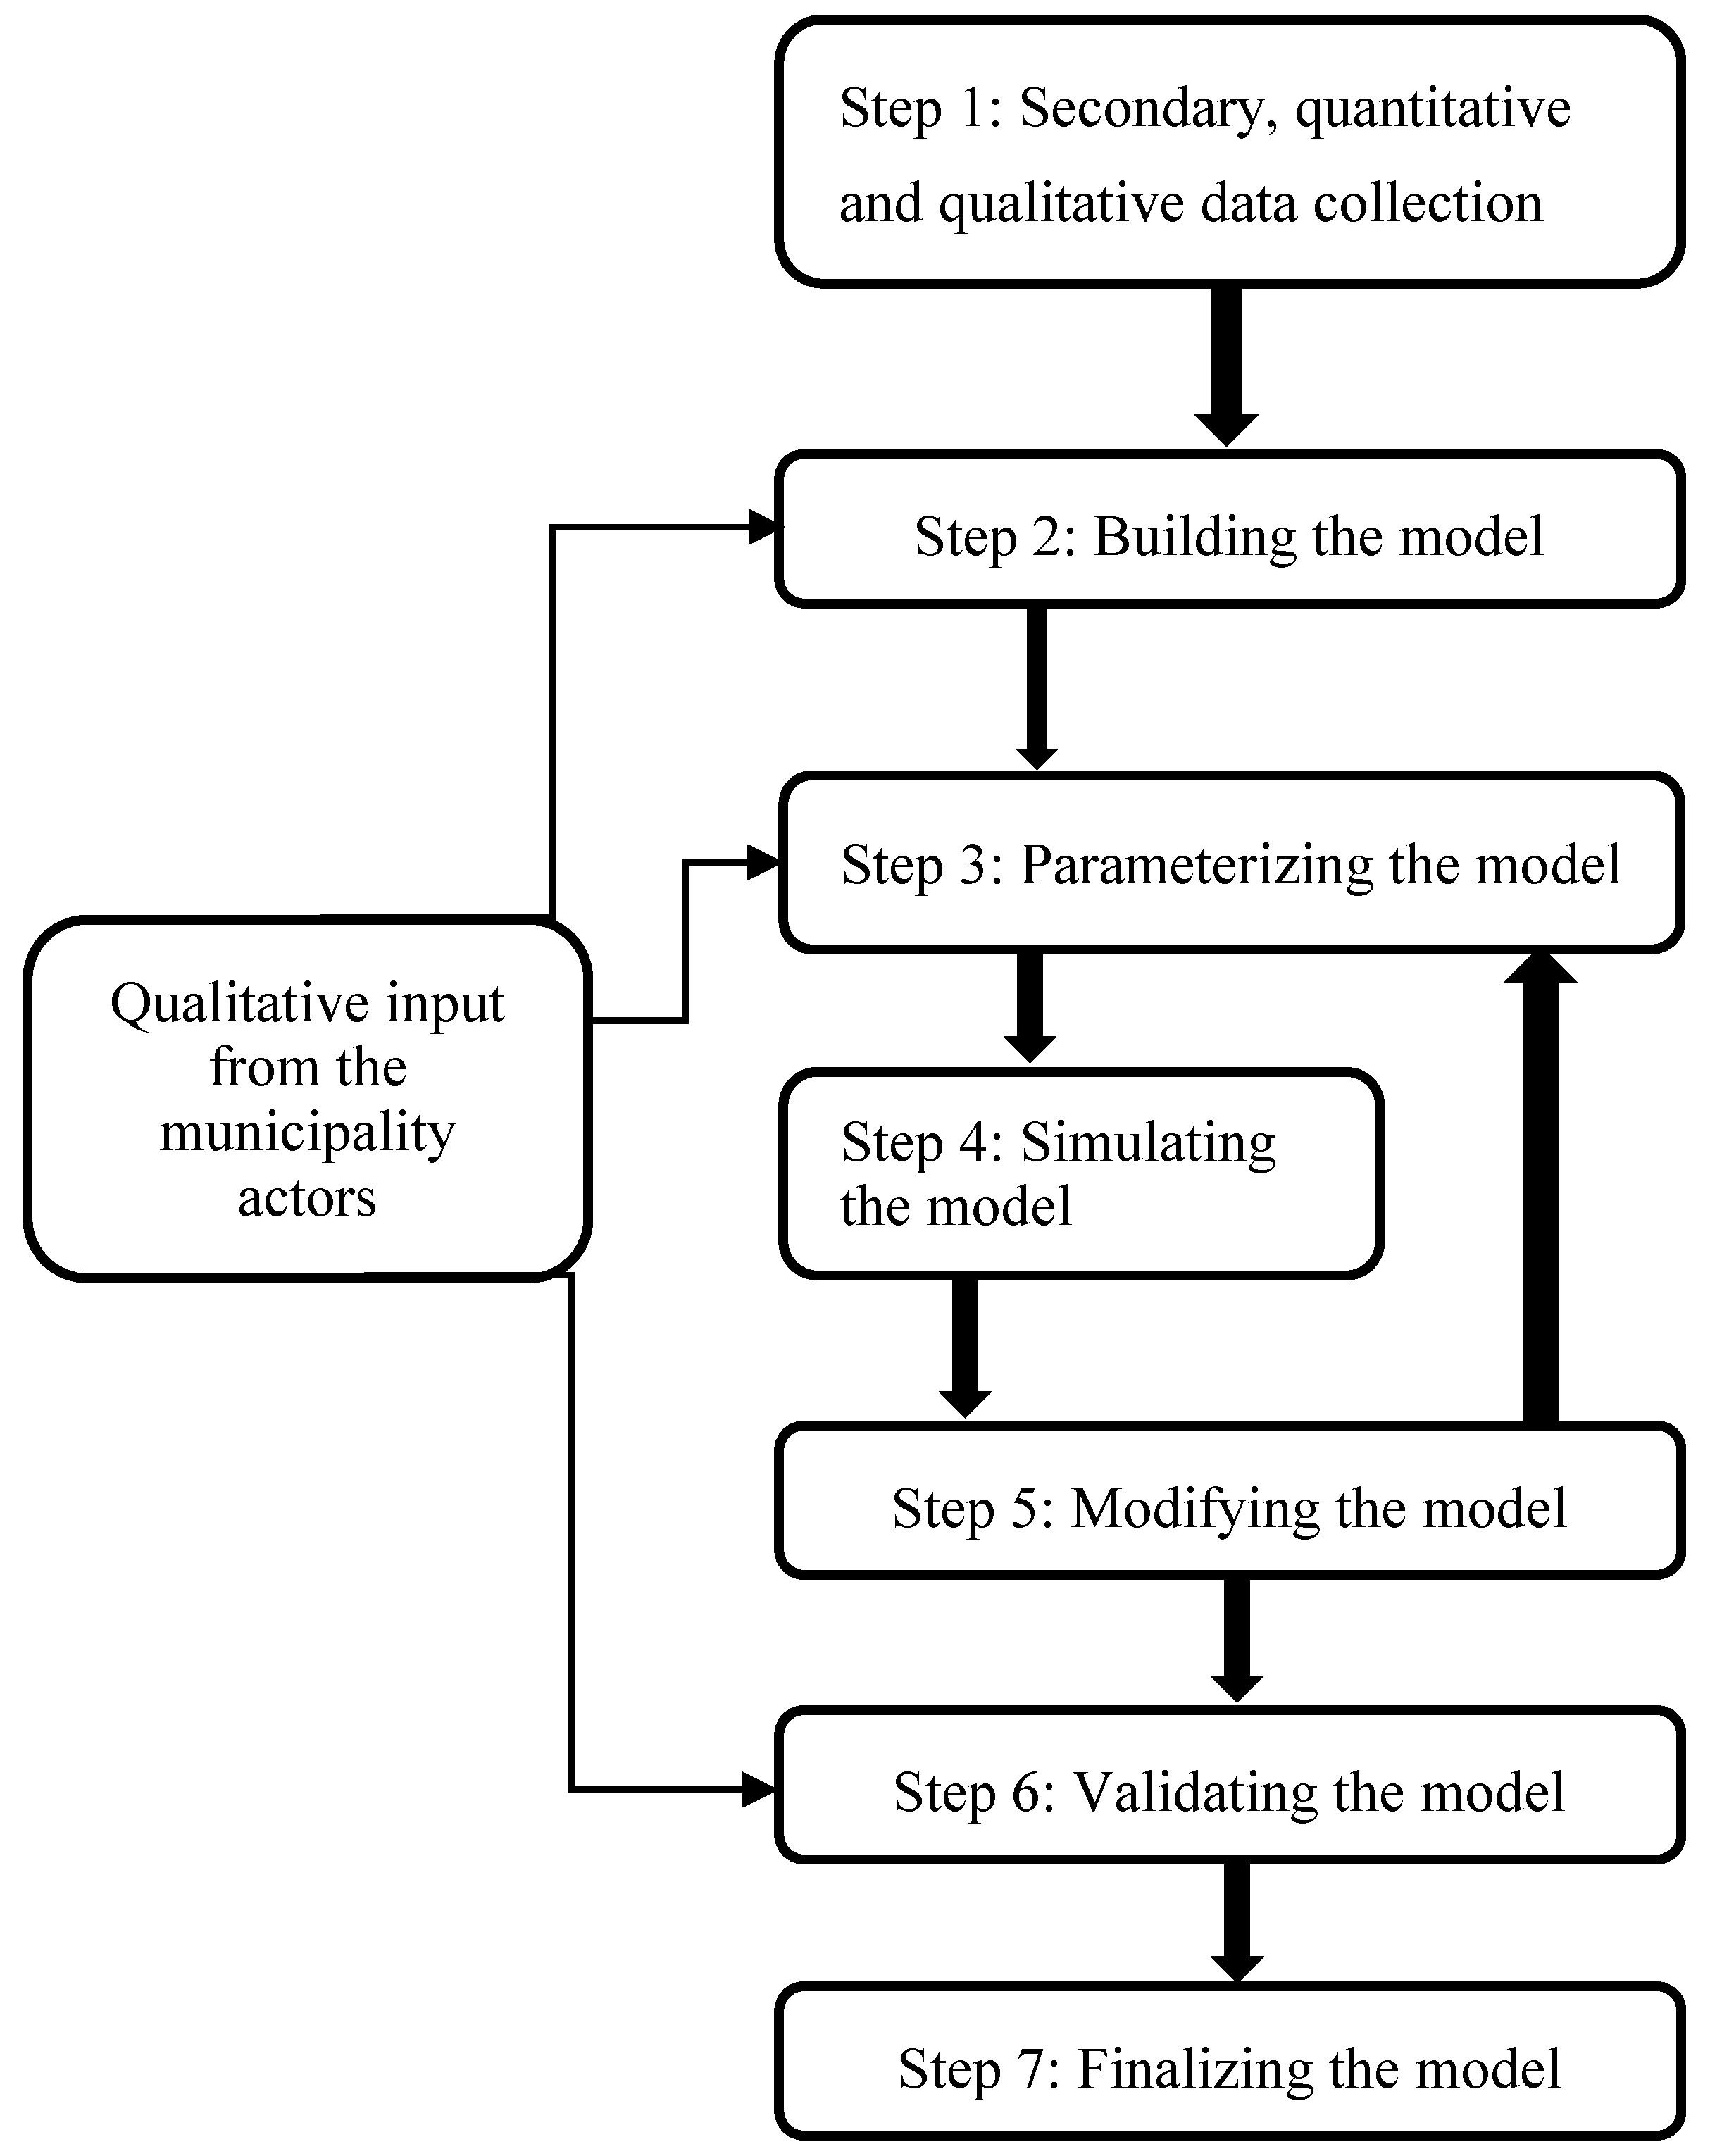
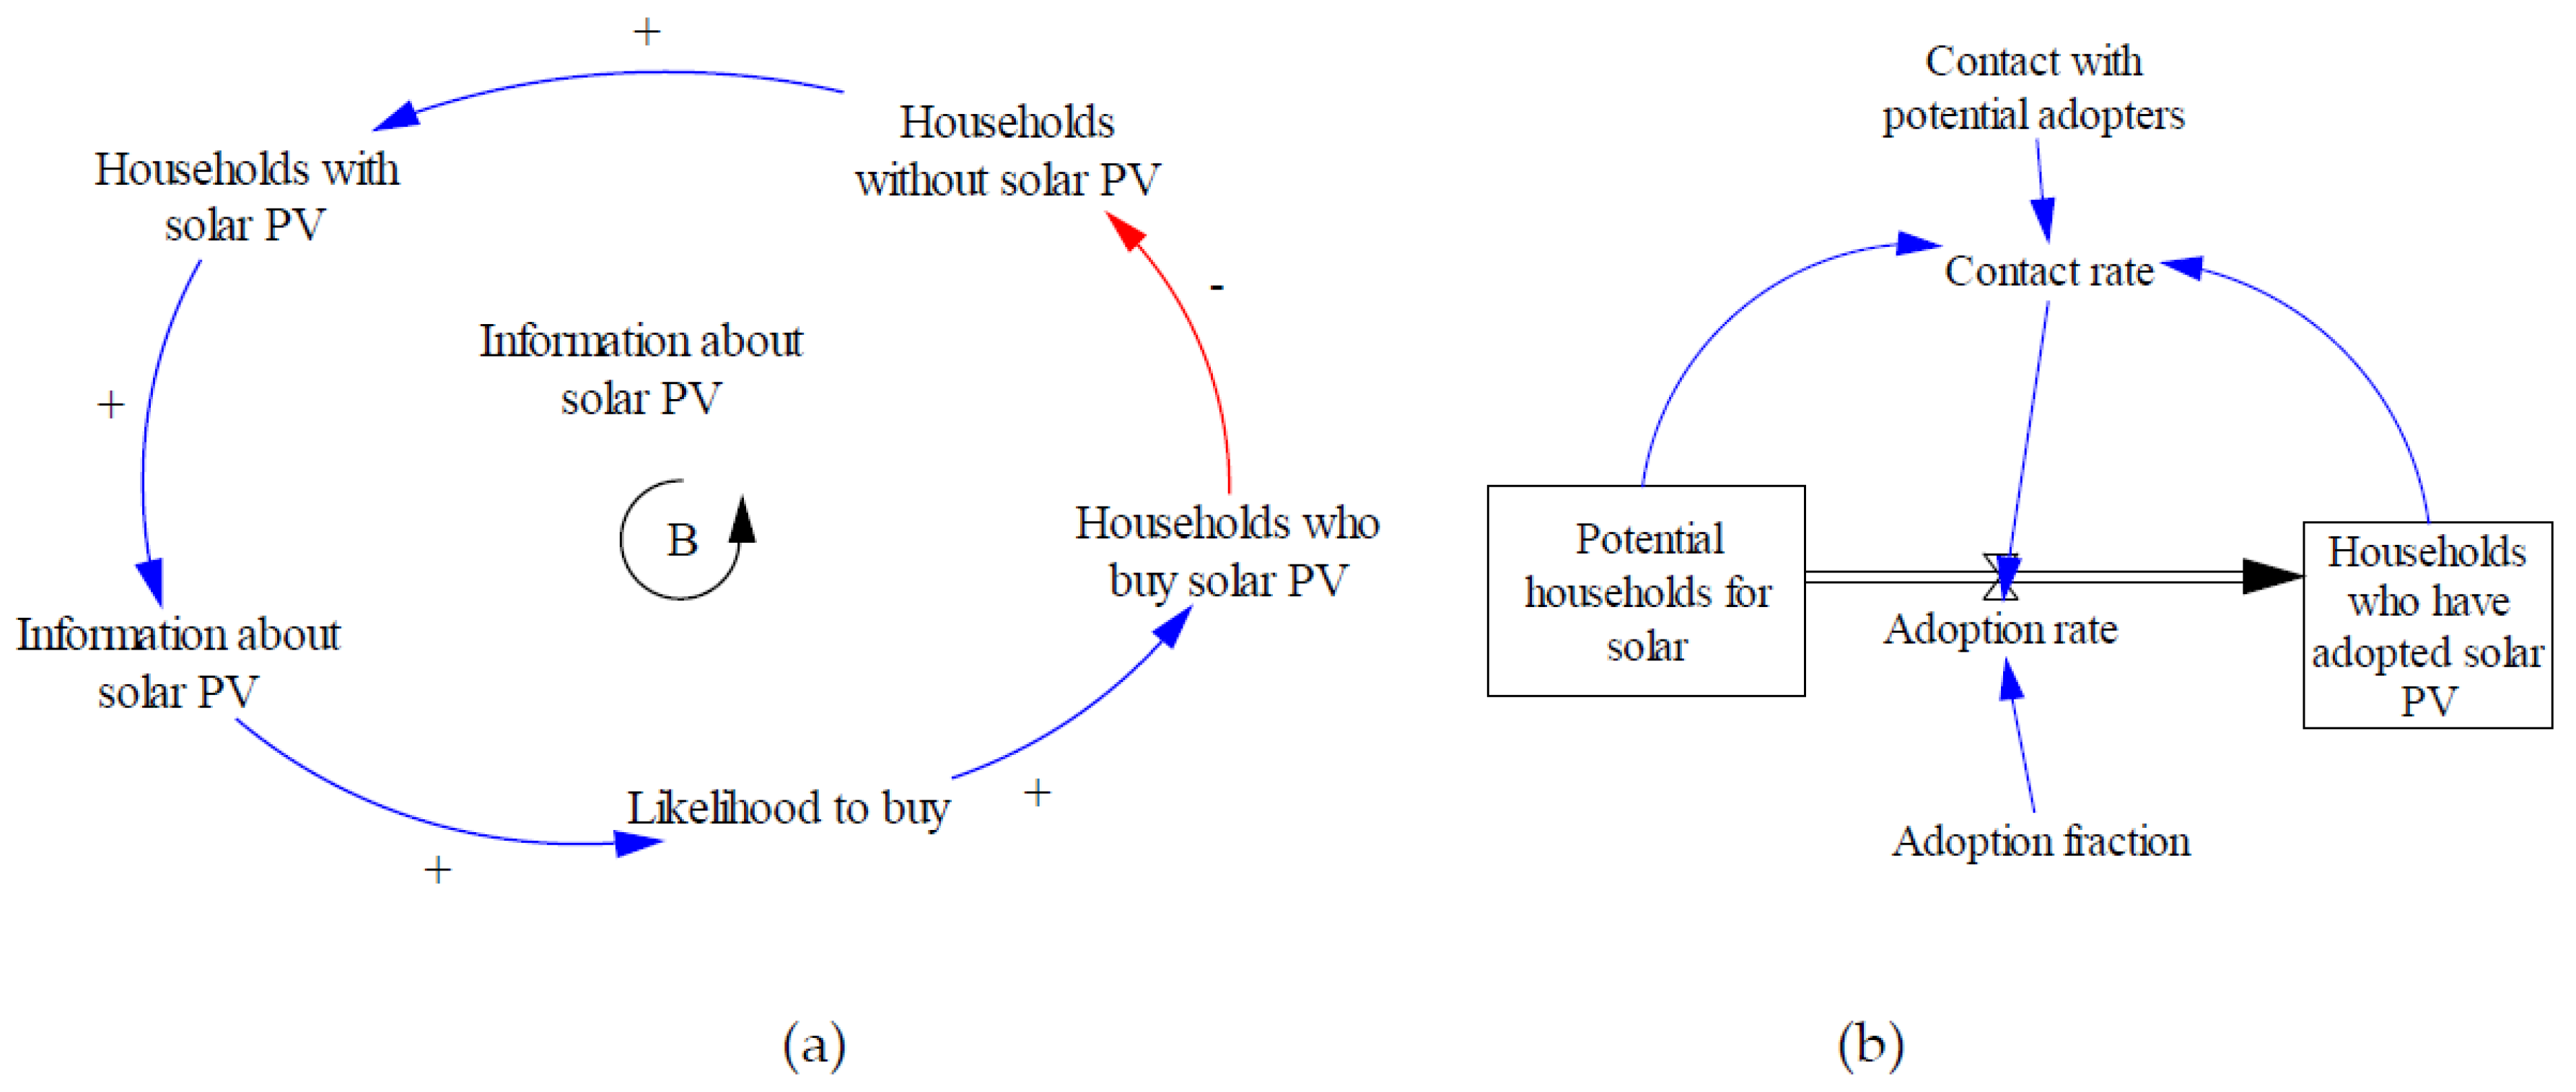
3.3.2. Steps 2–7: System Dynamics (SD) Modelling

SD modelling is closely aligned with systems thinking; “the ability to see the world as a complex and interconnected system” [47].
SD modelling is a quantitative methodology which can elicit the complex relationships between the different actors and their impact on the diffusion of solar PV in Skåne. Without loss of generality, we characterize the diffusion of solar PV in Skåne as a local energy transition [7].
The process underpinning the SD modelling technique is well codified, according to Sterman [47]. It generally consists of the following steps: (1) referencing modes and background data related to the transition; (2) drawing up a mental model of the transition; (3) building the initial model, in our study entailing a causal loop diagram (CLD) and a stock and flow diagram (SFD); and (4) refining the model with validation. However, for this project, we followed a different work flow, with certain modifications.
We built the model, first starting with CLD, and then SFD. However, the CLD and SFD building processes were an iterative loop in this study, with qualitative input from the municipality actors. We not only followed the project the municipality actors are implementing and obtained data (both qualitative and quantitative), but we also obtained input into the models we built from the municipality actors. This unique model–real life case causal relationship follows Figure 1 and Figure 2.
CLD consists of variables connected by arrows denoting the causal influence among the variables. These variables are linked by causal links, shown by arrows. A causal link can have a positive or negative polarity. A positive polarity implies that an increase in one variable results in the increase in the connected variable. Conversely, a negative polarity implies that increase in one variable results in a decrease in the connected variable. Likewise, loops can also be positive or negative. Positive loops are called reinforcing loops and negative loops are called balancing loops.
In the SFD, the relationships between the variables need to be defined in the form of equations. While the adoption rate and its equation containing the potential households for solar PV adoption and households who have already adopted solar PV, along with the contact rate and adoption fraction, were formulated according to Bass’ work, the other variables defined, which are unique to the solar PV diffusion in Skåne, needed to be formulated by us. We did this mainly through our modelling experience, observed/learnt outcomes (both scientific and real-life) and the expected model behaviour.
In this study, we built the initial CLDs and a simulatable SFD by reading literature on the diffusion process of technical products. Then, we read the project documents such as the “objective statement” of the municipality actors of the project, their project plan and their communication plan. Then, during a face-to-face meeting, we explained the CLD and SFD thus built and asked them to critique them. Thus, we obtained municipality actors’ opinions on the general structure of the model. Secondly, with that input, we built a detailed model, capturing the feedback loops underpinning the local energy transitions supported by their co-creation activities. Then, we had a meeting where we explained the detailed model built, along with the parameters and their values and meanings. We also presented some preliminary results from the simulation, to underscore the order of the effect of their co-creation activities. During this meeting, certain opinions and critiques were expressed by the municipality actors, which led us to make changes to the detailed model and come up with a final model. The SD model was built using proprietary SD modelling software called VENSIM (see http://vensim.com/).

3.4. The Project Background

The project we followed is titled “Co-creating green transitions” (unless otherwise stated, all translations were done by the authors). This is an EU Interreg project. This project involves the cooperation of four municipalities in Sweden and Denmark, who embarked on a common project on co-creating green and sustainable transitions in the energy sector [37]. Out of the four municipalities, in this study, we focused on the solar PV adoption project in Skåne, Sweden. The original title in Danish is Samskabende Grøn Omstilling. More information about this project can be found at [48].
The “follow research” we undertook gave us unique insight into the formulation of a definition of co-creation, especially within the confines of local energy transitions. The project partners, who are the municipality actors (MAs), define co-creation as the “municipal and private actors’ joint efforts to solve common problems through constructive exchange and application of experience, resources, skills and ideas”. They also defined the five underlying principles of co-creation as being: (1) Transparency; (2) Common learning; (3) Energetic and active commitment; (4) Open and flexible processes; and (5) Dialogue [37].

4. Model Development Process
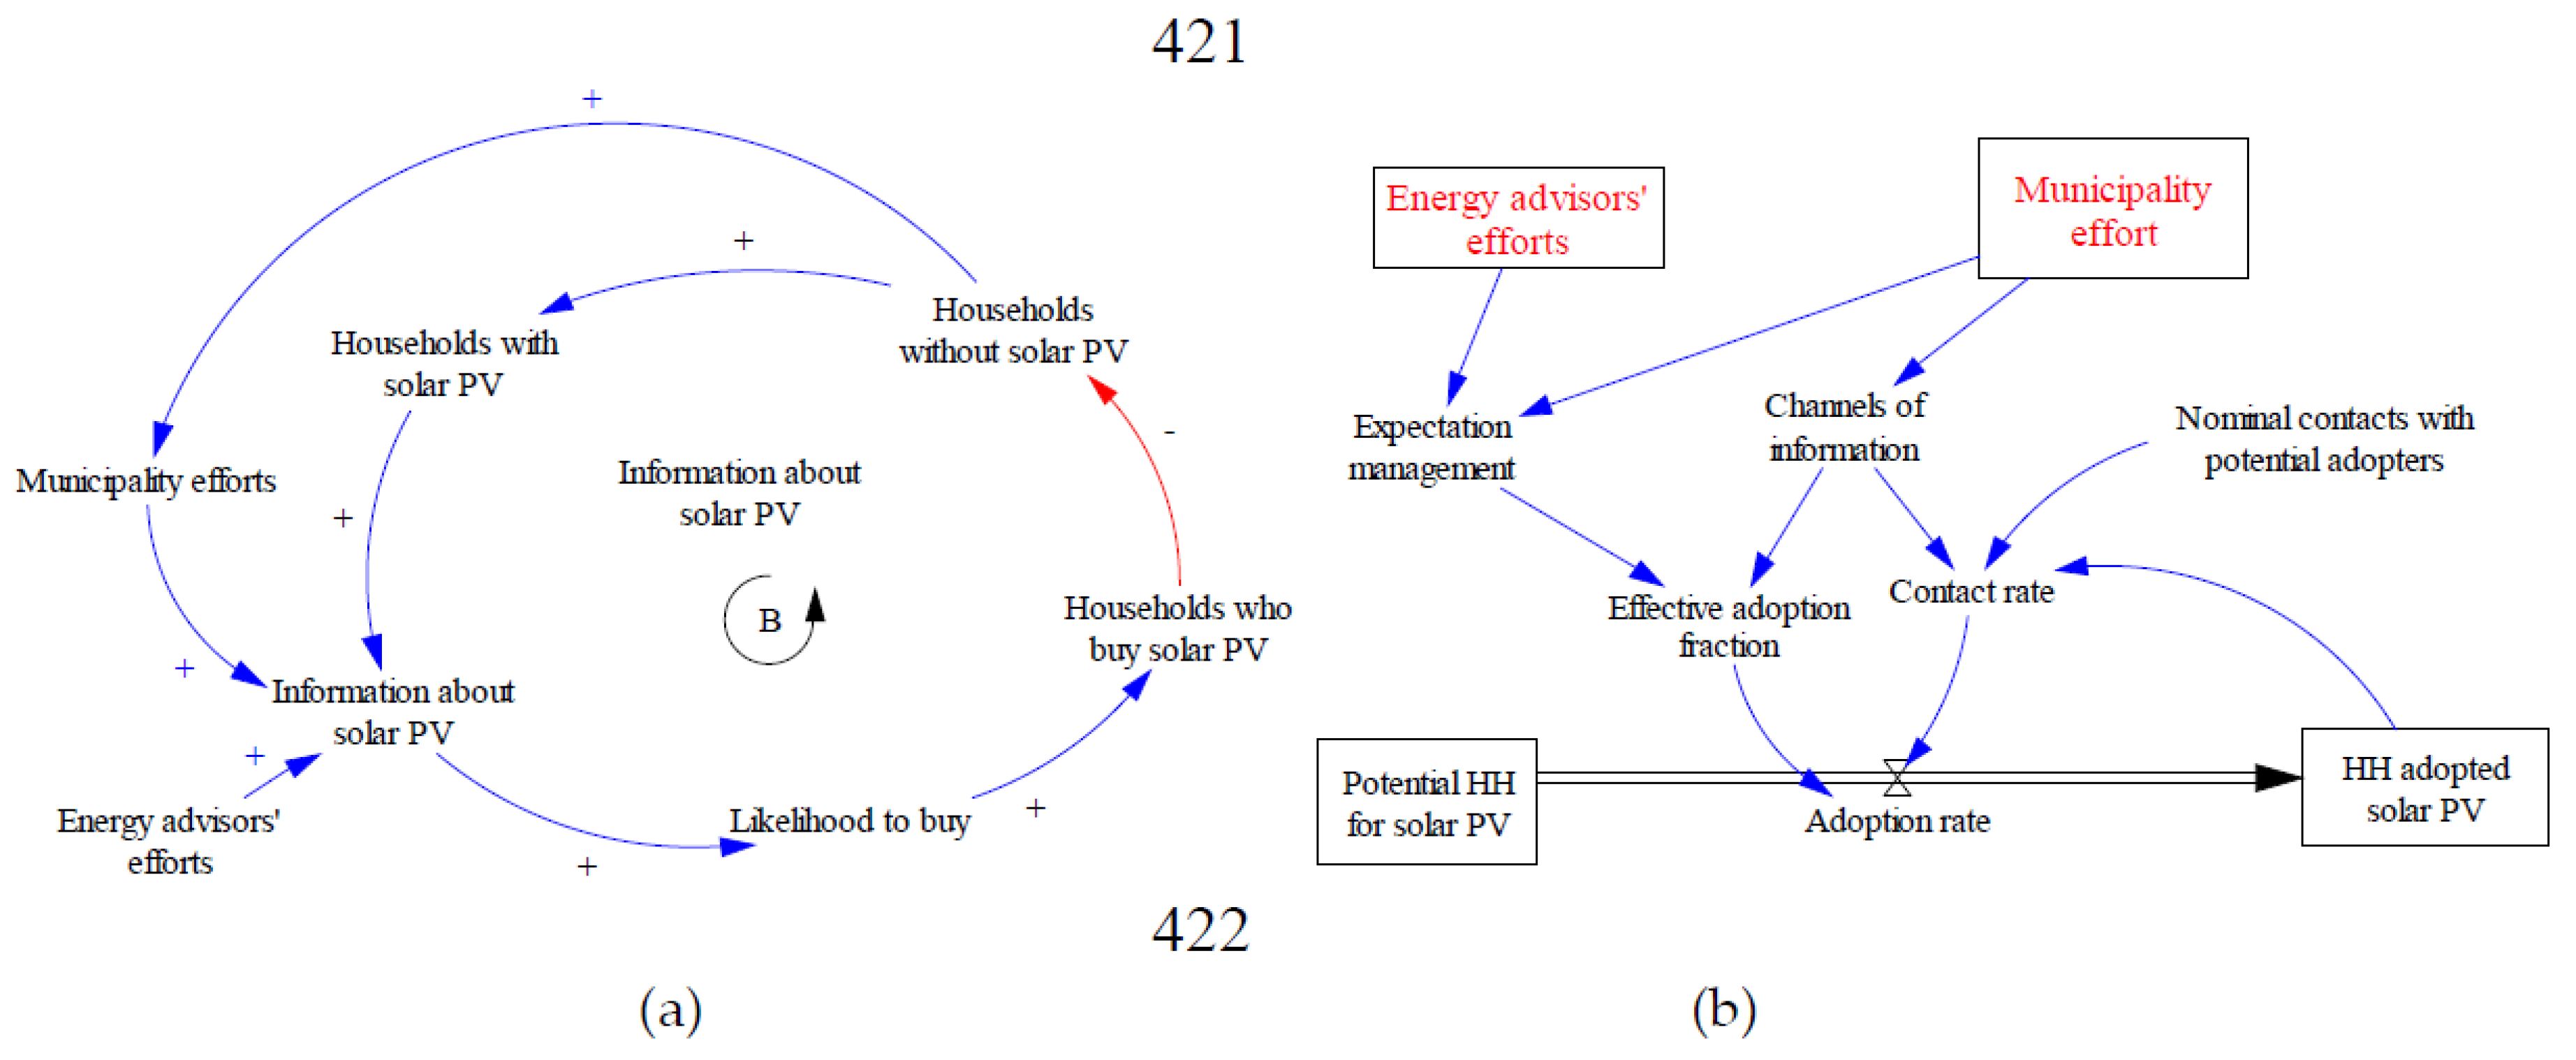
This section describes the model development process and the different model outcomes at each stage of the development process. It is important to bear in mind that the model development is undertaken to answer the question of how co-creation efforts in local energy transitions can be integrated into a model-based study of a transitions case.

4.1. Initial Model

The diffusion of solar PV systems for Sweden can be thought of as a technical product diffusion and thus, as the initial model, we adopted a simplified Bass’ model [49]. The CLD and SFD for the simplified initial model of diffusion for solar PV in Skåne are given in Figure 4. The potential households are single or two-family dwellings in Skåne, who have not installed solar PV systems at their homes. The potential households and households who have already installed solar PV systems in their homes are modelled as stocks, with the adoption rate being the flow, whereby potential households are converted to households who have adopted solar PV. The adoption rate is modelled as a function of the contact rate between potential households and households who have adopted solar PV, and the adoption fraction.
At this stage, after the development of the initial CLD and SFD, the project documents were read and inductively analysed. During this analysis, certain facts about the intended co-creation activities came to light.
The project documents conveyed that the MAs were going to seek the help of Energy Advisors (EAs), semi-independent advisors who help citizens belonging to a municipality get help and advice regarding energy matters. We also found that the MAs wanted the solution to the diffusion of solar PV systems to be “co-created”, and their definition of “co-created” was conveyed as “a discussion and a two-way street, rather than just advice from one person to another”. They also wanted an increase in the number of households who adopt solar PV in Skåne.

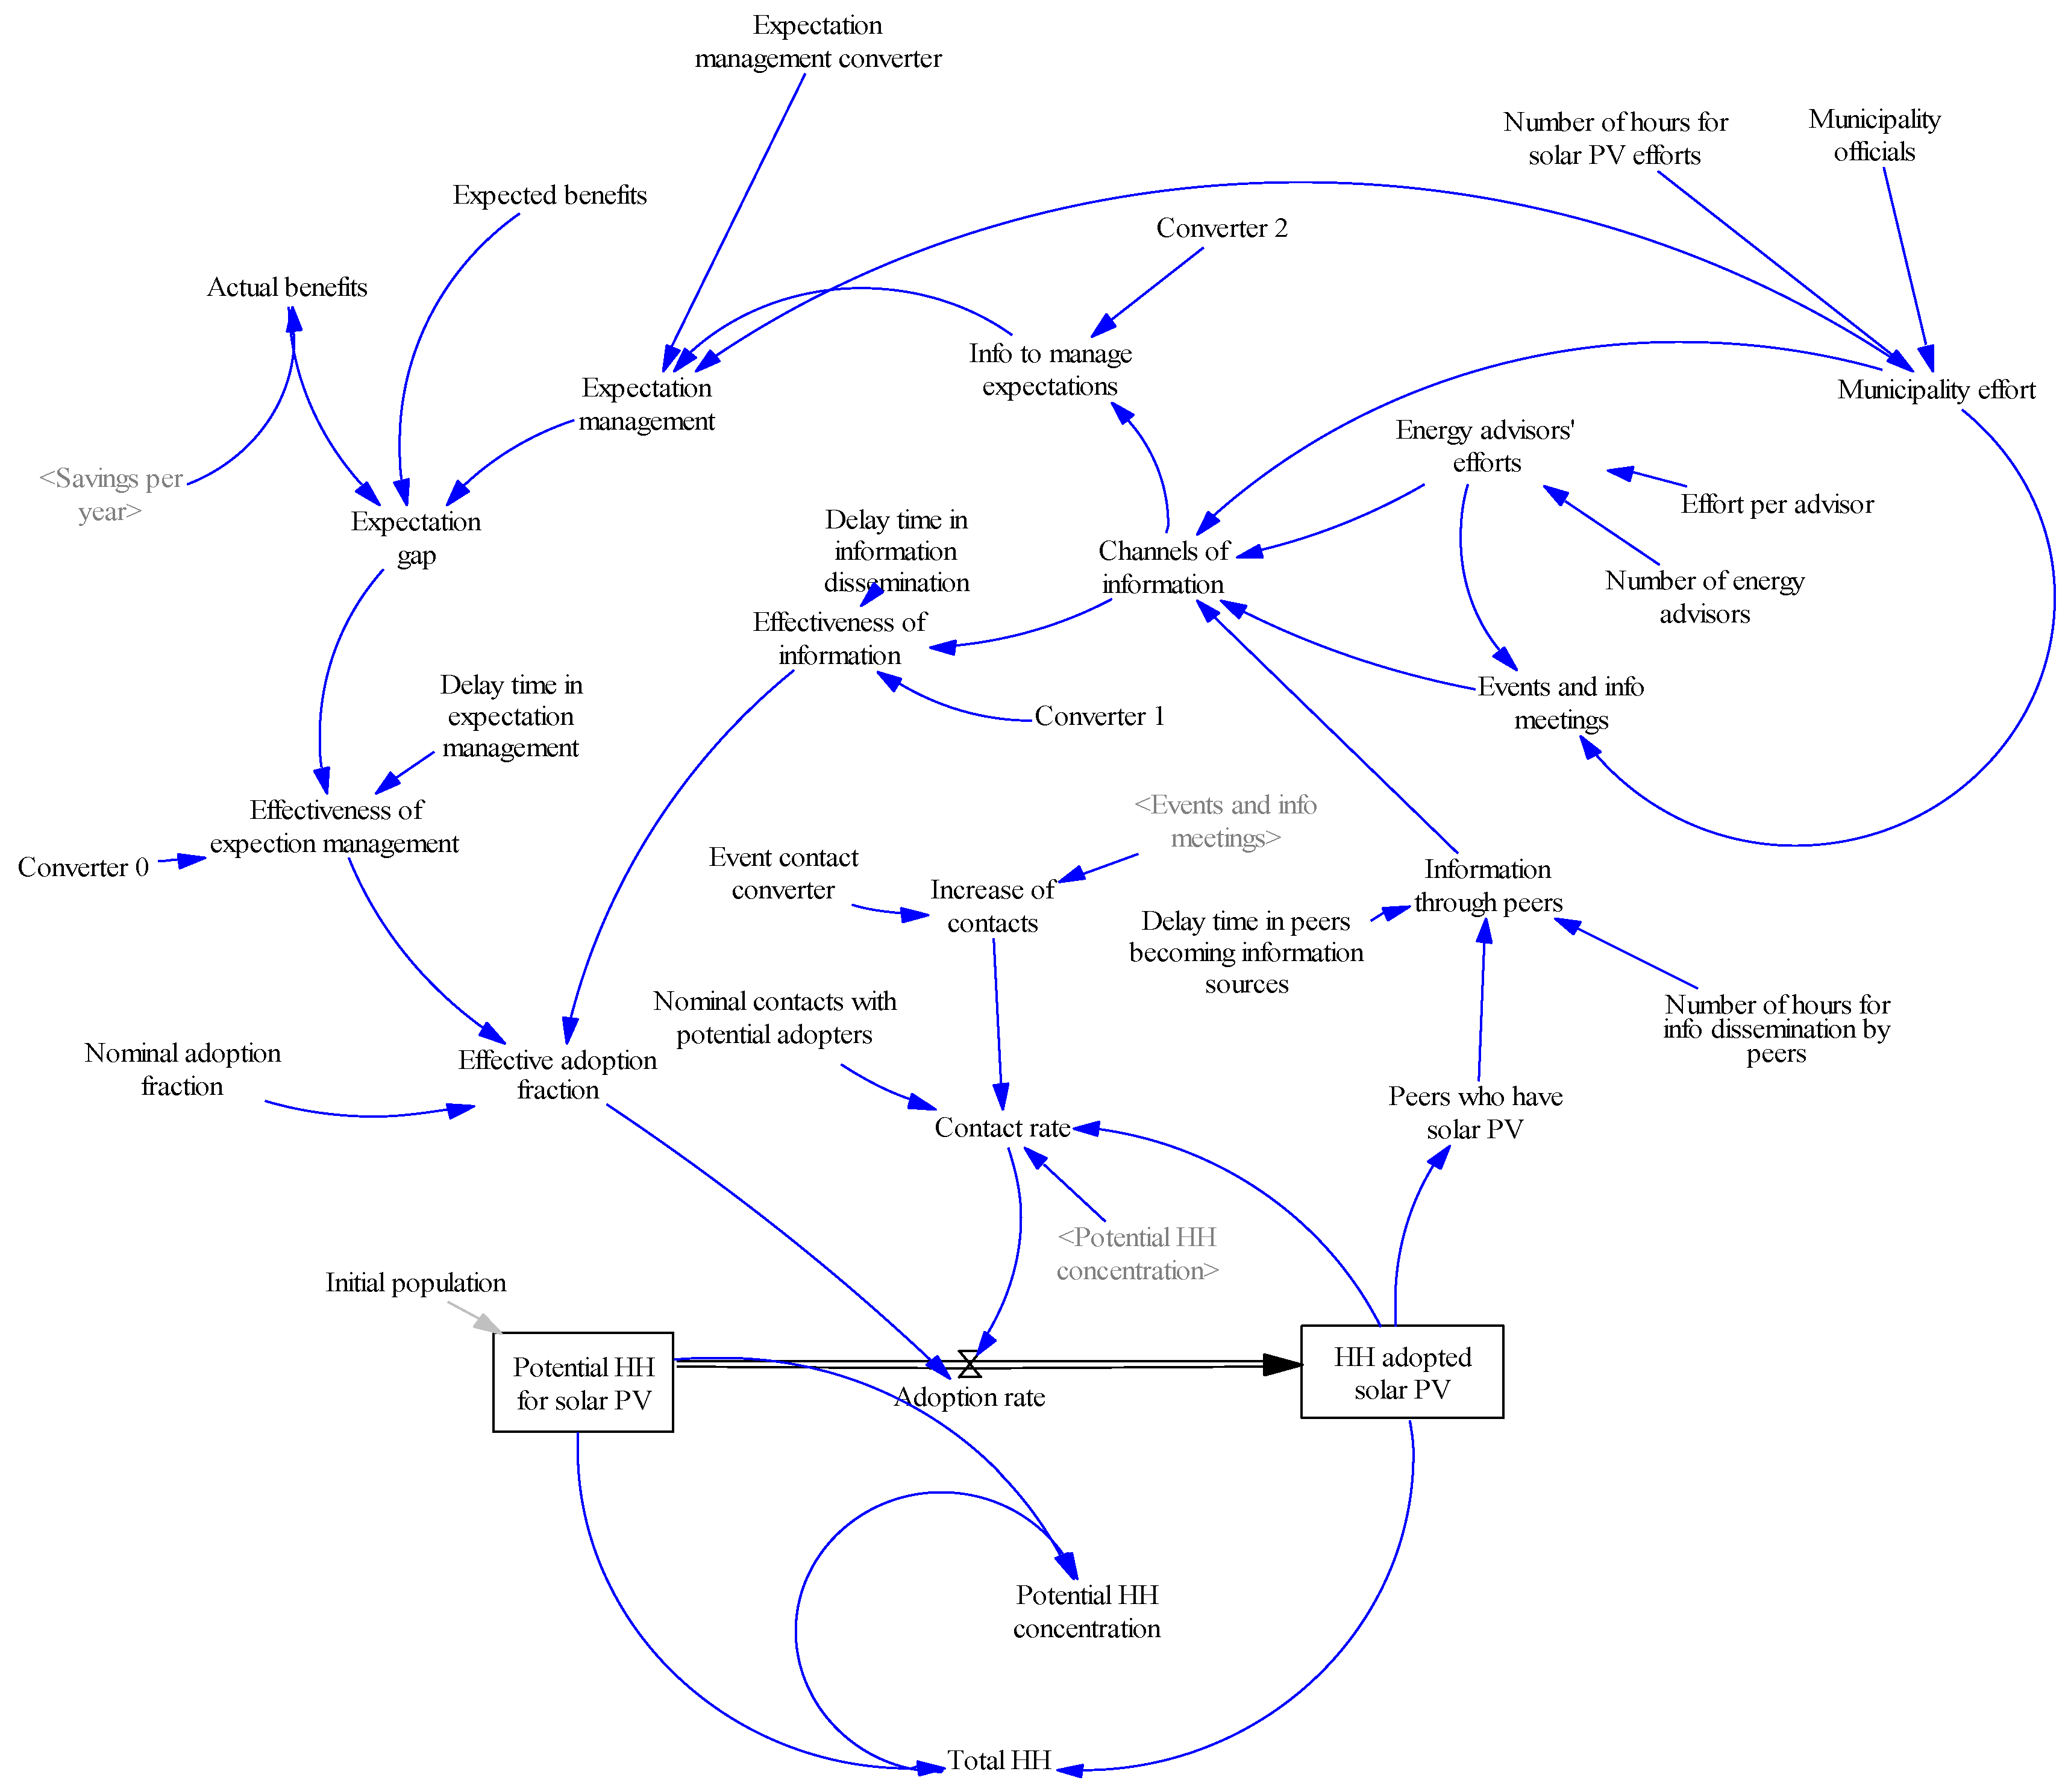
4.2. Iteration 1: First Discussion with the Municipality Actors

In the semi-structured interview (the semi-structured interview took place face-to-face on 11 May 2017) carried out with the MAs, we posed a question about how the EAs help the co-creation process, to which they answered the following about the EAs: “the energy advisors are generally independent and choose when to work with the municipality actors in the co-creation project. While they cooperate and collaborate, they do so on an ad-hoc basis, rather than in any explicitly pre-agreed upon way”.
Iteration 1: Identification of the causal relationships between the variables
Certain important facts were discovered by us during the discussion with the MAs. The MAs’ role could be sub-divided as:
  • Arranging information meetings and events
  • Acting to establish study circles, which act as long-term channels of information
  • Managing expectations directly, of citizens who inquire about solar PV for their homes
With this information, we developed a refined and brief CLD representing the co-creation activities, and a corresponding condensed SFD, which are given in Figure 5. We envision that the co-creation efforts work towards either increasing the contact rate or the adoption fraction of the flow-rate in the SFD. A fraction of the municipality effort creates channels of information which increases the adoption fraction and the contact rate. This is discussed further in Iteration 1: Model Development Section.
Iteration 1: Model development
The basic presumption in the CLD and the overview SFD (Figure 5) is that the actions of the municipality actors and EAs increase the factors which affect the adoption rate of solar PV systems; the Contact rate (the phrases appearing in bold herein are actual variables used in the model depicted in the figures) and the Adoption fraction. Thus, as shown in Figure 5, Municipality Effort (which denotes the co-creation efforts of the MAs) contributes to Channels of information which in turn leads to Effective adoption fraction (which is higher than the Adoption fraction in Figure 4 (right)). In addition, Energy advisors’ efforts go towards increasing Expectation management, which in turn contributes to Effective adoption fraction.
Figure 5 presents the municipality effort as positively contributing to the two factors which in theory influence the adoption rate of solar PV panels, which are the Effective adoption fraction and the Contact rate. We conceptualized this as Municipality effort creating Channels of information, which in turn increases the Effective adoption fraction and the Contact rate, and municipality effort managing expectations, which also increases the Effective adoption fraction.
The detailed SFD of the model submitted to the MAs is given in Figure 6. This model expounds the SFD given in Figure 5b. The equations governing the detailed SFD shown in Figure 6 are given in Table A1. The constant parameters for the variables are listed in Table A2.
Figure 6 gives the detailed SFD of the model developed after the first discussion with the MAs. In addition to the Municipality effort and the Energy Advisors’ efforts, the peers who have adopted solar PV systems also act as Channels of information, albeit with a time delay. This is given through the variable of Information through peers, with the delay being accounted for by the delay variable Delay time in peers becoming information sources, which is estimated at half a year.
The Municipality effort is divided into three key efforts: Events and info meetings, Expectation management and Channels of information. However, Channels of information is not only dependent on the Municipality effort, but also on Energy advisors’ efforts, Events and info meetings and Information through peers. While Municipality effort is exogenously given by us, the Channels of information changes over time, with the dynamics of adoption of solar PV.
The Municipality effort is the product of the number of Municipality officials and the Number of hours for solar PV efforts they have at their disposal. This information was obtained from the MAs. In addition, the Municipality effort is divided between establishing Channels of information towards Expectation management and organizing Events and info meetings. These divisions of their effort are translated into different impacts (Channels of information, etc.) by dimensionally consistent converters which are estimated by the modelers.
Likewise, Adoption rate is given as the product of Effective adoption fraction and Contact rate. The Contact rate here is the cumulative of the Nominal contacts with potential adopters, which is the contacts when there are no external factors influencing this and the increase due to the information meetings and study circles established by the co-creation effort, which is given by the variable Increase of contacts.
Unlike in the conventional Bass’ diffusion model, the Effective adoption fraction is the addition of the Nominal adoption fraction, Effectiveness of expectation management and Effectiveness of information. The rationale behind this is that the Effective adoption fraction can be thought of as consisting of two components: a constant component given by the Nominal adoption fraction, and a dynamically changing component made up of Effectiveness of expectation management and Effectiveness of information.
The Expectation gap is characterized as the difference between Expected benefits and Actual benefits. The Actual benefits is equal to the savings per year that is accrued due to the solar PV system for the household and we assume the Expected benefits is equal to the average yearly household electricity bill.
In the model, there are constants named as Converter 0, 1, etc. These are unit converters, and variables which are estimated to convert certain actions contributing as independent variables, to maintain dimensional consistency in the model.
This detailed model conceptualizes the different ways in which the municipality co-creation actions and efforts influence the adoption rate of solar PV. While the available information of solar PV increases due to co-creation efforts, it increases non-linearly with time, as the number of peers who have solar PV also increases the available information, and, through that, the diffusion of solar PV. This feedback is also important in the adoption of technological products, especially once the co-creation efforts stop. On the other hand, the co-creation efforts involving potential households and households who own a solar PV increases the contact rate between the two categories of households and increases the effective adoption fraction as well.
The parameters given in Table A2 were estimated by the modellers, while ensuring dimensional consistency and reasonable model behaviour.
Incorporation of techno-economic details into the model
As noted in the previous section, managing the expectations of the citizens who inquire about solar PV systems is also an activity that is done through the co-creation activities. To capture the expectations of the prospective adopters of solar PV systems, it is essential to convert that expectation into techno-economic terms, especially monetary terms. In addition to the base model given in Figure 5, and the detailed SFD given in Figure 6, we modelled a separate sub-system called “Household cost dynamics”, which is given in Figure 7.
The “Household cost dynamics sub-system” model is governed by the equations and parameters given in Table A3. The Cost savings from solar PV is modelled as a stock, where the Savings per year (flow) accumulate. The Savings per year is equal to the Savings per unit of electricity produced by the solar PV panel multiplied by the total Units of solar PV electricity generated in a year.
The variables related to the cost of the solar PV were taken from published industry reports [50]. The subsidy grants parameter (Grants) was obtained from the Swedish Tax Agency website [51]. The price of electricity was extrapolated from the past year data [52].
We sent this detailed simulatable SFD model, with the basic diffusion model and the Household cost dynamics sub-system model to both the MAs, so that they could critique the model, in its structures and assumptions.

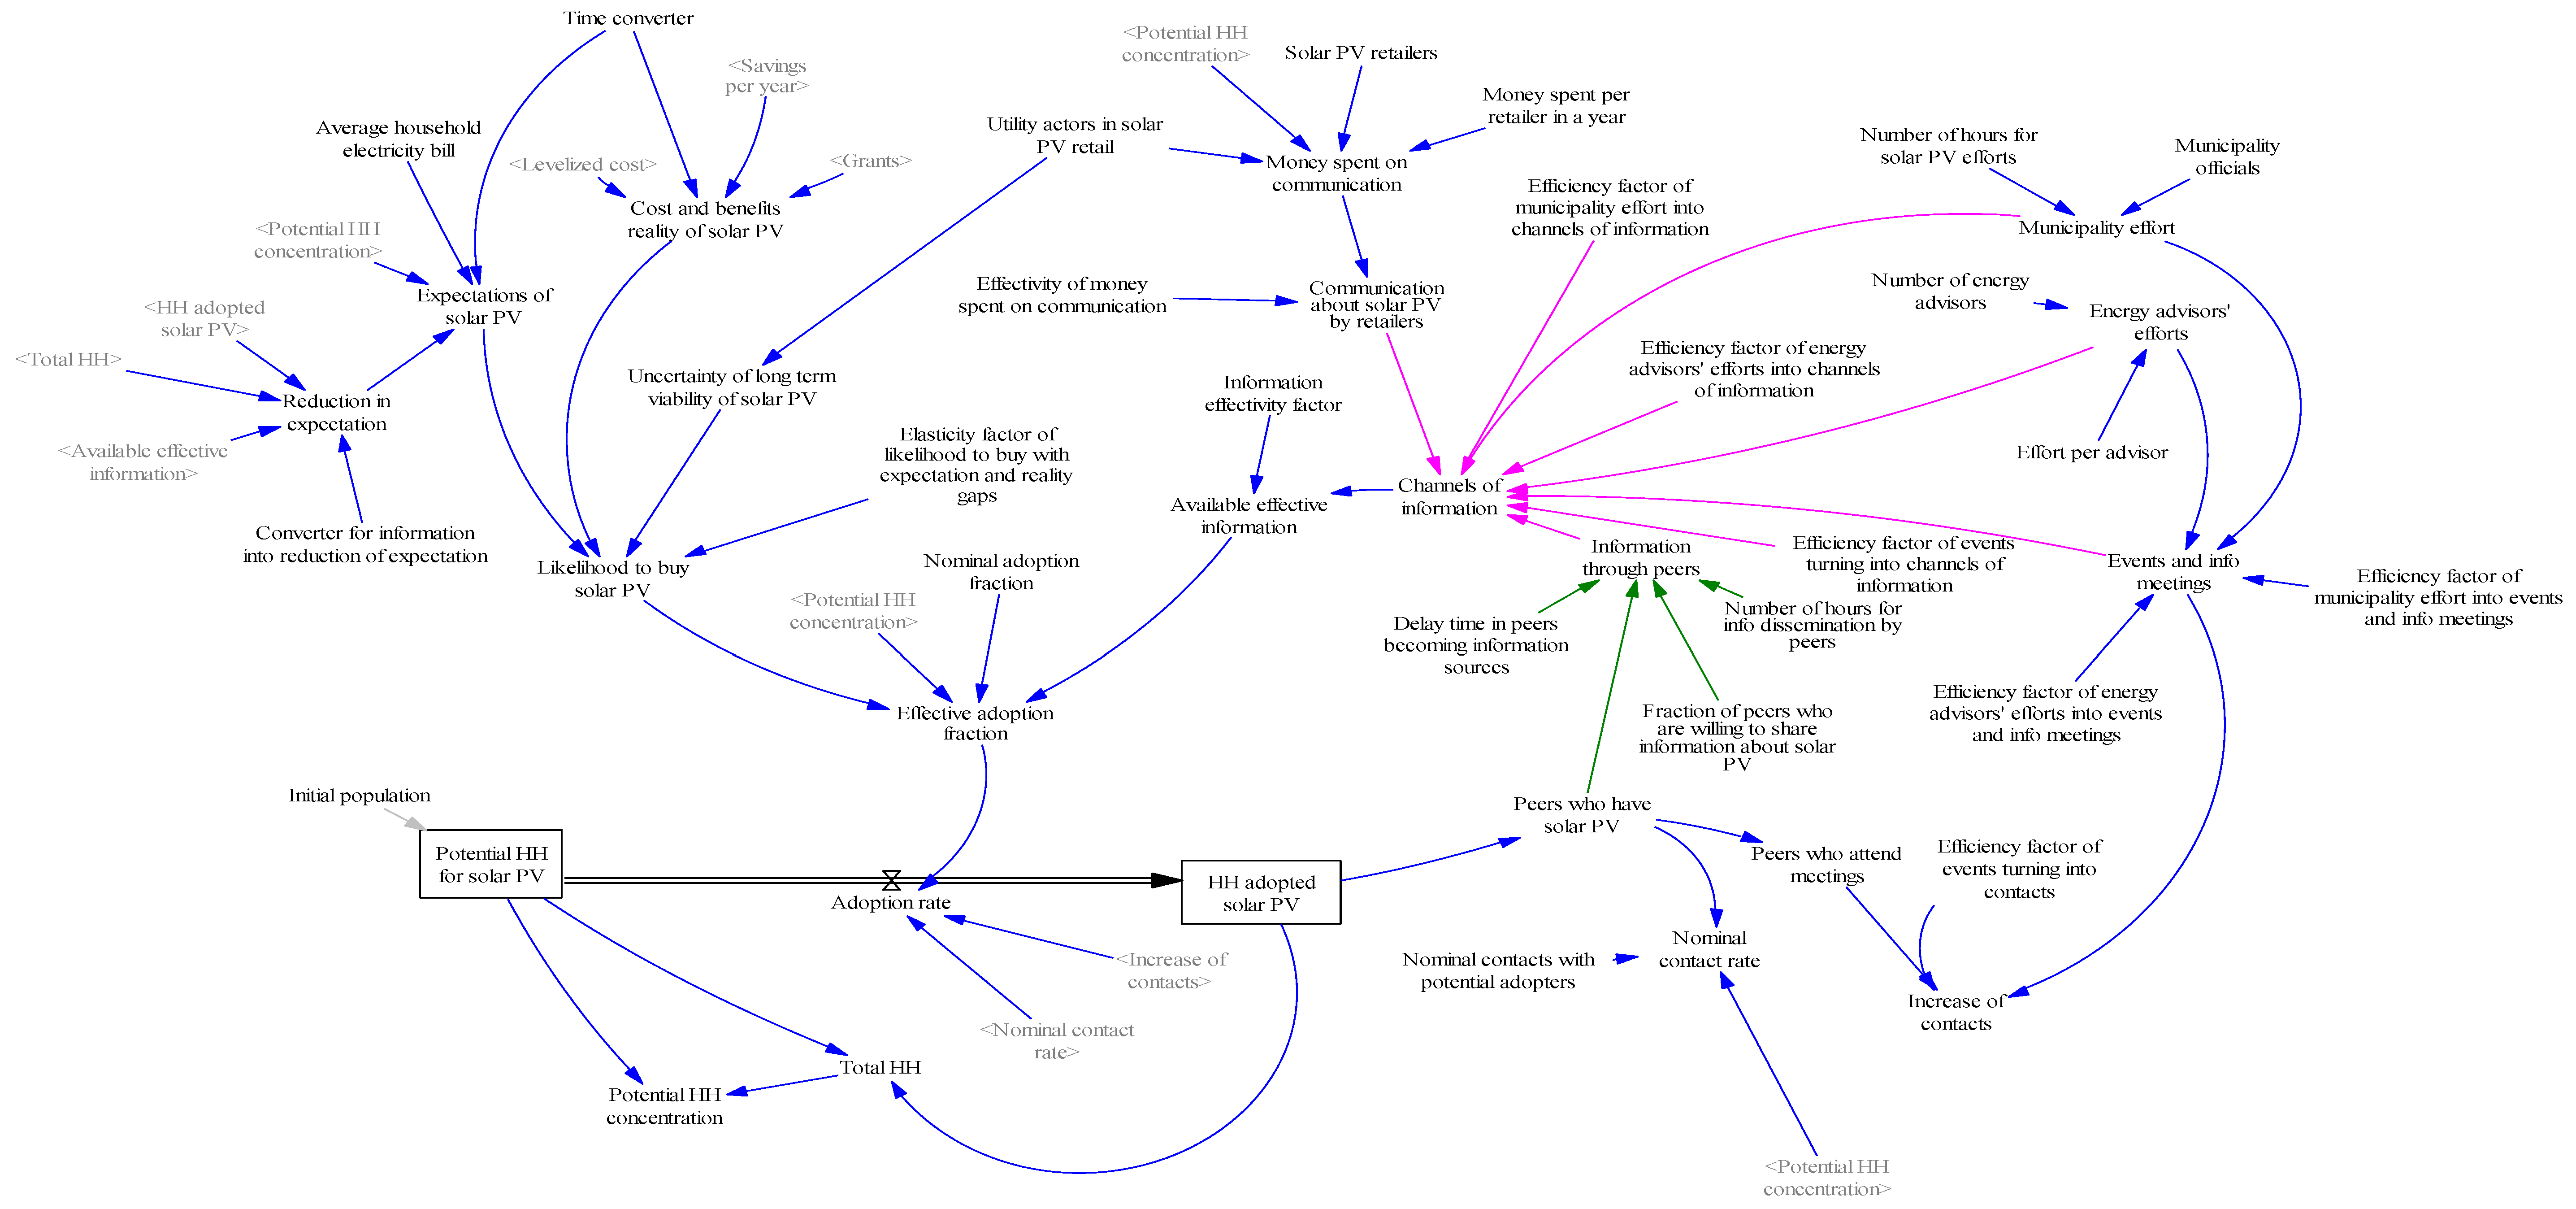
4.3. Iteration 2: Discussion with the MAs

The discussion which ensued (the second discussion took place over video-enabled VOIP platform on 4 December 2017 and lasted approximately 95 min) was recorded with the explicit consent of both the MAs. Both authors took part in the discussion.
The discussion and the comments were manually transcribed and inductively analysed. The essence of the discussion and the input the MAs provided are given below.
  • Inclusion of commercial retailers of solar PV panels in Skåne, and their effect on advertising and communication
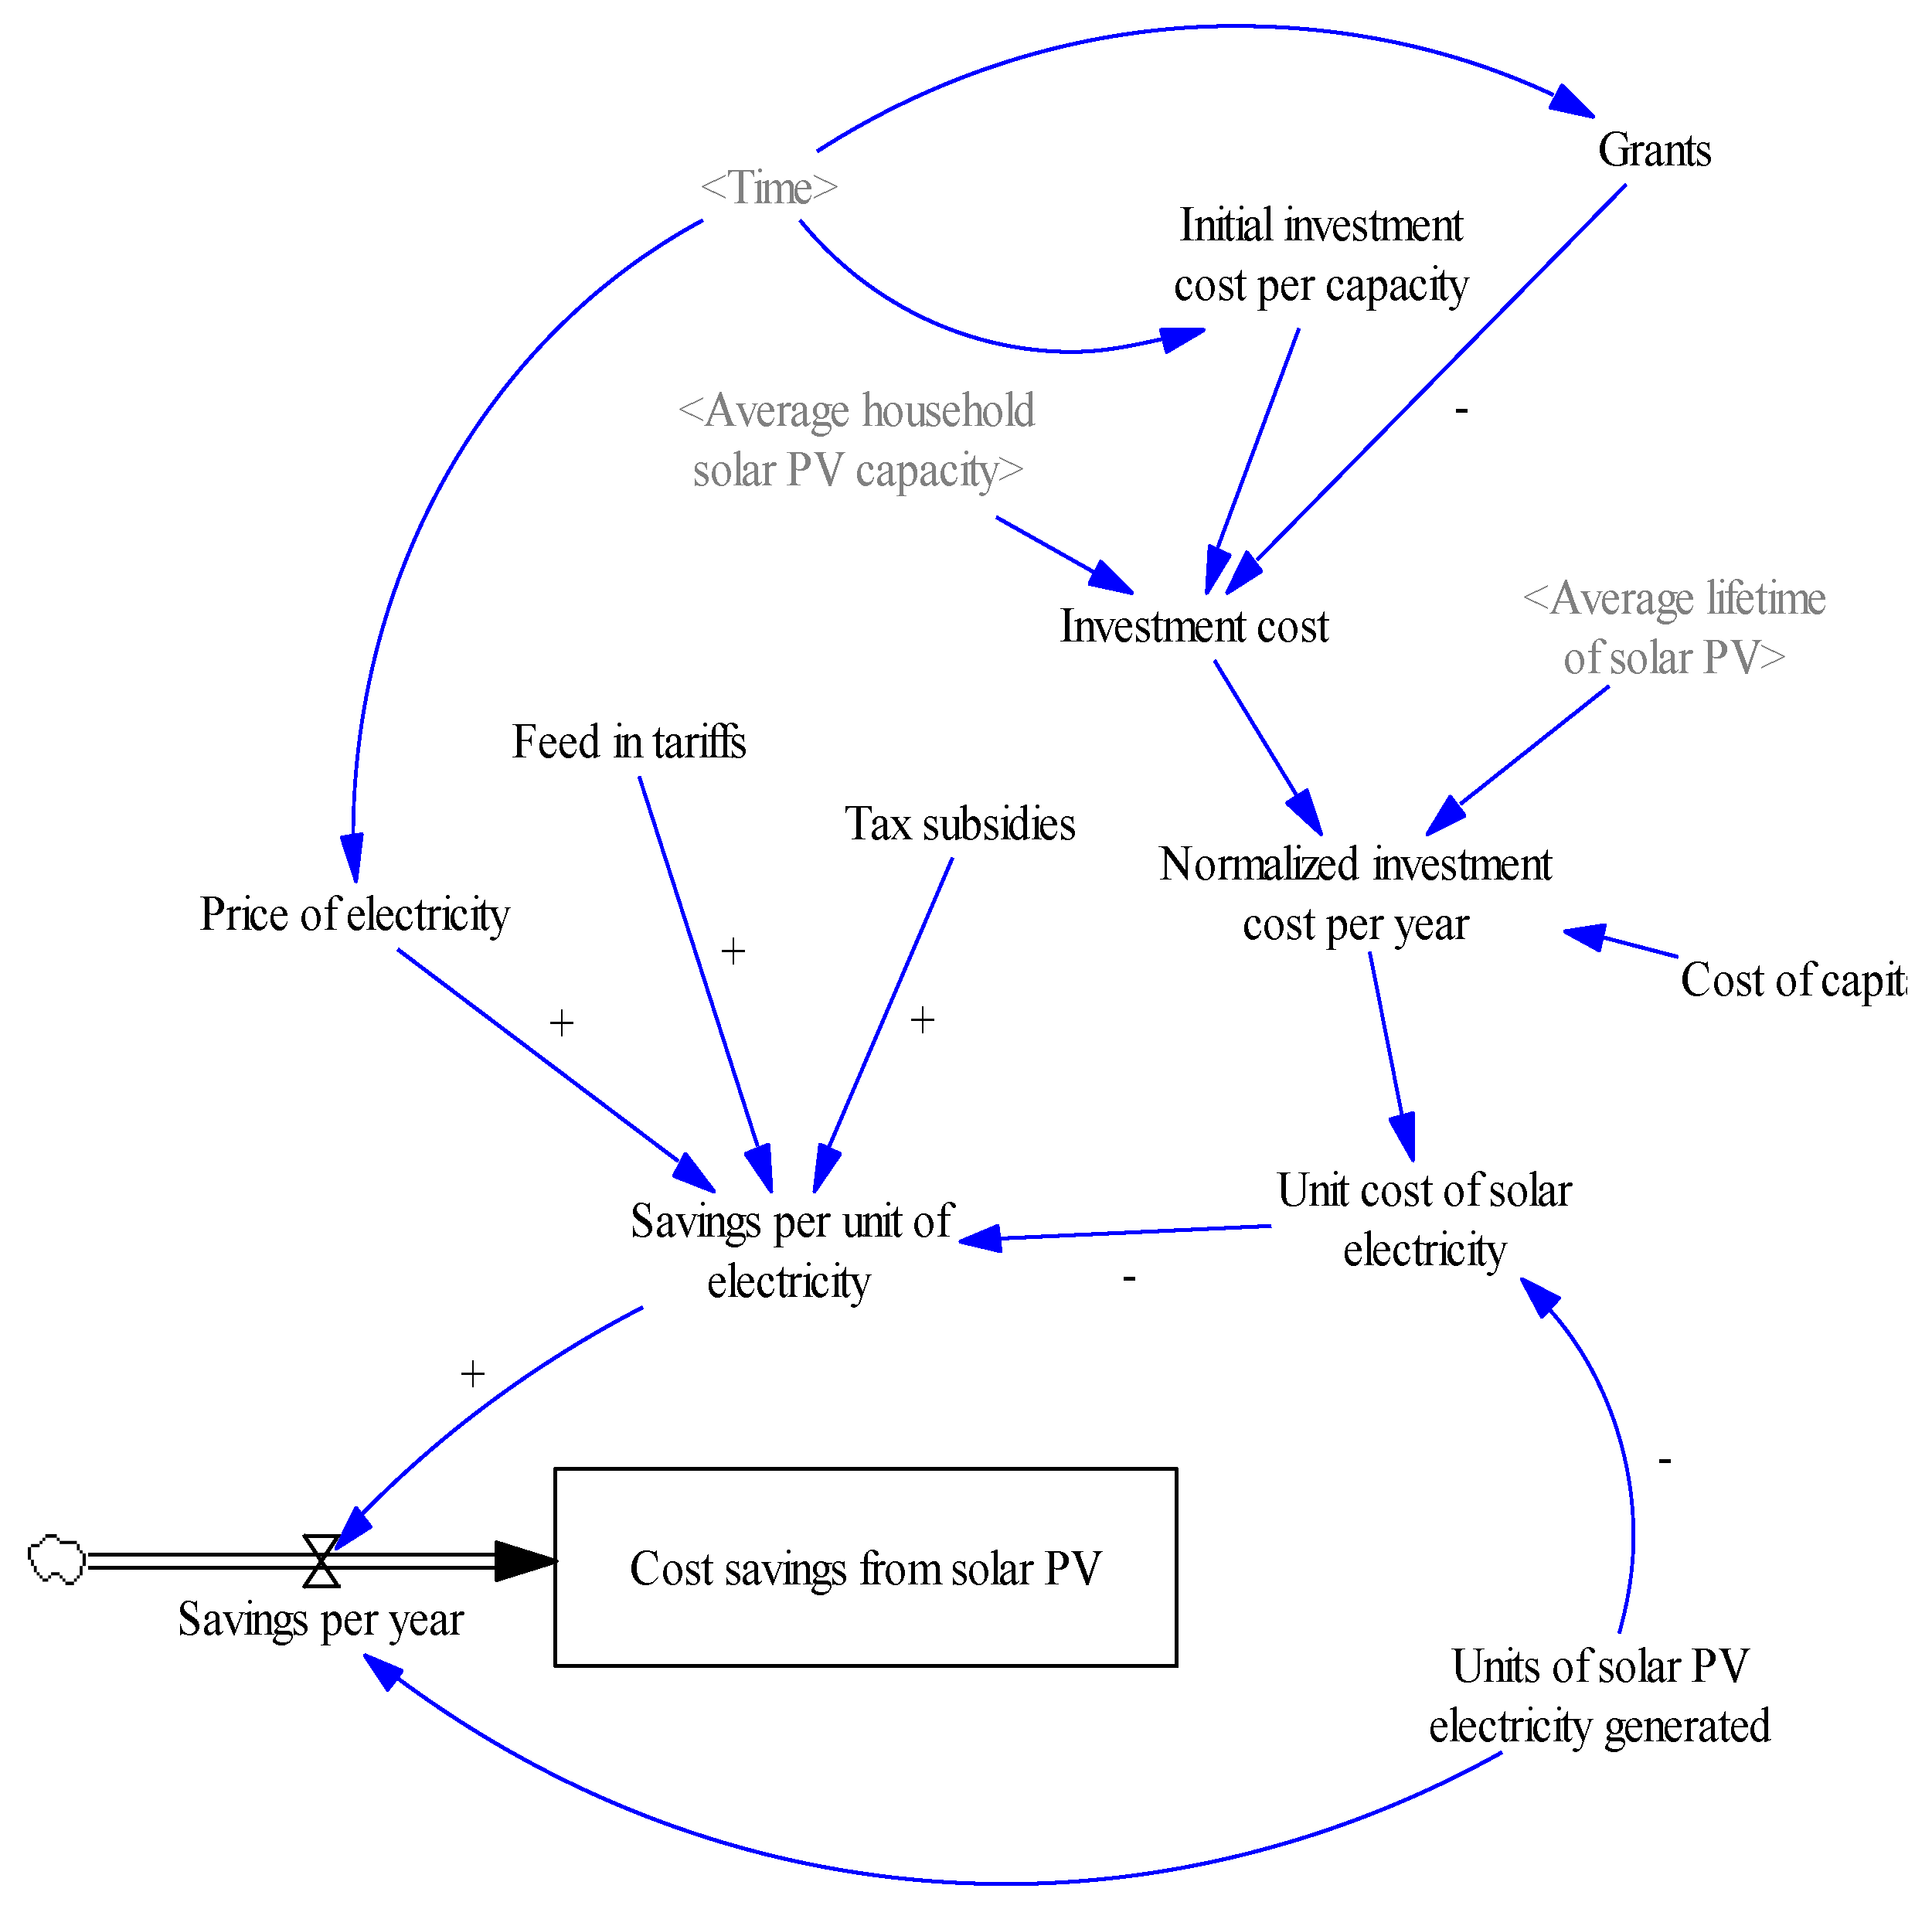
  • A more robust representation of expected and actual benefits and their linking to the adoption fraction.
The MAs wanted the name Feed-in-tariffs changed to spot price since it misrepresented the reality by suggesting that the Swedish government has a guaranteed price on electricity fed into the grid by micro-producers.
Iteration 2: Causal relationship and model development
The detailed SFD of the final model is given in Figure 8. The most significant changes in the Base model is given by the representation of the Likelihood to buy solar PV and the inclusion of the utility and solar PV retailers. As per the discussion with the MAs, we have included the Utility actors in solar PV retail and Solar PV retailers as contributing to the diffusion in two ways: they spend money on communication which increases the Channels of information and Utility actors in solar PV retail also reduce the Uncertainty of long-term viability of solar PV, which goes onto increase the Likelihood to buy.
There is another structural change made in the final model as per the suggestions of the MAs. The Peers who attend meetings is artificially limited to 4000 in a year. This constrains the possible channels of information to an upper limit, through peers who have solar PV, in the future years. This was to restrict the possible exponential increase in the “buzz” created by solar PV, which the MAs believe will die down.
We changed the structure of the household cost economics too. As per the suggestion of the MAs, we assumed a proportion of electricity generated in the year as being self-consumed by the household having the solar PV system, and the rest being sold to the grid, which gives them the Spot price for solar electricity. We have assumed that currently in Skåne, the proportion is half and half, for the self-consumption and electricity being fed into the grid, respectively (see Figure 9).

4.4. Final Model

Figure 8 includes coloured segregation of what makes up Channels of information (pink) and Information through peers (green). The Channels of information are created through Municipality effort, Energy advisors’ efforts, Events and info meetings, Information through peers and Communication about solar PV by retailers. The Effective adoption fraction is equal to the Nominal adoption fraction plus the Likelihood to buy solar PV and Available effective information.
Unlike in the detailed model in the first iteration (Section 4.2), we have modelled the Municipality effort as contributing to only two outlets: Channels of information and Events and info meetings. However, at the same time, Channels of information leads to Available effective information, which increases the Effective adoption fraction and increases the Reduction in expectation dynamically, which in turn increases the Likelihood to buy solar PV.
The Likelihood to buy solar PV is the difference between the Cost and benefits reality of solar PV and Expectations of solar PV multiplied by the Elasticity factor of likelihood to buy with Channels of information and expectation and reality gaps and divided by Uncertainty of long-term viability of solar PV. Through Cost and benefits reality of solar PV, the model feeds back the savings possible through solar PV into the diffusion process, whilst at the same time considering the unrealistic expectations some residents have of solar PV, through Expectations of solar PV. The Uncertainty of long-term viability of solar PV is given as an estimate of the experiential curve (see the detailed equations in Appendix A). The Elasticity factor of likelihood to buy with expectation and reality gaps is estimated by the MAs. The rest of the equations and the relationships are presented in detail in Appendix A. As can be seen, this structure is different from the model given at the end of the first iteration. Certain feedbacks, such as the effect of retailers on the adoption process, even in a region at the sub-national scale can be significant.
In the final model, the Municipality effort is going towards creating Channels of information and conducting Events and info meetings. These Channels of information lead to higher availability of effective information, which in turn leads to the increase in the adoption rate. This increases the number of households who adopt solar PV, and these households in turn also act as Channels of information. The municipality co-creation efforts also see the EAs participating in the Events and info meetings. Thus, even if the co-creation efforts are discontinued, the initial channels of information can be sustained by the households who newly adopt solar PV, thus fulfilling information needs.
The available effective information also serves the purpose of dispelling the very high expectations associated with solar PV, which inevitably lead to the rejection of solar PV once its known that solar PV cannot match up to those expectations. As such, reduction in expectation leads to a more realistic expectation of solar PV, which in turn, with the reduction of uncertainty of solar PV, can lead to better adoption fractions among households who come into contact with solar PV owners.
Moreover, the Household cost dynamics model has also undergone considerable change, with the division of whether the produced solar electricity is consumed or fed to the grid. This split is significant for calculating the income from solar electricity, and thus affects the cost savings from the solar PV panel, and ultimately the payback period of the investment for each household.
The cost dynamics is driven by the investment cost and the investment cost’s contribution to Savings per year. In Figure 9, the flow rate of Savings per year is fed into the Likelihood to buy solar PV in Figure 8. This Savings per year is determined by the Investment cost. However, the Savings per year is also sensitive to the total cost of levelized electricity and the savings from the self-consumed and sold units of solar PV electricity. In the long term, given the reduction in investment cost per capacity, the savings increases and hence the likelihood to buy solar PV increases. Furthermore, more savings are possible through self-consumed units of electricity, as opposed to sold units of electricity, since the spot price for electricity, given the current market conditions, are lower than the price of grid electricity.

5. Discussion and Conclusions

This section presents the discussions related to extending the field of modelling of local energy transitions and incorporating co-creation activities into the model and conclusions from this study.
Model-based theory building
Sterman discussed the dictum that all models are wrong in his seminal work [53]. However, some models are indeed useful, if they are used for their intended purpose. Our model-based exploration was mainly carried out to examine the ways in which co-creation activities in Skåne could be represented in a model. Thus, in this article, we do not run simulations and draw conclusions as to the quantitative impact of co-creation efforts in this case but, rather, have articulated a possible way to incorporate co-creation efforts into a quantitative local energy transition model. Especially, with the methodology we have chosen, where we link the real-world case to the causal relationships driving the transition and then connect it to a SD model, we have used a hybrid theory-model linking methodology, with participation from a key stakeholder. Such a methodology was extensively discussed by Ulli-Beer et al. [20] who pointed out that there is always a trade-off between theory-building and case-specific model-building. In this study, we took a real-world case, and especially a real-world case with a hitherto unexplored phenomenon (co-creation), and tried to extend and generalize it with a model-building approach, with the participation of a set of key stakeholders. A theory-building approach, as is common in most socio-technical transition studies, is a top-down approach. A case specific analysis (even model-based) is a bottom-up approach. In this study, we took a specific case and attempted to generalize it through a model which also considers the transition dynamics, and other specific factors, thus leading to a hybrid approach. We surmise this is a step in a useful direction in terms of local energy transitions research. In conclusion, this study has posited a way to include co-creation efforts in a local energy transitions case, hybridizing theorizing through model-building with a specific real-world case.
The next step in this process may be a mechanism-based transition research methodology, as proposed by Papachristos [54]. As the author explained, a mechanism-based transition research methodology would integrate case study and modelling, and eventually simulation. Executing the simulatable model presented in this article and using the results to validate the theory postulated is a relevant methodology in transitions research.
The next question would be what other useful information such an SD model can give transitions scholars, the MAs and even other practitioners. Such a model can also be useful to understand the comparisons between co-creation efforts, and purely economic incentives such as increases or decreases to tax subsidies, etc. However, such comparisons are only possible if the model is accurate, relevant and structurally representative of the real-world feedbacks. Model validation is one of the ways of ensuring that the model is useful and accurate. While we have not explicitly carried out validation, it is relevant to point out that the inclusion of MAs and their input in to the model development process provides some qualitative validation in considering the real-world happenings.
Investigating in-depth cost dynamics through different policy scenarios is also a domain which is relevant for analysis through such a model built in this article. For example, Dehdarian and Racz [55] and Dehdarian [56] presented system dynamic models to highlight the policies and their cost dynamics in technologically complex household products. Such relevant policy analysis can also be undertaken by extending the current study in the future.
Key insights from doing this study
The exercise undertaken during this study has been helpful in garnering several key insights. We found the suggestions and discussions with the MAs very useful in understanding the social factors and processes which help in the diffusion of a technologically innovative product, such as solar PV. Many studies (e.g., [57,58]) have explicitly said that they do not know how much social processes, and efforts by municipalities and peers help or hinder such adoption rates, and the dynamics underpinning the social processes and adoptions. Moreover, surprisingly, the MAs also said that they found the discussions, and the explanation of the modelling variables and processes illuminating and very useful in undertaking the co-creation efforts. The “systems thinking” way we explained the models supposedly was useful for them to realize how co-creation was affecting adoption as well.
Representation of co-creation in the model
At the beginning of Section 2.1, we present four points that are hallmarks of co-creation processes, as told by Voorberg et al. [38]. At this point, we want to see if we have captured those four essential points in our model and explain how the activities of the MAs are contributing towards the process of co-creation in local energy transitions processes.
Co-creation processes should give lasting solutions to problems society face: in this study, the problem is self-sufficiency for energy needs, and the MAs act as advice-givers and knowledge dispensers. While the case we have studied here is tied to a single technology (solar PV systems), in reality it need not be tied to a single technology.
While giving advice and fostering dialogue, the fundamental nature of relationship between the MAs and EAs and the citizens has changed. This is the second hallmark of a co-creation process. At the same time, the citizens and other stakeholders are engaged in the creation of the solution to the problems. While we have captured some involvement in the co-creation of the solution, through the participation of potential adopters and EAs, the model we have built is not capable of handling spontaneous co-creation processes, which brings us to the fourth point. Co-creation should not only be the production of solutions but also the process of innovation. In addition, it should not merely be an institutionalized production (see Section 2.1). We think the process of innovation and particularly the process of spontaneous co-creation cannot be captured in the model we have proposed. For example, the MAs mentioned that, while they were planning and carrying out some information meetings and study circles, an individual citizen from Djupadal, a neighbourhood in Skåne, approached them and expressed that he wants to start his own quasi-citizen movement which cooperatively focuses on solar electricity. The MAs decided to be passive observers, only giving advice if and when it was sought and not getting involved in the running of the movement. However, this spontaneous evolution is also part of the co-creation process, and cannot be objectively handled by the SD model we have built and presented in this study.
Conclusions
The aspects of co-creation undertaken in the local energy transitions study can be explored through a model that can capture the transitions dynamics, as shown in Section 4: Model Development Process. A significant outcome of this study has been the model development process presented. The inclusion of the real-life actors, in this case the MAs, in the model building process and the iterative linking of the real-world case to the model variables and the SD model is a methodological outcome of this study (see Figure 1 and Figure 2).
Another outcome was the way to integrate co-creation efforts into a model representing a local energy transitions case, which was also the objective of this study. The purpose of the model was exploration of co-creation actions in a local energy transitions case. For this, the model we built, with the input from the MAs, was built to reflect the municipality co-creation actions as factors that impact upon the transition dynamics. The co-creation actions were modelled explicitly, and how they impact on the diffusion process is represented. In addition, how these co-creation actions’ impacts can have feedback effects, such as increasing the adoption in the short term, leading to higher availability of information in the long term, which is a reinforcing cycle, is also represented in the model. Thus, in effect, a better explanation of how such a co-creation based local energy transition can differ from any other transitions process (local or otherwise) is given through this study.
Without the simulation of the stock and flow model (SFD) it is specious to come to any reasonable conclusions regarding the quantitative efficacy of the co-creation action or the quantitative impact it has on this particular diffusion process. As mentioned before, the objective of this study was to explore co-creation in the context of local energy transitions, using a model, rather than present the quantitative impact of co-creation or other such analyses. Considering this objective and the scope it defines, simulation results are not presented in this article. A further continuation of this study would entail simulating the detailed SFD model to answer questions regarding the quantitative impact of co-creation in the solar PV diffusion case in Skåne.

Author Contributions

Conceptualization, S.S. and E.O.A.; Methodology and Modeling Validation, S.S. and E.O.A.; Writing—Original Draft Preparation, S.S. Writing—Review and Editing, E.O.A.

Funding

This research was funded by EU Interreg project: Project Number: 20200803 Samskabende Grøn Omstilling (Co-creating green transitions) and by the Swedish Energy Agency.

Acknowledgments

The authors would like to thank the two municipality actors for their valuable time and willing participation towards this paper. The authors would also like to thank the other project members for their cooperation. The authors would like to thank the anonymous reviewers for their valuable comments.

Conflicts of Interest

The authors declare no conflict of interest.

Appendix A

Table A1. The equations governing the detailed SFD (Iteration 1) developed in the study (corresponding to Figure 6).
Variable NameEquationsUnit
Actual benefitsSavings per yearSEK
Adoption rateEffective adoption fraction × Contact rateHouseholds/Year
Channels of information(Energy advisors’ efforts × 0.01) + (Events and info meetings × 0.01) + (Municipality effort × 0.25) + Information
through peers
Hours/Year
Contact rate(Increase of contacts + Nominal contacts with potential adopters) × HH adopted solar PV × Potential HH concentrationHouseholds/Year
Cost savings from solar PVINTEG (Savings per year, 0)SEK
Effective adoption fractionEffectiveness of expectation management + Effectiveness of information + Nominal adoption fractionDimensionless
Effectiveness of expectation managementConverter 0 × (IF THEN ELSE (Expectation gap >= 0, SMOOTH (Expectation gap, Delay time in expectation management), 0))Dimensionless
Effectiveness of informationSMOOTH (Channels of information, Delay time in information dissemination ) × Converter 1Dimensionless
Energy advisors’ effortsEffort per advisor × Number of energy advisorsHours/Year
Events and info meetingsEnergy advisors’ efforts × 0.05 + Municipality effort × 0.05Hours/Year
Expectation gapExpected benefits-Actual benefits + Expectation managementSEK
Expectation management(Municipality effort × 0.5 × Expectation management converter) + Info to manage expectationsSEK
HH adopted solar PVINTEG (Adoption rate, 5000)Households
Increase of contactsEvent contact converter × Events and info meetings1/Year
Info to manage expectationsChannels of information × Converter 2 × 0.01SEK
Information through peersNumber of hours for info dissemination by peers × SMOOTH (Peers who have solar PV, Delay time in peers becoming information sources)Hours/Year
Municipality effortMunicipality officials × Number of hours for solar PV effortsHours/Year
Municipality officials2-STEP (2, 9)Dimensionless
Number of energy advisors12-STEP (6, 6 )–STEP(6, 12)Dimensionless
Peers who have solar PVHH adopted solar PVHouseholds
Potential HH concentrationPotential HH for solar PV/Total HHDimensionless
Potential HH for solar PVINTEG (−Adoption rate, Initial population)Households
Savings per yearSavings per unit of electricity × Units of solar PV electricity generatedSEK/Year
Total HHHH adopted solar PV + Potential HH for solar PVHouseholds
Table A2. The list of parameters of the initial simulatable model (Iteration 1 corresponding to Figure 6).
Variable NameParametersUnit
Converter 00.0000011/SEK
Converter 10.0000001Year/Hours
Converter 21Year × SEK/Hours
Delay time in expectation management0.5Year
Delay time in information dissemination0.5Year
Delay time in peers becoming information sources0.75Year
Effort per advisor1200Hours/Year
Event contact converter0.00051/Hours
Expectation management converter1Year/Hours × SEK
Expected benefits18,000SEK
Initial population270,000Households
Nominal adoption fraction0.05Dimensionless
Nominal contacts with potential adopters21/Year
Number of hours for info dissemination by peers2.5Hours/(Year × Households)
Number of hours for solar PV efforts750Hours/Year
Table A3. The equations and parameters governing the “Household cost dynamics” sub-system model (corresponding to Figure 7).
Variable NameEquations and ParametersUnit
Average household solar PV capacity5kW
Average lifetime of solar PV25Year
Cost of capital0.019Dimensionless
Feed-in-Tariffs0.5SEK/kWh
GrantsStochastic: (0,0), (25,20,000), (0,20,000), (5,10,000), (10,5000), (20,0), (25,0)SEK
Initial investment cost per capacityStochastic: (0,20,000), (25,20,000), (0,19,450), (1,19,450), (5,18,000), (1,16,000), (15,15,000), (20,14,500), (25,14,000)SEK/kW
Investment cost(Average household solar PV capacity × Initial investment cost per capacity) − GrantsSEK
Normalized investment cost per year(Investment cost × ((1 + Cost of capital)25))/Average lifetime of solar PVSEK/Year
Price of electricityStochastic: (0,0), (25,10), (0,1.7), (1,1.7), (5,1.8), (10,2), (15,2.2), (20,2.3), (25,2.4)SEK/kWh
Savings per unit of electricityPrice of electricity − Unit cost of solar electricity + Feed-in-Tariffs + Tax subsidiesSEK/kWh
Savings per yearSavings per unit of electricity × Units of solar PV electricity generatedSEK/Year
Tax subsidies0.6SEK/kWh
Unit cost of solar electricityNormalized investment cost per year/Units of solar PV electricity generatedSEK/kWh
Units of solar PV electricity generated900kWh/Year

References

  1. OECD. Together for Better Public Services: Partnering with Citizens and Civil Society; OECD: Paris, France, 2011; pp. 25–43. [Google Scholar]
  2. Bureau of European Policy Advisers(BEPA). Social Innovation—A Decade of Changes; BEPA: Luxembourg, 2014. [Google Scholar]
  3. Loorbach, D.; Frantzeskaki, N.; Avelino, F. Sustainability Transitions Research: Transforming Science and Practice for Societal Change. Annu. Rev. Environ. Resour. 2017, 42, 599–626. [Google Scholar] [CrossRef]
  4. Seyfang, G.; Hielscher, S.; Hargreaves, T.; Martiskainen, M.; Smith, A. A grassroots sustainable energy niche? Reflections on community energy in the UK. Environ. Innov. Soc. Transit. 2014, 13, 21–44. [Google Scholar] [CrossRef]
  5. Van Der Schoor, T.; Van Lente, H.; Scholtens, B.; Peine, A. Challenging obduracy: How local communities transform the energy system. Energy Res. Soc. Sci. 2016, 13, 94–105. [Google Scholar] [CrossRef]
  6. Süsser, D.; Döring, M.; Ratter, B.M.W. Harvesting energy: Place and local entrepreneurship in community-based renewable energy transition. Energy Policy 2017, 101, 332–341. [Google Scholar] [CrossRef]
  7. Selvakkumaran, S.; Ahlgren, E.O. Understanding the local energy transitions process: A systematic review. Int. J. Sustain. Energy Plan. Manag. 2017, 14. [Google Scholar] [CrossRef]
  8. Palm, J.; Thoresson, J. Strategies and Implications for Network Participation in Regional Climate and Energy Planning. J. Environ. Policy Plan. 2013, 16, 3–19. [Google Scholar] [CrossRef] [Green Version]
  9. Palm, J. Development of sustainable energy systems in Swedish municipalities: A matter of path dependency and power relations. Local Environ. 2006, 11, 445–457. [Google Scholar] [CrossRef] [Green Version]
  10. Beermann, J.; Tews, K. Decentralised laboratories in the German energy transition. Why local renewable energy initiatives must reinvent themselves. J. Clean. Prod. 2017, 125–134. [Google Scholar] [CrossRef]
  11. Ruth, M.; Özgün, O.; Wachsmuth, J.; Gößling-Reisemann, S. Dynamics of energy transitions under changing socioeconomic, technological and climate conditions in Northwest Germany. Ecol. Econ. 2015, 111, 29–47. [Google Scholar] [CrossRef]
  12. Mattes, J.; Huber, A.; Koehrsen, J. Energy transitions in small-scale regions—What we can learn from a regional innovation systems perspective. Energy Policy 2015, 78, 255–264. [Google Scholar] [CrossRef]
  13. Viétor, B.; Hoppe, T.; Clancy, J. Decentralised combined heat and power in the German Ruhr Valley; assessment of factors blocking uptake and integration. Energy Sustain. Soc. 2015, 5, 5. [Google Scholar] [CrossRef]
  14. Chilvers, J.; Longhurst, N. Participation in Transition(s): Reconceiving Public Engagements in Energy Transitions as Co-Produced, Emergent and Diverse. J. Environ. Policy Plan. 2016, 18, 585–607. [Google Scholar] [CrossRef]
  15. Hufen, J.A.M.; Koppenjan, J.F.M. Local renewable energy cooperatives: Revolution in disguise? Energy Sustain. Soc. 2015, 5, 18. [Google Scholar] [CrossRef] [Green Version]
  16. Geels, F.W.; Schot, J. Typology of sociotechnical transition pathways. Res. Policy 2007, 36, 399–417. [Google Scholar] [CrossRef]
  17. Geels, F.W.; Kemp, R. Dynamics in socio-technical systems: Typology of change processes and contrasting case studies. Technol. Soc. 2007, 29, 441–455. [Google Scholar] [CrossRef]
  18. Geels, F.W.; Kern, F.; Fuchs, G.; Hinderer, N.; Kungl, G.; Mylan, J.; Neukirch, M.; Wassermann, S. The enactment of socio-technical transition pathways: A reformulated typology and a comparative multi-level analysis of the German and UK low-carbon electricity transitions (1990-2014). Res. Policy 2016, 45, 896–913. [Google Scholar] [CrossRef]
  19. Timmermans, J.; de Haan, H.; Squazzoni, F. Computational and mathematical approaches to societal transitions. Comput. Math. Organ. Theory 2008, 14, 391–414. [Google Scholar] [CrossRef] [Green Version]
  20. Ulli-Beer, S.; Kubli, M.; Zapata, J.; Wurzinger, M.; Musiolik, J.; Furrer, B. Participative Modelling of Socio-Technical Transitions: Why and How Should We Look Beyond the Case-Specific Energy Transition Challenge? Syst. Res. Behav. Sci. 2017, 34, 469–488. [Google Scholar] [CrossRef]
  21. Lachman, D.A. A survey and review of approaches to study transitions. Energy Policy 2013, 58, 269–276. [Google Scholar] [CrossRef]
  22. Halbe, J.; Reusser, D.E.; Holtz, G.; Haasnoot, M.; Stosius, A.; Avenhaus, W.; Kwakkel, J.H. Lessons for model use in transition research: A survey and comparison with other research areas. Environ. Innov. Soc. Transit. 2015, 15, 194–210. [Google Scholar] [CrossRef] [Green Version]
  23. Köhler, J.; de Haan, F.; Holtz, G.; Kubeczko, K.; Moallemi, E.; Papachristos, G.; Chappin, E. Modelling Sustainability Transitions: An Assessment of Approaches and Challenges. J. Artif. Soc. Soc. Simul. 2018, 21. [Google Scholar] [CrossRef] [Green Version]
  24. Schwaninger, M.; Groesser, S.N. Modeling as Theory-Building. In Proceedings of the 2008 International Conference of the System Dynamics Society, Athens, Greece, 20–24 July 2008; pp. 1–26. [Google Scholar]
  25. Schwaninger, M.; Groesser, S.N. System Dynamics as Model-based Theory Building. Syst. Res. Behav. Sci. 2008, 8, 27–42. [Google Scholar] [CrossRef]
  26. Bleda, M.; Shackley, S. Simulation Modelling as a Theory Building Tool: The Formation of Risk Perceptions. J. Artif. Soc. Soc. Simul. 2012, 15, 2. [Google Scholar] [CrossRef]
  27. Bhatnagar, R. Exploratory Model Building. Uncertain. Proc. 1994, 77–85. [Google Scholar] [CrossRef]
  28. Turnheim, B.; Berkhout, F.; Geels, F.; Hof, A.; McMeekin, A.; Nykvist, B.; van Vuuren, D. Evaluating sustainability transitions pathways: Bridging analytical approaches to address governance challenges. Glob. Environ. Chang. 2015, 35, 239–253. [Google Scholar] [CrossRef]
  29. Selvakkumaran, S.; Ahlgren, E.O. Local energy transitions: methods, models, challenges and opportunities. In Proceedings of the International Sustainability Transitions Conference, Gothenburg, Sweden, 18–21 June 2017. [Google Scholar]
  30. Busch, H.; McCormick, K. Local power: exploring the motivations of mayors and key success factors for local municipalities to go 100% renewable energy. Energy Sustain. Soc. 2014, 4, 5. [Google Scholar] [CrossRef] [Green Version]
  31. Burch, S.; Shaw, A.; Dale, A.; Robinson, J. Triggering transformative change: a development path approach to climate change response in communities. Clim. Policy 2014, 14, 467–487. [Google Scholar] [CrossRef]
  32. Fuchs, G.; Hinderer, N. Situative governance and energy transitions in a spatial context: Case studies from Germany. Energy Sustain. Soc. 2014, 4, 16. [Google Scholar] [CrossRef]
  33. Hargreaves, T.; Hielscher, S.; Seyfang, G.; Smith, A. Grassroots innovations in community energy: The role of intermediaries in niche development. Glob. Environ. Chang. 2013, 23, 868–880. [Google Scholar] [CrossRef] [Green Version]
  34. Moss, T.; Becker, S.; Naumann, M. Whose energy transition is it, anyway? Organisation and ownership of the Energiewende in villages, cities and regions. Local Environ. 2015, 20, 1547–1563. [Google Scholar] [CrossRef]
  35. Kubli, M.; Ulli-Beer, S. Decentralisation dynamics in energy systems: A generic simulation of network effects. Energy Res. Soc. Sci. 2016, 13, 71–83. [Google Scholar] [CrossRef]
  36. Voorberg, W.; Bekkers, V.; Tummers, L. Co-creation and Co-production in Social Innovation: A Systematic Review and Future Research Agenda. In Proceedings of the EGPA Conference, Edinburgh, UK, 11–13 September 2013. [Google Scholar]
  37. Horsbøl, A. Co-Creating Green Transition: How Municipality Employees Negotiate their Professional Identities as Agents of Citizen Involvement in a Cross-Local Setting. Environ. Commun. 2018, 12, 701–714. [Google Scholar] [CrossRef]
  38. Voorberg, W.H.; Bekkers, V.J.J.M.; Tummers, L.G. A Systematic Review of Co-Creation and Co-Production: Embarking on the social innovation journey. Public Manag. Rev. 2015, 1333–1357. [Google Scholar] [CrossRef] [Green Version]
  39. De Koning, J.I.J.C.; Crul, M.R.M.; Renee, W. Models of co-creation. In Proceedings of the ServDes. 2016 Conference, Copenhagen, Denmark, 24–26 May 2016; pp. 266–278. [Google Scholar]
  40. Verschuere, B.; Brandsen, T.; Pestoff, V. Co-production: The State of the Art in Research and the Future Agenda. Voluntas 2012, 23, 1083–1101. [Google Scholar] [CrossRef] [Green Version]
  41. Trutnevyte, E.; Stauffacher, M.; Scholz, R.W. Supporting energy initiatives in small communities by linking visions with energy scenarios and multi-criteria assessment. Energy Policy 2011, 39, 7884–7895. [Google Scholar] [CrossRef]
  42. Reinsberger, K.; Brudermann, T.; Hatzl, S.; Fleiß, E.; Posch, A. Photovoltaic diffusion from the bottom-up: Analytical investigation of critical factors. Appl. Energy 2015, 159, 178–187. [Google Scholar] [CrossRef]
  43. Puerari, E.; de Koning, J.; von Wirth, T.; Karré, P.; Mulder, I.; Loorbach, D. Co-Creation Dynamics in Urban Living Labs. Sustainability 2018, 10, 1893. [Google Scholar] [CrossRef]
  44. Lindahl, J. Svensk Solenergi. Available online: http://sagrom.com/ (accessed on 21 May 2018).
  45. Lindahl, J. National Survey Report of PV Power Applications in Sweden 2014; Swedish Energy Agency: Eskilstuna, Sweden, 2015. [Google Scholar]
  46. Lindahl, J. National Survey Report of PV Power Applications 2016; Swedish Energy Agency: Eskilstuna, Sweden, 2017. [Google Scholar]
  47. Sterman, J.D. Business Dynamics—Systems Thinking and Modeling for a Complex World; Irwin/McGraw-Hill: New York, NY, USA, 2000; ISBN 007238915X. [Google Scholar]
  48. Samskabende Gron Omstilling. SAGROM. Available online: http://sagrom.com/ (accessed on 21 May 2018).
  49. Bass, F.M. The Relationship Diffusion Rates, Experience Curves, and Demand Elasticities for Consumer Durable Technological Innovations. J. Bus. 1980, 53, S51–S67. [Google Scholar] [CrossRef]
  50. Lindahl, J. National Survey Report of PV Power Applications in Sweden 2015; Swedish Energy Agency: Eskilstuna, Sweden, 2016. [Google Scholar]
  51. Swedish Tax Agency VAT Exemption for Micro-Production of Renewable Electricity. Available online: https://www.skatteverket.se/privat/fastigheterochbostad/mikroproduktionavfornybarel/skattereduktionformikroproduktionavfornybarel.4.12815e4f14a62bc048f4220.html (accessed on 21 May 2018).
  52. Ahlberg, V. Energimarknadsinspectionen Price of Electricity and Natural Gas for Household Customers. Available online: https://www.scb.se/en/finding-statistics/statistics-by-subject-area/energy/price-trends-in-the-energy-sector/energy-prices-on-natural-gas-and-electricity/ (accessed on 21 May 2018).
  53. Sterman, J.D. All models are wrong: Reflections on becoming a systems scientist. Syst. Dyn. Rev. 2002, 18, 501–531. [Google Scholar] [CrossRef]
  54. Papachristos, G. A mechanism based transition research methodology: Bridging analytical approaches. Futures 2018, 98, 57–71. [Google Scholar] [CrossRef]
  55. Dehdarian, A.; Racz, P. A System Dynamics model for the Cost Recovery of Residential Smart Meter Roll-Out in the Lemanic Area. In Proceedings of the 33rd International Conference of the System Dynamics Society, Cambridge, MA, USA, 19–23 July 2015; pp. 1–28. [Google Scholar]
  56. Dehdarian, A. Scenario-based system dynamics modeling for the cost recovery of new energy technology deployment: The case of smart metering roll-out. J. Clean. Prod. 2018, 178, 791–803. [Google Scholar] [CrossRef]
  57. Palm, A. Peer effects in residential solar photovoltaics adoption—A mixed methods study of Swedish users. Energy Res. Soc. Sci. 2017, 26, 1–10. [Google Scholar] [CrossRef]
  58. Vasseur, V.; Kemp, R. The adoption of PV in the Netherlands: A statistical analysis of adoption factors. Renew. Sustain. Energy Rev. 2015, 41, 483–494. [Google Scholar] [CrossRef]
Figure 1. The simplified diagram of the overall method used in the study.
Sustainability 10 03905 g001
Figure 2. The disaggregated method flow used in the study.
Sustainability 10 03905 g002
Figure 3. The stylized representation of the model development work-flow in this study.
Sustainability 10 03905 g003
Figure 4. The initial model schematic: (a) the initial model Causal Loop Diagram (CLD); and (b) the initial model Stock and Flow Diagram (SFD).
Sustainability 10 03905 g004
Figure 5. The schematic of the models developed after the first discussion with the MAs: (a) the CLD of the model; and (b) the SFD of the model.
Sustainability 10 03905 g005
Figure 6. The detailed SFD of the initial base model of solar PV diffusion in Skåne.
Sustainability 10 03905 g006
Figure 7. The SFD of the “Household cost dynamics” sub-system.
Sustainability 10 03905 g007
Figure 8. The finalized model of the solar PV diffusion in Skåne, Sweden.
Sustainability 10 03905 g008
Figure 9. The final Household cost dynamics sub-system model.
Sustainability 10 03905 g009
Table 1. An overview of the data collection methods in this study.
Data TypesQualitativeQuantitative
PrimaryInterviews, discussions and informal workshops.
Joint model conceptualization sessions
-
SecondaryProject documents
Project descriptions, brochures and other material.
Past data and statistics about the diffusion of solar PV.
Secondary data

