
Article

Exploratory SSR-Based Assessment of Genetic Diversity and Differentiation Among Four Wild Almond Populations in Kazakhstan

1
Laboratory “NatureLab”, Astana International University, 8 Kabanbay Batyra Ave., Astana 010000, Kazakhstan
2
Faculty of Biology, University of Warsaw, 1 Ilji Miecznikowa Str., 02096 Warsaw, Poland
3
Molecular Genetics Laboratory, Institute of Plant Biology and Biotechnology, 45 Timiryazev Street, Almaty 050040, Kazakhstan
4
Department of Biology, K. Zhubanov Aktobe Regional University, 34 Alia Moldagulova Ave., Aktobe 030000, Kazakhstan
*
Author to whom correspondence should be addressed.
Int. J. Plant Biol. 2026, 17(8), 67; https://doi.org/10.3390/ijpb17080067
Submission received: 21 June 2026 / Revised: 27 July 2026 / Accepted: 28 July 2026 / Published: 31 July 2026
(This article belongs to the Section Plant Biochemistry and Genetics)

Abstract

Wild almond relatives are valuable reservoirs of allelic variation for crop improvement and conservation, yet Kazakhstan’s wild-almond genetic resources remain poorly characterised. We conducted an exploratory SSR assessment of 80 putative individuals from four taxon-locality groups (20 per group), each representing one sampled population: Prunus ledebouriana, P. tenella, P. petunnikowii, and P. spinosissima. Of 22 nuclear simple sequence repeat loci screened for cross-taxon transferability, 15 generated reproducible profiles and were retained; their even genome-wide distribution was not verified. Across the full dataset, the mean number of alleles was 3.55, the effective number of alleles was 2.62, expected heterozygosity (He) was 0.544, and 95.0% of loci were polymorphic. Missing genotypes ranged from 0.0% to 34.7% among groups, and six loci had at least 20% missing data. AMOVA attributed 76.5% of variation to within-group differences and 23.5% to among-group differences (PhiPT = 0.235, p = 0.001). PCoA, unbiased Nei distances, UPGMA, and descriptive Bayesian clustering separated the four sampled groups. A nine-locus sensitivity analysis that excluded the six high-missing loci retained P. spinosissima as the group with the highest mean He (0.699), whereas P. petunnikowii increased from 0.471 to 0.609. Thus, the low full-panel estimate for P. petunnikowii was not robust to missing data. Because taxon identity was fully confounded with locality and the marker panel was limited, the results are interpreted as a regional marker-transferability and methodological baseline rather than as species-wide or genome-wide inference.

1. Introduction

Crop wild relatives provide alleles that may broaden the genetic base of cultivated crops and improve tolerance to drought, temperature extremes, pests, and diseases [1]. Within Rosaceae, cultivated almond (Prunus dulcis (Mill.) D.A. Webb, subgenus Amygdalus) is an economically important nut crop, and its wild relatives constitute an important source of evolutionary and breeding variation [2,3]. The domestication history of the almond is complex and includes contributions from multiple wild gene pools and introgression, strengthening the need to conserve natural populations and document their genetic structure [3].
Kazakhstan contains several wild shrubby almonds adapted to contrasting mountain, steppe, and arid environments. The present study focuses on Prunus ledebouriana (Schltdl.) Y.Y. Yao, P. tenella Batsch, P. petunnikowii (Litv.) Rehder, and P. spinosissima (Bunge) Franch. Current taxonomic resources treat these as accepted Prunus names; names formerly used in Amygdalus, including Amygdalus ledebouriana, A. nana, A. petunnikowii, and A. spinosissima, are relevant synonyms in the regional literature [4,5,6]. Several of these taxa have restricted or fragmented distributions, and their conservation and potential use in breeding depend on a more reliable understanding of genetic diversity within and among natural populations [5,6].
The reproductive ecology of wild almonds is directly relevant to interpreting marker variation. Most Prunus species possess an S-RNase-based gametophytic self-incompatibility system that favours outcrossing, while insect visitors, particularly bees, mediate pollen transfer [7,8,9]. Local pollen movement, mating compatibility, and the spatial arrangement of flowering shrubs may therefore affect within-population diversity. Prunus tenella can also produce root suckers and form clonal patches [10], so spatial separation among sampled shoots reduces but does not eliminate the risk of collecting ramets of the same genet. In related Prunus species, birds and mammals disperse drupes and can contribute to both short- and long-distance seed movement [11,12,13]. These processes provide a biological framework for evaluating the balance between within-population diversity and differentiation among geographically separated groups.
Nuclear simple sequence repeat markers remain useful for exploratory conservation-genetic studies because they are codominant, multiallelic, reproducible, and often transferable among related Prunus taxa [14,15]. In poorly studied germplasm, a modest nSSR panel permits preliminary diversity screening, fingerprinting, and comparison with historical datasets without requiring a complete reference genome [14,15,16,17]. Nevertheless, SNP- and sequencing-based approaches provide much denser and more even genomic coverage. Therefore, transferred nSSR loci should be interpreted as a limited multilocus assay rather than a genome-wide representation of diversity.
Recent almond studies using comparable SSR workflows provide an important analytical context. Hasanbegović et al. used 10 SSR markers to compare 60 genotypes from two Adriatic regions [18]. Yangöz and Güney analysed 16 cultivated and naturally growing genotypes with 18 SSRs and combined diversity indices with UPGMA, PCoA, and STRUCTURE [19]. Bayazıt et al. integrated 16 SSRs with morphological and biochemical data for 18 southern Turkish genotypes [20]. Together, these studies demonstrate the continued value of SSRs for germplasm characterisation while also showing that marker performance and biological inference depend on sampling design, taxonomic scope, the number of loci, scoring platform, and data completeness.
Comparative genetic information on wild almonds in Kazakhstan remains limited, and previous studies have generally examined individual taxa or restricted localities rather than multiple taxa within a single analytical framework [5,6,17]. In particular, no regional study has compared a single sampled population from each of the four target taxa using the same nSSR workflow while explicitly evaluating sensitivity to missing data. The present study, therefore, provides an exploratory comparison of four taxon-locality groups. The objectives were to (i) evaluate the cross-taxon transferability and analytical suitability of an existing nSSR panel; (ii) quantify genetic variation within and among the sampled groups; (iii) examine concordance among AMOVA, unbiased Nei distances, PCoA, UPGMA, and STRUCTURE; (iv) assess the sensitivity of descriptive diversity estimates to loci with high missingness; and (v) establish a reproducible baseline for expanded conservation-genetic surveys. Because each locality represented a single taxon, the design cannot separate taxonomic, geographic, and environmental effects.

2. Materials and Methods

2.1. Study Species, Sampling Localities, and Field Sampling

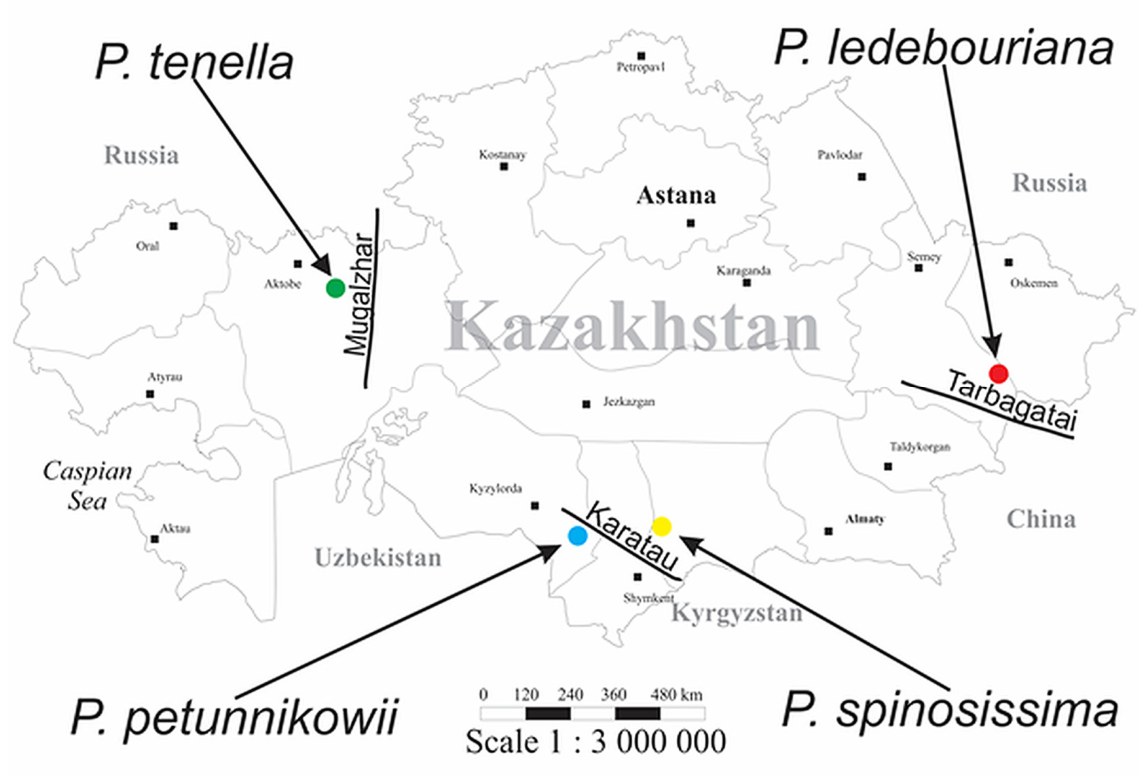
Field surveys and sampling were conducted during the 2025 growing season in four natural populations located in eastern Kazakhstan (Tarbagatai), western Kazakhstan (Mugalzhar), and southern Kazakhstan (Karatau and Mashat). One locality was sampled for each target taxon, and each taxon-locality combination was treated as a separate population unit in the comparative genetic analyses. Complete day-level collection dates were not available in the archived field records; sampling is therefore reported at the growing-season level. The sites span mountain, steppe, and arid environments and differ in elevation, precipitation, relative humidity, and soil conditions (Figure 1; Table 1); exact geographic coordinates are provided in Table 1.
Prunus ledebouriana was sampled in Tarbagatai State National Nature Park (Abai Region, Urzhar District) at approximately 1400 m a.s.l., where Kastanozems (chestnut soils) and mountain-meadow soils predominate. Prunus tenella was sampled near Emba in the Mugalzhar area (Aktobe Region) at approximately 300–500 m a.s.l. on light Kastanozems, calcareous soils, and locally saline substrates. Prunus petunnikowii and P. spinosissima were collected in southern Kazakhstan in the Karatau and Mashat areas at approximately 700–1000 m a.s.l., under hot, dry conditions on light Kastanozems, chernozem-derived soils, and gravelly soils.
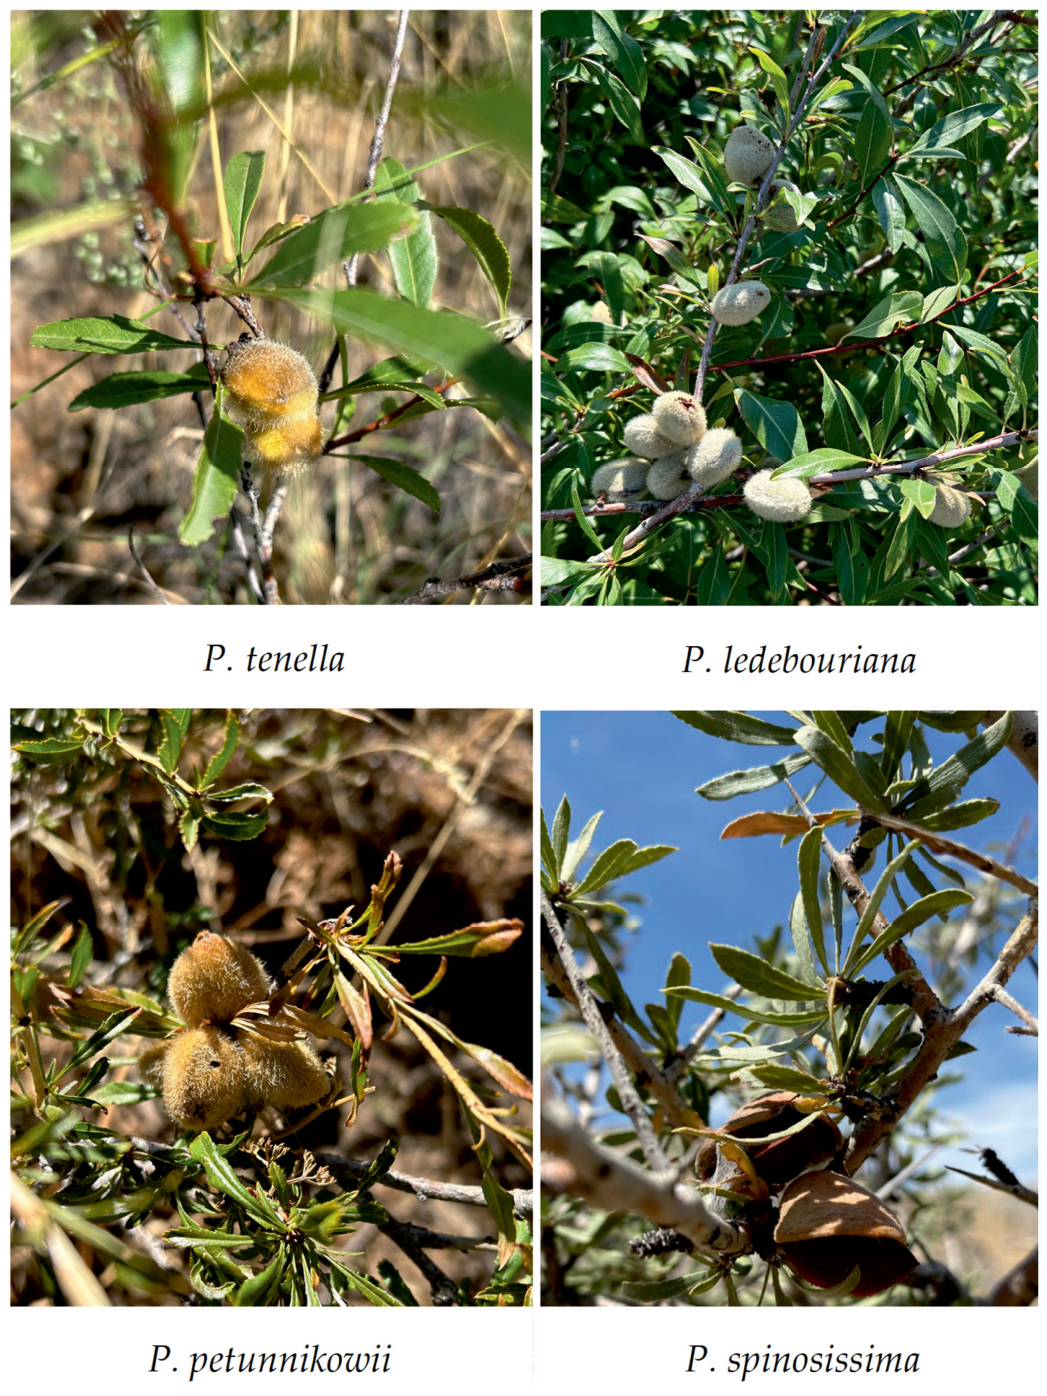
Field identification followed regional floristic treatments and current accepted nomenclature [4,5,6]. The taxa shared the general shrubby habit typical of subgenus Amygdalus. Still, they differed in diagnostically useful combinations of branch architecture, leaf shape, fruit form, stone symmetry, and spines (Figure 2). A concise comparative summary is provided in Table A1; these observations were used for taxonomic verification and were not treated as an independent quantitative morphometric dataset.
For molecular analysis, 20 visually distinct shrubs were sampled from each population, giving an equal nominal sample size of 20 individuals per group (80 in total). Young, healthy leaves were collected from plants separated by at least 50 m; where terrain and population extent allowed, distances ranged from 50 to 100 m. This field rule was intended to reduce the probability of sampling close relatives or repeated ramets. However, no multilocus clone correction was performed, so the sampled shoots are treated as putative individuals rather than genetically verified genets. Leaves were placed in sterile bags or tubes, rapidly dried in silica gel or frozen, and stored at −20 °C or −80 °C until DNA extraction.
Voucher specimens were prepared for the sampled localities and deposited in institutional herbarium collections in Almaty and Astana, where they remain available for taxonomic verification. Voucher accession numbers were not available for inclusion in this revision. The relevant administrations authorised site access and plant collection in protected areas; specific authorisation numbers were not available in the archived records.

2.2. DNA Extraction and Quality Control

Approximately 50–100 mg of young leaf tissue was ground to a fine powder in liquid nitrogen. Total genomic DNA was then extracted using the CTAB procedure of Doyle and Doyle [21], with modifications for tissues rich in polysaccharides and polyphenols, as described by Porebski et al. [22]. The powder was transferred to a preheated CTAB extraction buffer and incubated before organic purification.
The lysate was purified with chloroform: isoamyl alcohol, and DNA was precipitated with cold isopropanol, washed with 70% ethanol, air-dried, and dissolved in TE buffer. DNA quality was assessed by 1% agarose gel electrophoresis and spectrophotometry. Working solutions were normalised to approximately 10–30 ng μL−1 and stored at −20 °C until amplification.

2.3. nSSR Screening, PCR Amplification, and Genotyping

A set of 22 nuclear SSR loci (CPDCT005-CPDCT046) developed for almond and reported as transferable across Prunus was initially screened [14]. The markers were selected for cross-species amplification rather than as a predefined genome-wide panel. Although individual CPDCT loci have been mapped in different Prunus studies, a consistent physical position for every retained locus was not verified against a single reference assembly. The present assay is therefore treated as a limited multilocus panel rather than an evenly distributed survey of the almond genome. Seven loci (CPDCT028, CPDCT031, CPDCT033, CPDCT035, CPDCT040, CPDCT042, and CPDCT044) were excluded because amplification was weak or non-reproducible, or because banding patterns could not be scored unambiguously across all groups. Fifteen loci were retained for statistical analysis. Primer sequences, repeat motifs, expected fragment sizes, and annealing temperatures are listed in Table A2. With only 15 retained loci, sampling variance among loci may be substantial, and any clustering or linkage among markers could overrepresent particular genomic regions while leaving other chromosomes or chromosome segments unsampled. Consequently, marker independence and genome-wide representativeness could not be assumed.
PCR was conducted in a final volume of 20 μL containing manufacturer-supplied 1× reaction buffer, 1.5 mM MgCl2, 0.5 mM of each dNTP, 0.2 μM of each primer, 1 U Taq DNA polymerase, and approximately 100 ng template DNA. Amplification was performed in a thermal cycler (Thermo Fisher Scientific, Waltham, MA, USA) with initial denaturation at 95 °C for 3 min; 35 cycles of 95 °C for 30 s, locus-specific annealing at 58–62 °C for 30 s, and 72 °C for 90 s; and a final extension at 72 °C for 20 min.
Amplicons were resolved on 6% denaturing polyacrylamide gels in TBE buffer and sized against a 100–1000 bp DNA ladder. Gels were stained with ethidium bromide and visualised with a Gel Doc XR system (Bio-Rad, Hercules, CA, USA). Samples with weak or ambiguous bands were reamplified where sufficient DNA was available. Unresolved profiles were coded as missing. Only reproducible, clearly scored loci were retained.

2.4. Genetic Diversity and Data Completeness

For each locus and taxon-locality group, the following statistics were calculated in GenAlEx 6.5 [23]: mean number of valid genotypes (N), observed number of alleles (Na), effective number of alleles (Ne), Shannon information index (I), expected heterozygosity (He), unbiased expected heterozygosity (uHe), and percentage of polymorphic loci (P). The nominal sample size was equal across groups (n = 20), but missing calls remained missing and were neither recoded nor imputed; consequently, the effective sample size varied across loci and groups. Missing genotypes were summarised by group and locus. To evaluate the robustness of the population-level diversity ranking, mean He was recalculated after excluding the six loci with at least 20% missing data across the complete dataset (CPDCT007, CPDCT008, CPDCT012, CPDCT023, CPDCT038/1, and CPDCT043). This nine-locus analysis was used as a descriptive sensitivity check. Because the transferred panel and uneven missingness did not support a fully comparable biological interpretation of observed heterozygosity, fixation indices, Hardy–Weinberg equilibrium, null-allele frequencies, polymorphism information content, probability of identity, or clone-corrected multilocus genotypes across all four groups, these parameters were not used for inference, and their absence is explicitly treated as a limitation. The pattern of missingness was not assumed to be random. In a cross-taxon SSR assay, missing calls may arise from primer-site divergence or null alleles, variable template quality, weak amplification, or ambiguous gel scoring; the present dataset could not distinguish among these causes. Therefore, no imputation was applied, and all allele-frequency-based results were interpreted together with the locus- and group-specific completeness statistics and the reduced-panel sensitivity analysis.

2.5. Genetic Differentiation, Ordination, Clustering, and Population Structure

The distribution of molecular variation within and among the four sampled groups was quantified by AMOVA in GenAlEx 6.5, with significance assessed using 999 permutations. Differentiation was expressed as PhiPT. Pairwise relationships were evaluated using unbiased Nei genetic distance (DNei) and unbiased Nei genetic identity (INei). Principal coordinates analysis (PCoA) was performed at both the group and individual levels. A UPGMA dendrogram based on the matrix of unbiased Nei distances was generated in MEGA 11 [24].
Bayesian clustering was performed in STRUCTURE 2.3.4 [25] under the admixture model with correlated allele frequencies. Values of K from 1 to 10 were evaluated using three independent runs per K, each with a burn-in of 100,000 iterations followed by 100,000 Markov chain Monte Carlo iterations. The most strongly supported K was evaluated using the ΔK method [26] in STRUCTURE HARVESTER [27], together with mean LnP(D) and its among-run variance. Summary statistics for all tested K values are provided in Table A3. Missing calls were retained as missing rather than imputed as allele states. Because taxon identity and sampling locality are confounded and four predefined taxon-locality groups were analysed, STRUCTURE was used only for descriptive individual assignment and concordance analysis; its clusters are not interpreted as independent evidence of species boundaries or species-wide population structure.

3. Results

3.1. Marker Screening, Data Completeness, and Locus Performance

Of the 22 nSSR loci initially screened, 15 generated reproducible, interpretable profiles and were retained. The seven discarded loci were CPDCT028, CPDCT031, CPDCT033, CPDCT035, CPDCT040, CPDCT042, and CPDCT044. Across retained loci, missing genotypes were unevenly distributed: 0.0% in P. spinosissima, 9.7% in P. ledebouriana, 14.0% in P. tenella, and 34.7% in P. petunnikowii. Six of the 15 retained loci had at least 20% missing genotypes across the complete dataset: CPDCT007, CPDCT008, CPDCT012, CPDCT023, CPDCT038/1, and CPDCT043. The largest taxon-by-locus gaps occurred in P. petunnikowii, including 75% missing at CPDCT038/1, 70% at CPDCT008, and 65% at CPDCT043 (Table A4). Thus, although the nominal group sizes were equal, the locus-specific effective sample sizes were not.
Locus informativeness varied markedly (Table 2). Expected heterozygosity ranged from 0.240 at CPDCT012 to 0.748 at CPDCT045. CPDCT027 (He = 0.745) and CPDCT015 (He = 0.625) were also highly variable. CPDCT005 and CPDCT046 combined relatively high He with low missing-data rates, whereas CPDCT038/1 had a comparatively high missing-data rate (37.5%). These contrasts were taken into account when interpreting population-level estimates.

3.2. Genetic Diversity Within Sampled Populations

Across the complete 15-locus dataset, mean Na was 3.55, Ne was 2.62, I was 0.988, He was 0.544, and uHe was 0.579; 95.0% of loci were polymorphic (Table 3). P. spinosissima had the highest full-panel values for Na (4.47), Ne (3.24), He (0.656), and uHe (0.691), and all loci were polymorphic. P. ledebouriana also showed complete polymorphism and He = 0.559. P. tenella had He = 0.488, whereas P. petunnikowii had the lowest full-panel He (0.471), the lowest proportion of polymorphic loci (86.7%), and the smallest mean number of valid genotypes per locus. Because P. petunnikowii also had the highest missing-data rate, this ranking required a robustness check. After excluding the six high-missing loci, mean He was 0.598 for P. ledebouriana, 0.525 for P. tenella, 0.609 for P. petunnikowii, and 0.699 for P. spinosissima (Table A5). P. spinosissima remained highest, but P. petunnikowii was no longer lowest. Therefore, the low full-panel estimate for P. petunnikowii is not robust and is partly driven by loci with high missingness.

3.3. Partitioning of Molecular Variation

AMOVA assigned 76.5% of the total molecular variation to differences within sampled populations and 23.5% to differences among populations (Table 4). The among-group component was significant (PhiPT = 0.235, p = 0.001), demonstrating differentiation among the four sampled taxon-locality groups while retaining substantial variation within each group.

3.4. Genetic Distances, PCoA, and UPGMA Clustering

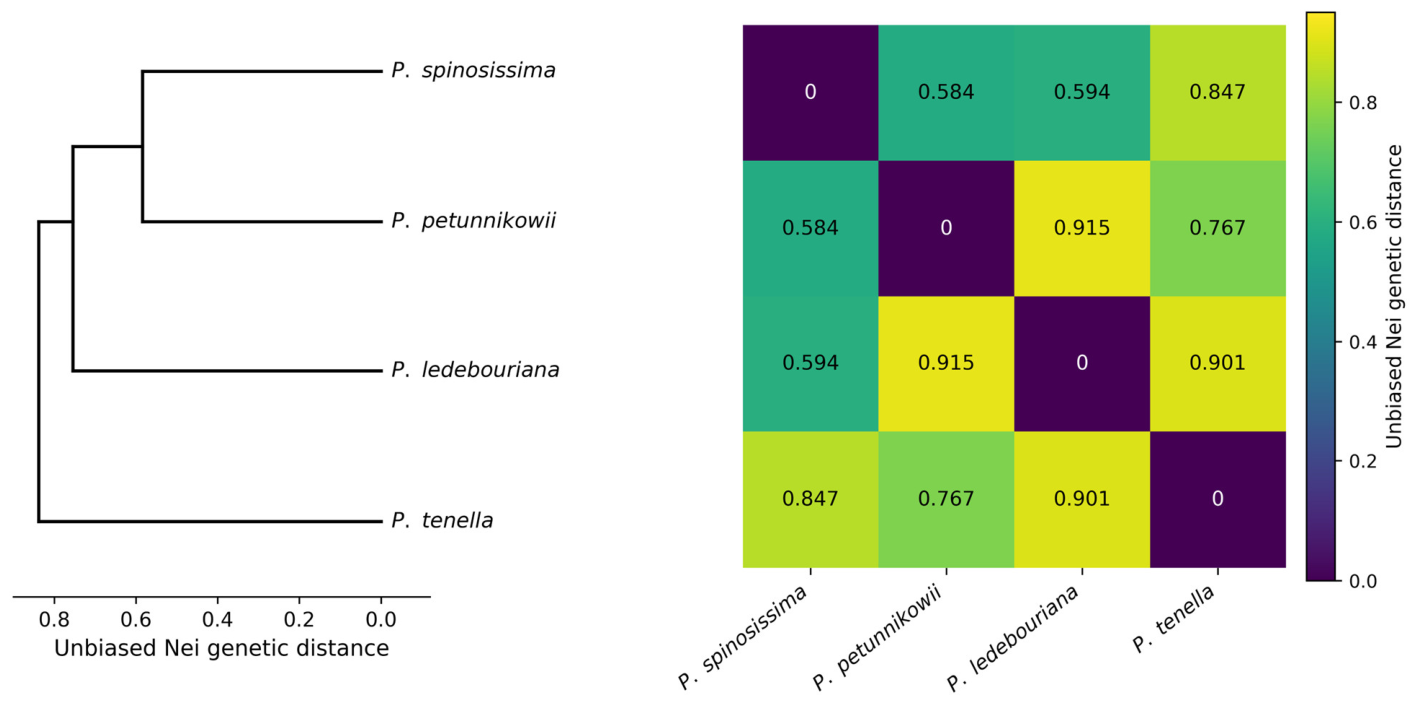
Pairwise unbiased Nei distances ranged from 0.584 to 0.915 (Table A6). The smallest distance was between P. petunnikowii and P. spinosissima (DNei = 0.584; INei = 0.557), followed by P. ledebouriana and P. spinosissima (DNei = 0.594; INei = 0.552). The largest distances involved P. ledebouriana and P. petunnikowii (DNei = 0.915) and P. ledebouriana and P. tenella (DNei = 0.901).
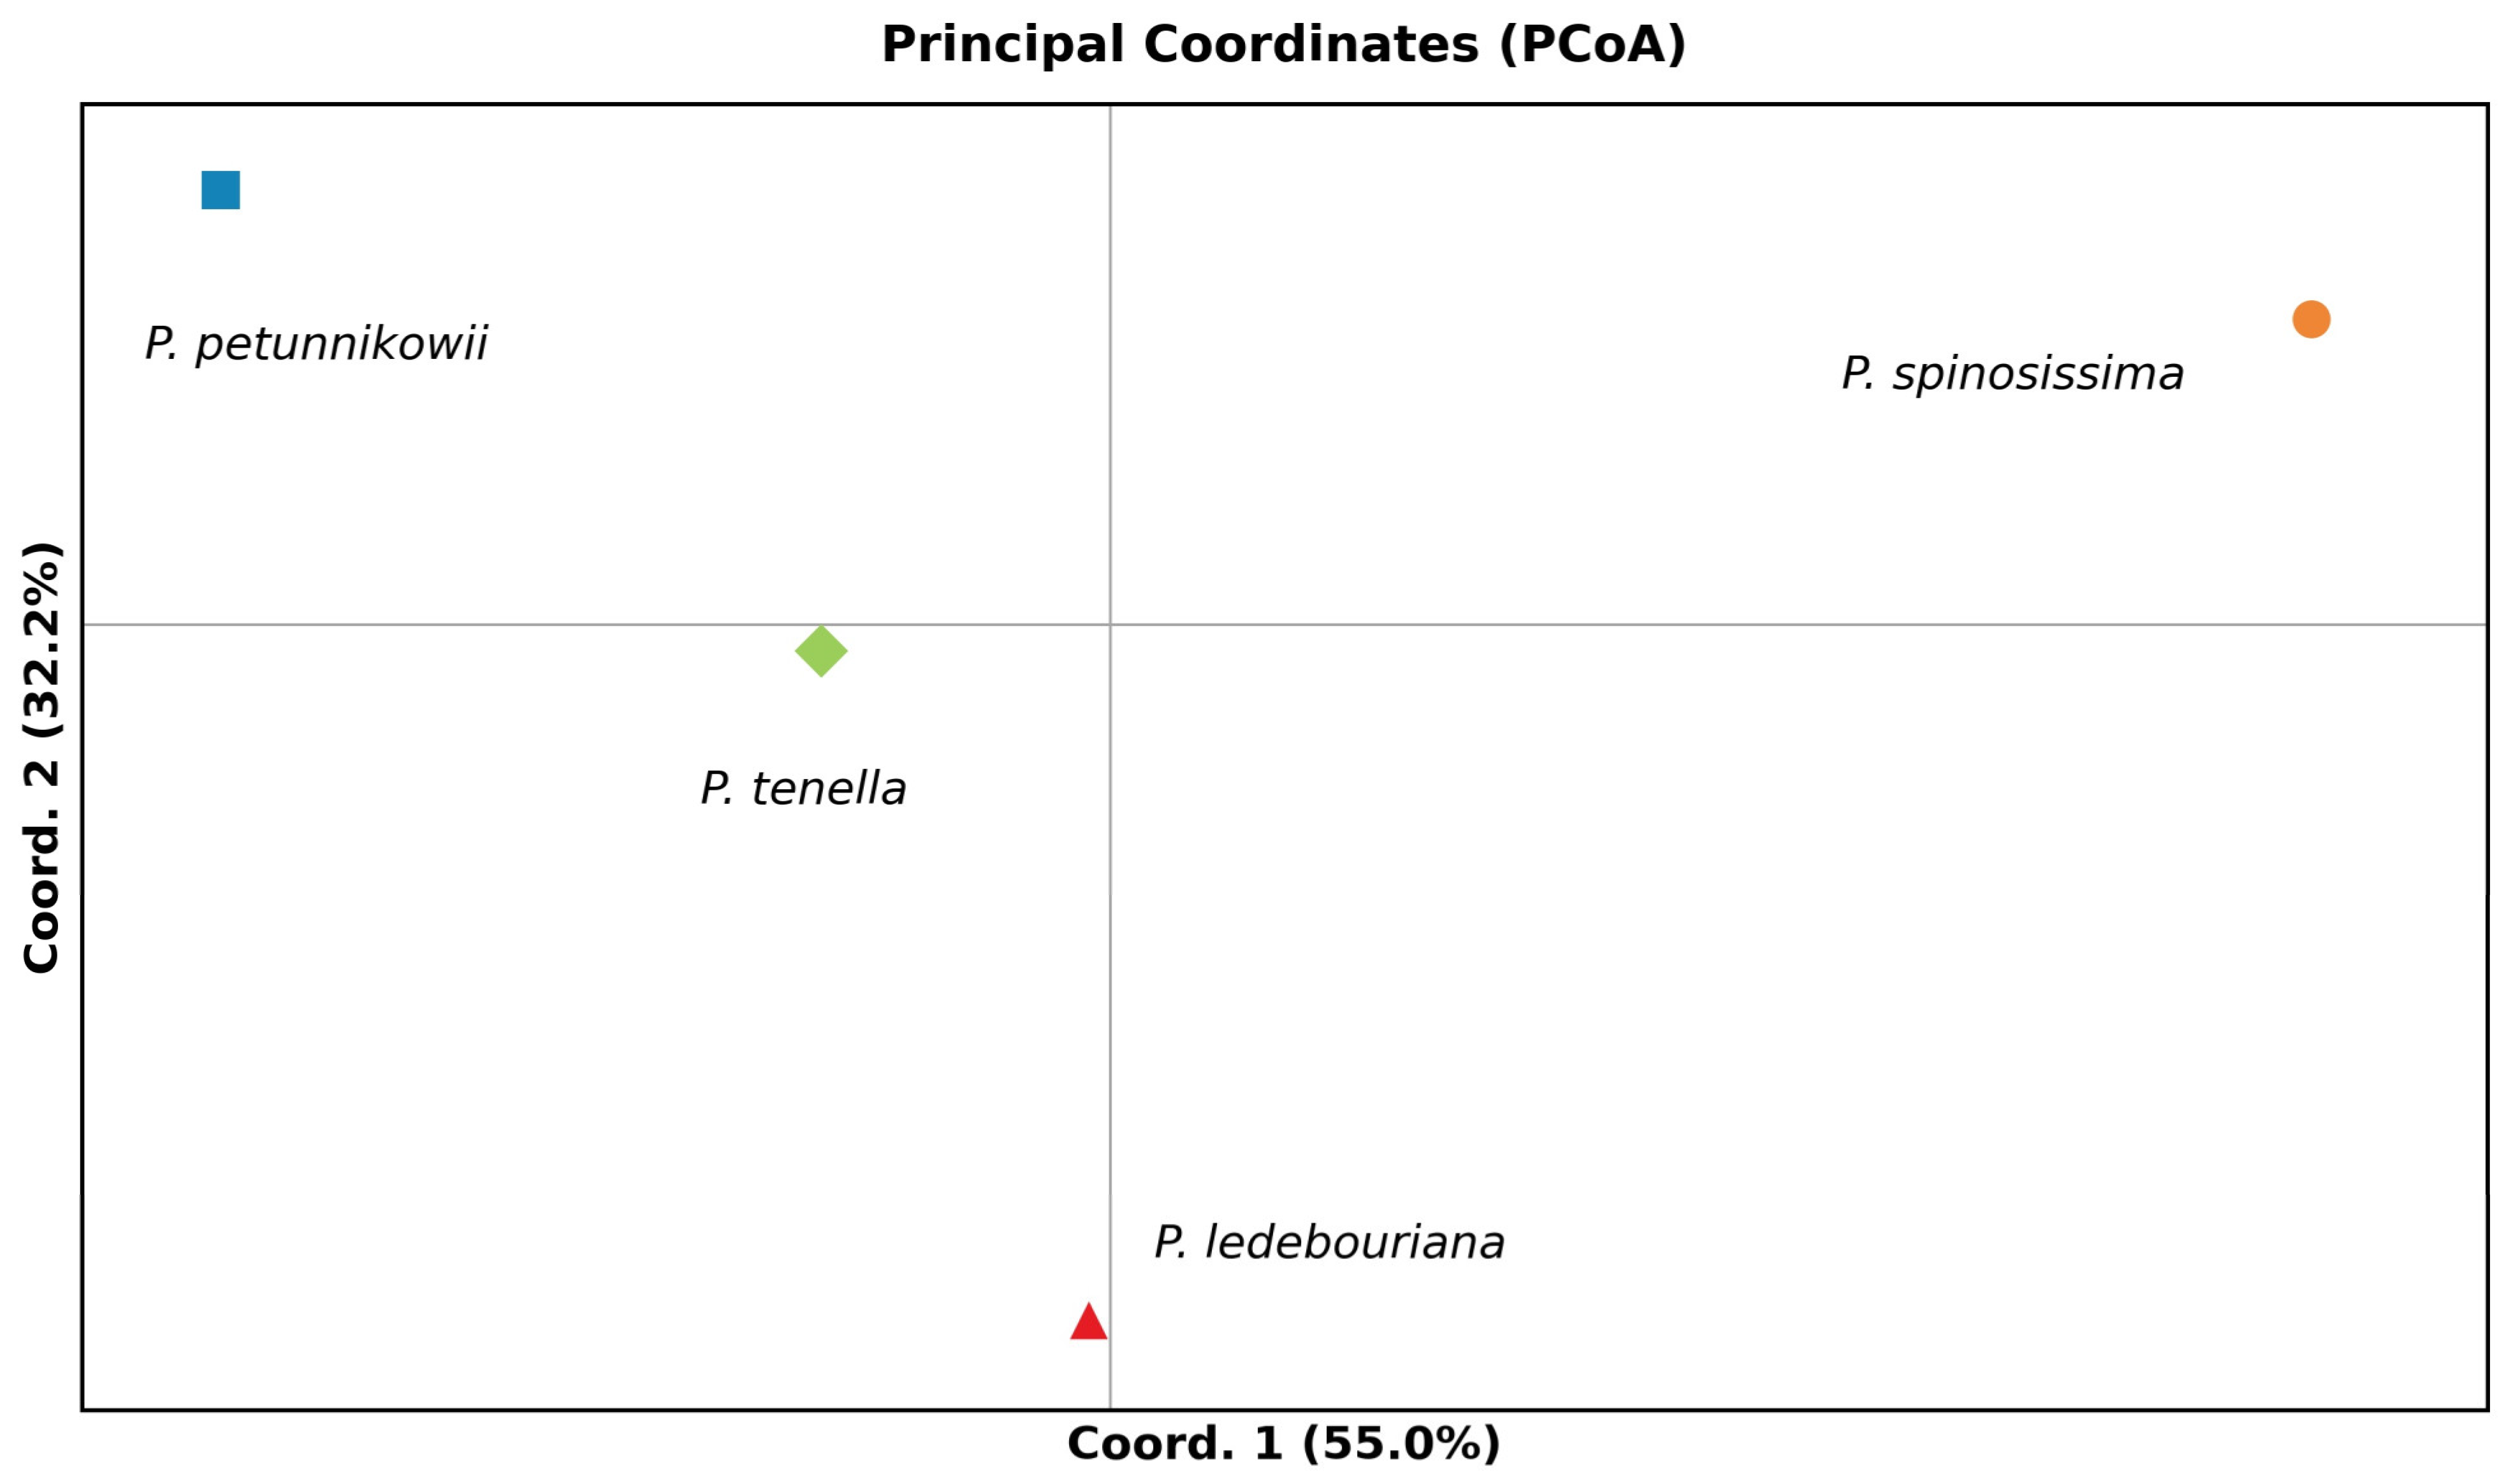
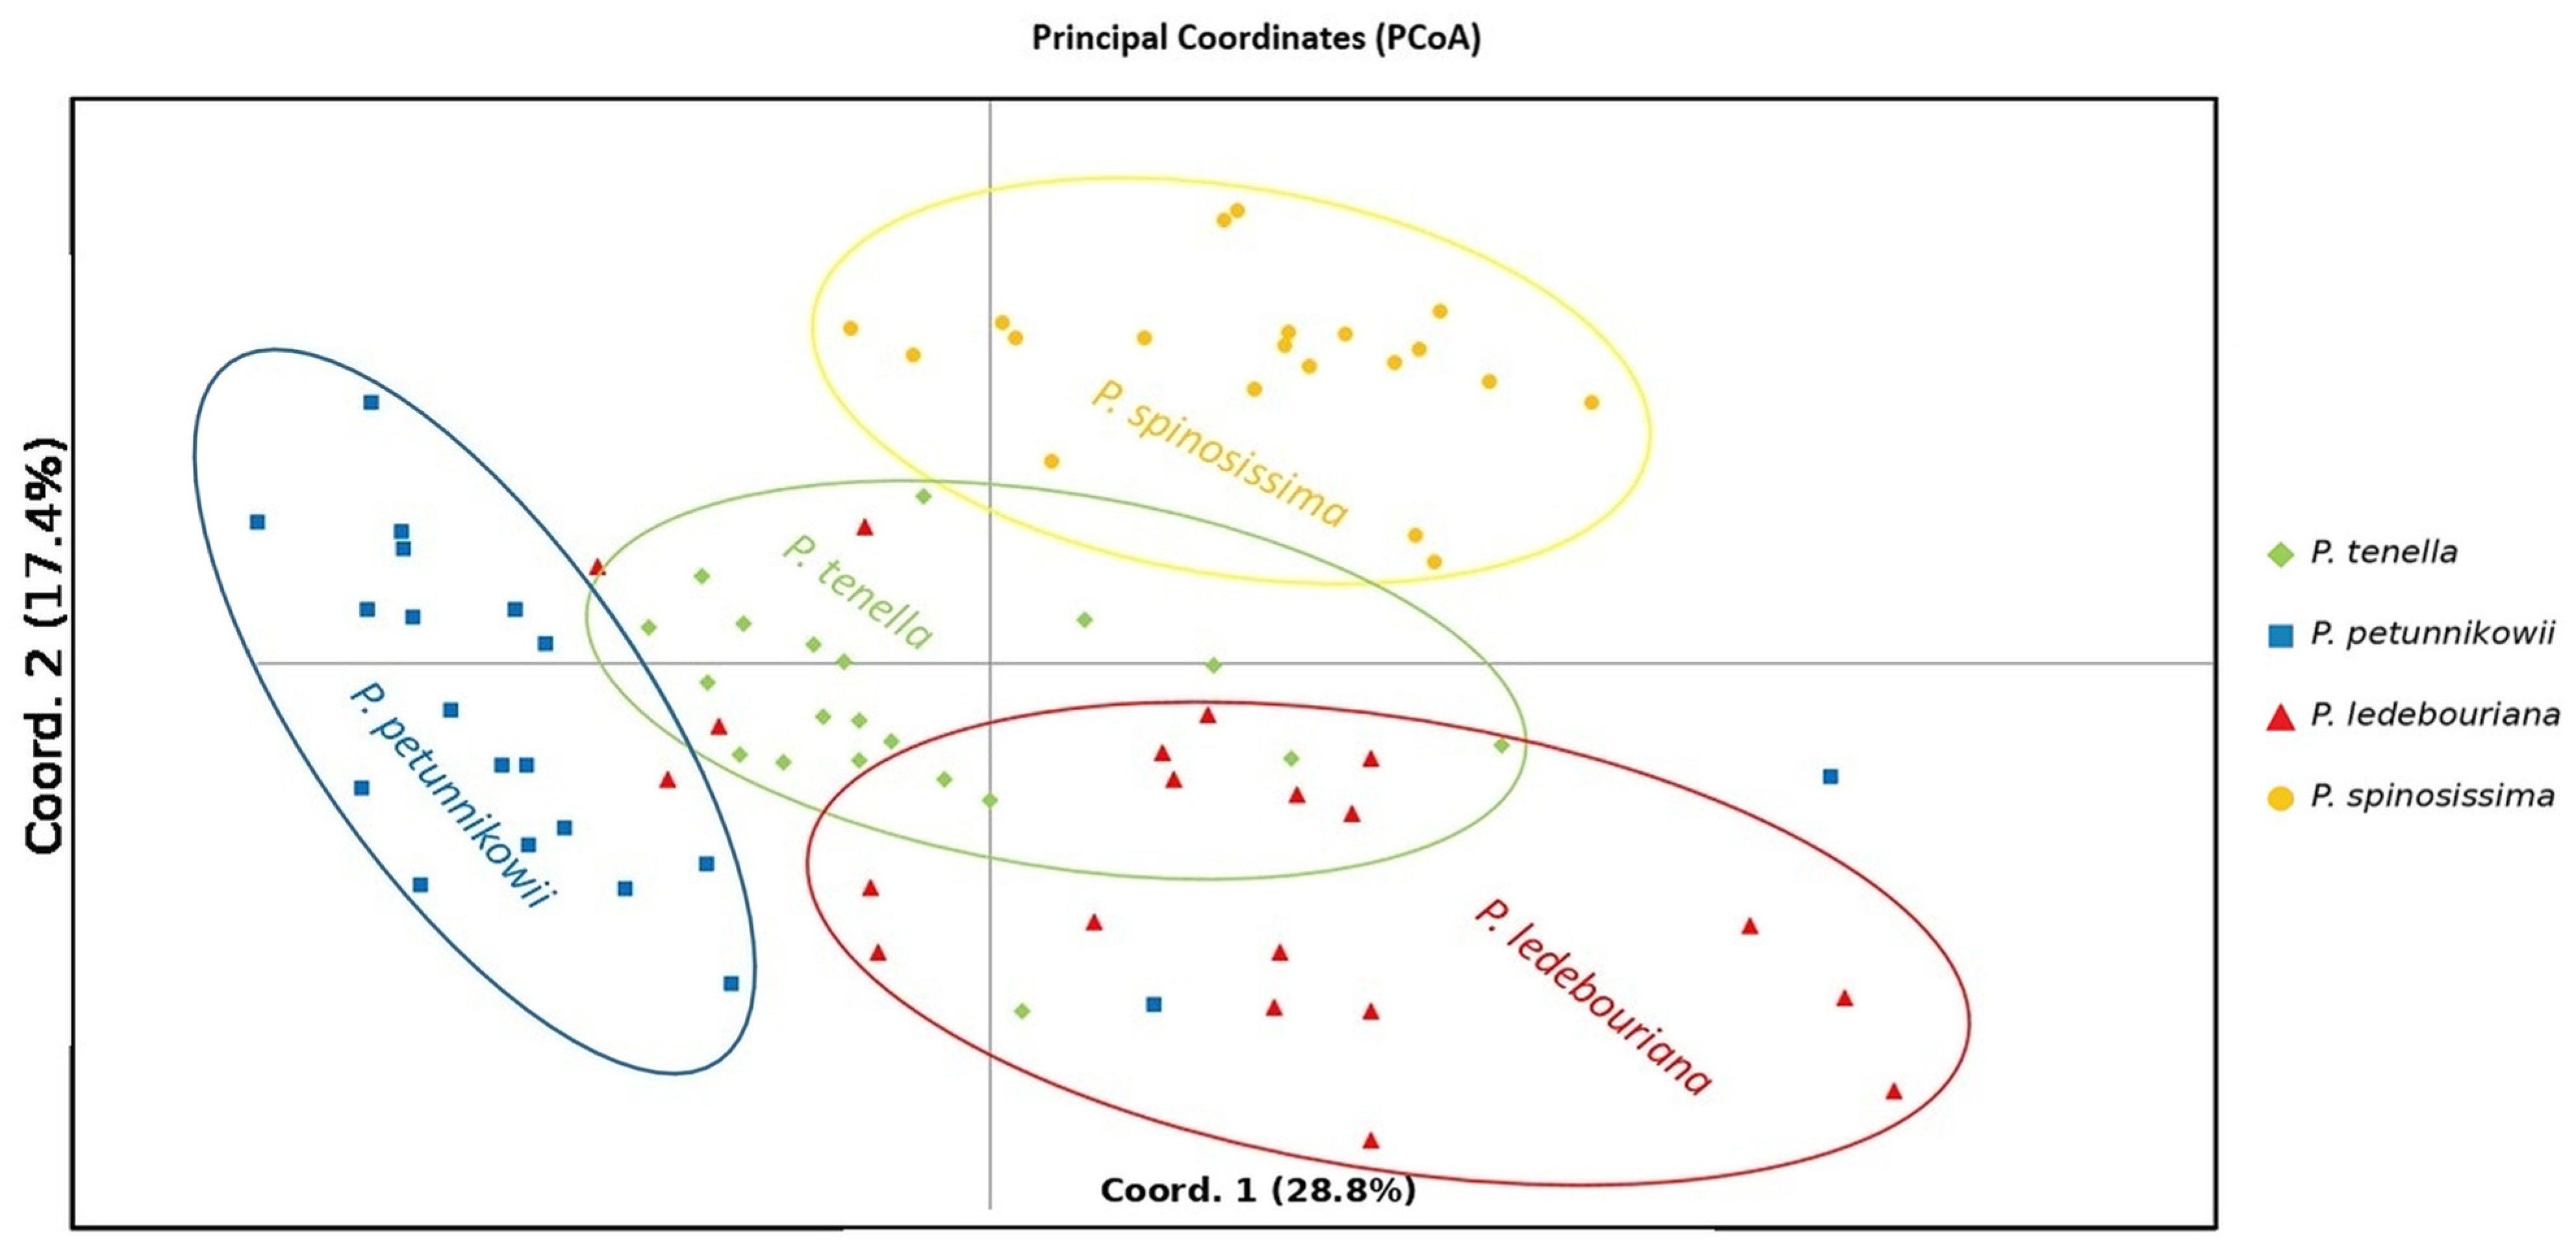
At the group level, the first two PCoA axes explained 55.0% and 32.2% of variation, respectively (87.2% cumulatively), and separated the four groups (Figure 3). At the individual level, axes 1 and 2 explained 28.8% and 17.4%, respectively; the first three axes explained 59.9% (Figure 4). Individual samples generally clustered by taxon-locality group, with limited overlap.
The heatmap and UPGMA dendrogram were consistent with the distance matrix (Figure 5). P. petunnikowii and P. spinosissima formed the closest pair; P. ledebouriana joined at a larger average distance, and P. tenella was separated from the other groups at the final clustering step. These relationships describe the sampled populations and should not be extrapolated to entire species ranges without replicated geographic sampling.

3.5. Bayesian Population Structure

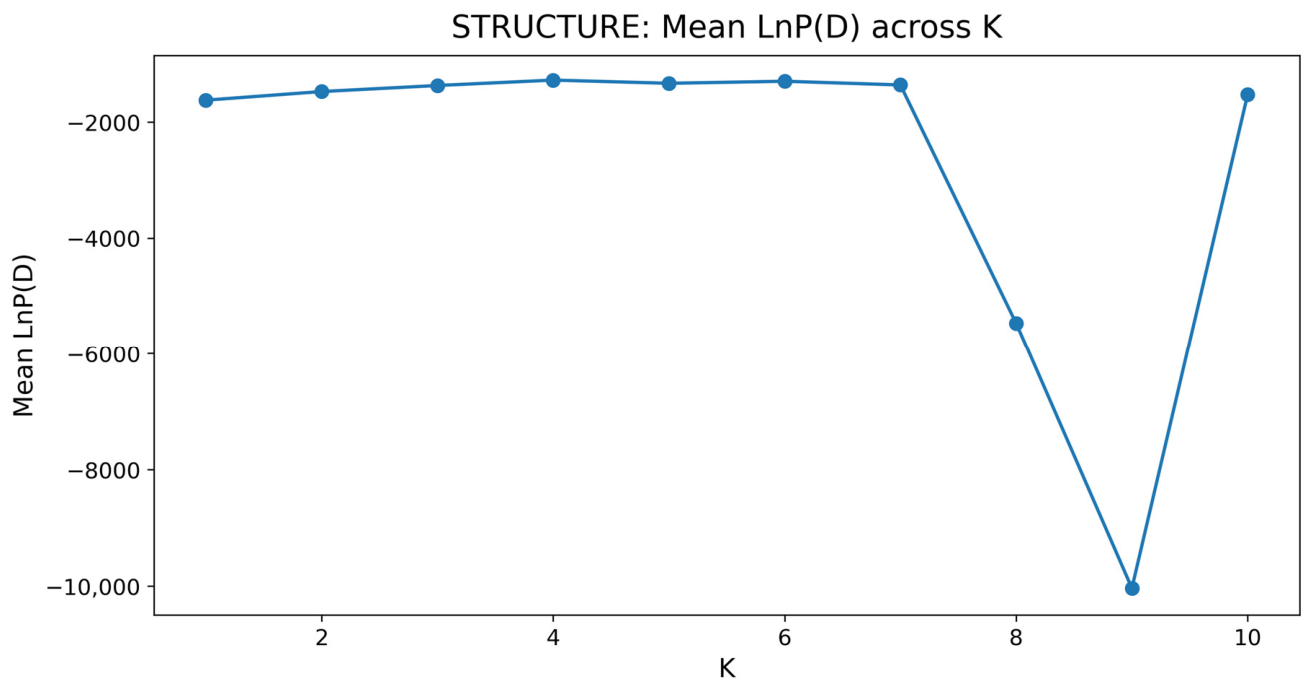
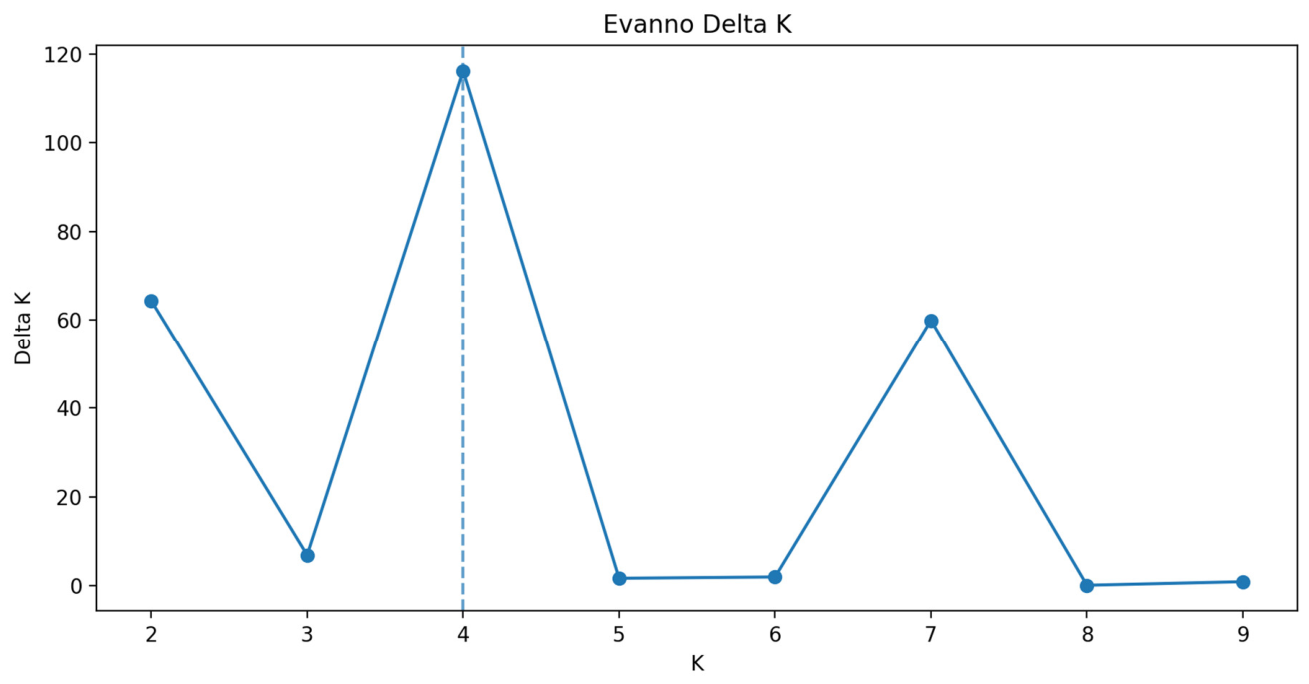
The Evanno statistic reached its maximum at K = 4 (ΔK = 116.26), while mean LnP(D) increased from K = 1 to K = 4 and became less stable at larger K values (Figure 6 and Figure 7; Table A3). A secondary ΔK peak occurred at K = 7, but among-run variability increased strongly at higher K. K = 4 was retained as the most parsimonious descriptive partition of this dataset. Because the samples were already divided into four taxon-locality groups, this result was expected and is interpreted primarily as an individual-level visualisation of concordance with the predefined groups, not as independent evidence for four species boundaries.
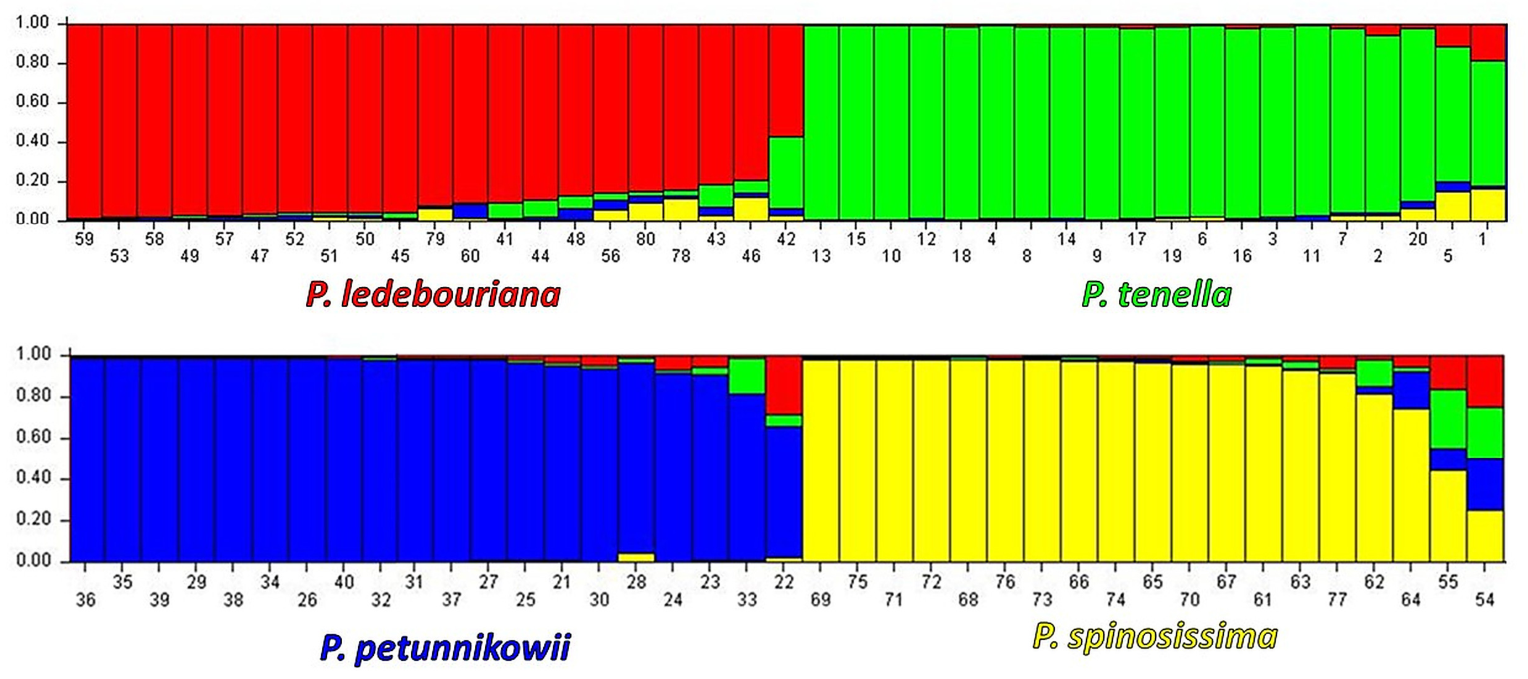
At K = 4, each taxon-locality group was dominated by a distinct ancestry component (Figure 8). Mean assignment to the dominant component was approximately 96.8% in P. petunnikowii, 96.0% in P. tenella, 92.9% in P. ledebouriana, and 90.7% in P. spinosissima. The corresponding non-dominant fractions were small but highest in P. spinosissima and P. ledebouriana. Given the single-population-per-species design, these fractions may reflect shared ancestral variation, scoring uncertainty, or historical connectivity; they should not be interpreted as direct evidence of contemporary hybridisation.

4. Discussion

This study provides an exploratory nSSR baseline for four wild almond populations distributed across contrasting regions of Kazakhstan. The retained panel detected allelic variation, and AMOVA indicated that most variation occurred within the sampled groups. However, the assay comprised only 15 transferred loci whose even physical distribution across the genome was not demonstrated. Accordingly, the estimates describe variation at these loci and should not be interpreted as genome-wide diversity. The predominance of within-group variation is biologically plausible for predominantly outcrossing Prunus taxa, in which gametophytic self-incompatibility and insect-mediated pollen transfer can maintain multiple alleles within local populations [7,8,9].
Three drawbacks arise from the limited, unmapped marker panel. First, estimates based on 15 loci have greater locus-sampling variance and may be disproportionately influenced by a few highly polymorphic loci. Second, because the retained loci were not positioned on a single common Prunus reference genome, their chromosomal coverage and statistical independence are unknown; linked or physically clustered loci could overweight some genomic regions, whereas large parts of the genome may be underrepresented. Third, such a panel has limited power to resolve subtle admixture, recent gene flow, or fine-scale structure. Thus, agreement among AMOVA, distance, ordination, UPGMA, and STRUCTURE analyses demonstrates a repeatable signal within this assay, but not comprehensive genome-wide differentiation.
Missing data represent an additional and potentially directional source of uncertainty. Missingness was highly uneven across groups and loci, and it may not be random because cross-species primer mismatches, null alleles, DNA quality, and scoring ambiguity can be taxon- or locus-specific. This reduces effective sample size, increases uncertainty in allele frequencies, and can bias diversity estimates, genetic distances, and model-based assignment. The sensitivity analysis provides direct evidence of this effect: after removing the six loci with at least 20% missing data, mean He for P. petunnikowii increased from 0.471 to 0.609. Therefore, the full-panel ranking for this group is not robust, and even the broader differentiation patterns should be regarded as provisional until they are confirmed with a denser, reference-mapped dataset.
The full-panel mean He of 0.544 was lower than values reported in several recent SSR studies of cultivated almond material [28]. However, differences in biological material, sample design, marker number, scoring platform, and missingness constrain direct numerical comparison. Hasanbegović et al. analysed 60 genotypes from two Adriatic regions with 10 polymorphic SSRs and detected significant regional differentiation [18]. Yangöz and Güney used 18 SSRs across 16 genotypes and cultivars, reporting a mean He of 0.78 and PIC values of 0.44–0.83, with broadly concordant UPGMA, PCoA, and STRUCTURE results [19]. Bayazıt et al. evaluated 18 genotypes using 16 SSRs, reported 99.4% polymorphism, and recovered two major clusters [20]. Unlike those studies, the present panel was transferred across four wild taxa and showed strongly uneven missingness. The nine-locus sensitivity analysis retained P. spinosissima as the group with the highest mean He. In contrast, the apparent low diversity of P. petunnikowii was not stable: its mean He increased from 0.471 to 0.609 after high-missing loci were removed. This comparison demonstrates why the full-panel ranking should not be treated as a species-level biological conclusion.
The predominance of within-population variation (76.5%) and significant among-group differentiation (PhiPT = 0.235) are consistent rather than contradictory. Outcrossing can preserve high diversity within local populations, whereas long-term geographic isolation and taxon-specific histories generate shifts in allele frequencies among populations. Comparable studies of wild almonds have reported substantial differentiation together with extensive within-group variation [16,17,29,30]. However, the present AMOVA compares taxon-locality groups; because taxon and geography are confounded, the among-group component cannot be partitioned into independent species and spatial effects.
Pairwise distances, PCoA, UPGMA, and STRUCTURE converged on a broad separation of the four sampled taxon-locality groups. This concordance shows that the retained multilocus profiles contain a group-associated signal. Still, it does not identify whether that signal reflects taxon identity, geography, environmental history, or a combination of these factors. The K = 4 solution is not an independent proof of four species-wide gene pools because four predefined groups were sampled, only three replicate STRUCTURE runs were used, and missingness was uneven. The secondary ΔK peak at K = 7 and unstable likelihoods at higher K further support cautious interpretation. Geographically replicated almond collections have often recovered more complex population structures [18,19,20,29,30,31,32,33,34].
Reproductive and dispersal biology may also contribute to the observed structure. Self-incompatibility promotes outcrossing, while the scale of insect pollen movement affects neighbourhood size [7,8,9]. Root-suckering in P. tenella can generate patches of ramets [10], and the 50 m minimum spacing used here reduces but does not eliminate this possibility. In related Prunus, frugivorous birds and mammals can disperse seeds over both short and long distances [11,12,13]. The relative importance of these processes cannot be estimated from the current marker panel, but they provide testable hypotheses for future landscape-genetic work.
From a conservation perspective, each sampled population harbours a distinct set of alleles and should be considered a potentially valuable component of Kazakhstan’s wild-almond gene pool. At this exploratory stage, the results support habitat protection, maintenance of sufficiently large and spatially connected flowering populations, and ex situ sampling from multiple spatially separated maternal plants rather than repeated collection within dense clonal patches. These recommendations apply to the four sampled localities and should guide expanded surveys, not rank entire species by conservation value.
Beyond marker coverage and missingness, several design limitations remain. Each taxon was represented by a single population, so taxonomic, geographic, and environmental effects cannot be disentangled, and within-taxon among-population variation cannot be estimated. The sampled shoots were not clone-corrected, ecological covariates were descriptive rather than replicated, and the dataset did not support comparable inference for observed heterozygosity, FIS, Hardy–Weinberg equilibrium, null-allele frequency, PIC, PID/PIDsib, or clone-corrected multilocus genotypes. The study should therefore be viewed as a regional snapshot and marker-transferability baseline. Future work should include multiple populations per taxon, larger spatially explicit samples, formal clone identification, and a substantially denser panel of reference-genome-mapped SNPs or sequencing markers, complemented by chloroplast data and quantitative morphology [17,35,36,37]. Pomological evaluation, seedling-vigour tests, and controlled graft-compatibility trials will also be required before any population can be assessed as a potential seed-rootstock resource.

5. Conclusions

Fifteen reproducible nSSR loci revealed appreciable variation within four sampled wild almond taxon-locality groups and significant differentiation among them. PCoA, unbiased Nei distances, UPGMA, and descriptive STRUCTURE analysis separated the four groups, while AMOVA attributed 76.5% of variation to within-group differences and 23.5% to among-group differences. P. spinosissima retained the highest mean He in both the full-panel and nine-locus sensitivity analyses. In contrast, the low full-panel estimate for P. petunnikowii was not robust to the removal of high-missing loci. Because one locality represented each taxon and the 15 loci were not verified as an evenly distributed genomic panel, the findings cannot separate taxon from geography. They should not be generalised to entire species ranges or the whole genome. The principal contribution is a transparent regional baseline that identifies transferable loci, quantifies the effect of missing data, and defines priorities for replicated, clone-corrected, genome-wide conservation-genetic surveys. The unknown genomic distribution means that some genomic regions may be overrepresented or entirely missed, and the uneven, potentially nonrandom missingness reduced comparability among groups. Accordingly, the numerical estimates and clustering patterns should be treated as hypotheses for validation rather than definitive estimates of species-wide genetic diversity or structure.

Author Contributions

Conceptualization, A.O., A.M. and Y.T.; methodology, M.Y., A.O. and Y.T.; software, S.K. and S.I.; validation, B.T. and T.S.; formal analysis, A.O., S.K. and M.Y.; investigation, A.O., T.S., A.M. and S.T.; resources, S.I. and B.T.; data curation, A.O. and S.T.; writing—original draft preparation, A.O.; writing—review and editing, A.O., S.T., A.M. and Y.T.; visualization, Y.T. and A.M.; supervision, S.T., A.M. and Y.T.; project administration, S.T.; funding acquisition, S.T., A.M. and S.I. All authors have read and agreed to the published version of the manuscript.

Funding

This research was funded by the Science Committee of the Ministry of Science and Higher Education of the Republic of Kazakhstan, Grant No. AP26198171, “Geoecological and molecular-genetic assessment, monitoring of the distribution and development of rare plant species of the genera Prunus, Sibiraea and Rosa (Rosaceae) in Kazakhstan”.

Data Availability Statement

The original contributions presented in this study are included in the article and Appendix A. The underlying genotype-scoring matrix, including missing-data codes, is available on request from the corresponding author due to institutional data-management requirements.

Conflicts of Interest

The authors declare no conflicts of interest.

Abbreviations

The following abbreviations are used in this manuscript:
AMOVAanalysis of molecular variance
CTABcetyltrimethylammonium bromide
DNeiunbiased Nei genetic distance
Heexpected heterozygosity
INeiunbiased Nei genetic identity
MCMCMarkov chain Monte Carlo
Nanumber of alleles
Neeffective number of alleles
nSSRnuclear simple sequence repeat
Ppercentage of polymorphic loci
PCoAprincipal coordinates analysis
PCRpolymerase chain reaction
PhiPTAMOVA-based genetic differentiation statistic
uHeunbiased expected heterozygosity
UPGMAunweighted pair group method with arithmetic mean

Appendix A

Table A1. Diagnostic morphological characteristics used for field verification of the four sampled wild almond taxa.
CharacterP. ledebourianaP. tenellaP. petunnikowiiP. spinosissima
HabitusShrub 1.5–2.0 m; spreading, unarmed branchesShrub 0.5–1.5 m; many short shoots; often suckeringShrub to 1 m; erect, unarmed branchesShrub to 2 m; spreading branches with long horizontal spines
LeavesLanceolate to oblong-ovate; 3.5–7.5 × 0.8–1.5 cm; serrate-dentateLinear to lanceolate; 3.5–7.0 × 1–2 cm; serrate-dentateLinear to linear-lanceolate; 2–3 × 0.3–0.5 cm; serrate-dentateLanceolate to cuneate-spatulate; 1.5–2.0 × 0.4–0.5 cm; entire or glandular-serrate
Petiole4–8 mm4–7 mmShort, generally <4 mmSessile or very short
FruitDensely tomentose; broadly ovate to rounded; 1.5–2.5 cmDensely tomentose; broadly ovate; 1.0–2.5 cmDensely tomentose; asymmetric, obliquely narrowed; 1.5–2.5 cmShort-tomentose to nearly glabrous; ovate to lanceolate, commonly falcate; 1.5–2.4 cm
StoneBroadly ovate to oblong-ovate; rough, shallowly groovedBroadly rounded to oblong-ovate; nearly symmetricalIrregularly ovate; asymmetric; obliquely tapered baseOvate to lanceolate; frequently asymmetric or falcate
Table A2. The 22 nSSR loci initially screened, including primer sequences and amplification conditions [14].
No.LocusRepeat MotifPrimer Sequence (5′-3′)Expected Size (bp)Annealing
Temperature (°C)
1CPDCT005(CT)14F: TTCAAGGAGAAGGCCTGAAA;
R: ATTGTGGGTTCCAACCAATG
11460 °C
2CPDCT007(GA)19F: TGCAAGTTGAATGTGGCAAT;
R: CTTTGGGTAGTGCAGGGATG
16458–62 °C
3CPDCT008(GA)18F: GAAGCAGCCATTCCTAGTGC;
R: TGTTTATGGACCTTAGTAGTCTGG
19158–60 °C
4CPDCT012(GA)12F: CAGACCGTCGTGTTGAAGTC;
R: GACCCGAATCGGAGTTGTAA
19858–60 °C
5CPDCT015(CT)20F: GAAACTCAGTGGCACAATCG;
R: GCAGGAGTTTCGAAAGGAAG
15460 °C
6CPDCT016(GA)19F: GGAAACCTGATTAGGGCACTT;
R: GGTCTGCTATACTGACCTAGGATT
19660 °C
7CPDCT022(CT)17F: TGATCGGCGTCTCCTTTATC;
R: AAAGCAAGCAGGCAAATGAA
15260 °C
8CPDCT023(GA)9F: GTGGCAAATGTTGGCAAAG;
R: AACACAAAGCAGCACCAAGA
17258–60 °C
9CPDCT025(CT)10F: GACCTCATCAGCATCACCAA;
R: TTCCCTAACGTCCCTGACAC
17260 °C
10CPDCT027(CT)19F: TGAGGAGAGCACTGGAGGAG;
R: CAACCGATCCCTCTAGACCA
17460 °C
11CPDCT028(GA)19F: TGAACGTTGCACTCCTTCAC;
R: ACCACCACCATAACCACCAT
17160 °C
12CPDCT031(GA)22F: AATTCATAAATCAACAAATCAACA;
R: GCAGAGCTTTTGGGTCAACT
17960 °C
13CPDCT033(CT)18F: CAAAACACAAAAACCCACCA;
R: ATTCGGGGAGTCAATCAGG
13260 °C
14CPDCT035(GA)17F: TCGAAGGAGGATGAAGTTGC;
R: ATATCACGAGGGGCAAAATG
14660 °C
15CPDCT038(GA)25F: ATCACAGGTGAAGGCTGTGG;
R: CAGATTCATTGGCCCATCTT
18158–60 °C
16CPDCT039(GA)15F: GGGAGAGAGGAGGAGAGTGG;
R: CAACCTCCAATTTCTTCGACA
14260 °C
17CPDCT040(GA)24F: TGATGAGGCCTAGAAATTGGA;
R: CACAGCAATCAGCAAAAAGC
16458–60 °C
18CPDCT042(GA)27F: ACGCGTTACAAGTGAGATGC;
R: TTGAAAAATCTTGATGGACGTG
19458–60 °C
19CPDCT043(GA)21F: CCTTCGTGAGTGTCCACCTG;
R: AGGGTCTGACTATCCACGATCT
11858–60 °C
20CPDCT044(GA)21F: ACATGCCGGGTAATTAGCAA;
R: AAAATGCACGTTTCGTCTCC
17560 °C
21CPDCT045(GA)16F: TGTGGATCAAGAAAGAGAACCA;
R: AGGTGTGCTTGCACATGTTT
14260 °C
22CPDCT046(GA)21F: TGGACATCGATTCAGAGAAAAA;
R: CGCAAGGTCAAACTTTCTCA
16660 °C
Loci retained for final analysis: CPDCT005, CPDCT007, CPDCT008, CPDCT012, CPDCT015, CPDCT016, CPDCT022, CPDCT023, CPDCT025, CPDCT027, CPDCT038/1, CPDCT039, CPDCT043, CPDCT045, and CPDCT046.
Table A3. Mean LnP(D), among-run standard deviation, and ΔK for STRUCTURE models with K = 1–10.
KMean LnP(D)SD LnP(D)ΔK
1−1622.800.62
2−1474.300.6964.33
3−1370.371.566.85
4−1277.101.28116.26
5−1332.2755.151.64
6−1297.0051.431.93
7−1360.8067.5359.89
8−5468.707298.370.06
9−10,039.3715,102.300.87
10−1526.00153.12
The K = 4 model had the largest ΔK and the lowest among-run variance. Values at K ≥ 5 were less stable, particularly K = 8–9.
Table A4. Loci with at least 30% missing genotypes in one or more sampled populations.
PopulationLocusMissing Data (%)Valid GenotypesMissing Genotypes
P. petunnikowiiCPDCT038/175515
P. petunnikowiiCPDCT00870614
P. petunnikowiiCPDCT04365713
P. ledebourianaCPDCT038/160812
P. tenellaCPDCT00760812
P. petunnikowiiCPDCT01260812
P. petunnikowiiCPDCT023501010
P. tenellaCPDCT01240128
P. petunnikowiiCPDCT00745119
P. petunnikowiiCPDCT01535137
Table A5. Sensitivity of mean expected heterozygosity (He) to exclusion of six loci with at least 20% missing genotypes across the complete dataset.
ChangeNine-Locus Sensitivity Means HeFull 15-Locus Mean HePopulation
+0.0390.5980.559P. ledebouriana
+0.0370.5250.488P. tenella
+0.1380.6090.471P. petunnikowii
+0.0430.6990.656P. spinosissima
+0.0640.6080.544Overall mean
The sensitivity subset excluded CPDCT007, CPDCT008, CPDCT012, CPDCT023, CPDCT038/1, and CPDCT043. Values were recalculated from the locus-by-population He estimates in Table A7. The analysis is descriptive and demonstrates that the low full-panel estimate for P. petunnikowii is not robust to loci with high missingness.
Table A6. Pairwise unbiased Nei genetic distance (DNei) and genetic identity (INei) among the four sampled populations.
Population PairDNeiINei
P. petunnikowiiP. spinosissima0.5840.557
P. ledebourianaP. spinosissima0.5940.552
P. tenellaP. petunnikowii0.7670.464
P. tenellaP. spinosissima0.8470.429
P. ledebourianaP. tenella0.9010.406
P. ledebourianaP. petunnikowii0.9150.401
Table A7. Expected heterozygosity (He) by locus and sampled population, with mean missing-data rates.
LocusP. ledebourianaP. tenellaP. petunnikowiiP. spinosissimaMean HeMean Missing Data (%)
CPDCT0050.5750.7350.4010.7050.6042.5
CPDCT0070.2770.3750.6780.7650.52427.5
CPDCT0080.7920.63700.5400.49222.5
CPDCT0120.3880.15300.4200.24026.2
CPDCT0150.5880.4320.7460.7350.62513.8
CPDCT0160.45100.5470.6350.4087.5
CPDCT0220.6230.2780.6640.7350.57510
CPDCT0230.5050.6000.1800.6450.48212.5
CPDCT0250.5800.6430.5190.5950.5845
CPDCT0270.7810.7810.7270.6900.74515
CPDCT038/10.6560.3600.4800.4050.47537.5
CPDCT0390.5150.6600.4920.6550.5817.5
CPDCT0430.3880.4750.2450.7750.47122.5
CPDCT0450.7550.6730.7400.8250.7486.2
CPDCT0460.5150.5210.6430.7200.6002.5

References

  1. Tirnaz, S.; Zandberg, J.; Thomas, W.J.W.; Marsh, J.; Edwards, D.; Batley, J. Application of crop wild relatives in modern breeding: An overview of resources, experimental and computational methodologies. Front. Plant Sci. 2022, 13, 1008904. [Google Scholar] [CrossRef] [Scilit] [PubMed]
  2. Barreca, D.; Nabavi, S.M.; Sureda, A.; Rasekhian, M.; Raciti, R.; Silva, A.S.; Annunziata, G.; Arnone, A.; Tenore, G.C.; Süntar, İ.; et al. Almonds (Prunus dulcis Mill. D.A. Webb): A source of nutrients and health-promoting compounds. Nutrients 2020, 12, 672. [Google Scholar] [CrossRef] [Scilit] [PubMed]
  3. Rahemi, A.; Gradziel, T. The Almonds and Related Species: Identification, Characteristics and Uses; Springer: Cham, Switzerland, 2024. [Google Scholar] [CrossRef] [Scilit]
  4. Govaerts, R.; Nic Lughadha, E.; Black, N.; Turner, R.; Paton, A. The World Checklist of Vascular Plants is a continuously updated resource for exploring global plant diversity. Sci. Data 2021, 8, 215. [Google Scholar] [CrossRef] [Scilit] [PubMed]
  5. Orazov, A.; Myrzagaliyeva, A.; Tustubayeva, S.; Irsaliyev, S.; Sailaubekova, A.; Turalin, B. Valuable morphological traits and genetic resources of wild almond relatives in Kazakhstan. ES Food Agrofor. 2025, 20, 1577. [Google Scholar] [CrossRef] [Scilit]
  6. Yazbek, M. Systematics of Prunus Subgenus Amygdalus: Monograph and Phylogeny. Ph.D. Thesis, Cornell University, Ithaca, NY, USA, 2010. [Google Scholar]
  7. Tao, R.; Iezzoni, A.F. The S-RNase-based gametophytic self-incompatibility system in Prunus exhibits distinct genetic and molecular features. Sci. Hortic. 2010, 124, 423–433. [Google Scholar] [CrossRef] [Scilit]
  8. Gómez, E.M.; Dicenta, F.; Batlle, I.; Romero, A.; Ortega, E. Cross-incompatibility in the cultivated almond (Prunus dulcis): Updating, revision and correction. Sci. Hortic. 2019, 245, 218–223. [Google Scholar] [CrossRef] [Scilit]
  9. Sáez, A.; Aizen, M.A.; Medici, S.; Viel, M.; Villalobos, E.; Negri, P. Bees increase crop yield in an alleged pollinator-independent almond variety. Sci. Rep. 2020, 10, 3177. [Google Scholar] [CrossRef] [Scilit] [PubMed]
  10. Nicotra, A.; Moser, L. Prunus tenella as a hypothetical rootstock for sweet cherry. Acta Hortic. 1985, 169, 217–224. [Google Scholar] [CrossRef] [Scilit]
  11. Jordano, P. Pollination biology of Prunus mahaleb L.: Deferred consequences of gender variation for fecundity and seed size. Biol. J. Linn. Soc. 1993, 50, 65–84. [Google Scholar] [CrossRef]
  12. García, C.; Jordano, P.; Godoy, J.A. Contemporary pollen and seed dispersal in a Prunus mahaleb population: Patterns in distance and direction. Mol. Ecol. 2007, 16, 1947–1955. [Google Scholar] [CrossRef] [Scilit] [PubMed]
  13. Grünewald, C.; Breitbach, N.; Böhning-Gaese, K. Tree visitation and seed dispersal of wild cherries by terrestrial mammals along a human land-use gradient. Basic Appl. Ecol. 2010, 11, 532–541. [Google Scholar] [CrossRef] [Scilit]
  14. Mnejja, M.; Garcia-Mas, J.; Howad, W.; Arús, P. Development and transportability across Prunus species of 42 polymorphic almond microsatellites. Mol. Ecol. Notes 2005, 5, 531–535. [Google Scholar] [CrossRef] [Scilit]
  15. Martínez-Gómez, P.; Arulsekar, S.; Potter, D.; Gradziel, T.M. An extended interspecific gene pool available to peach and almond breeding as characterised using simple sequence repeat markers. Euphytica 2003, 131, 313–322. [Google Scholar] [CrossRef] [Scilit]
  16. Rahemi, A.; Fatahi, R.; Ebadi, A.; Taghavi, T.; Hassani, D.; Gradziel, T.; Folta, K.; Chaparro, J. Genetic diversity of some wild almonds and related Prunus species revealed by SSR and EST-SSR markers. Plant Syst. Evol. 2012, 298, 173–192. [Google Scholar] [CrossRef] [Scilit]
  17. Orazov, A.; Yermagambetova, M.; Myrzagaliyeva, A.; Mukhitdinov, N.; Tustubayeva, S.; Turuspekov, Y.; Almerekova, S. Plant height variation and genetic diversity between Prunus ledebouriana and Prunus tenella based on SSR markers in East Kazakhstan. PeerJ 2024, 12, e16735. [Google Scholar] [CrossRef] [Scilit] [PubMed]
  18. Hasanbegović, J.; Hadžiabulić, S.; Kurtović, M.; Gaši, F.; Lazović, B.; Dorbić, B.; Skender, A. Genetic characterisation of almond (Prunus amygdalus L.) using microsatellite markers in the area of the Adriatic Sea. Turk. J. Agric. For. 2021, 45, 797–806. [Google Scholar] [CrossRef] [Scilit]
  19. Yangöz, G.B.; Güney, M. Characterisation and diversity assessment of almond (Prunus dulcis Mill.) genotypes and cultivars using simple sequence repeat markers. Genet. Resour. Crop Evol. 2025, 72, 5887–5901. [Google Scholar] [CrossRef] [Scilit]
  20. Bayazıt, S.; Çalışkan, O.; Coşkun, Ö.F.; Yaman, M. Genetic variability in almond (Prunus dulcis L.) in South Türkiye: Morphological, biochemical, and SSR analyses. BMC Plant Biol. 2025, 25, 1176. [Google Scholar] [CrossRef] [Scilit] [PubMed]
  21. Doyle, J.J.; Doyle, J.L. A rapid DNA isolation procedure for small quantities of fresh leaf tissue. Phytochem. Bull. 1987, 19, 11–15. [Google Scholar]
  22. Porebski, S.; Bailey, L.G.; Baum, B.R. Modification of a CTAB DNA extraction protocol for plants containing high polysaccharide and polyphenol components. Plant Mol. Biol. Rep. 1997, 15, 8–15. [Google Scholar] [CrossRef] [Scilit]
  23. Peakall, R.; Smouse, P.E. GenAlEx 6.5: Genetic analysis in Excel. Population genetic software for teaching and research: An update. Bioinformatics 2012, 28, 2537–2539. [Google Scholar] [CrossRef] [Scilit] [PubMed]
  24. Tamura, K.; Stecher, G.; Kumar, S. MEGA11: Molecular Evolutionary Genetics Analysis version 11. Mol. Biol. Evol. 2021, 38, 3022–3027. [Google Scholar] [CrossRef] [Scilit] [PubMed]
  25. Pritchard, J.K.; Stephens, M.; Donnelly, P. Inference of population structure using multilocus genotype data. Genetics 2000, 155, 945–959. [Google Scholar] [CrossRef] [Scilit] [PubMed]
  26. Evanno, G.; Regnaut, S.; Goudet, J. Detecting the number of clusters of individuals using the software STRUCTURE: A simulation study. Mol. Ecol. 2005, 14, 2611–2620. [Google Scholar] [CrossRef] [Scilit] [PubMed]
  27. Earl, D.A.; vonHoldt, B.M. STRUCTURE HARVESTER: A website and program for visualising STRUCTURE output and implementing the Evanno method. Conserv. Genet. Resour. 2012, 4, 359–361. [Google Scholar] [CrossRef] [Scilit]
  28. Szikriszt, B.; Hegedűs, A.; Halász, J. Review of genetic diversity studies in almond (Prunus dulcis). Acta Agron. Hung. 2011, 59, 379–395. [Google Scholar] [CrossRef] [Scilit]
  29. Zeinalabedini, M.; Majidian, P.; Ashori, R.; Gholaminejad, A.; Ebrahimi, M.A.; Martinez-Gomez, P. Integration of molecular and geographical data analysis of Iranian Prunus scoparia populations for genetic diversity assessment and conservation planning. Sci. Hortic. 2019, 247, 49–57. [Google Scholar] [CrossRef] [Scilit]
  30. Delplancke, M.; Alvarez, N.; Benoit, L.; Espíndola, A.; Joly, H.; Neuenschwander, S.; Arrigo, N. Evolutionary history of almond tree domestication in the Mediterranean basin. Mol. Ecol. 2013, 22, 1092–1104. [Google Scholar] [CrossRef] [Scilit] [PubMed]
  31. Tahan, O.; Geng, Y.; Zeng, L.; Dong, S.; Chen, F.; Chen, J.; Song, Z.; Zhong, Y. Assessment of genetic diversity and population structure of Chinese wild almond, Amygdalus nana, using EST- and genomic SSRs. Biochem. Syst. Ecol. 2009, 37, 146–153. [Google Scholar] [CrossRef] [Scilit]
  32. Fernández i Martí, A.; Font i Forcada, C.; Kamali, K.; Rubio-Cabetas, M.J.; Wirthensohn, M.; Socias i Company, R. Molecular analyses of evolution and population structure in a worldwide almond pool assessed by microsatellite markers. Genet. Resour. Crop Evol. 2015, 62, 205–219. [Google Scholar] [CrossRef] [Scilit]
  33. Halász, J.; Kodad, O.; Galiba, G.M.; Skola, I.; Ercisli, S.; Ledbetter, C.A.; Hegedűs, A. Genetic variability is preserved among strongly differentiated and geographically diverse almond germplasm: An assessment by simple sequence repeat markers. Tree Genet. Genomes 2019, 15, 12. [Google Scholar] [CrossRef] [Scilit]
  34. Delplancke, M.; Alvarez, N.; Espíndola, A.; Joly, H.; Benoit, L.; Brouck, E.; Arrigo, N. Gene flow among wild and domesticated almond species: Insights from chloroplast and nuclear markers. Evol. Appl. 2012, 5, 317–329. [Google Scholar] [CrossRef] [Scilit] [PubMed]
  35. Rahimi-Dvin, S.; Gharaghani, A.; Pourkhaloee, A. Genetic diversity, population structure, and relationships among wild and domesticated almond germplasm revealed by ISSR markers. Adv. Hortic. Sci. 2020, 34, 287–300. [Google Scholar] [CrossRef] [Scilit]
  36. Khojand, S.; Zeinalabedini, M.; Azizinezhad, R.; Imani, A.; Ghaffari, M.R. Genomic exploration of Iranian almond germplasm: Diversity, population structure, and linkage disequilibrium through genotyping-by-sequencing. BMC Genom. 2024, 25, 1101. [Google Scholar] [CrossRef] [Scilit] [PubMed]
  37. Zhang, H.X.; Zhang, X.F.; Zhang, J. Genetic divergence and evolutionary adaptation of four wild almond species. Forests 2024, 15, 834. [Google Scholar] [CrossRef] [Scilit]
Figure 1. Locations of the four wild almond populations sampled in Kazakhstan in 2025: Prunus tenella (green), P. ledebouriana (red), P. petunnikowii (blue), and P. spinosissima (yellow).
Ijpb 17 00067 g001
Figure 2. Representative fruits of the sampled wild almond taxa: Prunus tenella, P. ledebouriana, P. petunnikowii, and P. spinosissima. Photographs were taken at the collection localities.
Ijpb 17 00067 g002
Figure 3. Principal coordinates analysis of the four sampled taxon-locality groups based on nSSR profiles. Axis labels show the percentage of variation explained.
Ijpb 17 00067 g003
Figure 4. Principal coordinates analysis of 80 individual wild almond samples based on nSSR profiles. Symbols and colours identify the four sampled taxon-locality groups; axis labels show the percentage of variation explained.
Ijpb 17 00067 g004
Figure 5. High-resolution heatmap of pairwise unbiased Nei genetic distances (DNei) and UPGMA dendrogram for the four sampled wild almond taxon-locality groups.
Ijpb 17 00067 g005
Figure 6. Evanno ΔK values derived from STRUCTURE models evaluated at K = 1–10; ΔK is defined for K = 2–9. The strongest support occurred at K = 4.
Ijpb 17 00067 g006
Figure 7. Mean LnP(D) across STRUCTURE models with K = 1–10; among-run variability is reported in Table A3.
Ijpb 17 00067 g007
Figure 8. Bayesian assignment of 80 wild almond individuals at K = 4. Each vertical bar represents one individual, and coloured fractions indicate estimated membership in the four genetic clusters. Individuals are arranged by sampled taxon-locality group.
Ijpb 17 00067 g008
Table 1. Sampling localities and habitat characteristics of the four wild almond populations sampled in Kazakhstan in 2025.
SpeciesCoordinatesElevation (m)Region and LocalityClimate and PrecipitationSoil and Humidity
P. ledebouriana47.151592,
82.021929
~1400Tarbagatai, eastern Kazakhstan; Tarbagatai State National Nature Park, Abai RegionJan −15 °C; Jul +22 to +25 °C; 300–500 mm year−1Kastanozem and mountain-meadow soils; 55–70%
P. tenella48.936730,
58.646700
~300–500Mugalzhar, western Kazakhstan; near Emba, Aktobe RegionJan −16 °C; Jul +24 to +26 °C; 250–350 mm year−1Light Kastanozem, calcareous and saline soils; 45–60%
P. petunnikowii43.599153,
68.705125
~800–1000Karatau, southern Kazakhstan; Karatau State Nature Reserve, Turkistan RegionJan −5 °C; Jul +28 to +30 °C; 200–300 mm year−1Light Kastanozem, chernozem-derived and gravelly soils; 30–40%
P. spinosissima42.430817,
70.056503
~700–900Mashat, southern Kazakhstan; near Mashat Nature Reserve, Turkistan RegionJan −5 °C; Jul +28 to +30 °C; 200–300 mm year−1Light Kastanozem, chernozem-derived and gravelly soils; 30–40%
Table 2. Genetic diversity and data-completeness statistics for the 15 retained nSSR loci, averaged across four sampled wild almond populations.
LocusNNaNeIHeuHeMissing Data (%)He Rank
CPDCT00519.53.502.801.0770.6040.6362.54
CPDCT00714.53.752.590.9810.5240.56827.59
CPDCT00815.54.002.690.9850.4920.52022.510
CPDCT01214.81.751.380.3690.2400.25526.215
CPDCT01517.34.002.971.1430.6250.66613.83
CPDCT01619.02.751.900.7100.3920.4135.013
CPDCT02219.83.502.380.9080.5100.5311.26
CPDCT02316.03.502.130.8140.4520.48120.011
CPDCT02518.03.252.330.8740.5000.53010.07
CPDCT02717.06.004.011.5460.7450.79215.02
CPDCT038/112.52.751.940.7100.4010.43937.512
CPDCT03918.83.252.320.8620.4930.5186.28
CPDCT04316.02.751.890.6720.3730.39820.014
CPDCT04518.85.004.181.4770.7480.7916.21
CPDCT04619.33.502.761.0440.5650.5943.85
N, mean number of valid genotypes; Na, number of alleles; Ne, effective number of alleles; I, Shannon information index; He, expected heterozygosity; uHe, unbiased expected heterozygosity.
Table 3. Mean genetic diversity statistics for four wild almond populations sampled in Kazakhstan in 2025.
PopulationNNaNeIHeuHeP (%)Missing Data (%)
P. ledebouriana18.13.672.591.0180.5590.595100.09.7
P. tenella17.23.072.330.8540.4880.51993.314.0
P. petunnikowii13.13.002.310.8310.4710.51186.734.7
P. spinosissima20.04.473.241.2500.6560.691100.00.0
Overall mean17.13.552.620.9880.5440.57995.014.6
N, mean number of valid genotypes per locus; Na, number of alleles; Ne, effective number of alleles; I, Shannon information index; He, expected heterozygosity; uHe, unbiased expected heterozygosity; P, polymorphic loci.
Table 4. Analysis of molecular variance among and within the four sampled wild almond populations.
Source of VariationdfSSMSEstimated VarianceVariation (%)
Among populations3103.13834.3791.47823.5
Within populations76366.5004.8224.82276.5
Total79469.6376.300100.0
The significance of PhiPT was evaluated using 999 permutations.
Disclaimer/Publisher’s Note: The statements, opinions and data contained in all publications are solely those of the individual author(s) and contributor(s) and not of MDPI and/or the editor(s). MDPI and/or the editor(s) disclaim responsibility for any injury to people or property resulting from any ideas, methods, instructions or products referred to in the content.