Article

Development of Salt and Drought Tolerance Classification in the Kazakhstan Cotton Collection Using Optimal Phenotypic Traits


1
Plant Genetic Engineering Laboratory, National Center for Biotechnology, Astana 010000, Kazakhstan
2
General Biology and Genomics Department, Faculty of Natural Sciences, L.N. Gumilyov Eurasian National University, Astana 010000, Kazakhstan
3
Institute of Veterinary and Agrotechnology, West Kazakhstan Agrarian and Technical University Named After Zhangir Khan, Oral 090009, Kazakhstan
4
Department of Transfer and Adaptation of Crop Varieties, Agricultural Experimental Station of Cotton and Melon Growing, Atakent 160525, Kazakhstan
*
Author to whom correspondence should be addressed.
Int. J. Plant Biol. 2026, 17(8), 65; https://doi.org/10.3390/ijpb17080065
Submission received: 23 May 2026 / Revised: 17 July 2026 / Accepted: 21 July 2026 / Published: 28 July 2026
(This article belongs to the Section Plant Response to Stresses)

Abstract

In arid and semi-arid regions, salinity and drought limit cotton productivity. As the northernmost cotton-growing country, Kazakhstan often deals with these issues. The objective of this study was to classify salt- and drought-tolerant groups within the Kazakhstan cotton collection based on key phenotypic traits. Fifty-six Gossypium hirsutum genotypes were evaluated under controlled conditions using NaCl and PEG-6000. Six morphophysiological traits, including germination rate, plant height, fresh weight, root dry weight, and relative water content, were analyzed. Increasing NaCl and PEG levels reduced vegetative growth, while germination remained relatively stable under moderate stress. Regression analysis identified 200 mM NaCl as the optimal salinity level for salt tolerance and 20–30% PEG as the optimal level for drought tolerance. Cluster analysis using membership function values grouped the genotypes into five tolerance categories. Eight lines including M-4016-6, M-4031-8, M-4014-6, M-4029-9, M-4016-7, M-4016-8, M-4020-2, and M-4016-4 exhibited high tolerance to both stresses. Additional lines exhibited combined tolerance, indicating strong breeding potential. Principal component analysis revealed an inverse relationship between salt and drought tolerance, suggesting stress-specific adaptation. This study is the first to report on the development of a classification system for salt and drought tolerance in the Kazakhstan Cotton Collection. The results demonstrate substantial genetic variability and highlight the potential for developing cotton cultivars adapted environments prone to stress.

1. Introduction

Cotton (Gossypium L.) is a major industrial crop that is essential to the global textile sector [1]. It plays a significant role in the agricultural economies of countries such as China, India, the United States, Brazil, and Pakistan. Together, these countries account for the majority of global cotton production and provide livelihoods for millions of people worldwide [2]. The four main cultivated cotton species are diploids (G. herbaceum and G. arboreum) and tetraploids (G. barbadense and G. hirsutum) [3]. Of these four cultivated species, G. hirsutum is characterized by its high yield potential [4], broad environmental adaptability [5], and medium fiber quality [6]. It accounts for approximately 90–95% of global cotton production, amounting to 2.5% of the world’s cultivated area [7].
G. hirsutum is cultivated on 33 million hectares across more than 100 countries [8] and provides income for around 250 million people, employing 7% of the workforce in developing countries that produce cotton [9]. Cotton is a major fiber crop. Sixty-four percent of its fiber is used for apparel, 28% for household furnishings, and 8% for industrial applications [10].
According to the U.S. Foreign Agricultural Service, the global production of cotton was 117.8 million bales. China is expected to lead production with an estimated 34.5 million bales, accounting for 29% of the total. Following China are India with 23.5 million bales (20%), Brazil with 18.8 million bales (16%), and the United States with approximately 13.9 million bales (about 12%). Pakistan, Australia, and Turkey contribute smaller shares. Together, China and India account for nearly half of the global output.
In Kazakhstan, cotton research is a vital component of agricultural science, because this crop is essential to the national textile industry. It is unique in that it is northernmost nation in the world where cotton is cultivated [11]. Cotton is cultivated annually on approximately 115,000–125,000 hectares, with about 80,000–85,000 of those hectares concentrated in the Maktaaral and Zhetisay districts of the Turkistan Region [12].
The Turkestan region of Kazakhstan is particularly vulnerable to drought, salinity, and infestations of major cotton pests, such as the beetroot borer, cotton bollworm, spider mites, and aphids. Recent studies have shown a significant warming trend and a decrease in annual precipitation across the region’s natural zones, along with an increase in air temperatures [13]. In Turkestan, all agricultural products are produced using chemicals and pesticides. The excessive use of fertilizers and pesticides pollutes the soil and the environment with biogenic elements, negatively impacting the health of the population. These findings underscore the region’s growing vulnerability to climate change and the urgent need for effective adaptation strategies to maintain cotton productivity amid mounting environmental challenges [11,14,15]. Therefore, it is necessary to study genotypes adapted to local climatic conditions to improve the efficiency of agricultural production. Our study addresses this gap by systematically evaluating both salinity and drought tolerance within the same germplasm collection.
Globally, saline soils cover more than 833 million hectares of land, accounting for an estimated 8.7 % of the Earth’s surface [16]. Meanwhile, soil drought affects approximately 45% of the world’s agricultural land. Together, drought and salinization could result in the loss of up to 50% of the world’s arable land [17]. Compared to many other crops, cotton is relatively tolerant of salinity and drought stress [18] and can be cultivated on saline–alkaline soils [19]. However, under severe or combined stress, cotton yield losses may exceed 50% [20], accompanied by deterioration in fiber length, strength, and quality [21]. These impacts have been reported in major cotton-producing regions worldwide [22]. Current research studies increasingly focuses on the molecular basis of stress tolerance [23], including antioxidant defense systems [24], osmoprotectant biosynthesis [25], and stress-responsive transcription factors [26]. Despite progress in understanding these mechanisms [18], integrating phenotypic data from global germplasm with locally adapted materials is necessary, particularly in regions exposed to combined drought and salinity stress, such as Central Asia [27].
The tolerance of cotton to drought and salinity is fundamentally driven by osmotic stress resulting from water deficits. The early responses of plant to these stresses are largely similar because they share key morphological, physiological, biochemical, and molecular mechanisms [28]. At the morphological level, adaptive changes in roots and leaves are essential for reducing water loss and improving water-use efficiency. Under both stresses, cotton plants generally show reduced shoot growth, altered root architecture, and decreased biomass. However, under drought roots may grow deeper to access available water. Under prolonged salinity stress, plants experience not only osmotic and ionic stress, but also Na+ toxicity. This results in a higher accumulation of Na+ in shoots than in roots, particularly in sensitive genotypes [29]. At the physiological level, plant responses to these abiotic stresses involve complex regulatory pathways, including stomatal closure, reduced leaf expansion, and decreased photosynthetic rates. Salt-tolerant genotypes maintain a better K+/Na+ balance efficiently sequestering Na+ sequestration into vacuoles through Na+/H+ antiporters and proton pumps, such as V-ATPase and V-PPase. This reduces cytoplasmic toxicity [30].
At the biochemical level, osmotic adjustment involves the accumulation of compatible solutes, such as proline and soluble sugars, and the activation of antioxidant enzymes, including superoxide dismutase (SOD), catalase (CAT), and ascorbate peroxidase (APX). These processes mitigate oxidative stress [31]. Non-enzymatic antioxidants, such as ascorbate, glutathione, carotenoids, and tocopherols also contribute to ROS scavenging [32]. At the molecular level, plant tolerance is determined by differences in the genome, transcriptome, and proteome [33]. Tolerant genotypes often possess unique stress-responsive genes and exhibit enhanced or constitutive expression of genes involved in stress adaptation. This can lead to leaf senescence, impaired photosynthesis, and further growth inhibition [34]. Overall, although drought and salinity share common osmotic stress responses, salinity imposes additional ionic constraints that require specialized ion homeostasis mechanisms for effective tolerance.
The objectives of this study were (1) evaluating the phenotypic variability of 56 cotton genotypes under salinity (NaCl) and drought (PEG-6000) stress, (2) identifying suitable NaCl and PEG-6000 levels for screening a large number of cotton materials, and (3) identifying the most informative traits for reliably screening and classifying genotypes. Fourth, to identify and recommend cotton genotypes with combined tolerance to both salinity and drought stresses.

2. Materials and Methods

2.1. Research Materials and Growth Conditions

This study examined 56 lines of G. hirsutum lines sourced from the “Cotton and Melon Agricultural Experimental Station” LLP in the Maktaaral district of the Turkestan region. Phenotypic evaluation was performed at the Plant Genetic Engineering Laboratory of the National Center for Biotechnology in Astana, Kazakhstan. Seedlings were grown in a phytotron chamber under the following controlled conditions: a 14-h/10-h (day/night) photoperiod, a temperature regime of 28/14 °C (day/night), a light intensity of 450 μmol·m−2·s−1, and a relative humidity of 60–80% [35]. To evaluate traits, 125 g of sterile soil (autoclaved at 121 °C for twenty minutes under standard pressure (1.1 atm)) was sown with seeds from each sample in plastic trays measuring 45 cm × 35 cm. The plastic tray was divided into eight compartments, with each compartment assigned to a single genotype under a specific treatment. Each compartment was considered an independent experimental unit. Ten seeds from each genotype were selected for each treatment, washed three times with sterile distilled water, and soaked in sterile water at room temperature for twelve hours. An experiment was conducted on 56 cotton lines to simulate salt stress in a controlled environment using NaCl concentrations of 100, 150, 200, 250, and 300 mM.
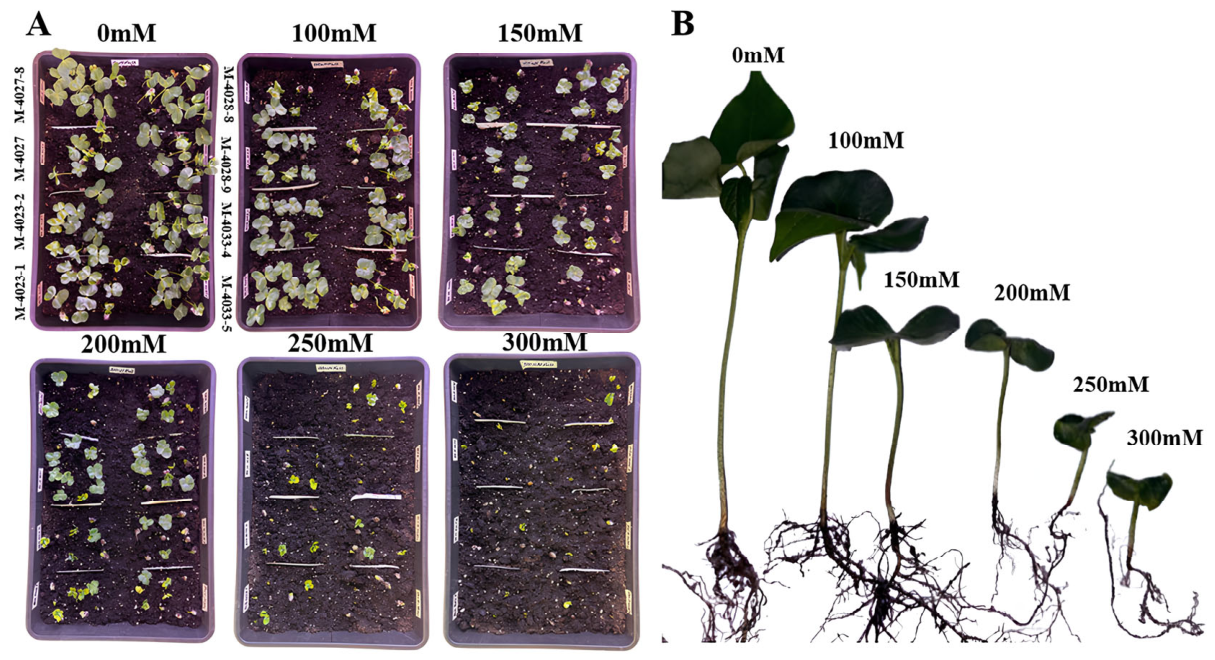
The corresponding salt solutions were prepared as described. Each treatment was applied separately to evaluate the effects of increasing salinity levels on seed germination and early seedling growth. Each experimental unit received 125 mL of sterilized water (control, 0 mM) and 125 mL of NaCl solution every three days (Figure 1).
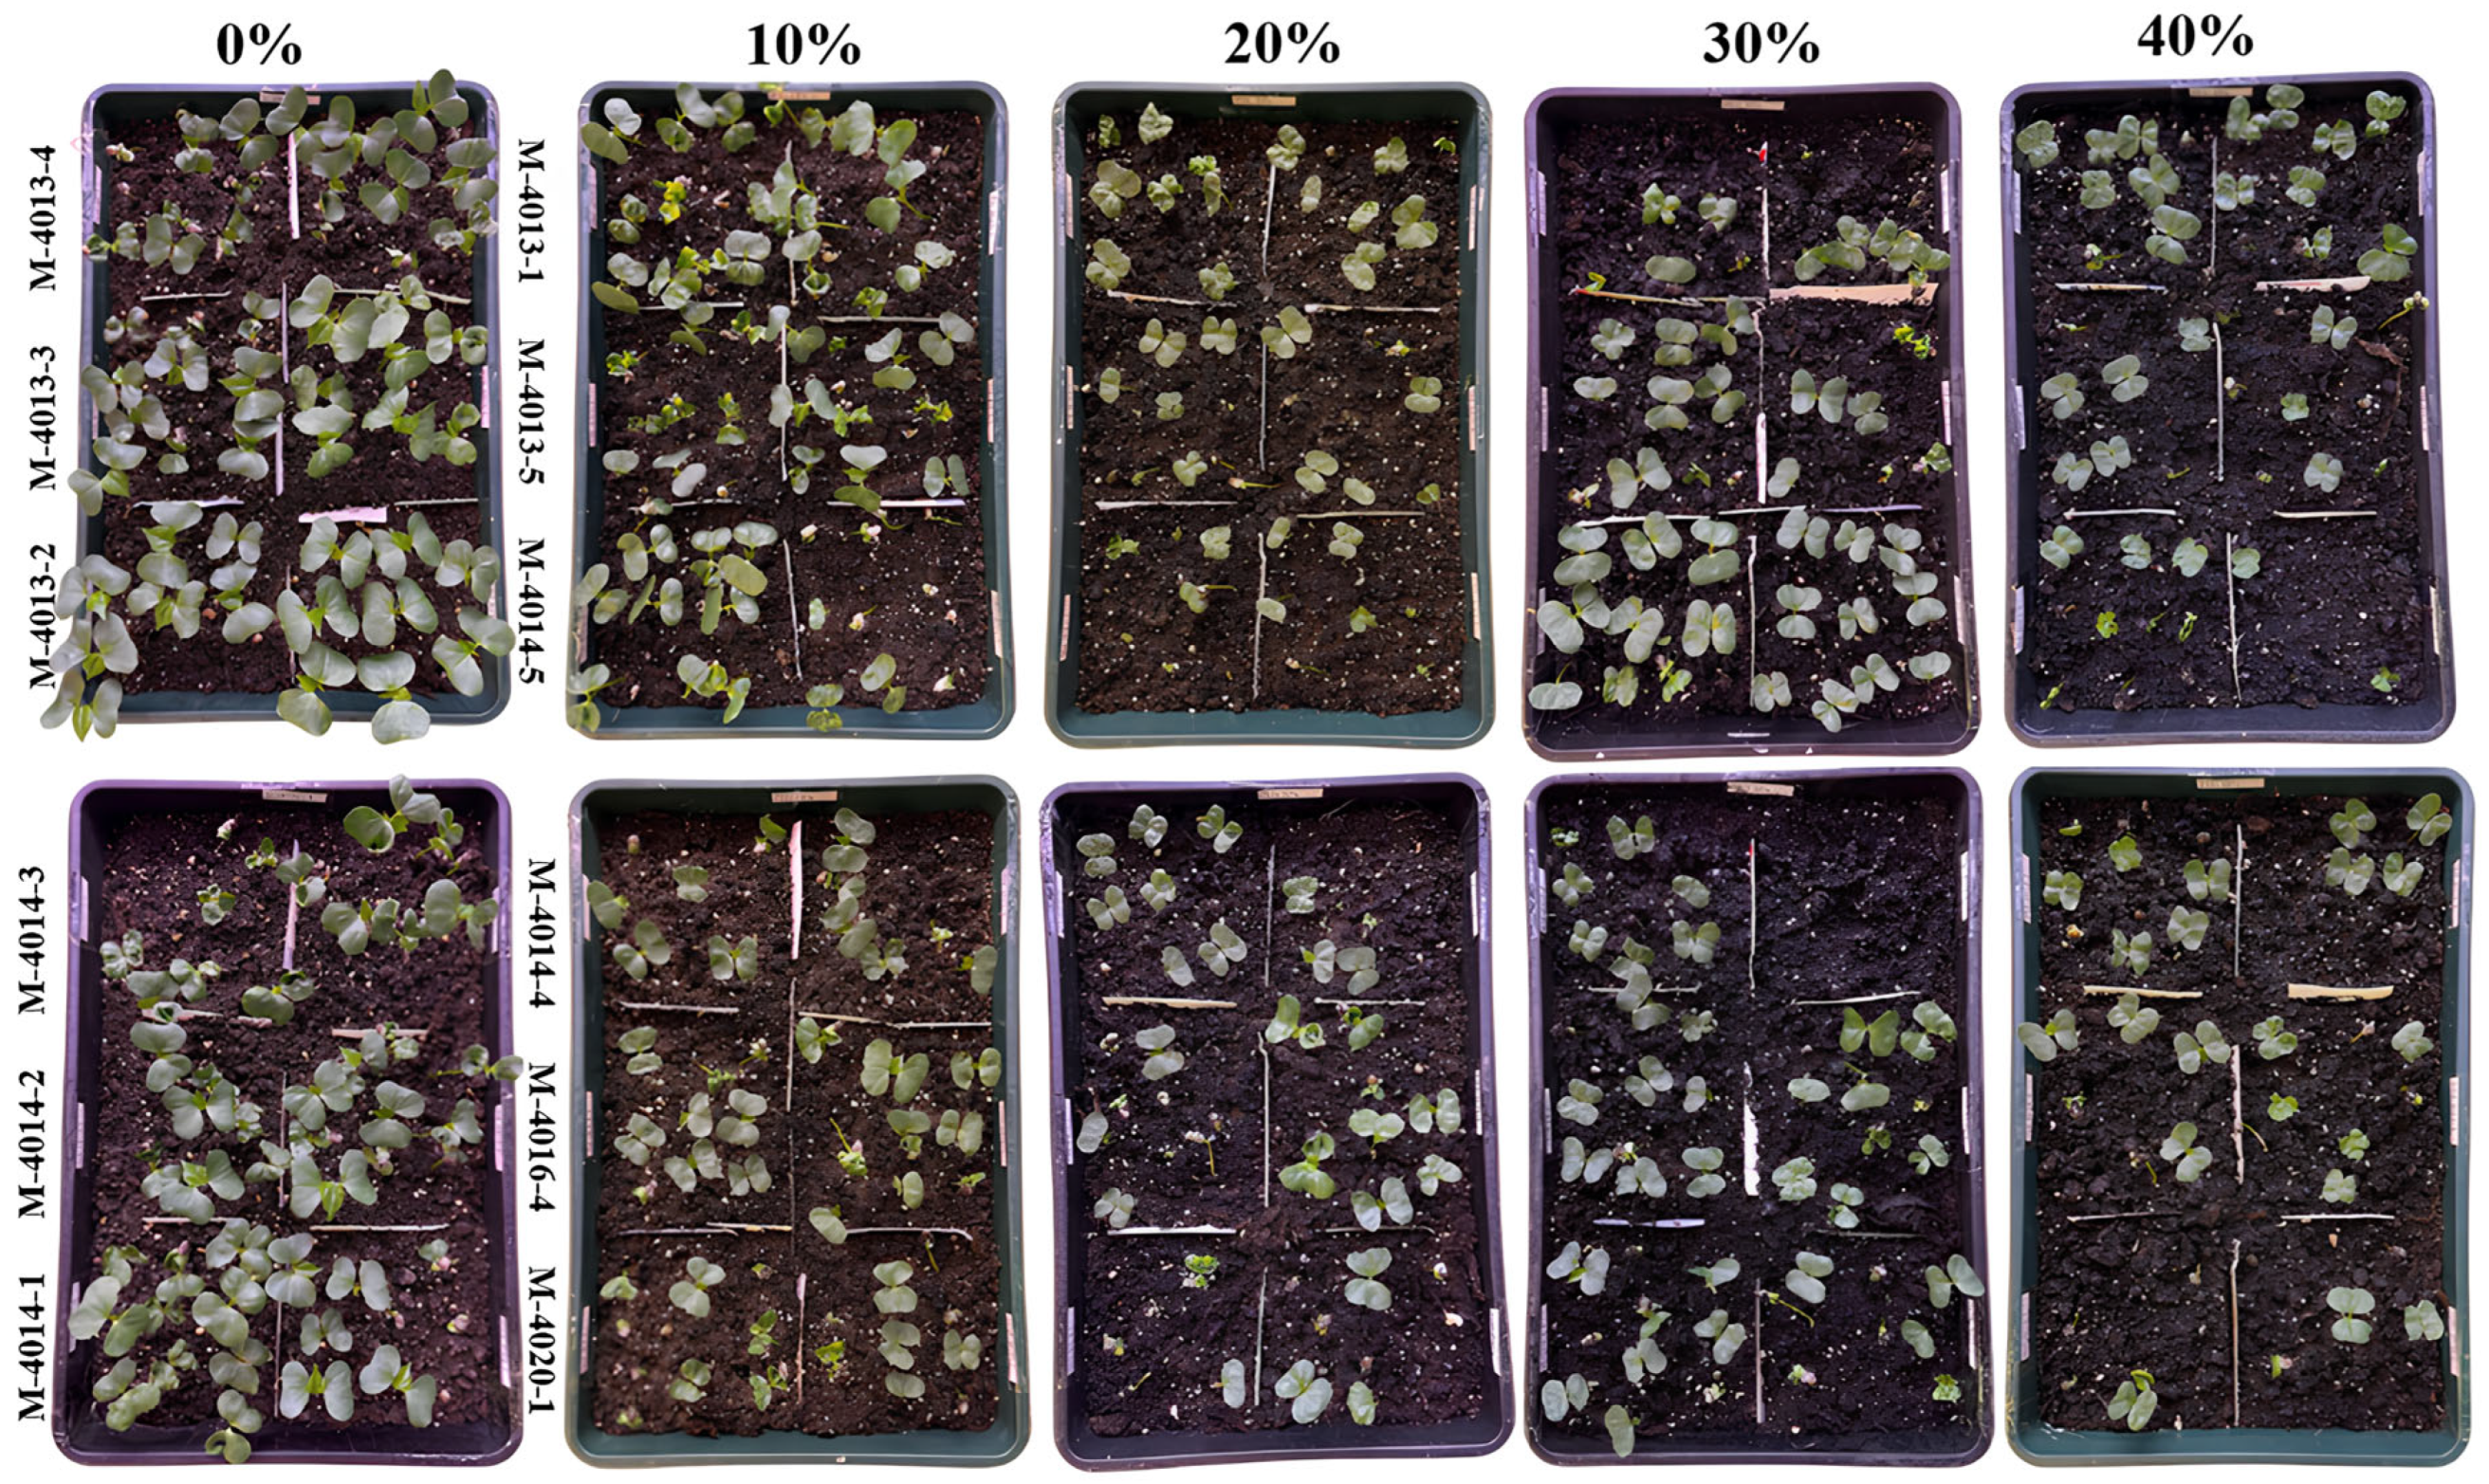
To classify the lines of the Kazakhstan cotton collection according to drought tolerance, 56 lines were screened. Polyethylene glycol 6000 (PEG-6000; H(OCH2CH2)nOH; Sigma-Aldrich, St. Louis, MO, USA) was used to induce drought stress. A preliminary experiment was conducted on 12 cotton lines to determine the optimal PEG-6000 concentration. The experiment used PEG-6000 concentrations of 0% (control), 10%, 20%, 30%, and 40%. The remaining 44 lines were then evaluated at the optimal concentrations of 20% and 30%. Each experimental unit was treated with 125 mL of PEG-6000 solution on the first day of sowing and subsequently watered with 125 mL of sterilized water every three days (Figure 2).

2.2. Phenotypic Data Collection

After 14 days of seedling growth, under controlled laboratory conditions, six phenotypic traits were recorded. These include:
Germination rate (GR, %): the proportion of germinated seeds to the total number of seeds sown.
Plant fresh weight (PFW, g): The seedlings were gently removed from the soil substrate, washed to eliminate residues, and lightly blotted with paper. The combined fresh biomass of the shoots and roots was weighed on analytical scales and expressed in grams.
Plant height (PH, cm): The vertical length of each seedling was determined by measuring the distance from the stem base (root collar) to the tip of the main shoot with a ruler. Values were recorded in centimeters.
Root dry weight (RDW, g): The root systems were carefully cleaned of substrate, dried under the same conditions as the shoots, and weighed using precision scales. The dry weight of the roots was recorded in grams.
Cotyledon area (CA, cm2): The cotyledons were detached, and their length (CL) and cotyledon width (CW) were measured. The surface area was calculated using the standard ellipse approximation formula [36].
C A = C L × C W 4 × π
Relative water content (RWC, %): Fully developed leaves were collected and immediately weighed to determine their fresh weight (FW, in g). The samples were then immersed in deionized water at room temperature (24 °C) for eight hours to obtain the turgid weight (TW, g). Next, the samples were dried in an oven at 80 °C for 48 h until they reached a constant weight. This weight was used to determine the dry weight (DW, g). Relative water content was calculated using the following formula [37]:
R W C = F W D W T W D W × 100 %

2.3. Phenotypic Data Analysis

Minimum and maximum values, mean ± standard deviation (SD), mean square values, and levels of statistical significance were determined for each trait.
To further assess drought tolerance, the drought tolerance coefficient (DTC) was calculated for each trait as the ratio of the values obtained under control and stress conditions [38]:
D T C i j = X i j s X i j c
where DTCij is the drought tolerance coefficient of trait j for genotype i, and XijS and XijC are the measured values of the trait j under stress (s) and control (c) conditions, respectively. This coefficient reflects how stable a genotype’s performance is under stress compared to optimal conditions.
However, since drought tolerance is a complex quantitative trait, relying on a single parameter may not capture its multidimensional nature. Therefore, composite indices such as the membership function values for drought tolerance (MFVD) have been proposed. The MFVD integrates DC values across multiple traits to provide a comprehensive evaluation of genotypic performance under abiotic stress. The membership value for each trait is calculated as follows:
U i j = D T C i j D T C j m i n D T C j m a x D T C j m i n
The average membership function value for genotype (i) is given by:
U = 1 n j 1 n U i j
where DCjmax and DCjmin represent the maximum and minimum drought tolerance coefficients for trait (j), respectively.
Genotypes were classified into five drought tolerance categories based on the average MFVD value.
If U mean ≥ U + 1.64 × SD, the genotype is considered highly tolerant.
If U + 1 × SD ≤ U mean < U + 1.64 × SD, the genotype is considered tolerant.
If U − 1 × SD ≤ U mean < U + 1 × SD, the genotype is moderately tolerant.
If U − 1.64 × SD ≤ U mean < U − 1 × SD, the genotype is susceptible.
If U mean < U − 1.64 × SD, then the genotype is highly susceptible.
Salt tolerance was calculated using the same formula, as the ratio of trait values measured under salt-stress (SS) and control (non-saline) conditions [39].
To estimate the degree of stress-induced damage, the Drought Damage Index (DDI) and Salt Damage Index (SDI) were calculated as the complement of the tolerance coefficient:
D D I = 1 D T C i j
S D I = 1 S T C i j
where DTC and STC are the drought and salt tolerance coefficients, respectively, calculated as the ratio of the trait value under stress to that under control conditions. Higher DDI or SDI values indicate greater stress-induced reduction in the measured trait, whereas values closer to zero indicate lower damage and higher stress tolerance [40,41].
A descriptive statistical analysis was performed using Microsoft Office 365 Excel. A one-way analysis of variance (ANOVA) was conducted. Linear regression analysis was performed to identify the optimal drought stress concentration and the key traits contributing to drought tolerance. Initial data processing was performed using Microsoft Excel for Microsoft 365 (Microsoft Corporation, Redmond, WA, USA). Correlation analyses and Q–Q plots were performed using XLSTAT 2025 software. (Data Analysis and Statistical Solution for Microsoft Excel, Addinsoft, Lumivero, Denver, CO, USA). PCA and additional statistical analyses were performed using the Statistics Kingdom platform (https://www.statskingdom.com; accessed 17 July 2026). Heatmap visualization and k-means clustering were performed in RStudio 2025.05.1 (Posit Software, PBC, Boston, MA, USA) using the heatmap package (R version 4.5.1) [42].

3. Results

3.1. Morpho-Physiological Responses of Cotton Genotypes to NaCl-Induced Salinity Stress

Descriptive statistical analysis revealed significant morpho-physiological responses of cotton genotypes under NaCl-induced salinity stress (Table 1). GR decreased gradually under increasing NaCl concentrations, from 89.29% under control conditions (60–100%) to 85.71% at 100 mM (0–100%), 80.53% at 150 mM (0–100%), and 72.86% at 200 mM (0–100%), but these changes were not significant (p > 0.05). GR was 62.32% at 250 mM (0–100%), and 44.82% at 300 mM (0–100%), with a high significance (p < 0.0001).
PH also declined progressively from 9.90 cm under control conditions (5.18–15.6 cm) to 6.76 cm at 100 mM (0–10.1 cm), 5.41 cm at 150 mM (0–8.2 cm), 4.35 cm at 200 mM (0–6.75 cm), 3.33 cm at 250 mM (0–6.32 cm), and 2.51 cm at 300 mM (0–4.8 cm). All treatments had a high level of significance (p < 0.0001).
The PFW decreased from 1.18 g under control conditions (0.31–2.63 g) to 0.85 g at 100 mM (0–1.39 g), 0.63 g at 150 mM (0–0.96 g), 0.49 g at 200 mM (0–0.84 g), 0.34 g at 250 mM (0–0.61 g), and 0.23 g at 300 mM (0–0.56 g). All salinity treatments exhibited highly significant differences compared to the control (p < 0.0001).
The RDW decreased from 0.16 g under control conditions (0.10–0.29 g) to 0.13 g at 100 mM (0–0.25 g), with moderate statistical significance (p < 0.01). RDW decrease further to 0.12 g at 150 mM (0–0.38 g), 0.09 g at 200 mM (0–0.14 g), 0.08 g at 250 mM (0–0.14 g), and 0.06 g at 300 mM (0–0.11 g). The high significance level was reached at 150–300 mM (p < 0.0001).
The CA decreased from 9.21 cm2 in the control group (2.26–14.13 cm2) to 6.27 cm2 at 100 mM (0–12.65 cm2), 4.42 cm2 at 150 mM (0–8.56 cm2), 3.35 cm2 at 200 mM (0–6.6 cm2), 2.31 cm2 at 250 mM (0–5.37 cm2), and 1.16 cm2 at 300 mM (0–4.4 cm2). All treatments under salinity stress showed highly significant differences (p < 0.0001).
The RWC decreased from 63.09% under control conditions (36.80–94.94%) to 53.77% at 100 mM (0–100.06%) and 48.10% at 150 mM (0–75.16%; p < 0.01). These NaCl treatments resulted in highly significant differences relative to control conditions (p < 0.01). The RWC then declined to 43.6% at 200 mM (0–79.36%), 34.51% at 250 mM (0–86.79%), and 23.6% at 300 mM (0–64%). All salinity treatments revealed highly significant differences relative to the control (p < 0.0001).
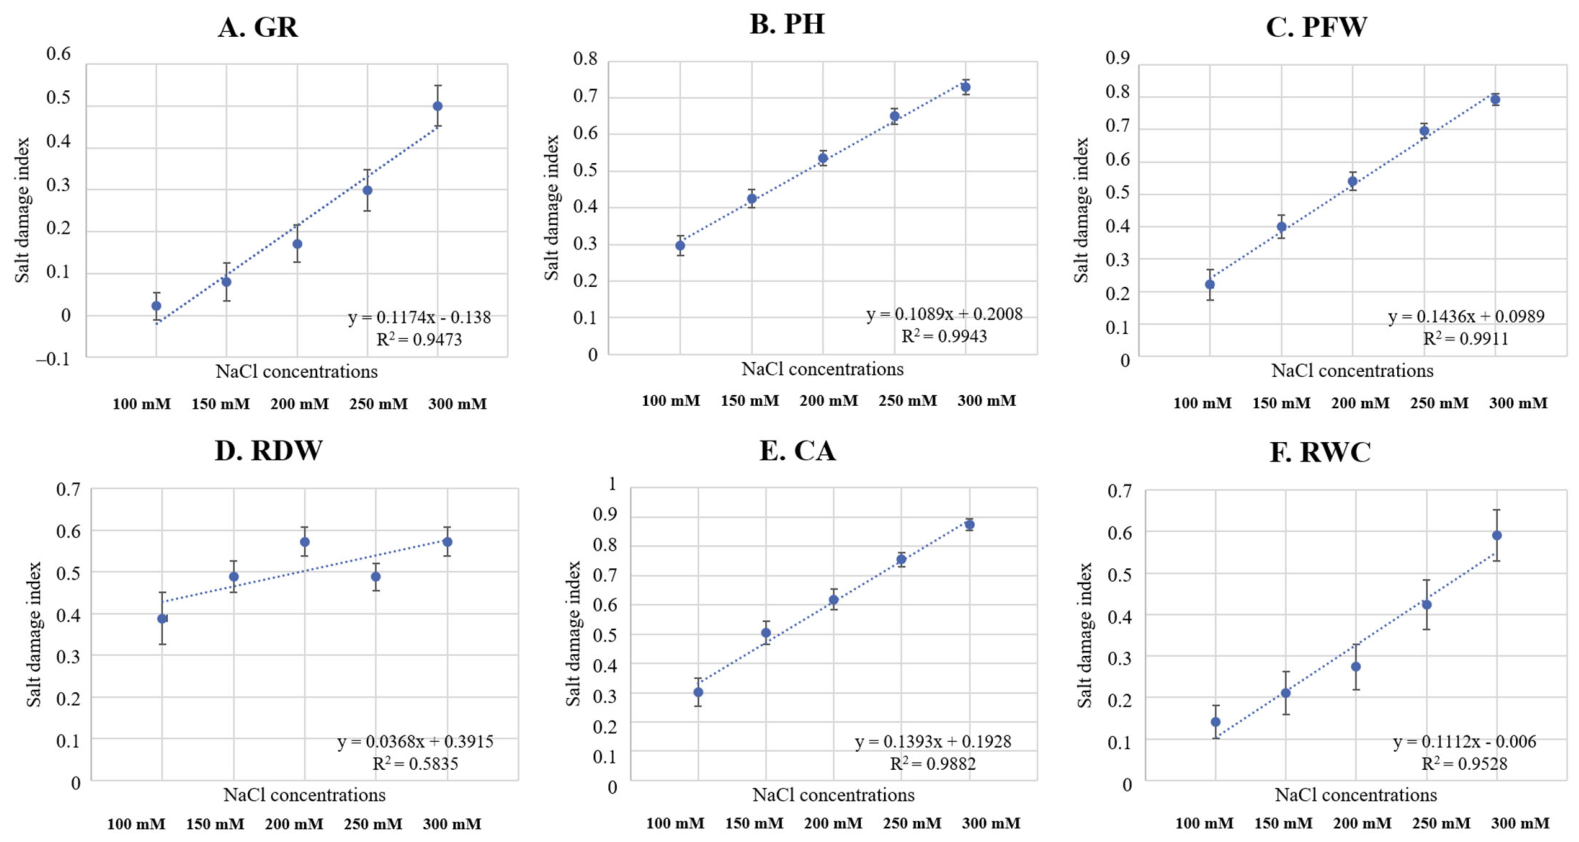
Linear regression analysis revealed strong positive linear relationships between the SDI and NaCl concentrations (100–300 mM) for all measured traits. Figure 3 illustrates that increasing salt stress consistently affects PH, with a high R2 value of 0.994. Next are CA (R2 = 0.988), PFW (R2 = 0.979), RWC (R2 = 0.9847), and GR (R2 = 0.9473). In contrast, RDW exhibited a weak relationship with salt concentration (R2 = 0.5853), suggesting that it was less sensitive to salinity within the tested range.
Correlation analysis of salt tolerance traits revealed significant variation with a p–value of less than 0.0001 (Table S1). GR remained relatively stable above 70% at 100–200 mM NaCl, but declined sharply at 250–300 mM. Therefore, 200 mM was selected as the optimal salt concentration to compare the salt tolerance among cotton genotypes.

3.2. Morphophysiological Responses of Cotton Genotypes to PEG-6000-Induced Drought Stress

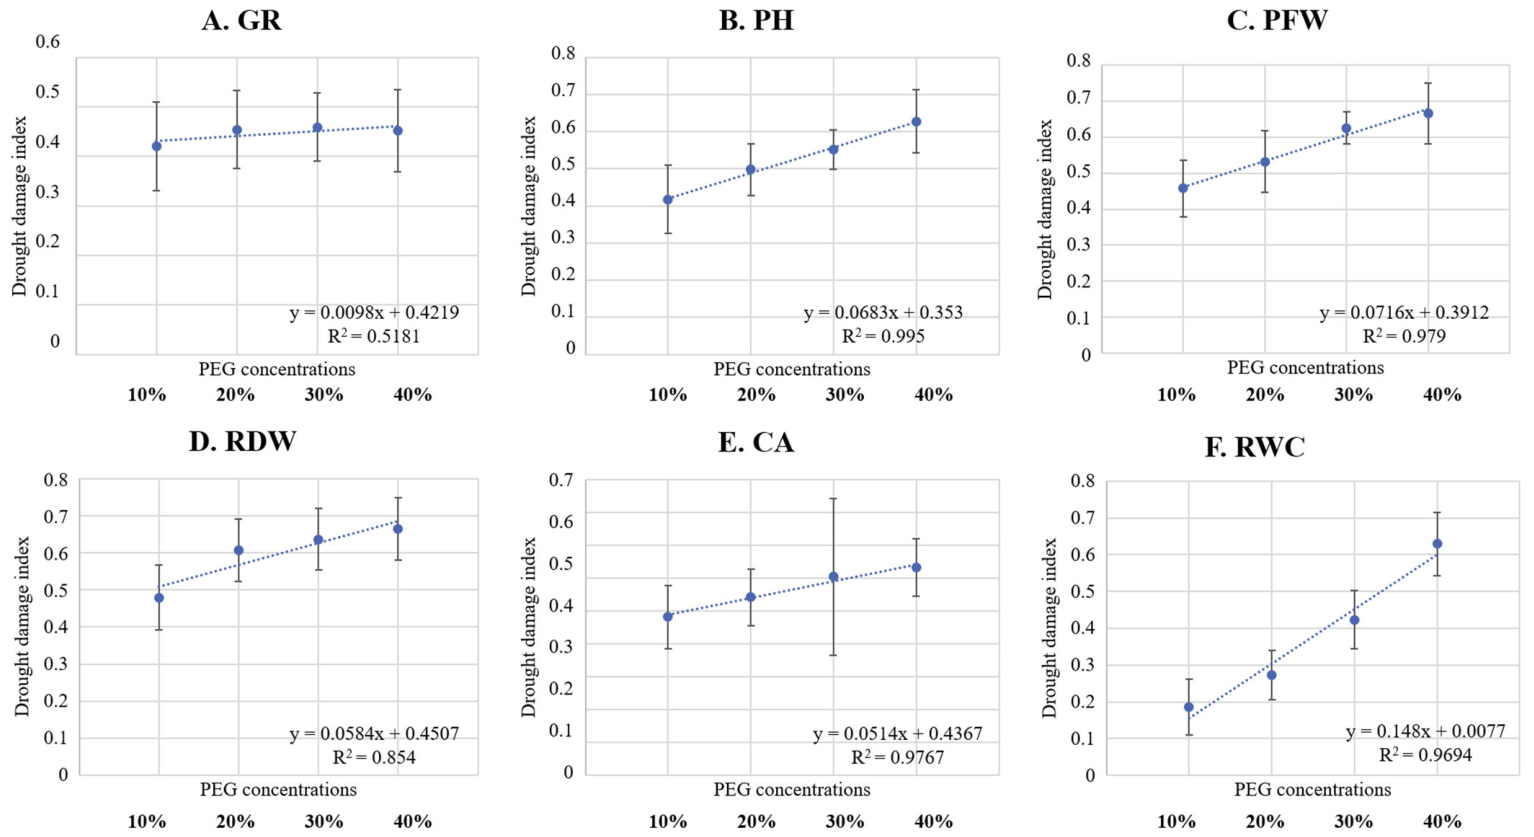
A preliminary analysis was conducted on 12 cotton genotypes to determine the optimal PEG-6000 concentration for evaluating drought stress (see Table S2 and Figure S1). The analysis of the relationship between DDI and the PEG-6000 concentration revealed strong linear dependencies for all measured traits. Figure 4 shows that increasing drought stress consistently affects PH with the highest coefficient of determination (R2) of 0.995, followed by PFW (R2 = 0.979), CA (R2 = 0.976), RDW (R2 = 0.8540), and RWC (R2 = 0.694). A moderate relationship between DDI and PEG-6000 concentration was recorded for GR (R2 = 0.518).
Then, a broader screening experiment was performed. After identifying the optimal PEG concentrations, 56 cotton genotypes were evaluated under control conditions, as well as under 20% and 30% PEG-6000 treatments, based on six drought tolerance traits (Table 2). GR was 80% (40–100%) under control conditions, 77.68% (30–100%) at 20% PEG, which was significant (p < 0.05), and 67.86% (0–100%) at 30% PEG, which was insignificant (p < 0.05). PH was 8.02 cm (4.49–11.47 cm) under control conditions, 5.41 cm (2.95–9.09 cm) at 20% PEG, and 4.58 cm (0–7.28 cm) at 30% PEG; both treatments were highly significant (p < 0.0001). The PFW was 9.28 g (3.46–17.95 g) under control, 5.13 g (1.42–13.44 g) at 20% PEG, and 4.06 g (0–8.15 g) at 30% PEG. This showed a highly significant level (p < 0.0001). RDW was 0.19 (0.02–0.53) under control, 0.19 (0.02–0.42) at 20% PEG, which was significant (p < 0.05), and 0.13 (0–0.59) at 30% PEG, which was highly significant (p < 0.0001). The CA was 10.18 cm2 (4.11–21.35 cm2) under the control condition, 5.27 cm2 (2.45–9.56 cm2) at 20% PEG, and 4.14 cm2 (0–8.60 cm2) at 30% PEG. Both drought-stressed treatments showed highly significant differences (p < 0.0001). The RWC was 76.29% (54.44–98.98%) under the control condition, 72.66% (34.79–95.37%) at 20% PEG, and 62.99% (0–99.63%). The latter was insignificant (p > 0.05); however, the RWC at 30% PEG was significant (p < 0.05).
Correlation analysis revealed significant relationships among drought tolerance traits (p < 0.05 and p < 0.01) (Table S3).

3.3. Cluster Heat Map Analysis and Cross-Classification Under Salts and Drought Stress

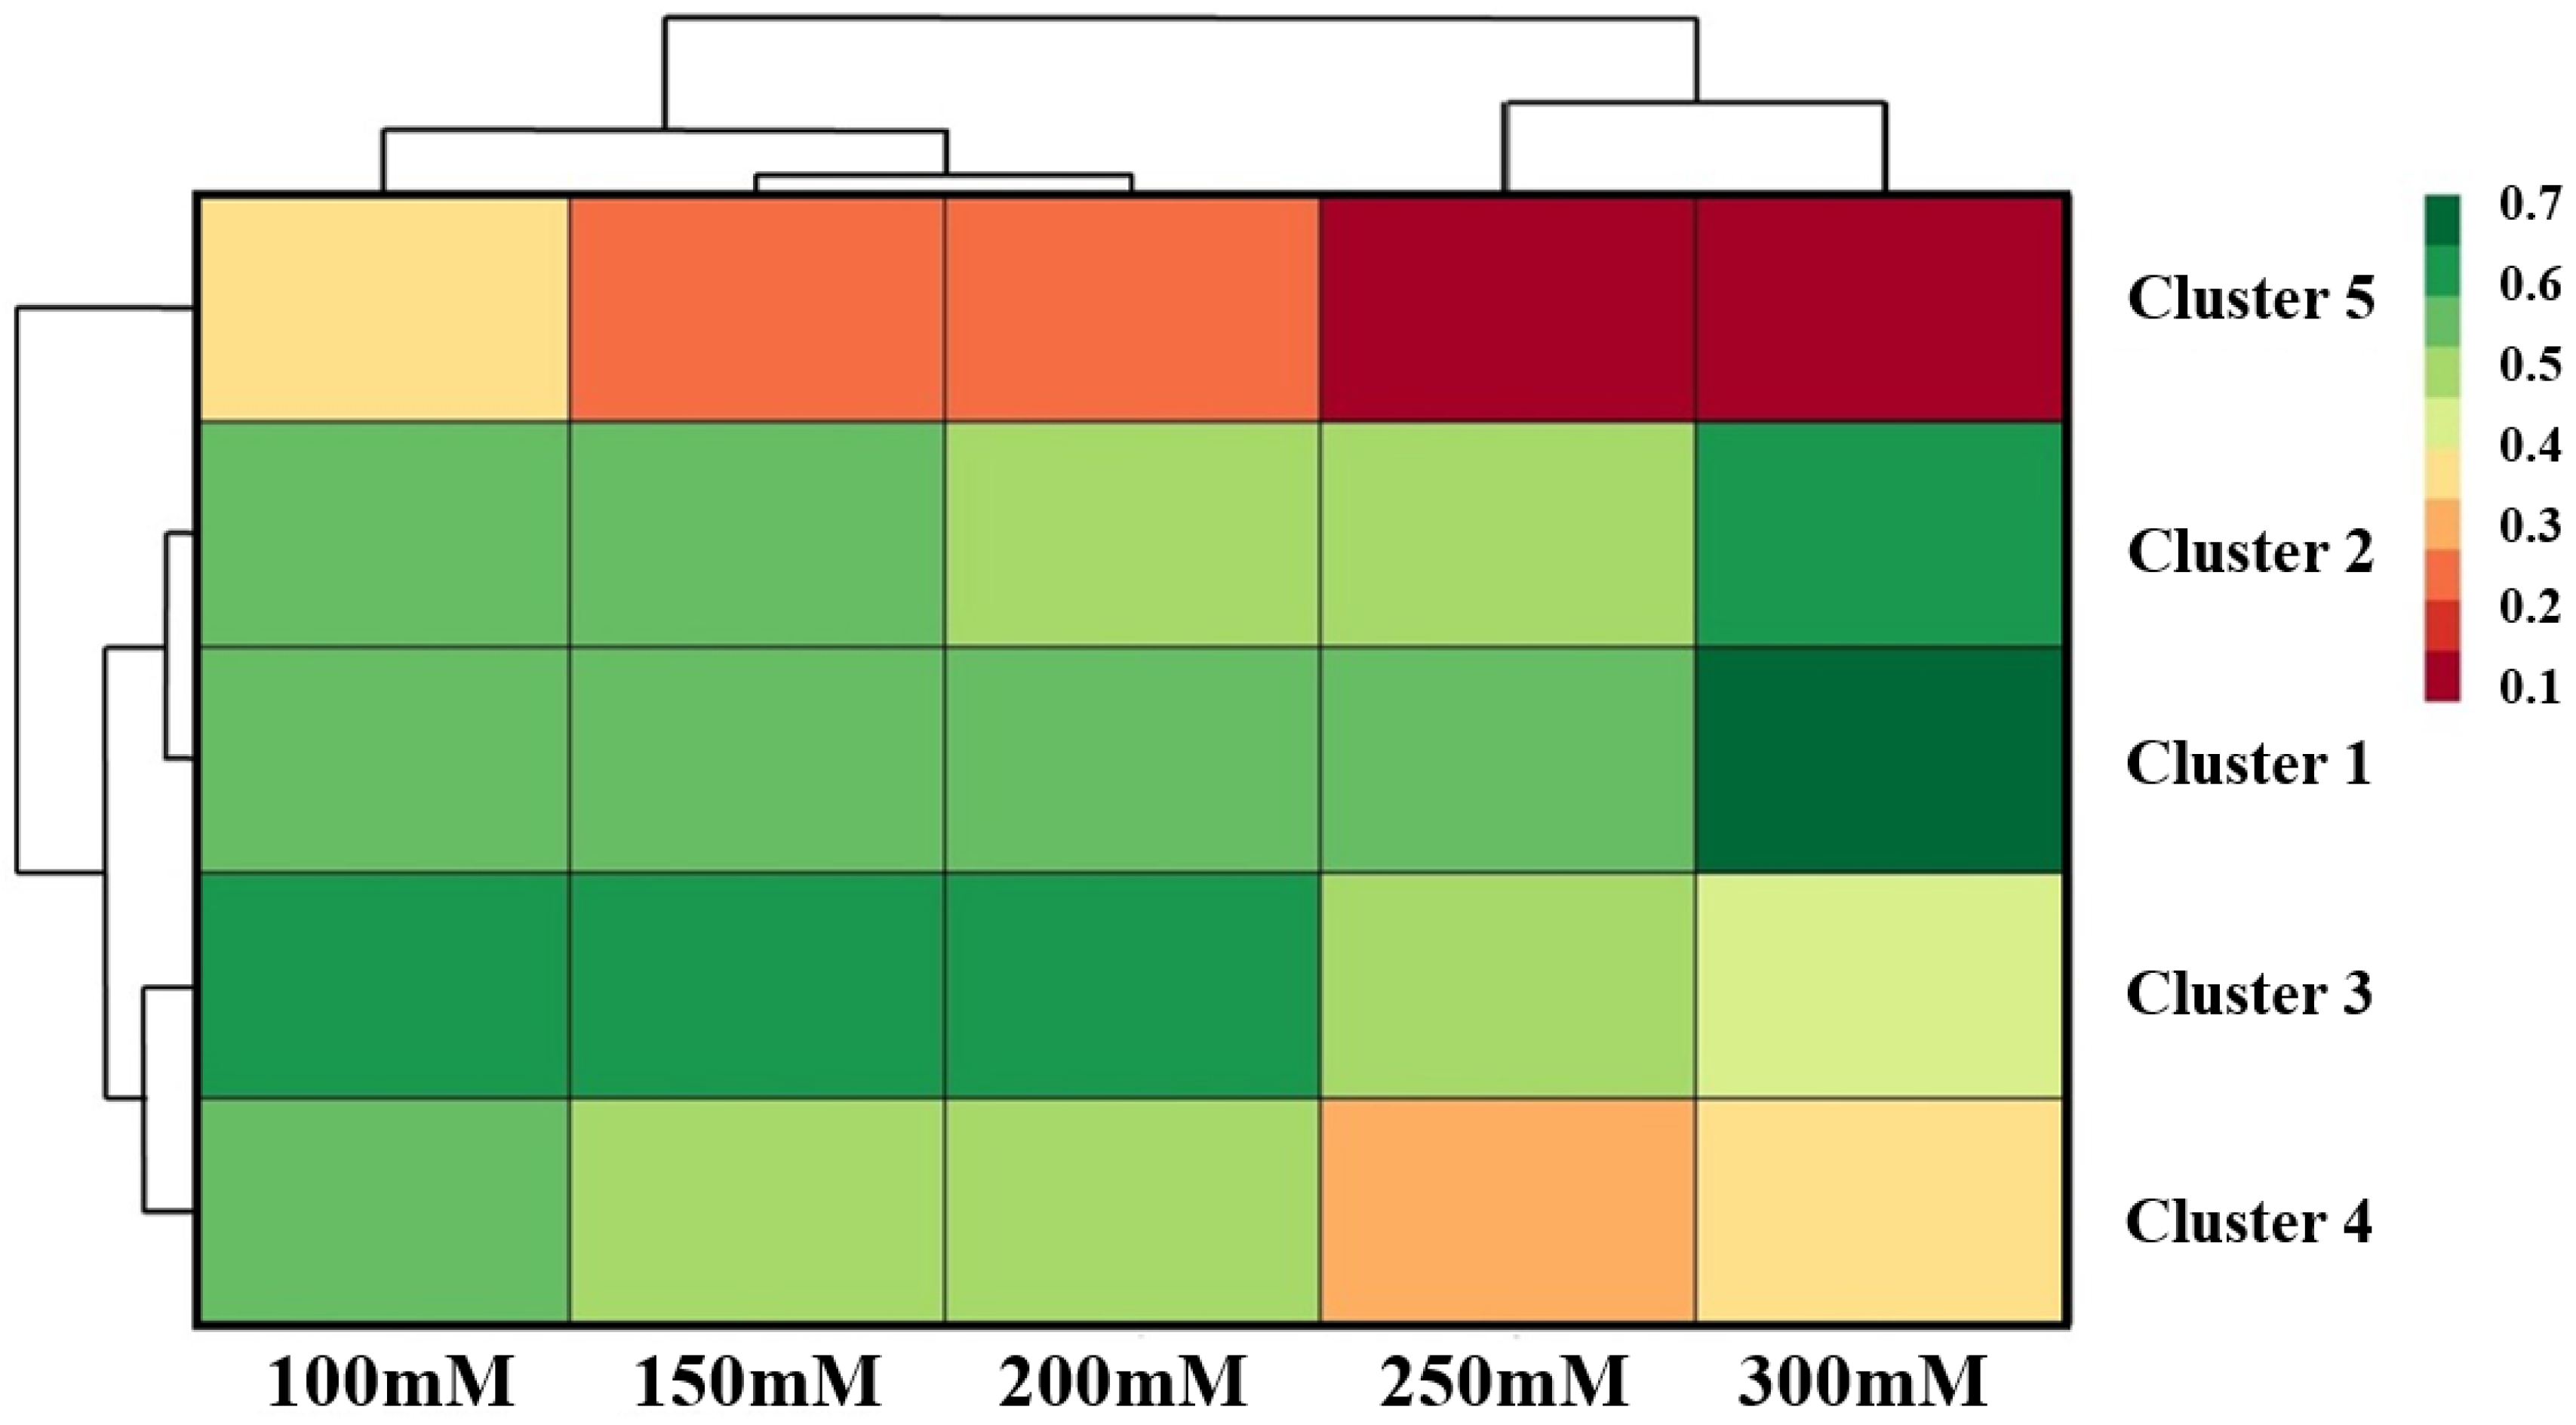
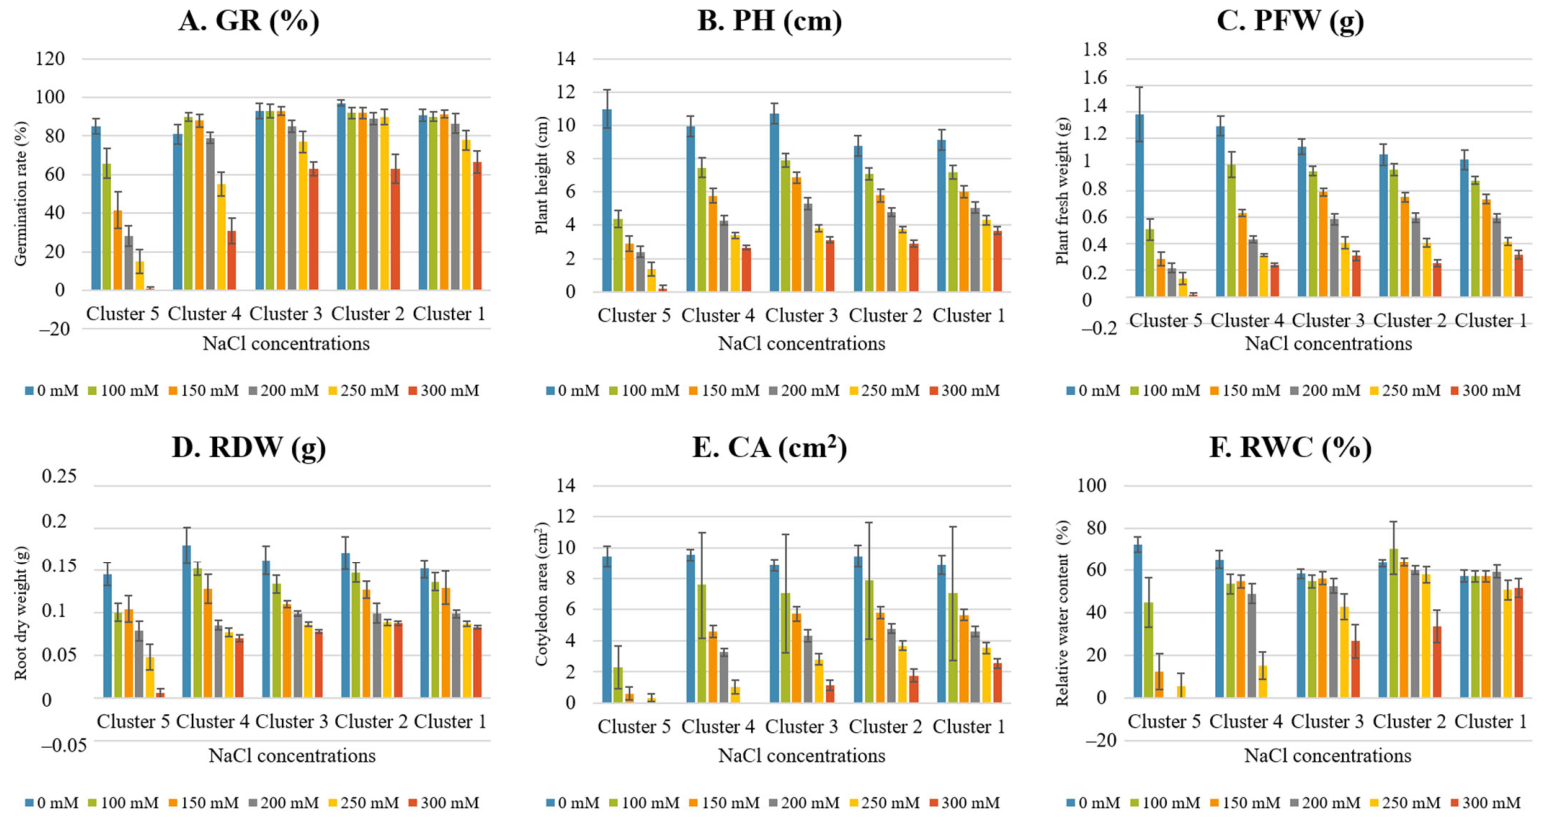
The 56 lines tested at various NaCl concentrations were classified into five groups based on their morphophysiological traits using a cluster analysis with an average membership function value (MFV, Uij). To verify the validity of SD-based classification, the normality of Uij values was assessed using Q-Q plots. Across salt conditions (100–300 mM NaCl) conditions (Figure S2), the data points generally aligned with the reference line, indicating an approximately normal distribution. After normalizing the U-value distribution, all genotypes were clustered into five tolerance classes under salt stress conditions (Figure 5 and Figure S3). Cluster one contained 14 genotypes (25%) that were highly tolerant, with Uij values ranging from 0.588 to 0.667. Cluster two contained 10 genotypes (18%) that were tolerant, with Uij values ranging from 0.557 to 0.579. Cluster three contained 10 genotypes (18%) that were moderately tolerant, with Uij values ranging from 0.488 to 0.551. An overall decline in PH, PFW, RDW, and CA was observed with increasing NaCl concentration across these three clusters. In contrast, GR and RWC performance remained relatively stable. The highly tolerant group retained a GR of 91.4% at 150 mM and 66.4% even at 300 mM (Figure 6A), and RWC remained above 50% up to 250–300 mM (Figure 6F). The moderately tolerant cluster showed an intermediate response, with gradual reductions in traits; GR ranged from 93% to 63% at 300 mM (Figure 6A). Cluster four contained 10 genotypes (18%) that were classified as susceptible, with Uij values ranging from 0.390 to 0.468.
Cluster 5 contained 12 genotypes (21%) classified as highly susceptible, with Uij values ranging from 0.073 to 0.284 (see Figure 5 and Figure S3). The highly susceptible and susceptible clusters exhibited the most pronounced decreases. For instance, in the highly susceptible group GR decreased from 85% at 0 mM to 41.7% at 150 mM and nearly to zero (0.8%) at 300 mM in the highly susceptible group (Figure 6A). Similarly, both clusters exhibited a reduction in CA and RWC to zero at the highest salinity level (Figure 6E).
The 56 lines tested at various PEG-6000 concentrations were classified into five groups based on their Uij values. To verify the validity of the SD-based classification, we assessed the normality of the Uij values using Q-Q plots. Under drought conditions (20–30% PEG-6000) (Figure S4), the data points generally aligned with the reference line, indicating a nearly normal distribution.
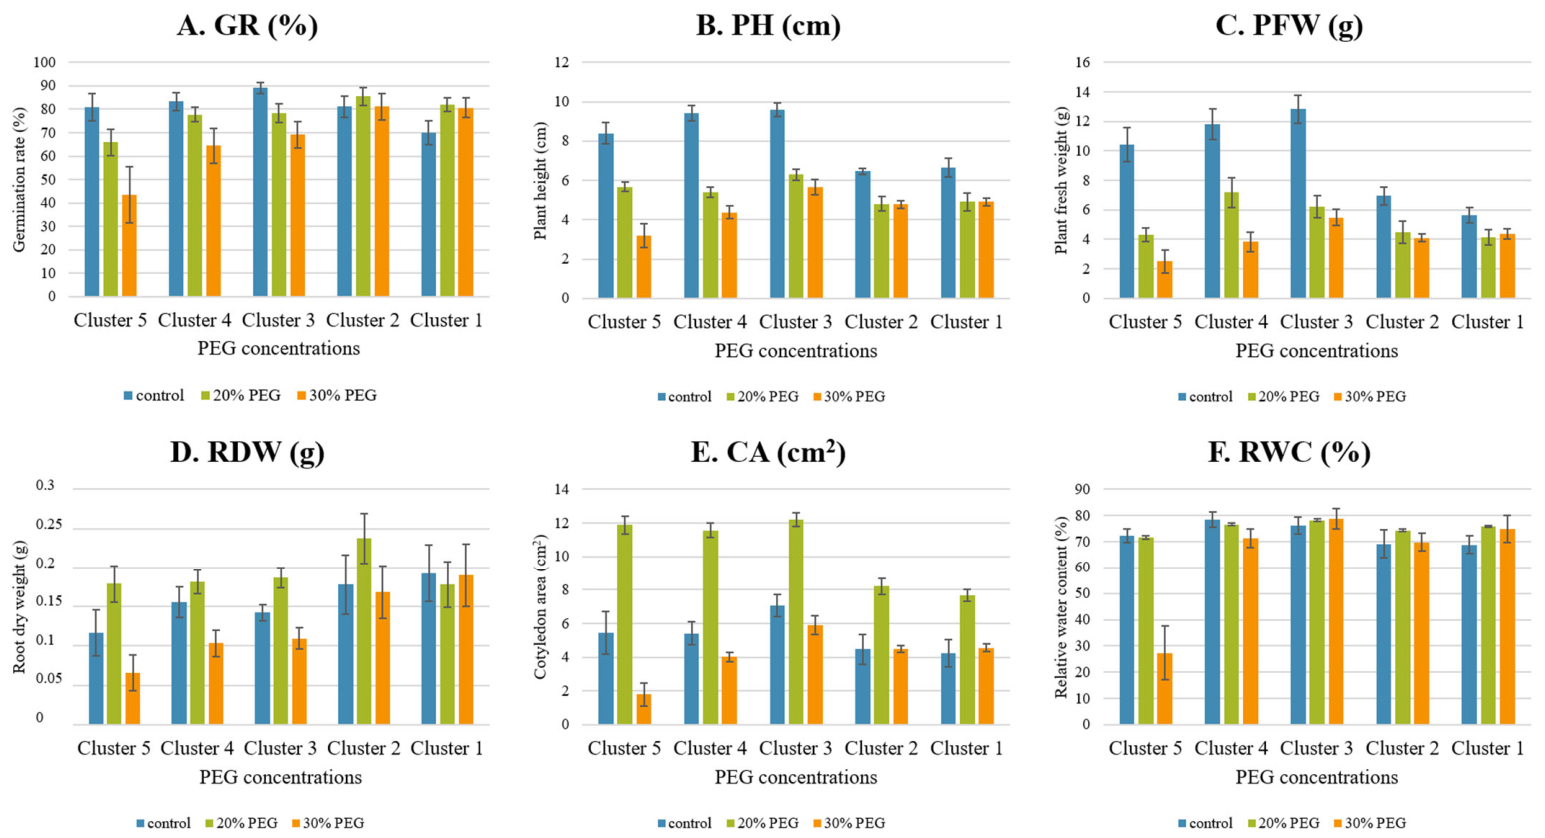
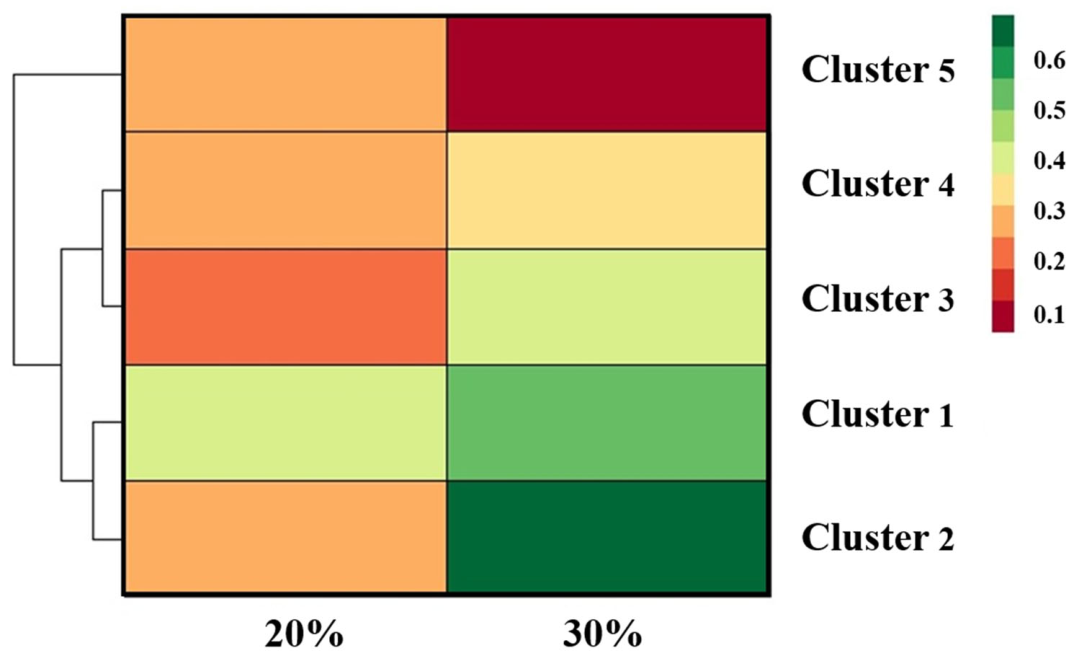
Cluster one contained 15 genotypes (27%) that were highly tolerant, with Uij values ranging from 0.448 to 0.605. Cluster two contained nine genotypes (16%) that were tolerant, with Uij values ranging from 0.391 to 0.446 (Figure 7 and Figure S3). These two clusters exhibited the greatest stability across treatments. In the highly drought-tolerant group, GR remained nearly unchanged, ranging from 70% to 80.7% (Figure 8A). RWC was also maintained at relatively high levels, ranging from 75.9% to 74.9%, even under 30% PEG (Figure 8F). Cluster three contained 11 genotypes (20%) that were classified as moderately tolerant, with Uij values ranging from 0.331 to 0.361. The moderately drought-tolerant group demonstrated a more gradual decline. For example, PFW decreased from 12.84 g to 5.48 g (Figure 8C), and CA decreased from 12.20 cm2 to 5.92 cm2 (Figure 8E), while RWC remained stable, ranging from 78.3% to 78.7% (Figure 8F). Cluster four contained nine genotypes (16%) that were susceptible, with Uij values ranging from 0.288 to 0.316.
Cluster five contained 12 genotypes (21%) that were classified as highly susceptible, with Uij values ranging from 0.098 to 0.281 (see Figure 7 and Figure S2). The highly drought-susceptible group showed the most significant reductions. GR decreased from 80.8% at the control level to 43.3% at 30% PEG (Figure 8A), while PFW decreased sharply from 10.44 to 2.50 g (Figure 8C). CA dropped from 11.90 to 1.80 cm2 (Figure 8E), and RWC decreased drastically from 71.7% to 27.3% (Figure 8F). The drought-susceptible cluster also exhibited substantial reductions, though less extreme. PFW decreased from 11.81 g to 3.85 g (Figure 8C), and CA decreased from 11.56 cm2 to 4.01 cm2 (Figure 8E). However, RWC remained relatively high, at 76.6% under the control conditions and 71.3% under 30% PEG (Figure 8F).
Table 3 presents a cross-classification analysis of 56 cotton lines based on their tolerance to salt and drought stress. Three lines, including M-4016-6, M-4031-8, and M-4014-6, were identified as highly tolerant of both salt and drought stress. Three other lines, including M-4029-9, M-4016-7, and M-4016-8, were highly tolerant of salt stress and drought stress. Two lines, including M-4051 and M-4033-5, were identified as highly tolerant under salt stress and moderately tolerant under drought stress. M-4020-2 was tolerant to salt stress and highly tolerant to drought stress. M-4016-4 was tolerant of both salt and drought stress. Three lines, including M-4031-6, M-4022-8, and M-4022-9, were tolerant to salt stress and moderately tolerant of drought stress. M-4031-5 was moderately tolerant to salt stress and highly tolerant in drought stress. The M-4022-7 and M-4029-3 lines showed moderate tolerance to both stresses. Fifteen lines exhibited highly tolerant, tolerant, or moderately tolerant characteristics under salt stress, but were susceptible or highly susceptible under drought stress. Sixteen lines exhibited highly tolerant, tolerant, or moderately tolerant characteristics under drought stress but were susceptible or highly susceptible under salt stress (see Table 3).

3.4. Relationship Analysis of Salt and Drought Stress in Genotypes Using Principal Component Analysis

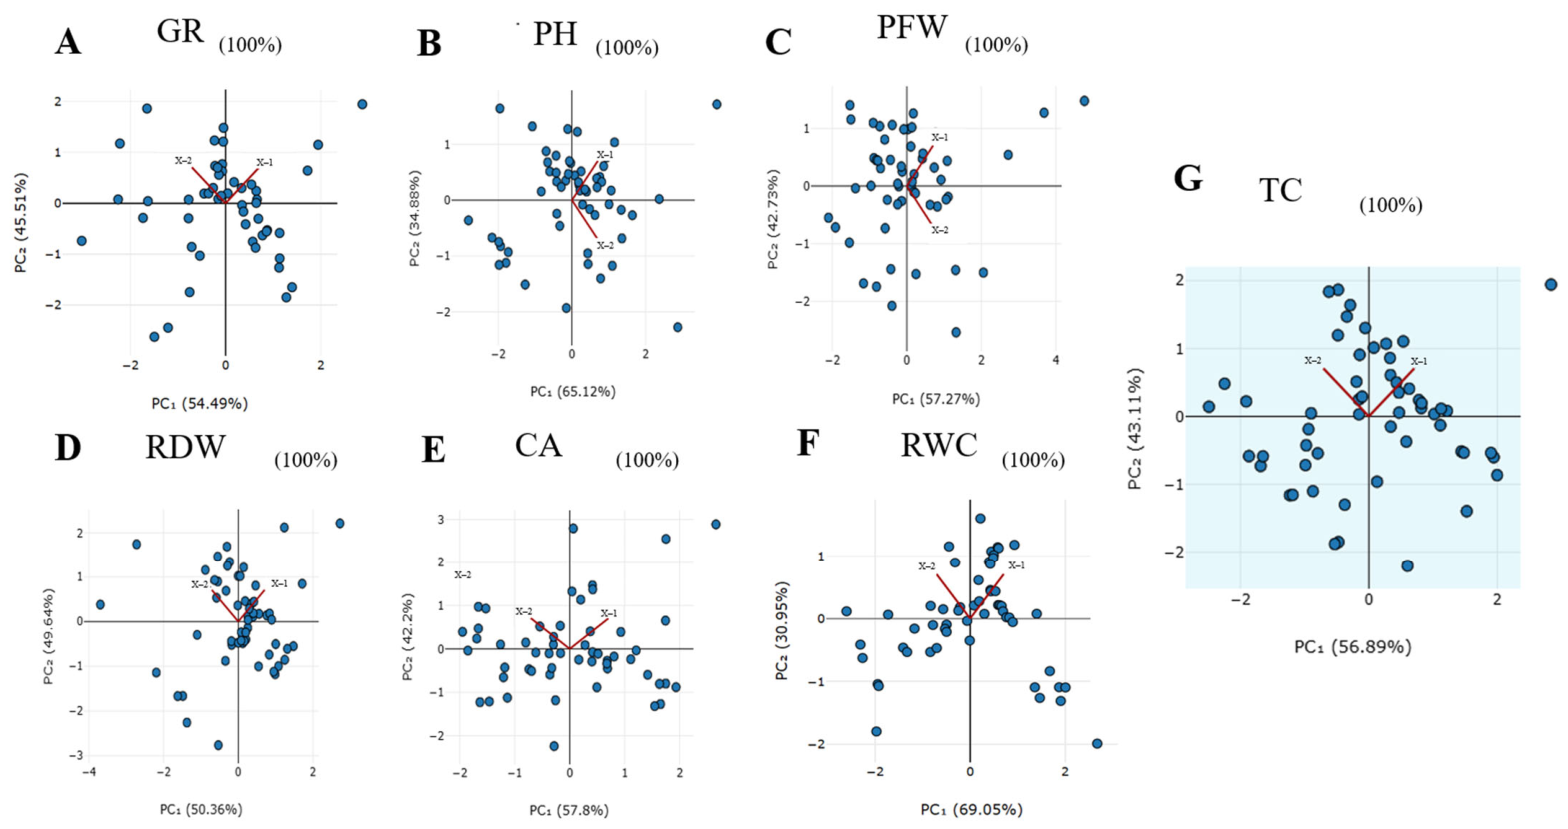
Principal component analysis (PCA) was performed using the tolerance coefficient (TC) values for each morphophysiological trait under salt (X1) and drought (X2) stress conditions to visualize the correlation structure between genotype responses (see Figure 9). In PCA biplots, the angle between the X1 and X2 vectors reflects the degree of correlation between tolerance to salinity and drought. Acute angles indicate a positive correlation, right angles indicate little to no correlation, and obtuse angles indicate a negative correlation. The first two principal components (PC1 and PC2) explained 100% of the total variation for each trait, with PC1 accounting for 50.36–69.05% and PC2 accounting for 30.95–49.64% of the total variance.
For GR (Figure 9A), PH (Figure 9B), PFW (Figure 9C), CA (Figure 9E), and RWC (Figure 9F), the X1 and X2 vectors formed acute angles, indicating a positive correlation between genotype responses to salt and drought stress. The strongest positive association was observed for PH, PFW, and RWC, where the vectors were closely aligned. This suggests that genotypes exhibiting higher tolerance under salinity tend to perform similarly under drought for these traits. GR and CA also showed positive relationships, though the wider angle between the vectors indicates a weaker association.
In contrast, the PCA of RDW (Figure 9D) showed the X1 and X2 vectors oriented in opposite directions, and forming an obtuse angle. This indicates a negative correlation between genotype responses to salt and drought stress.
The PCA based on the overall salt tolerance coefficient (STC) and the drought tolerance coefficient (DTC) (Figure 9G) revealed a similar obtuse angle, indicating a weak or negative association between overall salt and drought tolerance across genotypes.
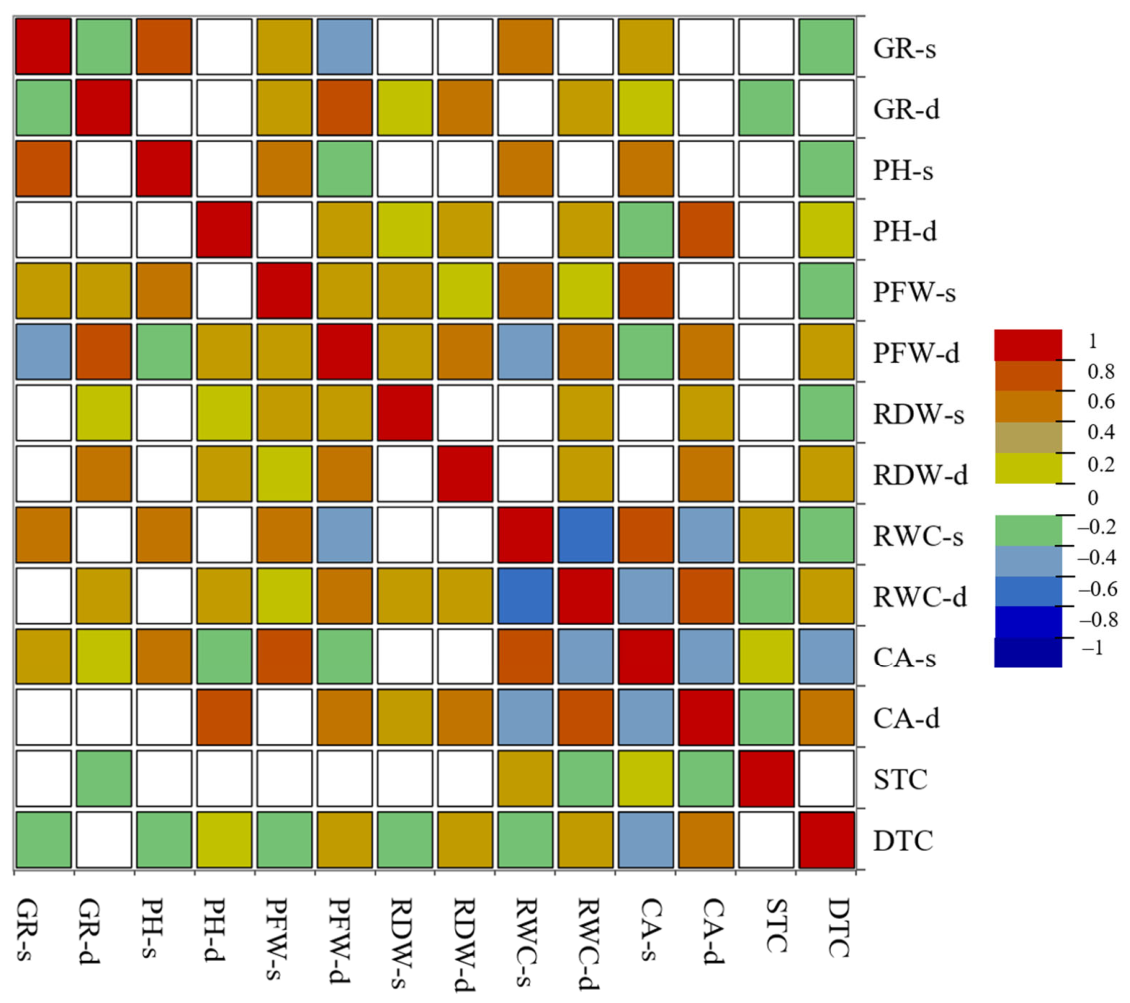
To verify the relationships suggested by the PCA biplots, a Pearson correlation analysis was performed between STC, DTC, and the morphophysiological traits (see Table S4 and Figure 10). The analysis confirmed the PCA results, showing that STC and DTC were only weakly and nonsignificantly correlated (r = 0.079). This indicates an absence of a strong linear relationship between salt and drought tolerance. Furthermore, STC was not significantly correlated with any measured trait. In contrast, DTC showed moderate positive correlations with drought-related traits, including PFW-d (r = 0.318, p < 0.05), RDW-d (r = 0.312, p < 0.05), RWC-d (r = 0.270, p < 0.05), and CA-d (r = 0.422, p < 0.001).

4. Discussion

4.1. Morpho-Physiological Responses of Cotton Genotypes to Salt and Drought Stress

Salinity levels are commonly expressed as the electrical conductivity (ECe) of saturated soil extracts. Levels of approximately 7.7 dS m−1 create comparable stress conditions for cotton cultivation in major cotton-producing regions [43]. The average annual rainfall in major cotton-growing regions ranges from 460–475 mm in the United States. In Xinjiang, China, annual precipitation is below 270 mm. In Pakistan, annual precipitation ranges from 300–600 mm. Soil salinity in these countries commonly ranges from moderate to high levels (2–20 dS m−1) [44,45]. NaCl concentrations of 150–200 mM are widely used as effective thresholds for discriminating salt tolerance in cotton genotypes at the seedling stage [46,47,48,49], and laboratory screening for drought tolerance commonly uses 15–27% PEG-6000 [50]. In Central Asia, studies on drought have mainly focused on field performance under irrigation deficits, while laboratory screening using controlled osmotic stress remains limited. Although PEG-6000 is a well-established method for laboratory evaluation of drought tolerance, it primarily induces osmotic stress and therefore cannot fully replicate the complex environmental conditions associated with drought in the field [51]. Soil physical properties, nutrient dynamics, and root–soil interactions are not reproduced under PEG treatment [52]. Nevertheless, the high reproducibility and precise control of osmotic potential of PEG-6000 make it suitable for standardized screening of large numbers of genotypes.
In the major cotton-growing areas of the Turkistan region of Kazakhstan, annual precipitation ranges from approximately 150 to 250 mm [53], while summer temperatures and evapotranspiration frequently lead to seasonal water deficits. Soil salinity is particularly widespread in irrigated cotton fields in the Maktaaral region. ECe values in these fields typically range from 4 to 8 dS m−1, but can reach 10 to 15 dS m−1 in areas with more severe salinity [54]. In our study, linear regression analysis identified that 200 mM and 20–30% PEG concentrations are suitability for screening a large number of genotypes and demonstrate substantial genetic variability within the Kazakhstan collection. The comparatively strong performance of Kazakhstani genotypes likely reflects long-term adaptation to saline environments, potentially involving improved ion homeostasis and osmotic regulation.
In our study, cotton germination declined sharply at 250–300 mM of NaCl. This is consistent with the reported salinity threshold of 150–200 mM of NaCl for cotton germination [55,56]. Under PEG-induced drought stress, GR showed moderate sensitivity, particularly at lower concentrations, indicating partial osmotic adjustment during the early stages of imbibition. Previous studies have reported similar trends, showing that germination remains relatively stable under moderate osmotic restriction while vegetative growth is more strongly affected [57]. Similar response patterns were observed for traits such as GR, PH, PFW, and CA under both NaCl- and PEG-induced osmotic stress, suggesting that these traits primary screening traits. Root systems respond differently from shoots. Under moderate salinity or drought stress, root growth is generally maintained more effectively than shoot growth because roots accumulate lower concentrations of Na+ and are therefore less inhibited than shoots [58].
RDW and RWC differentiation was observed according to stress type. RDW showed a weaker association with the NaCl gradient (R2 = 0.5853), indicating that root biomass was less tightly linked to increasing salinity. However, ANOVA detected significant effects at 100 mM NaCl (p < 0.01) and highly significant effects at higher concentrations, confirming that RDW still responds to salt stress despite the moderate linear relationship. Arif et al. (2019) similarly reported that moderate stress induces structural adjustments in roots that partially maintain biomass allocation [59]. Shelden et al. (2023) reported that high NaCl concentrations (≥250 mM) markedly reduce root biomass in cotton, indicating biphasic root responses to ionic stress [60]. Under PEG-induced drought stress, the RDW responses depended on stress severity: the effects were weak at 20% PEG and became highly significant at 30%. This suggests that severe osmotic stress restricts root biomass accumulation. RWC responded significantly to salt stress at NaCl concentrations of 100 mM and higher, indicating the strong impact of salinity on plant water status. Under PEG treatment, RWC was not significant at 20%, but it became significant at 30%. These results suggest that RWC is less sensitive to moderate osmotic stress and is therefore limited in its usefulness as an early indicator of drought tolerance. Although the selected stress levels do not precisely replicate field conditions, they were chosen as standardized laboratory screening treatments for two reasons. First, the osmotic potential of the 20% PEG-6000 solution was calculated to be approximately −0.49 MPa, while that of the 30% PEG-6000 solution was calculated to be approximately −1.03 MPa, according to the Michel and Kaufmann equation (1973) [61]. These values correspond to moderate and severe water deficit conditions, while remaining below the threshold −1.5 MPa at which cotton growth is started actively inhibited [62]. Likewise, although 200 mM NaCl corresponds to an electrical conductivity of approximately 18–20 dS m−1 [63], which is higher than the average salinity of most cotton fields in Kazakhstan (4–15 dS m−1). However, this concentration is widely used for laboratory screening because it provides stable, reproducible salt stress and enables effective discrimination among cotton genotypes. Second, our preliminary dose–response analysis showed that these treatments provided clear phenotypic differentiation among genotypes while avoiding complete inhibition of plant growth. This makes them suitable for large-scale screening of salinity and drought tolerance.
Overall, 200 mM NaCl and 20% and 30% PEG-6000 were identified as the optimal concentrations for screening salinity and drought tolerance, respectively. All traits in this study, as they provided clear phenotypic differentiation among cotton genotypes. The substantial genotypic variability observed highlights the breeding value of the Kazakhstan cotton collection for developing cultivars adapted to salinity- and drought-prone agroecosystems.
Recent advances in cotton breeding underscore the importance of combining physiological screening with molecular breeding methods, such as marker-assisted selection and the identifying of stress-responsive genes, to expedite the development of stress-resilient cultivars [64]. Thus, the screening strategy established in this study is a valuable foundation for future breeding programs targeting salinity and drought tolerance.

4.2. Cluster Heat Map Analysis and Cross-Classification Under Salt Stress and Drought Stress

Cluster heat map analysis showed that, under salt and drought stress, 14 genotypes exhibited salt-specific tolerance and 15 demonstrated drought-specific tolerance. Despite stress-specific tolerance, only a few genotypes exhibited stable performance across both stresses. Three lines, M-4016-6, M-4031-8, and M-4014-6, were classified as highly tolerant under both salinity and drought conditions. M-4029-9, M-4016-7, M-4016-8, and M-4020-2 demonstrated asymmetric characteristics, being classified as highly tolerant to salt stress and tolerant to drought stress, respectively. Line M-4016-4 showed tolerance to both stresses. Therefore, these eight lines are recommended as cotton genotypes with combined tolerance to salinity and drought stresses.

4.3. Relationship Analysis the Effects of the Salt and Drought Stress on Genotypes Using Principal Component Analysis

Despite the frequent assumption that drought and salinity tolerance are positively correlated due to their shared osmotic component [65], our results demonstrate a weak correspondence between tolerance rankings under these two stresses. Only a few genotypes maintained similar tolerance under both conditions, while the majority exhibited clear stress-specific responses. The PCA results not only describe variation among genotypes and provide insight into stress adaptation. The obtuse angle between the STC and DTC vectors suggests a negative association. However, rather than indicating strict antagonism, this pattern reflects a tendency toward stress-specific adaptation. This is consistent with the weak correspondence in genotype rankings under salt and drought conditions.
The opposite positioning of RDW vectors in the PCA supports the idea that root allocation strategies are central to the differentiation between salt and drought adaptation [66]. Root dry weight exhibited contrasting associations with salt and drought stress, suggesting different physiological regulation and resource allocation under these conditions. PCA based on tolerance coefficients (STC and DTC) revealed a clear separation along the principal axis, with salt tolerance loading opposite to drought tolerance. This pattern indicates that most genotypes tend to specialize in tolerance to one stress rather than exhibiting broad-spectrum resistance. This reflects adaptive trade-offs among stress-response mechanisms. From a physiological perspective, this trade-off from our results can be explained by fundamentally different adaptive strategies. Under salinity, plants maintain ion homeostasis by actively excluding Na+ and Cl or sequestering them in vacuoles [67]. Key adaptations include enhanced root apoplastic barriers and Na+/H+ antiporters SOS1 at the plasma membrane, which prevent Na+ entry into shoots. Additionally, tonoplast NHX antiporters to compartmentalize Na+ in vacuoles [68]. This transport is ATP-dependent, so salt stress strongly increases the plant’s energy demand, as evidenced by elevated ATPase activity, protein turnover, and photorespiration [69]. Salt-adapted wild tomato accessions, for example, use Na+ and Cl as inexpensive osmolytes, whereas cultivated varieties rely on organic solutes, incurring much higher carbon and energy costs [70]. Under drought stress, drought-tolerant genotypes typically develop deeper or more extensive root systems to enhance water uptake [71]. An efficient salt-osmolyte strategy conflicts with a drought-osmolyte strategy, reflecting a biochemical trade-off.
At the molecular level, the observed physiological trade-offs are supported by differential regulation of stress-responsive signaling pathways. Although salinity and drought share common osmotic signaling components, they activate distinct downstream molecular networks that control ion homeostasis, osmotic adjustment, reactive oxygen species detoxification, and hormonal signaling. Consequently, activation of pathways that promote tolerance to one stress can diminish the effectiveness of responses to the other stress [72]. One clear example is the cotton transcription factor GhWRKY25. In transgenic studies, overexpressing GhWRKY25 increased salt tolerance but decreased drought tolerance [73], demonstrating that GhWRKY25 activates salt-adaptive genes while inhibiting drought-adaptive processes and revealing a genetic trade-off. More generally, many stress-responsive TFs, such as WRKY, DREB, and NAC families, are tuned to one type of stress and can negatively interact with others [74]. This antagonistic regulation means that enhancing one stress pathway often comes at the expense of another [75].
These trade-offs suggest that achieving high tolerance to both salinity and drought is challenging. Therefore, breeding programs often focus on stress-specific traits, ion homeostasis for salinity, and root architecture for water-use efficiency for drought. Alternatively, combining complementary traits may provide balanced resilience. Nevertheless, developing environment-specific cultivars remains more effective than pursuing universal tolerance.

5. Conclusions

This study revealed significant variation in salinity and drought tolerance among the cotton genotypes in the Kazakhstan collection. Increasing concentrations of NaCl and PEG significantly impacted vegetative growth traits, though germination remained relatively stable under moderate stress conditions. Regression analysis revealed that 200 mM NaCl and 20–30% PEG are the optimal concentrations for screening cotton genotypes for salinity and drought tolerance, respectively. Cluster analysis and membership function evaluation classified the genotypes into five tolerance groups and identified eight promising lines that are tolerant of both stresses. Furthermore, principal component analysis revealed no association between salt and drought tolerance, suggesting that most genotypes exhibit stress-specific adaptation rather than broad-spectrum resistance. Overall, these results highlight the significant genetic diversity in the Kazakhstani cotton germplasm and provide valuable material for breeding programs aiming to develop cotton cultivars adapted to environments prone to salinity and drought. However, the identified tolerant genotypes should undergo further validated under field conditions to confirm the stability of their performance across different environments before their practical deployment in breeding programs. Future breeding efforts should integrate physiological screening with molecular breeding approaches, including identifying stress-responsive genes and using marker-assisted or genomic selection to accelerate developing climate-resilient cotton cultivars.

Supplementary Materials

The following supporting information can be downloaded at: https://www.mdpi.com/article/10.3390/ijpb17080065/s1, Figure S1: Heatmap of phenotypic trait variation in cotton genotypes under different PEG-6000 concentrations; Figure S2: Q–Q plots showing the distribution of Uij across cotton genotypes under different salt concentrations (100, 150, 200, 250, and 300 mM NaCl) and the overall average. Each blue dot represents an individual genotype. The dashed diagonal line indicates the expected quantiles under a normal distribution, allowing visual assessment of the normality of the Uij values; Figure S3: Distribution of cotton genotypes according to tolerance classes under salt and drought stress. (A) number of lines for each group of tolerance. (B) percentage of lines of each salt tolerance group. (C) percentage of lines of each drought tolerance group; Figure S4: Q–Q plots showing the distribution of Uij across cotton genotypes under different PEG-6000 concentrations (0% (control), 10%, 20%, 30%, and 40%). Each blue dot represents an individual genotype. The dashed diagonal line indicates the expected quantiles under a normal distribution, allowing visual assessment of the normality of the Uij values; Table S1: Correlation analysis among salt tolerance traits; Table S2: Descriptive statistics of morpho-physiological traits in cotton lines under control and PEG-6000 concentrations (10%, 20%, 30%, 40%); Table S3: Correlation analysis among drought tolerance traits; Table S4: Pearson correlation coefficients among morpho-physiological traits, STC, and DTC under salt and drought stress conditions.

Author Contributions

Conceptualization, D.T. and S.M. (Shuga Manabayeva); resources, D.T., S.M. (Shuga Manabayeva), L.T. and S.M. (Sabir Makhmadjanov); methodology, D.T., A.O., M.R. and S.M. (Shuga Manabayeva); data curation, A.O., N.Z., N.A., M.R. and S.M. (Sabir Makhmadjanov); formal analysis, A.O., N.Z., N.A. and M.R., software A.O., N.Z., N.A. and M.R.; visualization, A.O. and N.Z.; writing—original draft preparation, A.O.; writing—review and editing D.T. and S.M. (Shuga Manabayeva); supervision, D.T. and S.M. (Shuga Manabayeva); project administration, D.T. and S.M. (Shuga Manabayeva); funding acquisition D.T. All authors have read and agreed to the published version of the manuscript.

Funding

This research was funded by the Science Committee of the Ministry of Science and Higher Education of the Republic of Kazakhstan, under the project (AP23489921).

Data Availability Statement

The data are included in the article and the Supplementary Materials.

Acknowledgments

We are grateful to the Science Committee of the Ministry of Science and Higher Education of the Republic of Kazakhstan for their financial support. We would also like to thank the research team at the LLP ‘Cotton and Melon Agricultural Experimental Station’, for providing research materials.

Conflicts of Interest

The authors declare no conflicts of interest and the research was conducted in the absence of any commercial or financial relationships that could be construed as a potential conflict of interest.

Abbreviations

The following abbreviations are used in this manuscript:
PEG-6000Polyethylene glycol
NaClSodium chloride
GRGermination rate
PHPlant height
PFWPlant fresh weight
RDWRoot dry weight
CACotyledon area
RWCWater content
FWFresh weight
TWTurgid weight
DWDry weight
SDISalt damage index
STCSalt tolerance coefficient
DTCDrought tolerance coefficient
UIJThe average membership function value
PCAPrincipal component analysis
MFVDMembership function value of drought tolerance
SSSalt-stressed

References

  1. Cao, N.; Hou, J.; Hu, W.; Li, H.; Lin, J.; Chen, G.; Wan, S.; Hu, S. Optimum plant density improved cotton (Gossypium hirsutum L.) root production capacity and photosynthesis for high cotton yield under plastic film mulching. Agronomy 2024, 14, 1040. [Google Scholar] [CrossRef] [Scilit]
  2. Khan, M.A.; Wahid, A.; Ahmad, M.; Tahir, M.T.; Ahmed, M.; Ahmad, S.; Hasanuzzaman, M. World cotton production and consumption: An overview. In Cotton Production and Uses: Agronomy, Crop Protection, and Postharvest Technologies; Springer: Singapore, 2020; pp. 1–7. [Google Scholar]
  3. Ma, Z.; Zhang, Y.; Wu, L.; Zhang, G.; Sun, Z.; Li, Z.; Jiang, Y.; Ke, H.; Chen, B.; Liu, Z. High-quality genome assembly and resequencing of modern cotton cultivars provide resources for crop improvement. Nat. Genet. 2021, 53, 1385–1391. [Google Scholar] [CrossRef] [Scilit] [PubMed]
  4. Iqbal, M.; Khan, M.A.; Chattha, W.S.; Abdullah, K.; Majeed, A. Comparative evaluation of Gossypium arboreum L. and Gossypium hirsutum L. genotypes for drought tolerance. Plant Genet. Resour. 2019, 17, 506–513. [Google Scholar] [CrossRef] [Scilit]
  5. Feng, L.; Chen, Y.; Ma, T.; Zhou, C.; Sang, S.; Li, J.; Ji, S. Integrative physiology and transcriptome sequencing reveal differences between G. hirsutum and G. barbadense in response to salt stress and the identification of key salt tolerance genes. BMC Plant Biol. 2024, 24, 787. [Google Scholar] [CrossRef] [Scilit] [PubMed]
  6. Rahimova, G.; Nabiev, S.; Azimov, A.; Sagdiev, M.; Alimova, R.n.; Khamdullaev, S.; Shavkiev, J. Morphological and agronomic characterization of colored cotton cultivars of G. hirsutum L. J. Wildl. Biodivers. 2024, 8, 165–178. [Google Scholar]
  7. Rauf, S.; Shehzad, M.; Al-Khayri, J.M.; Imran, H.M.; Noorka, I.R. Cotton (Gossypium hirsutum L.) breeding strategies. In Advances in Plant Breeding Strategies: Industrial and Food Crops: Volume 6; Springer: Berlin/Heidelberg, Germany, 2019; pp. 29–59. [Google Scholar]
  8. Kathiravan, P.; Narayanan, R.; Sathyaraj, D.; Sabesan, T.; Saravanan, K. Genetic variability studies for yield and yield attributing traits in upland cotton (Gossypium hirsutum L.). Int. J. Adv. Biochem. Res. 2025, 9, 1101–1105. [Google Scholar] [CrossRef] [Scilit]
  9. Zhang, J.; Zhu, Y.; Kole, C. World Cotton Production, Genetic Diversity, Genetic Grain, and Genomics. In The Cotton Genome; Zhang, J., Kole, C., Zhu, Y., Eds.; Springer Nature: Cham, Switzerland, 2025; pp. 1–20. [Google Scholar]
  10. Voora, V.; Larrea, C.; Bermudez, S. Global Market Report: Cotton; International Institute for Sustainable Development: Geneva, Switzerland, 2020. [Google Scholar]
  11. Makhmadjanov, S.; Tokhetova, L.; Daurenbek, N.; Dyamurshayeva, G.; Makhmadjanov, D. Selection of productive early maturing cotton genotypes with improved fibre quality parameters. Sci. Horiz. 2024, 27, 69–79. [Google Scholar] [CrossRef] [Scilit]
  12. Orken, A.; Manabayeva, S.; Makhmadjanov, S.; Ramazanova, M.; Kali, B.; Tokhetova, L.; Tussipkan, D. Cotton (Gossypium L.) production and importance of sequencing technology for improving agronomic traits. Fundam. Exp. Biol. 2025, 11830, 62–74. [Google Scholar] [CrossRef] [Scilit]
  13. Salnikov, V.; Talanov, Y.; Polyakova, S.; Assylbekova, A.; Kauazov, A.; Bultekov, N.; Musralinova, G.; Kissebayev, D.; Beldeubayev, Y. An Assessment of the Present Trends in Temperature and Precipitation Extremes in Kazakhstan. Climate 2023, 11, 33. [Google Scholar] [CrossRef] [Scilit]
  14. Tabynbayeva, L. GENETIC POTENTIAL OF NEW PROMISING COTTON (Gossypium hirsutum L.) CULTIVARS IN KAZAKHSTAN. SABRAO J. Breed. Genet. 2025, 57, 1818–1829. [Google Scholar] [CrossRef] [Scilit]
  15. Tulemetova, A.S.; Dosmuratova, E.E.; Serik, E. THE MAIN TENDENCIES OF PRODUCTION OF COTTON IN KAZAKHSTAN. In Proceedings of the Industrial Technologies and Engineering (ICITE-2018), Shymkent, Kazakhstan, 9–10 November 2018; pp. 205–210. [Google Scholar]
  16. Chen, X.; Yang, J.; She, D.; Chen, W.; Wu, J.; Wang, Y.; Chen, M.; Li, Y.; Qureshi, A.S.; Singh, A.; et al. Monitoring, Reclamation and Management of Salt-Affected Lands. Water 2025, 17, 813. [Google Scholar] [CrossRef] [Scilit]
  17. Zhang, D.; Xie, A.; Zhu, C.; Liu, Z.; Zhang, Z.; Zhai, W.; Zhao, Y.; Sun, J.; Zhao, B. Comprehensive evaluation and physiological responses of 20 table grape varieties to sole and combined salt and drought stress. Plant Sci. 2026, 362, 112790. [Google Scholar] [CrossRef] [Scilit] [PubMed]
  18. Maryum, Z.; Luqman, T.; Nadeem, S.; Khan, S.M.U.D.; Wang, B.; Ditta, A.; Khan, M.K.R. An overview of salinity stress, mechanism of salinity tolerance and strategies for its management in cotton. Front. Plant Sci. 2022, 13, 907937. [Google Scholar] [CrossRef] [Scilit] [PubMed]
  19. Chen, H.; Khan, M.K.R.; Zhou, Z.; Wang, X.; Cai, X.; Ilyas, M.K.; Wang, C.; Wang, Y.; Li, Y.; Liu, F. A high-density SSR genetic map constructed from a F2 population of Gossypium hirsutum and Gossypium darwinii. Gene 2015, 574, 273–286. [Google Scholar] [CrossRef] [Scilit] [PubMed]
  20. Razaji, A.; Panknejad, F.; Moarefi, M.; Damghani, A.M.; Ilkaee, M.N. Meta-analytical study of the effect of drought stress on cotton’s performance and its components in Iran. J. Crop Ecophysiol. 2020, 14, fa157–fa170. [Google Scholar]
  21. Paknejad, F.; Razaji, A.; Moarefi, M.; Damghani, A.M.; Ilkaee, M.N. Meta-analysis of the effects of salinity stress on cotton (Gossypium spp.) growth and yield in Iran. J. Agric. Sci. 2019, 26, 94–103. [Google Scholar]
  22. Chaudhary, M.T.; Majeed, S.; Rana, I.A.; Ali, Z.; Jia, Y.; Du, X.; Hinze, L.; Azhar, M.T. Impact of salinity stress on cotton and opportunities for improvement through conventional and biotechnological approaches. BMC Plant Biol. 2024, 24, 20. [Google Scholar] [CrossRef] [Scilit] [PubMed]
  23. Zhang, H.; Mao, L.; Xin, M.; Xing, H.; Zhang, Y.; Wu, J.; Xu, D.; Wang, Y.; Shang, Y.; Wei, L. Overexpression of GhABF3 increases cotton (Gossypium hirsutum L.) tolerance to salt and drought. BMC Plant Biol. 2022, 22, 313. [Google Scholar] [CrossRef] [Scilit] [PubMed]
  24. Wang, D.; Lu, X.; Chen, X.; Wang, S.; Wang, J.; Guo, L.; Yin, Z.; Chen, Q.; Ye, W. Temporal salt stress-induced transcriptome alterations and regulatory mechanisms revealed by PacBio long-reads RNA sequencing in Gossypium hirsutum. BMC Genom. 2020, 21, 838. [Google Scholar] [CrossRef] [Scilit]
  25. Li, H.; Liu, L.; Kong, X.; Wang, X.; Si, A.; Zhao, F.; Huang, Q.; Yu, Y.; Chen, Z. Time-course transcriptomics analysis reveals molecular mechanisms of salt-tolerant and salt-sensitive cotton cultivars in response to salt stress. Int. J. Mol. Sci. 2025, 26, 329. [Google Scholar] [CrossRef] [Scilit] [PubMed]
  26. El-Esawi, M.A.; Alayafi, A.A. Overexpression of StDREB2 transcription factor enhances drought stress tolerance in cotton (Gossypium barbadense L.). Genes 2019, 10, 142. [Google Scholar] [CrossRef] [Scilit] [PubMed]
  27. Ali, Z.; Maryam, H.; Saddique, M.A.B.; Ikram, R.M. Exploiting genetic diversity in enhancing phenotypic plasticity to develop climate-resilient cotton. Genet. Resour. Crop Evol. 2023, 70, 1305–1320. [Google Scholar] [CrossRef] [Scilit]
  28. Nour, M.M.; Aljabi, H.R.; AL-Huqail, A.A.; Horneburg, B.; Mohammed, A.E.; Alotaibi, M.O. Drought responses and adaptation in plants differing in life-form. Front. Ecol. Evol. 2024, 12, 1452427. [Google Scholar] [CrossRef] [Scilit]
  29. Patil, A.M.; Pawar, B.D.; Wagh, S.G.; Shinde, H.; Shelake, R.M.; Markad, N.R.; Bhute, N.K.; Červený, J.; Wagh, R.S. Abiotic Stress in Cotton: Insights into Plant Responses and Biotechnological Solutions. Agriculture 2024, 14, 1638. [Google Scholar] [CrossRef] [Scilit]
  30. Almeida, D.M.; Oliveira, M.M.; Saibo, N.J.M. Regulation of Na+ and K+ homeostasis in plants: Towards improved salt stress tolerance in crop plants. Genet. Mol. Biol. 2017, 40, 326–345. [Google Scholar] [CrossRef] [Scilit] [PubMed]
  31. Jomova, K.; Alomar, S.Y.; Alwasel, S.H.; Nepovimova, E.; Kuca, K.; Valko, M. Several lines of antioxidant defense against oxidative stress: Antioxidant enzymes, nanomaterials with multiple enzyme-mimicking activities, and low-molecular-weight antioxidants. Arch. Toxicol. 2024, 98, 1323–1367. [Google Scholar] [CrossRef] [Scilit] [PubMed]
  32. Cannea, F.B.; Padiglia, A. Antioxidant Defense Systems in Plants: Mechanisms, Regulation, and Biotechnological Strategies for Enhanced Oxidative Stress Tolerance. Life 2025, 15, 1293. [Google Scholar] [CrossRef] [Scilit] [PubMed]
  33. Aslam, N.; Li, Q.; Bashir, S.; Yuan, L.; Qiao, L.; Li, W. Integrated Review of Transcriptomic and Proteomic Studies to Understand Molecular Mechanisms of Rice’s Response to Environmental Stresses. Biology 2024, 13, 659. [Google Scholar] [CrossRef] [Scilit] [PubMed]
  34. Raza, A.; Salehi, H.; Bashir, S.; Tabassum, J.; Jamla, M.; Charagh, S.; Barmukh, R.; Mir, R.A.; Bhat, B.A.; Javed, M.A.; et al. Transcriptomics, proteomics, and metabolomics interventions prompt crop improvement against metal(loid) toxicity. Plant Cell Rep. 2024, 43, 80. [Google Scholar] [CrossRef] [Scilit] [PubMed]
  35. Tussipkan, D.; Pan, Z. Genetic markers and genome-wide association study in plants. Eurasian J. Appl. Biotechnol. 2023, 3, 3–14. [Google Scholar] [CrossRef] [Scilit]
  36. Peksen, E. Non-destructive leaf area estimation model for faba bean (Vicia faba L.). Sci. Hortic. 2007, 113, 322–328. [Google Scholar] [CrossRef] [Scilit]
  37. Dilnur, T.; Peng, Z.; Pan, Z.; Palanga, K.K.; Jia, Y.; Gong, W.; Du, X. Association Analysis of Salt Tolerance in Asiatic cotton (Gossypium arboretum) with SNP Markers. Int. J. Mol. Sci. 2019, 20, 2168. [Google Scholar] [CrossRef] [Scilit] [PubMed]
  38. Xu, C.; Mao, J.; Li, X.; Burner, D.M.; Li, C.; Hussin Hussin, S.H.; Lin, X.; Liu, H.; Zhao, P.; Lu, X. Evaluation of drought tolerance in sugarcane genotypes using the membership function value of drought tolerance (MFVD). Euphytica 2023, 219, 37. [Google Scholar] [CrossRef] [Scilit]
  39. Chen, X.; Min, D.; Yasir, T.A.; Hu, Y.-G. Evaluation of 14 morphological, yield-related and physiological traits as indicators of drought tolerance in Chinese winter bread wheat revealed by analysis of the membership function value of drought tolerance (MFVD). Field Crop. Res. 2012, 137, 195–201. [Google Scholar] [CrossRef] [Scilit]
  40. Fischer, R.; Maurer, R. Drought resistance in spring wheat cultivars. I. Grain yield responses. Aust. J. Agric. Res. 1978, 29, 897–912. [Google Scholar] [CrossRef] [Scilit]
  41. Ltaief, S.; Krouma, A. Functional dissection of the physiological traits promoting durum wheat (Triticum durum Desf.) tolerance to drought stress. Plants 2023, 12, 1420. [Google Scholar] [CrossRef] [Scilit] [PubMed]
  42. Kolde, R.; Maintainer, R.K. &Quot; Package ‘Pheatmap’. &Quot; R Pack-Age 1.7; R Foundation for Statistical Computing: Vienna, Austria, 2015; p. 790. Available online: https://CRAN.R-project.org/package=pheatmap (accessed on 1 March 2026).
  43. Sabagh, A.E.; Islam, M.S.; Iqbal, M.A.; Hossain, A.; Mubeen, M.; Jabeen, T.; Waleed, M.; Wasaya, A.; Rahman, M.H.U.; Ratnasekera, D. Salinity stress in cotton: Adverse effects, survival mechanisms and management strategies. In Engineering Tolerance in Crop Plants Against Abiotic Stress; CRC Press: Boca Raton, FL, USA, 2021; pp. 59–80. [Google Scholar]
  44. Lascano, R.J.; Payton, P.; Mahan, J.R.; Goebel, T.S.; Iii, D.C.G. Annual rainfall and dryland cotton lint yield-southern high plains of Texas. Agric. Sci. 2022, 13, 177–200. [Google Scholar] [CrossRef]
  45. Sun, Z.; Wang, Z.; Li, J. Identification and Evaluation of the Main Constraints on Cotton Production Within a Collective Drip Irrigation System in Southern Xinjiang, China. Agronomy 2025, 15, 760. [Google Scholar] [CrossRef] [Scilit]
  46. Anwar, Z.; Ditta, A.; Riaz Khan, M.K. Multivariate screening of upland cotton genotypes reveals key traits for salt tolerance at the seedling stage. BMC Plant Biol. 2025, 25, 1448. [Google Scholar] [CrossRef] [Scilit] [PubMed]
  47. Li, S.; Nurmemet, I.; Seydehmet, J.; Lv, X.; Aili, Y.; Yu, X. Spatiotemporal Dynamics and Driving Factors of Soil Salinization: A Case Study of the Yutian Oasis, Xinjiang, China. Land 2024, 13, 1941. [Google Scholar] [CrossRef] [Scilit]
  48. Ali, A. Improving Salinity and Agricultural Water Management in the Indus Basin, Pakistan: Issues, Management and Opportunitie: A Synthesis from a Desk-Top Literature Review; Gulbali Institute, Charles Sturt University Albury: Albury, NSW, Australia, 2023; Volume 1. [Google Scholar]
  49. Usmanov, D.; Radjapov, F.; Salokhuddinov, I.; Kamburova, V.; Abdukarimov, S.S.; Sobirov, B.; Azimov, A.; Abdugafforov, A.; Rakhmatova, N.; Abdurakhimov, A. ASSESSMENT OF SALT STRESS TOLERANCE IN LOCAL COTTON VARIETIES UNDER LABORATORY CONDITIONS. Сoвременная Биoлoгия И Генетика 2025, 2, 100–107. [Google Scholar]
  50. Muhammad Riaz, G.; Muhammad Yasir, S.; Sultan Ahmad, R.; Aaqib, R.; Waqas, N.; Ghulam, M.; Sikandar, H.; Mazher, I. Assessment of drought tolerance in various cotton genotypes under simulated osmotic settings. Asian J. Agric. Biol. 2021, 2, 202008437. [Google Scholar] [CrossRef] [Scilit]
  51. Kylyshbayeva, G.; Bishimbayeva, N.; Jatayev, S.; Eliby, S.; Shavrukov, Y. Polyethylene Glycol (PEG) Application Triggers Plant Dehydration but Does Not Accurately Simulate Drought. Plants 2025, 14, 92. [Google Scholar]
  52. Töpfer, V.; Melzer, M.; Snowdon, R.J.; Stahl, A.; Matros, A.; Wehner, G. PEG treatment is unsuitable to study root related traits as it alters root anatomy in barley (Hordeum vulgare L.). BMC Plant Biol. 2024, 24, 856. [Google Scholar] [CrossRef] [Scilit] [PubMed]
  53. Suska-Malawska, M.; Vyrakhamanova, A.; Ibraeva, M.; Poshanov, M.; Sulwiński, M.; Toderich, K.; Mętrak, M. Spatial and in-depth distribution of soil salinity and heavy metals (Pb, Zn, Cd, Ni, Cu) in arable irrigated soils in Southern Kazakhstan. Agronomy 2022, 12, 1207. [Google Scholar] [CrossRef] [Scilit]
  54. Tanirbergenov, S.; Saljnikov, E.; Suleimenov, B.; Saparov, A.; Cakmak, D. Salt affected soils under cotton-based irrigation agriculture in southern Kazakhstan. Zemlj. I Biljka 2020, 69, 1–14. [Google Scholar] [CrossRef] [Scilit]
  55. Yildiz-Aktas, L.; Dagnon, S.; Gurel, A.; Gesheva, E.; Edreva, A. Drought tolerance in cotton: Involvement of non-enzymatic ROS-scavenging compounds. J. Agron. Crop Sci. 2009, 195, 247–253. [Google Scholar] [CrossRef] [Scilit]
  56. Sikder, R.K.; Wang, X.; Jin, D.; Zhang, H.; Gui, H.; Dong, Q.; Pang, N.; Zhang, X.; Song, M. Screening and evaluation of reliable traits of upland cotton (Gossypium hirsutum L.) genotypes for salt tolerance at the seedling growth stage. J. Cotton Res. 2020, 3, 11. [Google Scholar] [CrossRef] [Scilit]
  57. Oguz, M.C.; Aycan, M.; Oguz, E.; Poyraz, I.; Yildiz, M. Drought stress tolerance in plants: Interplay of molecular, biochemical and physiological responses in important development stages. Physiologia 2022, 2, 180–197. [Google Scholar] [CrossRef] [Scilit]
  58. Ergin, N.; Kulan, E.; Gözükara, M.; Kaya, M.; Çetin, Ş.; Kaya, M.D. Response of germination and seedling development of cotton to salinity under optimal and suboptimal temperatures. Kahramanmaraş Sütçü İmam Üniversitesi Tarım Doğa Derg. 2021, 24, 108–115. [Google Scholar] [CrossRef] [Scilit]
  59. Arif, Y.; Singh, P.; Siddiqui, H.; Bajguz, A.; Hayat, S. Salinity induced physiological and biochemical changes in plants: An omic approach towards salt stress tolerance. Plant Physiol. Biochem. 2020, 156, 64–77. [Google Scholar] [CrossRef] [Scilit] [PubMed]
  60. Shelden, M.C.; Munns, R. Crop root system plasticity for improved yields in saline soils. Front. Plant Sci. 2023, 14, 1120583. [Google Scholar] [CrossRef] [Scilit] [PubMed]
  61. Michel, B.E.; Kaufmann, M.R. The osmotic potential of polyethylene glycol 6000. Plant Physiol. 1973, 51, 914–916. [Google Scholar] [CrossRef] [Scilit] [PubMed]
  62. Lokhande, S.; Reddy, K.R. Reproductive and Fiber Quality Responses of Upland Cotton to Moisture Deficiency. Agron. J. 2014, 106, 1060–1069. [Google Scholar] [CrossRef] [Scilit]
  63. Richards, L.A. Diagnosis and Improvement of Saline and Alkali Soils; US Government Printing Office: Washington, DC, USA, 1954.
  64. Riaz, M.; Rafiq, M.; Nawaz, H.H.; Miao, W. Bridging Molecular Insights and Agronomic Innovations: Cutting-Edge Strategies for Overcoming Boron Deficiency in Sustainable Rapeseed Cultivation. Plants 2025, 14, 995. [Google Scholar] [CrossRef] [Scilit] [PubMed]
  65. Ahmed, N.; Chaudhry, U.K.; Ali, M.A.; Ahmad, F.; Sarfraz, M.; Hussain, S. Salinity tolerance in cotton. In Cotton Production and uses: Agronomy, Crop Protection, and Postharvest Technologies; Springer: Berlin/Heidelberg, Germany, 2020; pp. 367–391. [Google Scholar]
  66. Ranjan, A.; Sinha, R.; Singla-Pareek, S.L.; Pareek, A.; Singh, A.K. Shaping the root system architecture in plants for adaptation to drought stress. Physiol. Plant. 2022, 174, e13651. [Google Scholar] [CrossRef] [Scilit] [PubMed]
  67. Amin, I.; Rasool, S.; Mir, M.A.; Wani, W.; Masoodi, K.Z.; Ahmad, P. Ion homeostasis for salinity tolerance in plants: A molecular approach. Physiol. Plant. 2021, 171, 578–594. [Google Scholar] [PubMed]
  68. Atta, K.; Mondal, S.; Gorai, S.; Singh, A.P.; Kumari, A.; Ghosh, T.; Roy, A.; Hembram, S.; Gaikwad, D.J.; Mondal, S. Impacts of salinity stress on crop plants: Improving salt tolerance through genetic and molecular dissection. Front. Plant Sci. 2023, 14, 1241736. [Google Scholar] [CrossRef] [Scilit] [PubMed]
  69. Bonarota, M.-S.; Kosma, D.K.; Barrios-Masias, F.H. Salt tolerance mechanisms in the Lycopersicon clade and their trade-offs. AoB Plants 2022, 14, plab072. [Google Scholar] [PubMed]
  70. Bonarota, M.-S.; Fenstemaker, S.; Vasquez-Gross, H.; Petereit, J.; Santos, P.; Francis, D.M.; Barrios-Masias, F.H. Physiology of salt tolerance introgressions from Solanum galapagense in the domesticated tomato. Front. Plant Sci. 2025, 16, 1568851. [Google Scholar] [CrossRef] [Scilit] [PubMed]
  71. Wasaya, A.; Zhang, X.; Fang, Q.; Yan, Z. Root phenotyping for drought tolerance: A review. Agronomy 2018, 8, 241. [Google Scholar] [CrossRef] [Scilit]
  72. Roy, S.J.; Negrão, S.; Tester, M. Salt resistant crop plants. Curr. Opin. Biotechnol. 2014, 26, 115–124. [Google Scholar] [CrossRef] [Scilit] [PubMed]
  73. Liu, X.; Song, Y.; Xing, F.; Wang, N.; Wen, F.; Zhu, C. GhWRKY25, a group I WRKY gene from cotton, confers differential tolerance to abiotic and biotic stresses in transgenic Nicotiana benthamiana. Protoplasma 2016, 253, 1265–1281. [Google Scholar] [PubMed]
  74. Li, S.; Khoso, M.A.; Xu, H.; Zhang, C.; Liu, Z.; Wagan, S.; Dinislam, K.; Liu, L. WRKY transcription factors (TFs) as key regulators of plant resilience to environmental stresses: Current perspective. Agronomy 2024, 14, 2421. [Google Scholar] [CrossRef] [Scilit]
  75. Samanta, S.; Roychoudhury, A. Molecular crosstalk of jasmonate with major phytohormones and plant growth regulators during diverse stress responses. J. Plant Growth Regul. 2025, 44, 62–88. [Google Scholar]
Figure 1. Trait evaluation under different NaCl concentrations at 14 days after sowing. (A) Germination of the studied accessions under various NaCl concentrations (0, 100, 150, 200, 250, and 300 mM). Lines: M-4023-1, M-4023-2, M-4027, M-4027-8, M-4028-8, M-4028-9, M-4033-4, M-4033-5. (B) Root system development of line M-4028-8 under different NaCl concentrations.
Ijpb 17 00065 g001
Figure 2. Trait evaluation under different PEG-6000 concentrations at 14 days after sowing. Germination of the studied accessions under various PEG concentrations (0%, 10%, 20%, 30%, and 40%). Lines: M-4013-1, M-4013-2, M-4013-3, M-4013-4, M-4013-5, M-4014-5, M-4014-1, M-4014-2, M-4014-3, M-4014-4, M-4016-4, and M-4020-1.
Ijpb 17 00065 g002
Figure 3. Linear regression plot of the relative values of the six traits of salt tolerance (x-axis: NaCl concentrations (mM); y-axis: salt damage index). (A) SDI of GR. (B) SDI of PH. (C) SDI of PFW. (D) SDI of RDW. (E) SDI of CA. (F) SDI of RWC.
Ijpb 17 00065 g003
Figure 4. Linear regression plot of the relative values of the six traits of drought tolerance (x-axis: PEG-6000 concentration (%); y-axis: drought damage index). (A) DDI of GR. (B) DDI of PH. (C) DDI I of PFW. (D) DDI of RDW. (E) DDI of CA. (F) DDI of RWC.
Ijpb 17 00065 g004
Figure 5. Heat map of the classification of 56 cotton lines based on average MFV under NaCl concentrations. Rows represent the five clusters, columns represent NaCl treatments, and colors indicate average MFV (red: lower values; green: higher values).
Ijpb 17 00065 g005
Figure 6. Core phenotypic trait differences among salt tolerance clusters. Ten individual plants from each line were used to evaluate each trait. Values represent the mean ± SD of all lines within each cluster (Cluster 1, n = 14 lines; Cluster 2, n = 10 lines; Cluster 3, n = 10 lines; Cluster 4, n = 10 lines; and Cluster 5, n = 12 lines).
Ijpb 17 00065 g006
Figure 7. Heat map of the classification of 56 cotton lines based on average MFV under PEG-6000 concentrations. Rows represent the five clusters, columns represent PEG-6000 treatments, and colors indicate average MFV (red: lower values; green: higher values).
Ijpb 17 00065 g007
Figure 8. Core phenotypic trait differences among drought tolerance clusters. Ten individual plants from each line were used to evaluate each trait. Values represent the mean ± SD of all lines within each cluster (Cluster 1, n = 15 lines; Cluster 2, n = 9 lines; Cluster 3, n = 11 lines; Cluster 4, n = 9 lines; and Cluster 5, n = 12 lines).
Ijpb 17 00065 g008
Figure 9. PCA biplots showing the relationships between salt (X1) and drought (X2) tolerance coefficients for the measured morphophysiological traits: (A) GR, (B) PH, (C) PFW, (D) RDW, (E) CA, (F) RWC, and (G) STC and DTC. PC1 and PC2 represent the first and second principal components, respectively, and the percentages in parentheses indicate the proportion of the total variance explained by each component. Blue circles represent individual cotton lines, while red arrows represent the salt (X1) and drought (X2) tolerance vectors; the angle between the arrows indicates the strength and direction of the correlation between genotype responses under the two stress conditions.
Ijpb 17 00065 g009
Figure 10. Pearson correlation matrix of morpho-physiological traits measured under salt (NaCl) and drought (PEG-6000) stress, including STC and DTC. Cell colors represent Pearson correlation coefficients (r), ranging from −1 (blue, strong negative correlation) to +1 (red, strong positive correlation), with colors near white indicating no correlation. The matrix includes both statistically significant and non-significant correlations.
Ijpb 17 00065 g010
Table 1. Descriptive statistics of morpho-physiological traits in cotton lines under control and NaCl concentrations.
TraitMinMaxAverage ± SDMean Squarep *
Control
GR (%)6010089.29 ± 1.7490.22
PH (cm)5.1815.69.90 ± 0.3610.24
PFW (g)0.312.631.18 ± 0.051.25
RDW (g)0.100.290.16 ± 0.010.17
CA (cm2)2.2614.139.21 ± 0.269.40
RWC (%)36.8094.9463.09 ± 1.5364.10
100 mM
GR (%)010085.71 ± 2.3687.48>0.05
PH (cm)010.16.76 ± 0.267.03<0.0001
PFW (g)01.390.85 ± 0.040.89<0.0001
RDW (g)00.250.13 ± 0.010.14<0.01
CA (cm2)012.656.27 ± 0.386.89<0.0001
RWC (%)0100.0653.77 ± 2.7957.60<0.01
150 mM
GR (%)010080.53 ± 3.5284.65>0.05
PH (cm)08.25.41 ± 0.255.73<0.0001
PFW (g)00.960.63 ± 0.030.67<0.0001
RDW (g)00.380.12 ± 0.010.13<0.0001
CA (cm2)08.564.42 ± 0.325.03<0.0001
RWC (%)075.1648.10 ± 3.2553.8<0.01
200 mM
GR (%)010072.86 ± 3.6777.78>0.05
PH (cm)06.754.35 ± 0.24.59<0.0001
PFW (g)00.840.49 ± 0.030.52<0.0001
RDW (g)00.140.09 ± 0.00360.1<0.0001
CA (cm2)06.63.35 ± 0.273.92<0.0001
RWC (%)079.3643.6 ± 3.3750.26<0.0001
250 mM
GR (%)010062.32 ± 4.3470.14<0.0001
PH (cm)06.323.33 ± 0.193.62<0.0001
PFW (g)00.610.34 ± 0.020.37<0.0001
RDW (g)00.140.08 ± 0.0040.08<0.0001
CA (cm2)05.372.31 ± 0.242.9<0.0001
RWC (%)086.7934.51 ± 3.643.63<0.0001
300 mM
GR (%)010044.82 ± 4.254.69<0.0001
PH (cm)04.82.51 ± 0.192.88<0.0001
PFW (g)00.560.23 ± 0.020.27<0.0001
RDW (g)00.110.06 ± 0.0040.07<0.0001
CA (cm2)04.41.16 ± 0.181.78<0.0001
RWC (%)06423.6 ± 3.5235.17<0.0001
* p > 0.05—insignificant, p < 0.01—significant and p < 0.0001—highly significant.
Table 2. Descriptive statistics of morphophysiological traits in cotton lines under control conditions and PEG-6000 concentrations.
TraitMinMaxAverage ± SDMean Squarep *
Control
GR4010080 ± 2.2781.77
PH (cm)4.4911.478.02 ± 0.268.25
PFW (g)3.4617.959.28 ± 0.53810.11
RDW (cm)0.020.530.19 ± 0.130.21
CA (cm2)4.1121.3510.18 ± 0.4810.79
RWC (%)54.4498.9876.29 ± 1.5677.29
20% PEG
GR3010077.68 ± 1.9779.0>0.05
PH (cm)2.959.095.41 ± 0.175.55<0.0001
PFW (g)1.4213.445.13 ± 0.335.68<0.0001
RDW (cm)0.020.420.19 ± 0.010.18<0.05
CA (cm2)2.459.565.27 ± 0.245.56<0.0001
RWC (%)34.7995.3772.66 ± 1.6873.72>0.05
30% PEG
GR010067.86 ± 3.7773.4<0.05
PH (cm)07.284.58 ± 0.24.82<0.0001
PFW (g)08.154.06 ± 0.274.54<0.0001
RDW (cm)00.590.13 ± 0.010.17<0.0001
CA (cm2)08.64.14 ± 0.274.58<0.0001
RWC (%)099.6362.99 ± 3.5168.17<0.05
* p > 0.05—insignificant, p < 0.05, p < 0.01—significant and p < 0.0001—highly significant.
Table 3. Cross-classification of cotton lines according to salt and drought tolerance.
Drought
Tolerance
Highly
Tolerant
TolerantModerate
Tolerant
SusceptibleHighly Susceptible
Salt
Tolerance
Highly tolerantM-4016-6
M-4031-8
M-4014-6
M-4029-9
M-4016-7
M-4016-8
M-4051
M-4033-5
M-4005-8
M-4028-9
M-4031-9
M-4028-8
M-4029-8
M-4027
TolerantM-4020-2M-4016-4M-4031-6
M-4022-8
M-4022-9
M-4033-4
M-4055
M-4024
M-4023-1
M-4023-2
Moderate
tolerant
M-4031-50M-4022-7
M-4029-3
M-4022-6
M-4029-4
M-4027-8
M-4029-6
M-4029-5
SusceptibleM-4014-3
M-4022-14
M-4031-7M-4022-11
M-4020-1
M-4022-10M-4005-7
M-4022-13
Highly
Susceptible
M-4013-4
M-4016-3
M-4013-1
M-4014-5
M-4013-3
M-4013-2
M-4014-2
M-4013-5
M-4014-1
M-4014-7
00M-4014-4
Disclaimer/Publisher’s Note: The statements, opinions and data contained in all publications are solely those of the individual author(s) and contributor(s) and not of MDPI and/or the editor(s). MDPI and/or the editor(s) disclaim responsibility for any injury to people or property resulting from any ideas, methods, instructions or products referred to in the content.