Article

Regulation of Photomorphogenesis, Structural Quality, and Physiological Status in Sorrel (Rumex acetosa L.) Across LED Light Quality Treatments


1
Department of Environmental Horticulture, Graduate School, Sahmyook University, Seoul 01795, Republic of Korea
2
Natural Science Research Institute, Sahmyook University, Seoul 01795, Republic of Korea
3
Department of Environmental Design & Horticulture, Sahmyook University, Seoul 01795, Republic of Korea
4
DMZ Forest Biological Resources Research Division, Korea National Arboretum, Yanggu 24564, Republic of Korea
*
Author to whom correspondence should be addressed.
These authors contributed equally to this work.
Int. J. Plant Biol. 2026, 17(8), 64; https://doi.org/10.3390/ijpb17080064
Submission received: 3 May 2026 / Revised: 13 July 2026 / Accepted: 23 July 2026 / Published: 28 July 2026
(This article belongs to the Section Plant Physiology)

Abstract

Sorrel (Rumex acetosa L.) is a promising leafy vegetable for controlled-environment production, but integrated information on its growth, structural quality, optical traits, and photochemical responses to light-emitting diode (LED) spectra remains limited. To our knowledge, this study provides the first systematic comparison of five contrasting LED spectral conditions in sorrel using morphological, biomass, structural-quality, reflectance-based, and chlorophyll-fluorescence indicators. Plants were grown for six weeks under red light (RL), green light (GL), blue light (BL), purple-phyto light (PL) containing red, blue, and far-red components, or white light (WL) at a color temperature of 6500 K. Sorrel responses differed markedly among spectral environments and could not be explained by a single growth parameter. WL produced the highest mean shoot dry weight (505 mg), which was approximately 30.5% higher than that under PL (387 mg), although the difference between the two treatments was not statistically significant. WL also produced 46.5% greater leaf area than PL (50.1 versus 34.2 cm2) and showed the highest mean PIABS value (4.00). In contrast, PL showed the highest mean root dry weight (25.5 mg) and Dickson quality index (9.4), together with a relatively low shoot-to-root ratio (17.7) and top-heavy index (20.0), indicating a less shoot-biased structural pattern. BL restricted growth and leaf development and was associated with lower soil plant analysis development units, normalized difference vegetation index, photochemical reflectance index, Fv/Fm, and PIABS, indicating that BL alone may have limited suitability for sorrel cultivation under the present experimental conditions. Under the tested conditions, WL appeared more suitable for yield-oriented production, whereas PL may be considered when shoot–root structural balance is prioritized.

1. Introduction

Sorrel (Rumex acetosa L.), a member of the Polygonaceae family, is a promising fresh-market leafy vegetable for which leaf color, morphological balance, and texture are important determinants of marketability [1,2]. In addition, sorrel has potential as a medicinal crop, exhibiting beneficial properties such as antioxidant activity, anti-inflammatory activity, inhibition of thrombus formation, and prevention of gastric ulcers [3,4,5]. Consumer preference for leafy vegetables is influenced not only by yield but also by visual quality and uniformity, making precise management of the cultivation environment essential for promoting stable leaf expansion and pigment accumulation during early growth [6,7]. From this perspective, controlled environment horticulture (CEH) emphasizes the regulation of the light environment alongside temperature, relative humidity, and nutrient solution conditions as central to crop production. Among these factors, light quality is considered a key environmental variable capable of simultaneously modulating plant growth and quality [8,9].
In plants, light functions not only as an energy source for photosynthesis but also as a critical signal regulating photomorphogenesis and physiological responses [10,11]. Plants perceive information about their light environment through diverse photoreceptors, and these signals can influence leaf expansion, elongation growth, pigment accumulation, stomatal conductance, and biomass allocation [12,13]. In terms of spectral conditions, red and far-red light are primarily linked to phytochrome-mediated regulation of elongation responses and canopy architecture [14], while blue light, through cryptochrome- and phototropin-related pathways, is important for chlorophyll formation, stomatal regulation, and stabilization of leaf morphology [15]. Green light penetrates more deeply into leaf tissues and may influence plant morphological responses [16]. Accordingly, even under similar light intensity, plant growth responses can differ based on the spectral composition, underscoring the need for diverse experimental approaches to evaluate species- and cultivar-specific light responses [17,18].
Chlorophylls and carotenoids are major pigments involved in light-energy capture and are important determinants of leaf color and visual quality; their accumulation can vary depending on the light environment [18,19]. In addition, certain light-quality conditions may favor increases in both fresh weight and dry weight, while others may have a relatively greater impact on shoot compactness, elongation, or the visual intensity of external leaf coloration [20,21,22]. Light quality is also known to influence structural quality and resource allocation patterns, indicating that spectral conditions should be carefully considered when designing cultivation environments [23].
To accurately interpret light-quality responses in leafy vegetables, these responses should be assessed multidimensionally rather than by relying on a single growth parameter. This approach should consider photosynthetic function, optical properties, and structural quality together [18,20,24]. Chlorophyll a fluorescence sensitively and non-destructively reflects the photochemical performance of photosystem II (PSII) and the functional status of the photosynthetic apparatus [25,26], making it valuable for evaluating early physiological responses of plants to changes in the light environment [27]. Meanwhile, vegetation indices derived from spectral reflectance properties can non-destructively estimate traits associated with chlorophyll content, greenness, leaf area, or light-use efficiency, thereby providing information complementary to that obtained from fluorescence parameters, which reflect PSII functional status [28,29,30]. Moreover, plant quality indices based on biomass accumulation, morphological traits, and shoot–root resource allocation patterns may provide a useful framework for evaluating the overall quality of sorrel under different light-quality treatments.
Light-emitting diodes (LEDs) allow precise control of spectral power distributions and are widely used as artificial light sources in CEH due to their long operational lifespan, high energy efficiency, low heat emission, and improved cost efficiency [31]. Monochromatic wavebands, such as red, green, and blue light, are useful for comparing species- and cultivar-specific physiological responses [20,32,33], whereas purple-phyto LEDs, which combine red and blue wavelengths with far-red components, may enhance growth or quality-related responses in some crops [25,34]. In contrast, white light (WL) provides a broader spectral range and serves as a practical reference light source for comparison with monochromatic or composite narrow-band treatments [35,36]. Therefore, comparing these light-quality treatments within a single experimental framework may facilitate an integrated interpretation of photomorphogenic responses and pigment-accumulation patterns in sorrel.
Although the effects of LED spectra have been extensively examined in several leafy vegetables, information regarding sorrel remains limited. In particular, previous studies have not systematically integrated shoot–root biomass allocation, structural-quality indices, leaf-level reflectance indices, and chlorophyll a fluorescence parameters when evaluating the response of sorrel to contrasting LED spectra. Consequently, it remains unclear whether a spectral condition that maximizes shoot biomass also provides favorable shoot–root balance, leaf optical characteristics, and PSII photochemical performance. A simultaneous comparison of monochromatic, composite, and broad-spectrum LEDs is therefore needed to identify both productive and structurally balanced light environments for sorrel.
This study aimed to compare the effects of red, green, blue, purple-phyto, and white LED spectra on the growth, shoot–root biomass allocation, structural quality, leaf optical characteristics, and PSII photochemical performance of sorrel. We further sought to determine whether the spectral condition most favorable for shoot productivity differed from that associated with balanced structural development.

2. Materials and Methods

2.1. Plant Materials, Growth Conditions, and LED Light Quality Treatments

Sorrel seeds were obtained from a seed company (Asia Seed, Seoul, Republic of Korea). The seeds were sown in square plastic pots measuring 6.5 × 6.5 × 6.5 cm (W × L × H). The pots were filled with a medium consisting of non-fertilized horticultural substrate (Hanareumsangto, Shinsung Mineral, Goesan-gun, Republic of Korea), vermiculite (Verminuri, G.F.C., Hongseong-gun, Republic of Korea), and perlite (New Pearl Shine No. 1, G.F.C., Hongseong-gun, Republic of Korea), mixed in a ratio of 1:1:1 (v/v/v). Five seeds were sown per pot, and germination was induced in a greenhouse under approximately 25% shading. When the first true leaf had fully expanded, one uniformly grown seedling was selected from each pot, and the remaining seedlings were thinned.
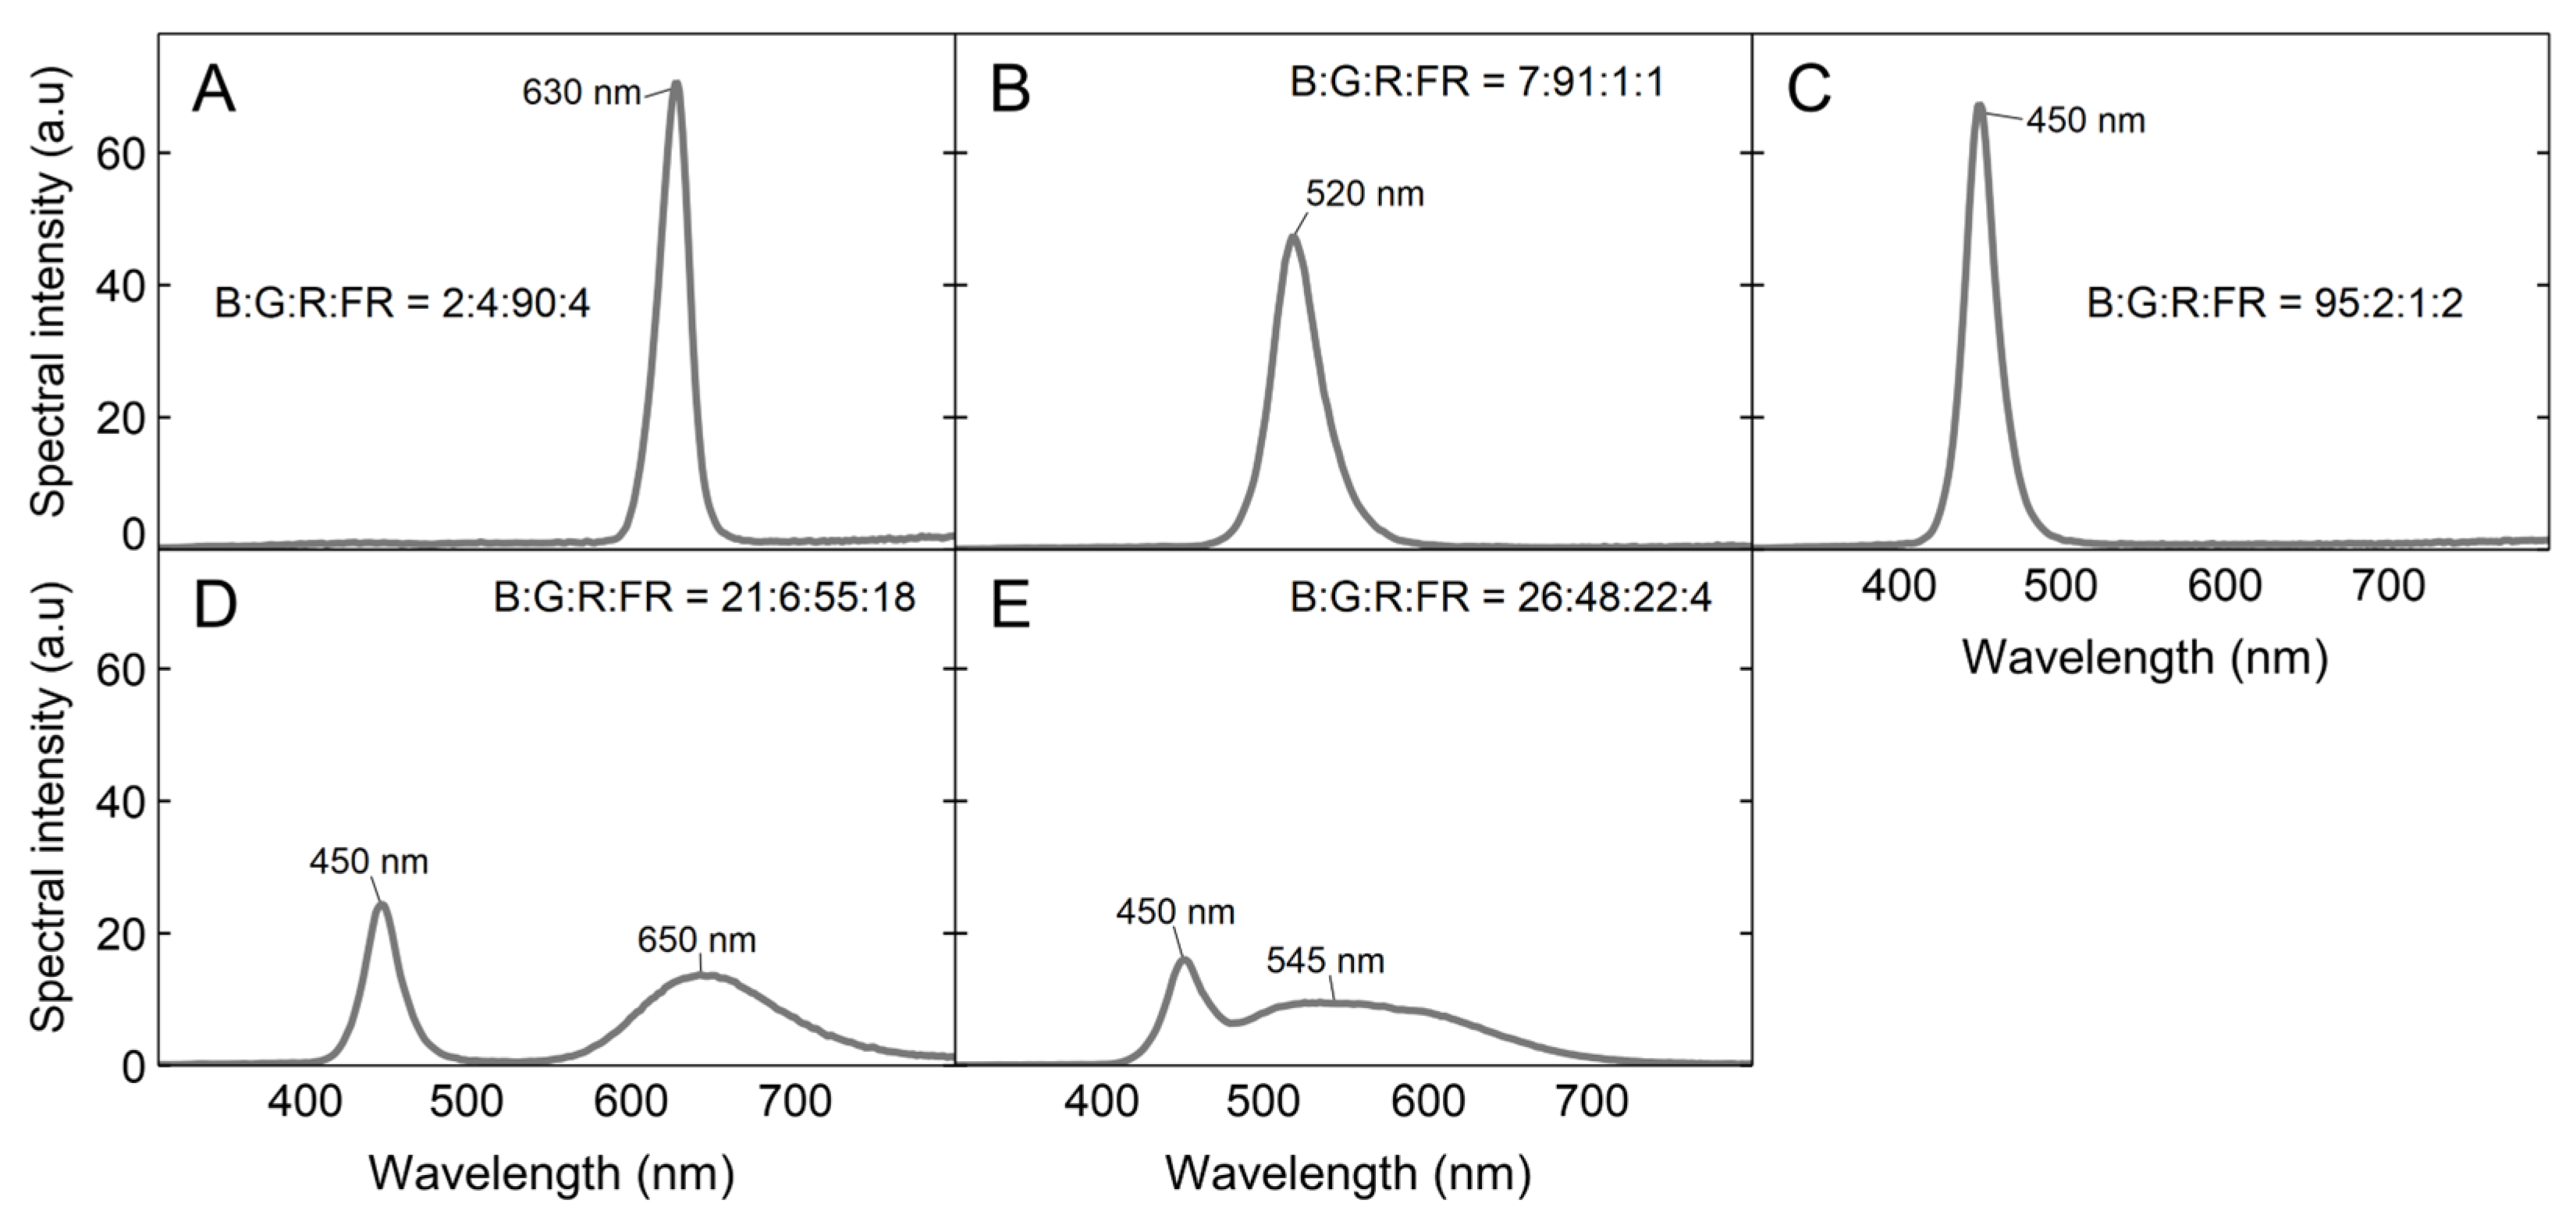
The selected seedlings were transferred to a closed-type plant factory with artificial lighting (PFAL) located in the experimental greenhouse of the Department of Environmental Horticulture, Sahmyook University, Nowon-gu, Seoul, Republic of Korea, for LED light-quality treatments. During the treatment period, the air temperature, relative humidity, and photoperiod were maintained at 20 ± 1 °C, 57.8 ± 13.4%, and a 14 h light/10 h dark cycle, respectively. The LED treatments comprised red light (RL) with a dominant peak at 630 nm and blue:green:red:far-red (B:G:R:FR) photon fractions of approximately 2:4:90:4; green light (GL) with a dominant peak at 520 nm and photon fractions of 7:91:1:1; blue light (BL) with a dominant peak at 450 nm and photon fractions of 95:2:1:2; purple-phyto light (PL) with major peaks at 450 and 650 nm and photon fractions of 21:6:55:18; and 6500 K WL with major spectral components near 450 and 545 nm and photon fractions of 26:48:22:4 (Figure 1). The T5 LEDs (Zhong Shan Jinsung Electronic, Zhongshan, China) used in this study were 1.2 m in length and had a power consumption of 20 W, a rated voltage of 220 V, and a frequency of 60 Hz. All treatments were adjusted to provide the same photon flux density of 100 µmol·m−2·s−1 over the 350–800 nm range at the upper canopy level. Light intensity and spectral power distributions were measured using a spectroradiometer (SpectraPen Mini; Photon Systems Instruments, Drásov, Czech Republic). The wavelength-resolved data exported from the instrument were used to calculate the relative photon fractions.
Plants were sub-irrigated twice a week with a nutrient solution. The nutrient solution contained a premixed fertilizer (Masterblend 4-18-38; Masterblend International-Tyler Enterprises, Morris, IL, USA), magnesium sulfate (MgSO4), and calcium nitrate [Ca(NO3)2] at final concentrations of 750, 375, and 750 mg·L−1, respectively.

2.2. Growth, Morphological Traits, and Biomass Component Measurements

Plants were grown under the light-quality treatments for six weeks, after which growth and morphological traits were measured at harvest. Shoot height (SH) was defined as the distance from the surface of the growing medium to the uppermost point of the plant, and shoot width (SW) was measured as the maximum horizontal width of the canopy. Stem diameter (SD) was measured at the basal region, and root length (RtL) was determined as the length of the longest root. Additionally, ground coverage, leaf length, leaf width, leaf area, leaf thickness, petiole length, and leaf number were recorded. Ground coverage and leaf area were calculated according to the method of Lee et al. [18], and the sturdiness quotient (SQ) and shoot aspect ratio (SAR) were also determined using the following equations:
GC = (π/4) · (SW · SW)
LA = (π/4) · (LL · LW)
SQ = SH/SD
SAR = SH/SW
(GC: ground coverage; SW: shoot width; LA: leaf area; LL: leaf length; LW: leaf width; SQ: sturdiness quotient; SH: shoot height; SD: stem diameter; and SAR: shoot aspect ratio).
Each plant was separated into shoot and root portions immediately after harvest, and their fresh weights were measured. Dry weight was determined after drying the samples in a hot-air drying oven at 105 °C for at least 24 h until a constant weight was reached. Based on these measurements, shoot dry weight (SDW), root dry weight (RDW), and the shoot-to-root ratio (S/R) were calculated. Relative moisture content (RMC) was also calculated using fresh weight and dry weight data from individual plants. The equation for RMC was adapted from Lee and Nam [37], as follows:
RMC = [(TFWTDW)/TFW] · 100
(RMC: relative moisture content; TFW: total fresh weight; and TDW: total dry weight).

2.3. Plant Structural Quality Assessments and Physiological Responses

Chlorophyll-related traits, leaf color, chlorophyll fluorescence, and vegetation indices were assessed using fully expanded leaves. Plant structural-quality indices were calculated separately from morphological traits and biomass components. Soil plant analysis development (SPAD) units were measured on fully expanded leaves using a portable chlorophyll meter (SPAD-502Plus; Konica Minolta, Tokyo, Japan), and leaf color was measured using a spectrophotometer (CM-2600d; Konica Minolta, Tokyo, Japan) and expressed as Commission Internationale de l’Éclairage Lab (CIELAB) L*, a*, and b* coordinates. All measurements were taken while avoiding the midrib. Following the method of Lee [38], the spectrophotometer was operated in specular component included (SCI) mode with a D65 illuminant and a 10° standard observer setting (D65/10°).
To quantify resource allocation patterns and structural quality, plant quality indices were calculated using morphological traits and biomass components. These included conventional plant quality indices such as the S/R, compactness, and Dickson quality index (DQI), as well as the top-heavy index (THI) and root investment ratio (RIR) [23].
S/R = SDW/RDW
Compactness = SDW/SH
DQI = TDW/(SH/SD + SDW/RDW)
THI = (SDW/RDW) · (SH/RtL)
RIR = (RDW/TDW) · (RtL/SH)
(SDW: shoot dry weight; RDW: root dry weight; SH: shoot height; TDW: total dry weight; SD: stem diameter; and RtL: root length).
For the analysis of remote sensing-based vegetation indices, reflectance spectra were measured over the 380–790 nm range using a portable spectroradiometer (PolyPen RP410, UVIS version; Photon Systems Instruments, Drásov, Czech Republic). Based on the measured reflectance spectra, the normalized difference vegetation index (NDVI), photochemical reflectance index (PRI), modified chlorophyll absorption ratio index (MCARI), structure-insensitive pigment index (SIPI), anthocyanin reflectance index 1 (ARI1), and carotenoid reflectance index 1 (CRI1) were calculated using the following equations [39]:
NDVI = (ρNIRρRed)/(ρNIR + ρRed)
PRI = (ρ531ρ570)/(ρ531 + ρ570)
MCARI = [(ρ700ρ670) − 0.2 · (ρ700ρ550)] · (ρ700/ρ670)
SIPI = (ρ790ρ450)/(ρ790ρ650)
ARI1 = (1/ρ550) − (1/ρ700)
CRI1 = (1/ρ510) − (1/ρ550)
Chlorophyll a fluorescence was measured using a portable fluorometer (FluorPen FP 110/D; Photon Systems Instruments, Drásov, Czech Republic). Before measurement, leaves were dark-adapted for at least 15 min using detachable dark-adapted leaf clips. Following the method of Shin et al. [20], the fluorometer was set to an excitation wavelength of 455 nm, and the leaves were exposed to an irradiance of 1500 µmol·m−2·s−1 (saturating light pulse), corresponding to 50% of the super-pulse intensity, to induce the maximum fluorescence level (Fm) required for the JIP test. The O-J-I-P fluorescence induction curve was recorded, and Fo, Fj, Fi, and Fm were analyzed. Based on these parameters, the maximum quantum yield of PSII (Fv/Fm) and the performance index on an absorption basis (PIABS) were calculated using the following equations [22,40]:
Fv/Fm = (FmFo)/Fm
PIABS = (RC/ABS)·[ΦPo/(1 − ΦPo)]·[Ψo/(1 − Ψo)]

2.4. Statistical and Multivariate Analyses

Data obtained from the experiment were analyzed using SAS 9.4 (SAS Institute, Cary, NC, USA). Each LED light-quality treatment included 12 replicates (n = 12), with each replicate representing an independent plant grown in an individual pot. Pots within each treatment were arranged in a completely randomized design (CRD) and were periodically repositioned to minimize positional effects. Differences among treatments were tested using one-way analysis of variance (ANOVA), and mean separation was conducted with Duncan’s multiple range test (DMRT) at a significance level of α = 0.05. Treatment differences were considered statistically significant at p < 0.05.
To interpret the integrated response patterns of sorrel to light-quality treatments, multivariate and correlation analyses were performed using variables related to morphological traits, biomass components, plant quality indices, SPAD units, leaf color, chlorophyll fluorescence parameters, and vegetation indices. Before analysis, all variables were standardized using Z-scores to facilitate comparisons among variables with different units and scales. Principal component analysis (PCA) was initially performed, and the results were visualized using a scree plot and a score-loading biplot to examine both the distribution of treatment scores and the directionality of variable loadings. For interpretive clarity, principal components up to PC5 were also summarized in tabular form.
For exploratory visualization of one-versus-rest associations between each LED treatment and the measured traits, each treatment was coded as a binary dummy variable. Point-biserial correlation coefficients, which are mathematically equivalent to Pearson correlation coefficients between a binary and a continuous variable, were then calculated using the standardized traits.

3. Results

3.1. Plant Growth and Canopy Development Under LED Light Quality Treatments

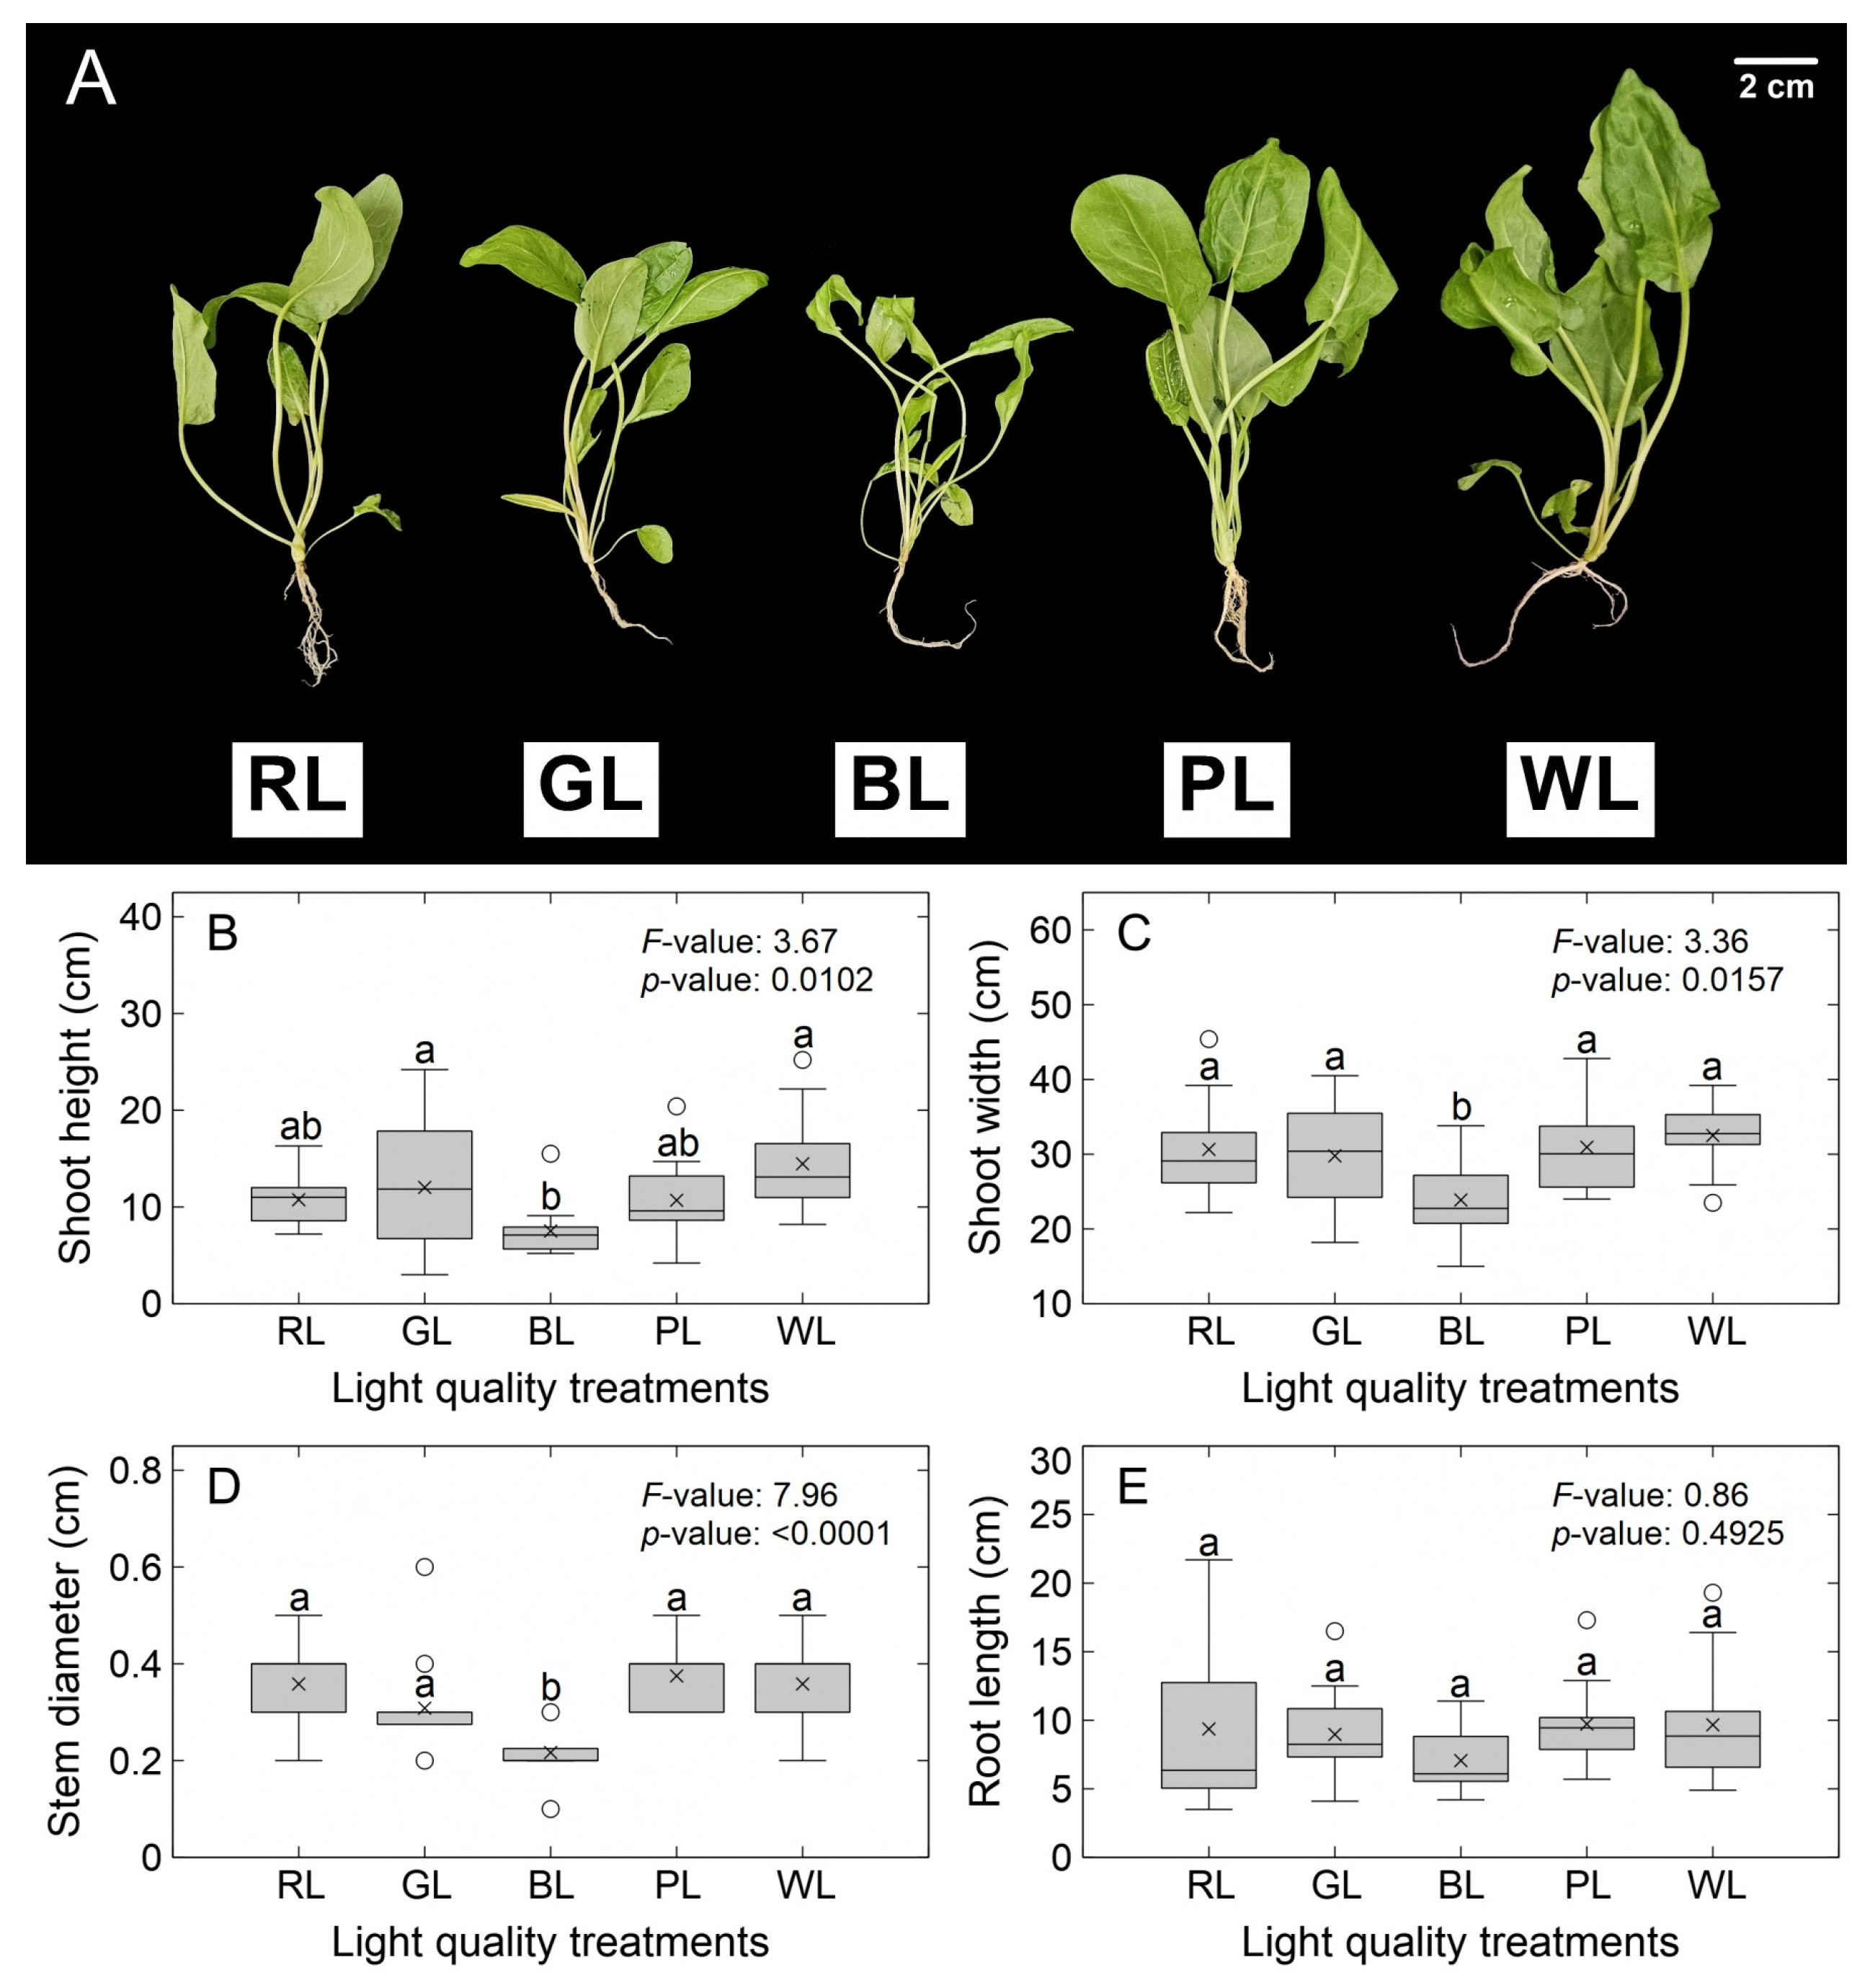
Representative images of sorrel plants after six weeks of LED light-quality treatments are shown in Figure 2. In terms of plant size, SH was approximately 60–92% greater in the GL and WL treatments (12.0 and 14.4 cm, respectively) than in the BL treatment (7.5 cm). SW was lowest in the BL treatment, at 23.8 cm, and similarly, SD was also lowest under BL, at 0.21 cm. RtL did not differ significantly among the LED light-quality treatments.
No statistically significant differences were observed in the SQ or SAR (Table 1). Ground coverage was greater in all treatments other than BL, ranging from 738 to 843 cm2, whereas the BL treatment showed the lowest value at 472 cm2.

3.2. Leaf Morphological Responses to LED Spectral Conditions

Most leaf-related traits differed significantly among LED light-quality treatments, whereas leaf number was not significantly affected (Table 2). Leaf length was greatest in the WL treatment, at 10.9 cm, although it did not differ significantly from that in the RL treatment (9.9 cm). A similar pattern was observed for leaf width; WL produced the greatest mean leaf width (5.7 cm), but this value was not significantly different from that observed under RL (5.3 cm).
Leaf area followed a pattern similar to that of leaf length and width, with the BL treatment showing the smallest leaf area at 17.6 cm2. Leaf thickness was greatest in the PL and WL treatments, both at 0.30 mm, whereas the BL treatment showed the lowest value at 0.20 mm. Petiole length was relatively long in the GL and PL treatments, at 15.2 and 15.6 cm, respectively, whereas it was shortest under RL, at 11.1 cm.

3.3. Biomass Accumulation and RMC

Biomass accumulation differed among the LED light-quality treatments (Table 3). Shoot fresh weight was lowest in the BL treatment, at 2781 mg, whereas the WL treatment reached 9413 mg, representing an approximately 238% increase relative to BL. Root fresh weight was relatively high in the RL, PL, and WL treatments, ranging from 175 to 215 mg, whereas the BL treatment showed a markedly lower value of 51 mg, corresponding to an approximately 71–76% reduction compared with those treatments. SDW was greatest in the WL treatment, at 505 mg, although it did not differ significantly from that in the PL treatment (387 mg). RDW showed the highest mean value in the PL treatment, at 25.5 mg, whereas the BL treatment had a relatively low value of 6.2 mg.
RMC was highest in the PL treatment, at 95.0%, and did not differ significantly from that in the BL treatment (94.7%). In contrast, the RL, GL, and WL treatments showed significantly lower values than PL, ranging from 94.4 to 94.6%.

3.4. Leaf Pigment-Related Traits and Color Characteristics

Chlorophyll content (SPAD units) and CIELAB color coordinates differed among the LED light-quality treatments (Table 4). SPAD units were lowest in the BL treatment, at 18.9. In all other treatments, SPAD units ranged from 25.4 to 28.3, representing an approximately 34–50% increase relative to BL.
The lightness parameter, L*, was highest in the BL treatment, at 50.1, although it did not differ significantly from that in the GL treatment (48.8). In contrast, the PL and WL treatments showed relatively lower L* values, ranging from 46.4 to 47.1, indicating darker leaf coloration. The red–green color parameter, a*, was less negative in the BL treatment (−9.2), whereas the RL treatment showed the lowest value (−10.2). The blue–yellow color parameter, b*, was highest in the BL treatment, at 29.5, indicating a relatively stronger yellow component, whereas the PL and WL treatments showed lower b* values, ranging from 23.8 to 24.4.

3.5. Plant Quality Indices and Resource Allocation

Plant quality indices varied among LED light-quality treatments (Table 5). The S/R was highest in the GL treatment at 30.6, while the PL treatment exhibited a relatively low value of 17.7. Compactness showed relatively high mean values in the GL, PL, and WL treatments, ranging from 35.6 to 39.5, although these values did not differ significantly from that in the RL treatment (30.9). DQI, used here as an integrated index of biomass accumulation and structural balance, showed the highest mean value in the PL treatment at 9.4; however, this value did not differ significantly from those observed in the RL and WL treatments (7.0 and 8.4, respectively).
Regarding resource allocation, the THI, which reflects the degree of shoot-oriented allocation, was relatively high in the GL and WL treatments at 45.2 and 44.2, respectively, compared with the PL treatment, which showed the lowest mean value (20.0). The RIR, reflecting root allocation, did not differ significantly among treatments.

3.6. Vegetation Indices Derived from Spectral Reflectance

Remote sensing vegetation indices varied among the LED light-quality treatments (Table 6). Leaf-level NDVI, a reflectance-based indicator related to leaf greenness and optical status, showed relatively high values in the PL and WL treatments, at 0.610 and 0.612, respectively. PRI, used to assess photochemical status, was lowest in the BL treatment, at 0.020, while the other treatments exhibited relatively higher values ranging from 0.024 to 0.025.
MCARI, which is associated with chlorophyll absorption and reflectance characteristics, showed relatively high mean values in the GL and BL treatments, ranging from 0.288 to 0.295; however, these values did not differ significantly from that in the RL treatment (0.273). SIPI, a reflectance-based proxy for the carotenoid-to-chlorophyll ratio, showed relatively high mean values in the PL and WL treatments, at 0.670 and 0.667, respectively; these values were not significantly different from those observed in the RL and GL treatments (0.650 and 0.645, respectively). ARI1, a reflectance-based proxy for anthocyanin-related variation, did not differ significantly among treatments. CRI1, a reflectance-based proxy for carotenoid-related variation, showed the highest mean value in the WL treatment at 3.95, although it did not differ significantly from that in the PL treatment (3.84).

3.7. Chlorophyll a Fluorescence Responses

Chlorophyll a fluorescence parameters varied among LED light-quality treatments (Table 7). The RL treatment showed the numerically highest mean values of Fo, Fj, Fi, and Fm, at 9100, 24,581, 41,977, and 51,169, respectively.
The maximum quantum yield of PSII (Fv/Fm) was high in the RL and WL treatments, recorded at 0.822 and 0.819, respectively, and did not differ significantly from that in the PL treatment (0.816). The PIABS was highest in the WL treatment, at 4.00, representing an approximately 36% increase compared with the BL treatment, which exhibited the lowest mean value (2.94).

3.8. PCA of Integrated Growth, Structural, and Physiological Responses

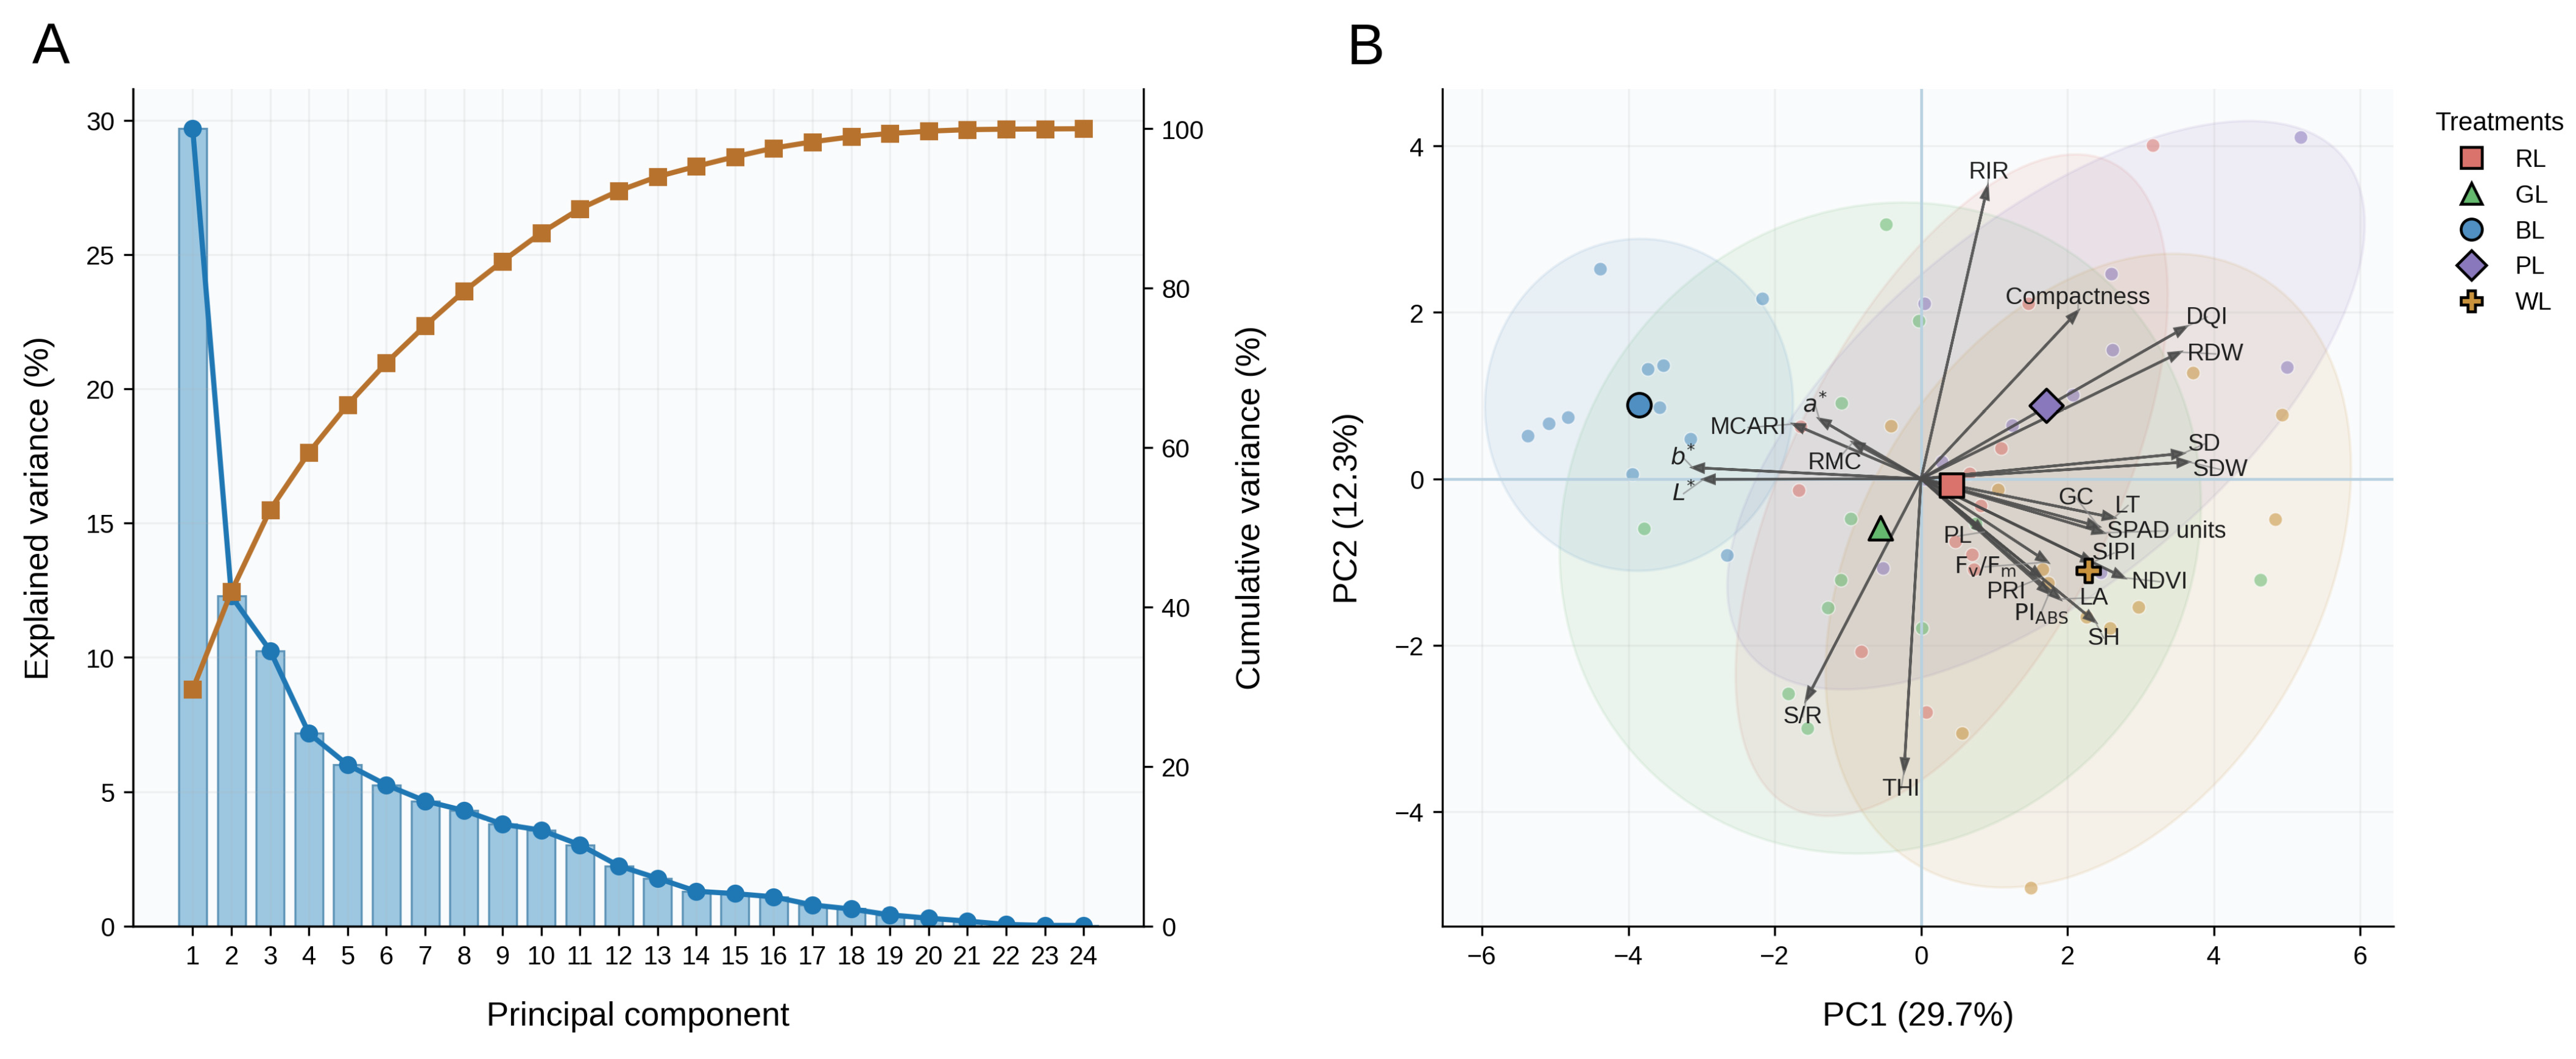
PCA was used to examine the multivariate distribution of morphological traits, biomass components, and physiological responses of sorrel under different LED light-quality treatments. PC1 and PC2 explained 29.7% and 12.3% of the total variance, respectively, with a cumulative explanatory power of 42.0% for the first two components (Figure 3). On the positive side of PC1, SDW, DQI, SD, RDW, NDVI, leaf thickness, SPAD units, and ground coverage were positioned, whereas b*, L*, MCARI, S/R, and a* were located on the negative side. Accordingly, PC1 was interpreted as a major axis reflecting overall biomass accumulation, structural quality, and leaf color.
The positive side of PC2 was characterized primarily by positive loadings for RIR, compactness, and DQI, whereas the negative side was characterized more strongly by THI and S/R. SH, leaf area, PIABS, and NDVI were also positioned on the negative side of PC2, although their loadings were smaller than those of THI and S/R. Therefore, PC2 may be interpreted as an axis representing relative differences in shoot bias, structural stability, and the balance of resource allocation rather than absolute growth itself. With respect to treatment score distribution, the BL treatment was clearly located on the negative side of PC1, whereas the WL and PL treatments were positioned on the positive side of PC1. In particular, the WL treatment was distributed in a direction associated with growth- and leaf color-related variables, whereas the PL treatment showed an orientation associated with DQI, compactness, and RDW. When considered together with its low S/R and THI values, PL can be interpreted as a treatment in which root biomass accumulation and structural balance were relatively maintained, rather than one that excessively promoted shoot growth alone. Therefore, the response to PL is better characterized as a less shoot-biased growth pattern associated with root biomass and structural-quality indices rather than with superior shoot productivity. However, since RIR did not differ significantly among treatments, it should be interpreted only as a supplementary trend when discussing the resource allocation characteristics of PL. In contrast, the GL and RL treatments were distributed at intermediate positions.
The loading results for the remaining components, PC3–PC5, are presented in Table 8. PC3 explained 10.3% of the total variance. PRI, NDVI, SIPI, RMC, and leaf thickness showed positive loadings on PC3, whereas SH, Fv/Fm, SDW, PIABS, and SD showed negative loadings. PC4 explained 7.2% of the variance and was characterized by strong positive loadings for Fv/Fm and PIABS, while b*, SH, L*, a*, and SIPI showed negative loadings. PC5 accounted for 6.0% of the variance, with PIABS, PRI, SIPI, Fv/Fm, and MCARI primarily contributing in the positive direction, and SPAD units, leaf thickness, petiole length, and RMC contributing mainly in the negative direction. The cumulative explanatory power of PC1–PC5 was approximately 65.5%, indicating that the first five principal components accounted for a substantial portion of the considerable multivariate variation in sorrel responses to light quality.

3.9. Correlation-Based Analysis of Treatment-Associated and Intervariable Relationships

3.9.1. Treatment–Variable Correlation Patterns Across LED Light-Quality Treatments

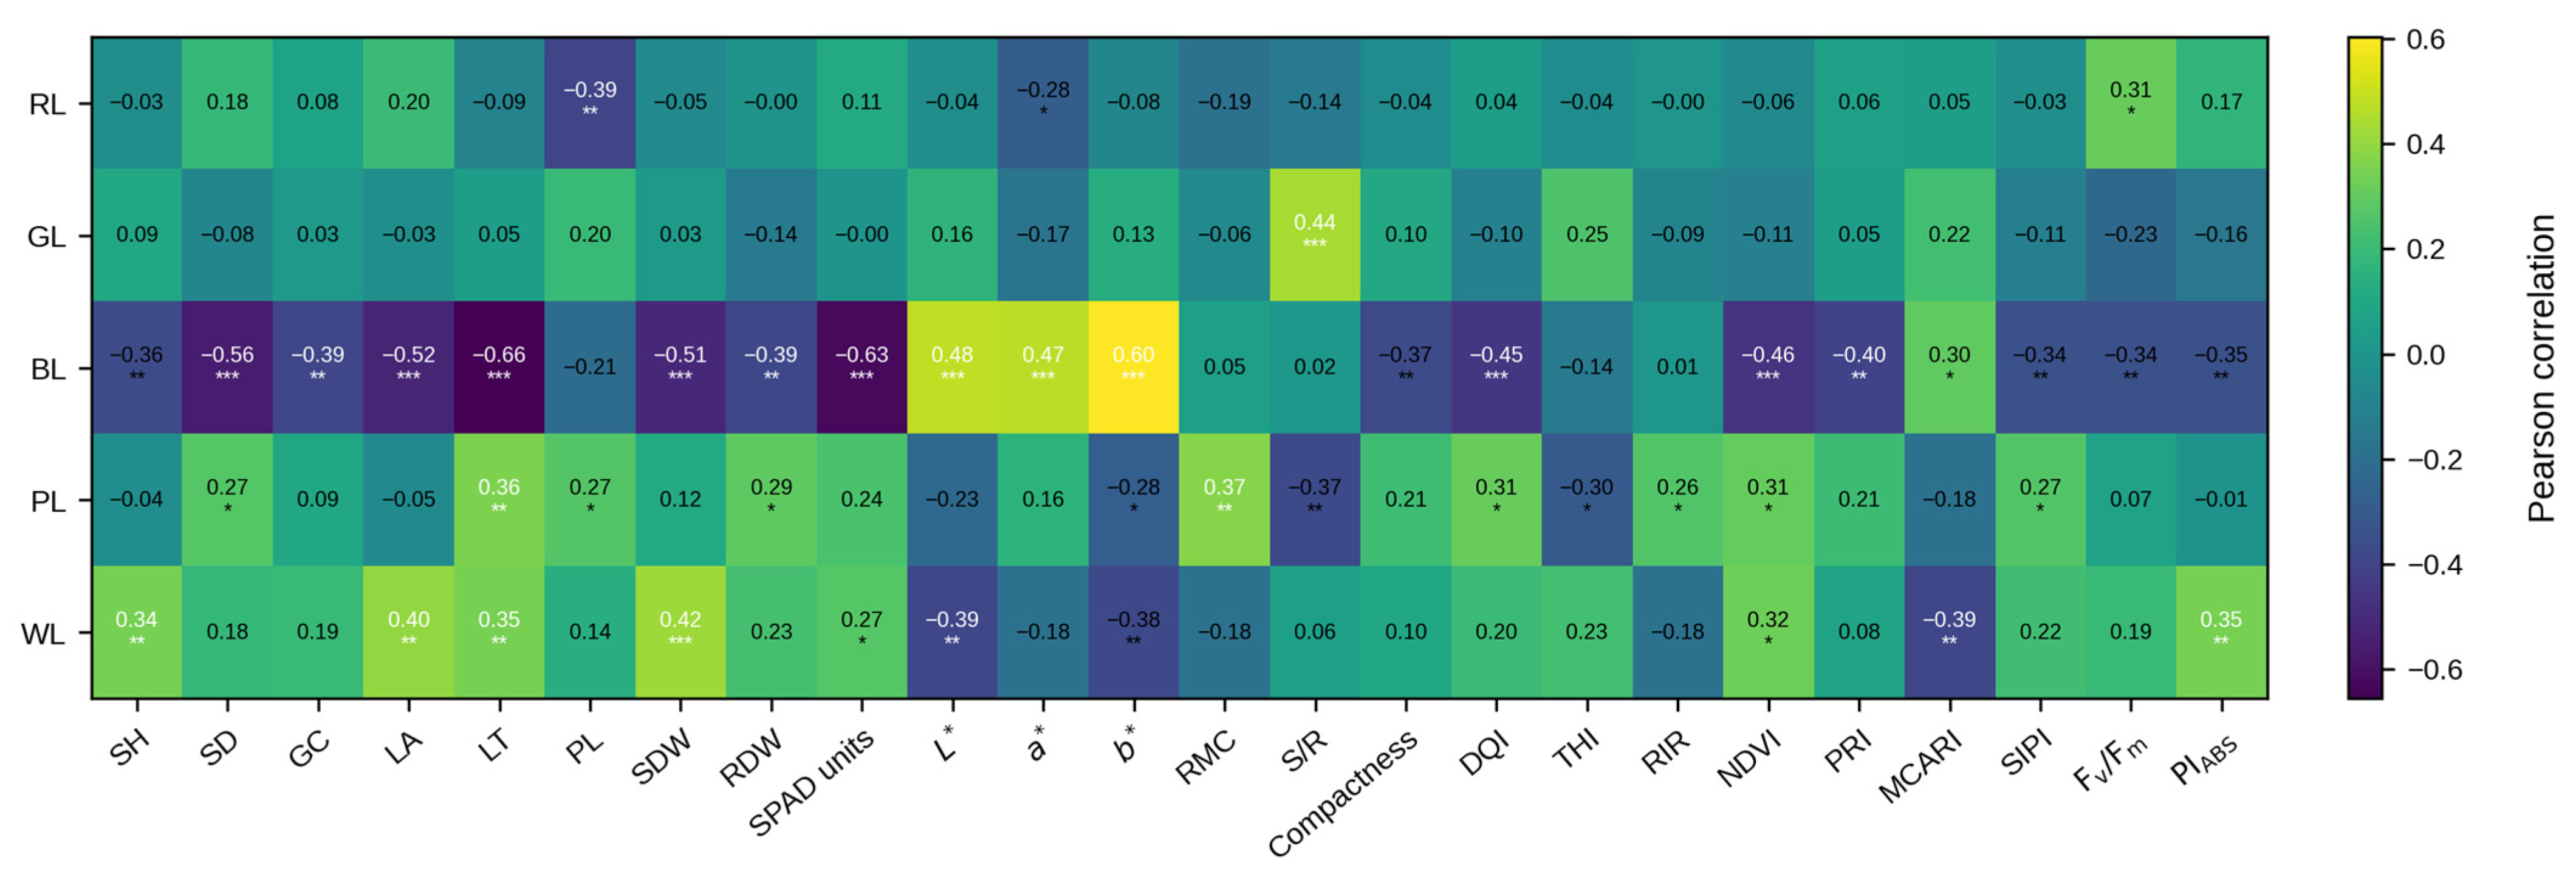
Exploratory point-biserial associations between each one-versus-rest treatment code and the measured traits summarized the direction and magnitude of treatment contrasts (Figure 4). The BL treatment was negatively correlated with SD, ground coverage, leaf area, leaf thickness, SDW, RDW, SPAD units, NDVI, Fv/Fm, and PIABS, whereas it was positively correlated with L*, a*, and b*. These patterns indicate that BL was associated with lower overall growth, lower SPAD units, diminished photochemical performance, and brighter and more yellowish leaf coloration.
In contrast, the WL treatment was positively correlated with SH, leaf area, leaf thickness, SDW, RDW, NDVI, and PIABS, while it was negatively correlated with L*, b*, and MCARI. This pattern distinguished WL as a treatment associated with favorable overall growth and optical quality formation. The PL treatment exhibited positive correlations with leaf thickness, RDW, RMC, DQI, NDVI, and PRI, but a negative correlation with S/R, indicating characteristics related to structural quality and a more balanced resource allocation pattern.

3.9.2. Variable–Variable Correlation Patterns Among Morphological Traits, Structural Quality, and Physiological Parameters

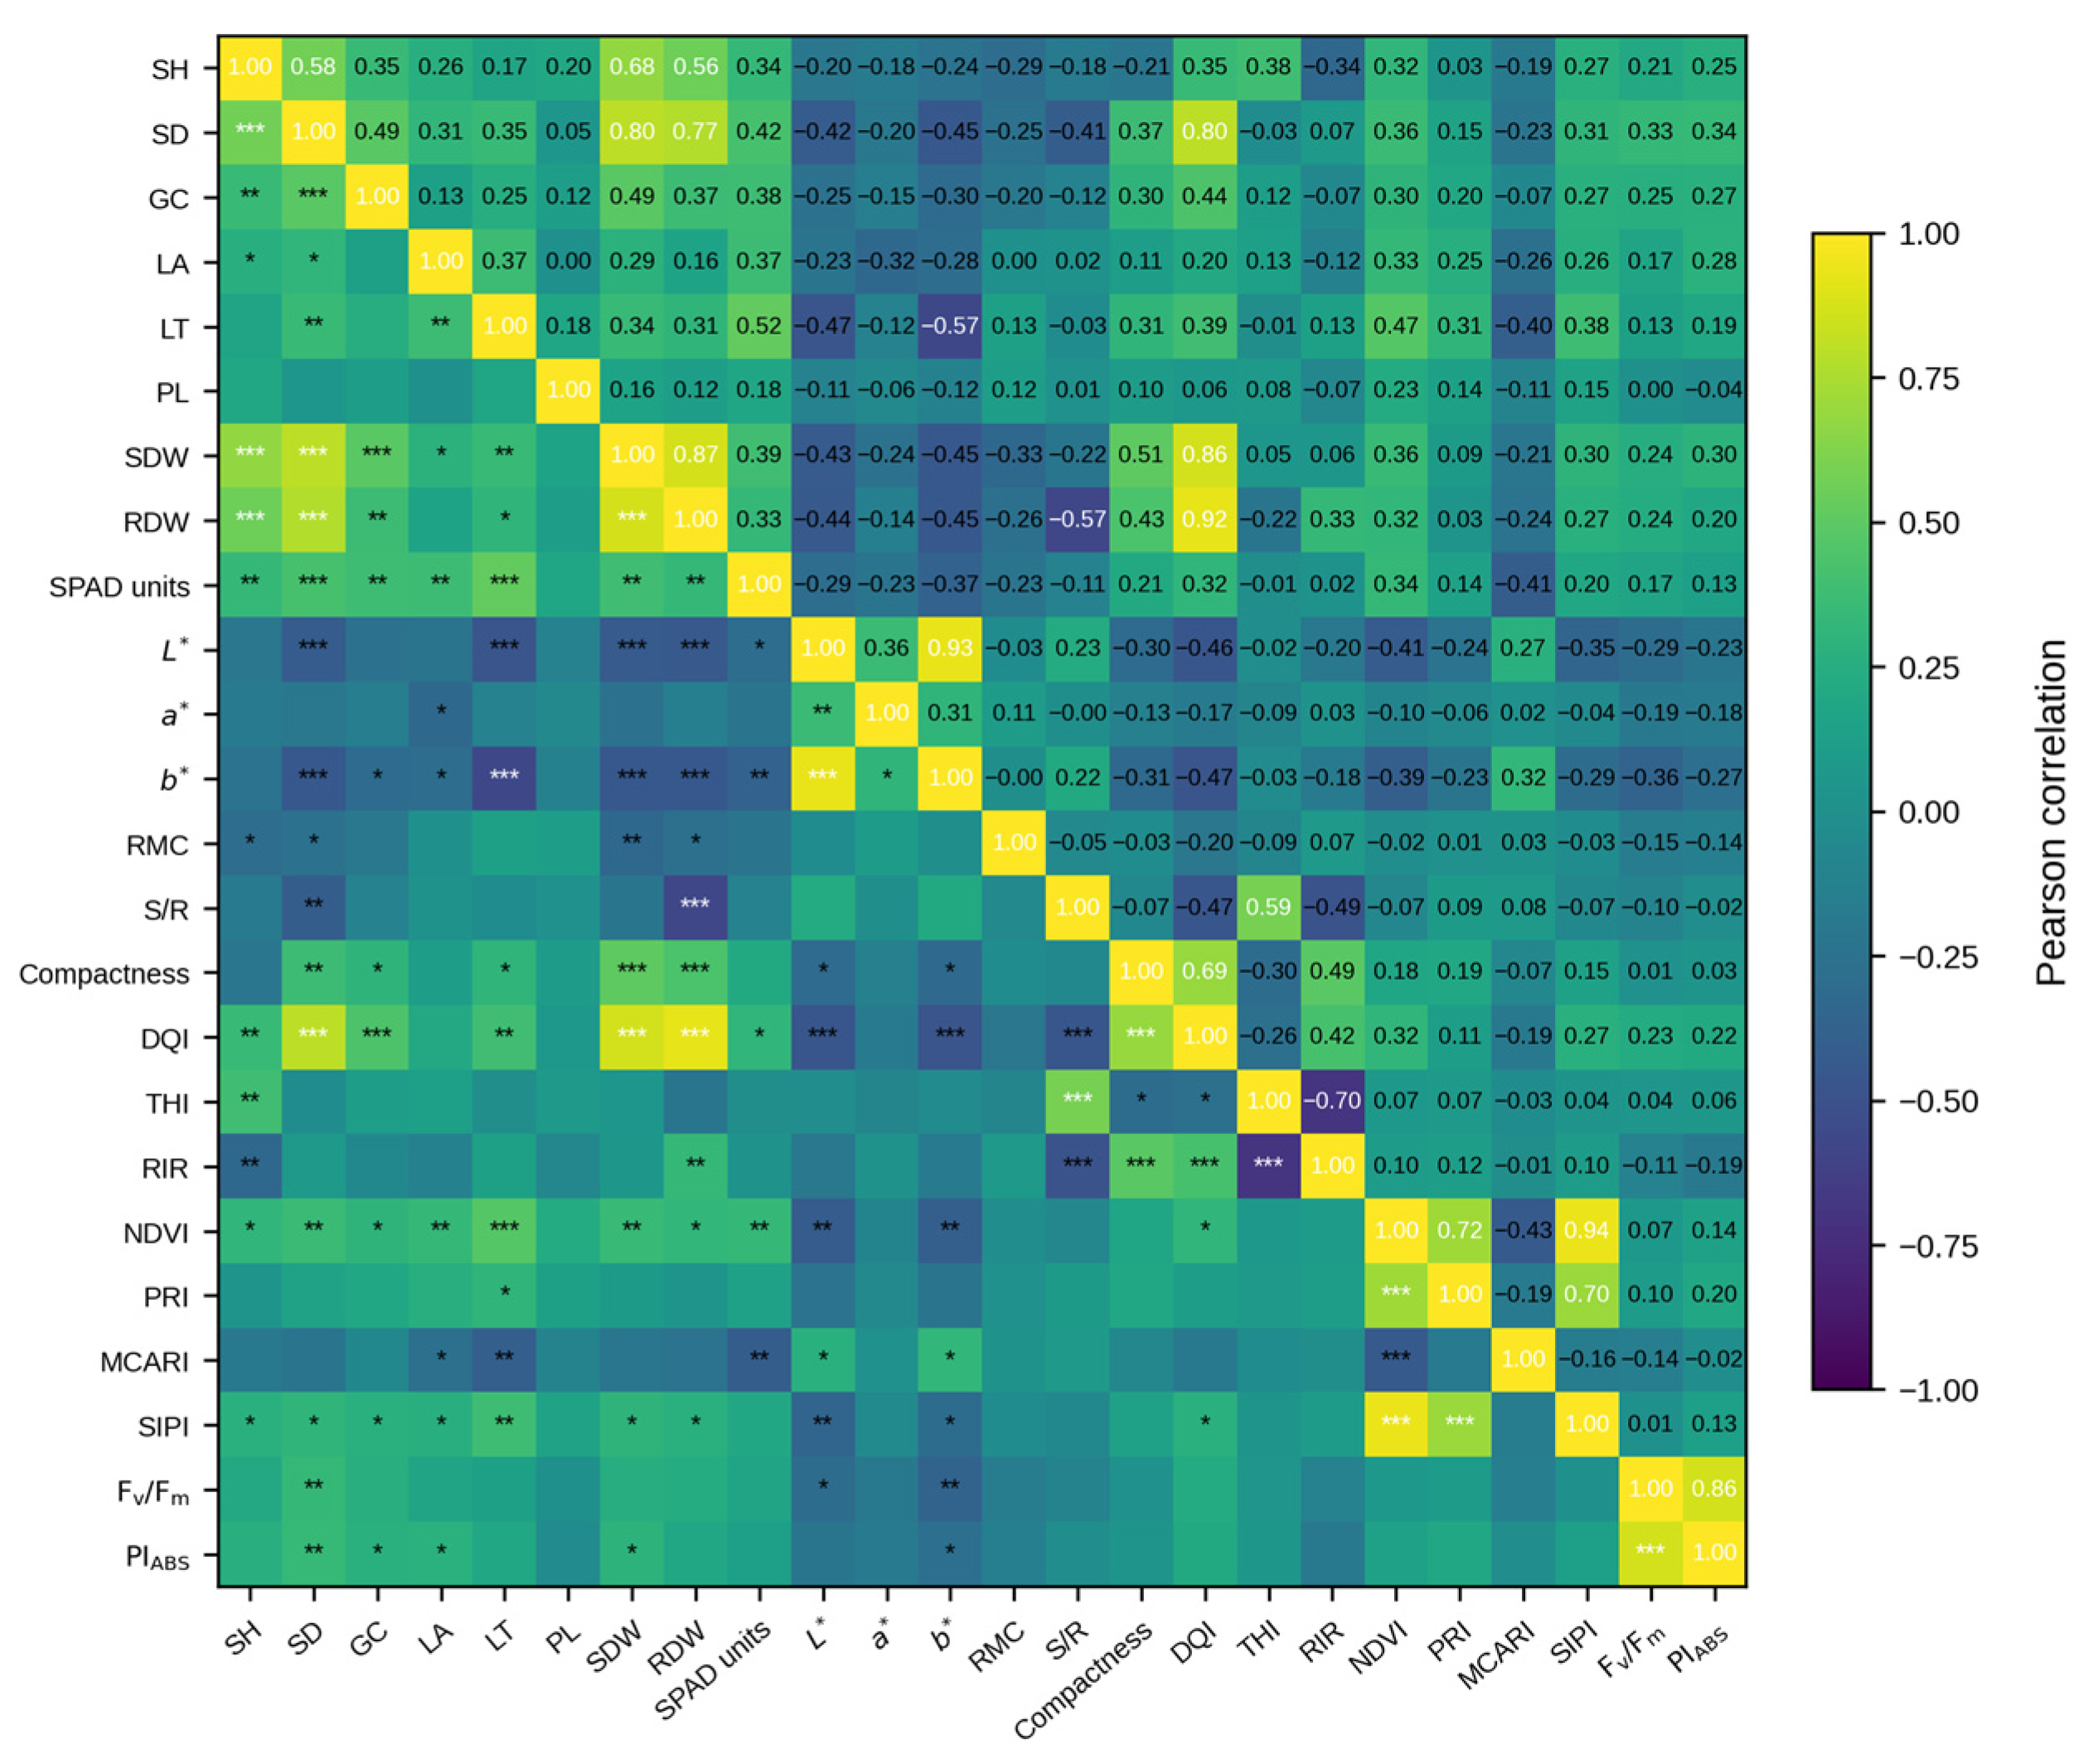
Pearson correlation analysis among traits showed that growth- and structural quality-related variables formed a strong positive correlation structure (Figure 5). In particular, SDW was strongly and positively correlated with RDW and DQI (r = 0.87 and 0.86, respectively), while RDW was also very strongly and positively correlated with DQI (r = 0.92). Additionally, SD was strongly and positively correlated with DQI (r = 0.80), indicating that biomass accumulation, root development, and overall structural quality were closely linked.
Clear positive correlations were also observed among vegetation indices. NDVI was positively correlated with PRI and SIPI (r = 0.72 and 0.94, respectively), and PRI was positively correlated with SIPI (r = 0.70). By contrast, L* was negatively correlated with SDW, RDW, DQI, and SPAD units (r = −0.43, −0.44, −0.46, and −0.29, respectively), and b* showed similar negative correlations with these variables (r = −0.45, −0.45, −0.47, and −0.37, respectively). These relationships indicate that plants with greater growth and chlorophyll-related traits tended to have relatively lower lightness and yellowness. In addition, Fv/Fm and PIABS showed a strong positive correlation (r = 0.86), indicating that these two indices varied in the same direction under the tested conditions.

4. Discussion

4.1. Growth and Shoot–Root Allocation Responses

LED spectra induced distinct growth and allocation responses in sorrel: WL favored shoot productivity, PL showed a less shoot-biased structural pattern, and BL reduced most growth-related trait values.
From a more detailed perspective, the most notable aspect of the morphological growth responses of sorrel was the overall growth restriction observed under BL. This treatment led to reductions in SH, SW, SD, and ground coverage. Additionally, leaf length, width, area, and thickness were generally lower than those observed under the other treatments.
In general, blue wavelengths are known to regulate stomatal movement, chlorophyll formation, photomorphogenesis, and leaf structural development through cryptochrome- and phototropin-mediated pathways [15]. Blue light is also a relatively high-energy region of the visible spectrum [41], and when supplied to plants in small amounts or at an appropriate proportion, it can contribute to stomatal opening, chloroplast development, chlorophyll accumulation, and photomorphogenic regulation [15,42]. However, when blue light is provided as the sole light source or at an excessively high proportion, it may suppress shoot elongation and leaf expansion or limit biomass accumulation [43,44].
However, in the present study, BL alone did not effectively promote leaf expansion or biomass accumulation. This suggests that while blue light can act as an essential signal for specific physiological responses, its capacity to support biomass production may be limited when used as the only light source, depending on the crop species and growth stage [32]. Notably, sorrel showed a relatively sensitive growth-inhibitory response to BL under the present experimental conditions. Therefore, in sorrel cultivation, BL may be better utilized in combination with other wavelengths rather than as the primary light source alone.
Previous studies have shown that the proportion of blue wavelengths plays a central role in regulating growth, morphology, photosynthetic efficiency, and quality traits in leafy vegetables, and that the optimal proportion can differ among parameters even under the same total photosynthetic photon flux density [45,46]. Future studies on sorrel should therefore extend beyond treatments using BL alone and examine more refined conditions, including red–blue ratios, blue-light fractions, timing of blue-light exposure, and combinations with PL or WL, to identify the balance point between biomass production and pigment-related or photochemical responses.
The favorable shoot-growth response under WL may reflect the complementary photosynthetic and signaling functions of its blue, green, and red spectral components. Previous studies have similarly shown that broad-spectrum white LEDs can support leaf development, canopy expansion, and biomass accumulation under controlled-environment conditions [18,20]. Because WL simultaneously supplied red, blue, and green photons, it may have provided a more balanced combination of photosynthetic energy and photomorphogenic signals than the monochromatic treatments [12,18]. The blue component may have contributed to cryptochrome- and phototropin-related regulation of leaf development and stomatal responses, whereas monochromatic red or blue conditions may disproportionately activate particular photoreceptor and physiological pathways [15,21,47,48]. Broad-spectrum WL may therefore coordinate multiple spectral signals involved in leaf expansion, chlorophyll-related responses, and photochemical function [49,50]. In addition, green photons can penetrate more deeply into mesophyll tissues and lower canopy layers, potentially improving within-leaf and within-canopy light distribution [16,51,52]. In the present study, WL showed the highest mean PIABS, although it did not differ significantly from RL or PL, and also exhibited high shoot biomass, leaf area, and NDVI. These concurrent responses suggest favorable coordination between shoot development and PSII photochemical performance under WL. However, because stomatal conductance, gas-exchange rates, and photoreceptor activity were not directly measured, these mechanistic interpretations should be treated with caution.
The PL treatment exhibited a response characterized more by structural allocation than by maximum shoot productivity. Previous studies have reported species-dependent responses to PL: productivity was improved relative to WL in lettuce (Lactuca sativa) [34]; growth and flowering were enhanced in a cultivar of Viola [25]; and PL produced an intermediate multivariate response between monochromatic and white LEDs in Korean white dandelion (Taraxacum coreanum) [10]. These contrasting findings indicate that the effects of composite red–blue–far-red spectra vary among plant species and among the traits evaluated.
In the present study, PL showed the highest mean RDW and DQI and relatively low S/R and THI. Because DQI integrates total dry weight, shoot height, stem diameter, and S/R, these combined responses indicate a less shoot-biased structural pattern rather than superior shoot productivity alone [23]. The red and blue components of PL may have supported photosynthetic and pigment-related processes [12], whereas its far-red component may have modified phyB–PIF signaling by altering the red-to-far-red environment [13,14]. Such responses depend on spectral ratio, species, and developmental stage. Moreover, RtL did not differ significantly among treatments; therefore, the PL response should be interpreted as a less shoot-biased biomass-allocation pattern rather than as evidence that far-red directly promoted root elongation.
The GL treatment showed longer petioles and relatively high S/R and THI, indicating a more shoot-oriented architecture. Greater shoot expansion under GL than under BL has also been reported in Coleus cultivars and basil [21,53]. Although green photons are absorbed less strongly near the leaf surface [54], their deeper penetration and involvement in shade-avoidance-like responses may partly explain petiole elongation [16,55,56]. However, the relatively modest RDW and DQI and the high S/R and THI indicate that this shoot expansion was not accompanied by a proportional improvement in root biomass or shoot–root structural balance.

4.2. Leaf Color and Reflectance-Based Responses

Chlorophyll meters used to measure SPAD units are widely applied as rapid and non-destructive tools for estimating chlorophyll status [57]. The CIELAB color space, which quantifies changes in lightness, the green–red axis, and the blue–yellow axis using L*, a*, and b* coordinates, is also useful for objectively evaluating visual quality [58]. In the present study, leaf color and pigment-related responses clearly differed among light-quality treatments. SPAD units were lowest under BL, whereas relatively high values were observed under RL, GL, PL, and WL. In addition, the BL treatment showed higher L* and b* values and a less negative a* value, indicating that the leaves became relatively brighter and more yellowish, with lower greenness. The lower SPAD units and reduced leaf thickness under BL may have contributed to these color changes by reducing chlorophyll-related light absorption and altering internal light scattering. In contrast, the PL and WL treatments showed high SPAD units and lower L* and b* values, suggesting a darker green leaf appearance. Because leaf color in leafy vegetables is closely associated with consumer preference and marketability [6,7], these results suggest that WL and PL may positively affect the external quality of sorrel. In particular, since sorrel has potential use as a fresh leafy vegetable, both growth performance and the intensity and uniformity of leaf color should be considered important quality factors when determining light-quality conditions.
The reflectance-based vegetation indices provided complementary information on growth, leaf color, and pigment-related optical responses. NDVI has been widely recognized as a representative index for evaluating photosynthetically active biomass or canopy vigor, relying on the differences between red and near-infrared reflectance [59]. In this study, leaf-level NDVI was relatively high under PL and WL and low under BL, indicating treatment-dependent differences in red and near-infrared reflectance associated with leaf greenness and optical status. PRI has been proposed as an index that reflects photochemical status related to photosynthetic radiation-use efficiency [28,60]. In the present study, PRI was also low under BL, indicating that the photochemical energy-use status may have been relatively unfavorable under BL conditions. In contrast, MCARI showed high values under GL and BL, displaying a pattern opposite to that of SPAD units. Although MCARI has been proposed as an index sensitive to chlorophyll absorption characteristics [61], spectral reflectance-based indices can also be influenced by species, leaf structure, developmental stage, and leaf optical properties [29].
SIPI is commonly used as a reflectance-based proxy for relative variation in the carotenoid-to-chlorophyll ratio while reducing the influence of leaf or canopy structure [62,63]. In this study, SIPI values were higher under PL and WL, indicating differences in reflectance patterns associated with relative carotenoid-to-chlorophyll status compared with the other spectral conditions. CRI1 showed the highest mean value under WL and did not differ significantly from that under PL, indicating stronger carotenoid-associated reflectance signals under these two treatments. In contrast, ARI1 did not differ significantly among treatments, indicating that LED light quality did not exert a clear effect on anthocyanin-related reflectance responses in sorrel under the present experimental conditions. Taken together, these results suggest that the light-quality responses of sorrel cannot be sufficiently explained by a single chlorophyll-related indicator, such as SPAD units. Rather, NDVI, PRI, MCARI, SIPI, and CRI1 provided complementary information on plant vigor, photochemical status, chlorophyll-associated absorption, and pigment-related optical variation.

4.3. Chlorophyll Fluorescence Responses

Light-quality-dependent physiological differences were also evident in the chlorophyll fluorescence responses. The RL treatment generally showed higher absolute fluorescence values for Fo, Fj, Fi, and Fm. However, the absolute values of each phase of the O-J-I-P chlorophyll fluorescence transient can be influenced by chlorophyll content, leaf thickness, light absorption properties, the oxidation–reduction state of PSII reaction centers, and the optical characteristics of the measured leaf area. Therefore, increases in absolute fluorescence values should not be directly interpreted as improvements in photochemical performance. Accordingly, chlorophyll fluorescence results should be interpreted by considering not only the absolute Fo–Fm values but also functional indices such as Fv/Fm and PIABS.
In this study, Fv/Fm was high in the RL and WL treatments and did not differ significantly from that in the PL treatment, whereas PIABS showed the highest mean value in the WL treatment. Fv/Fm is a representative indicator of the maximum photochemical efficiency of PSII and is generally known to range from 0.78 to 0.84 in non-stressed leaves of higher plants [20,21,64], with values of around 0.83 often reported in highly vigorous species or leaves [27,65]. By contrast, PIABS is a JIP-test-based parameter that integrates reaction-center activity, excitation-energy trapping, and electron transport on an absorption basis [66,67]. The highest mean PIABS under WL therefore supports the interpretation that WL provided favorable integrated PSII performance, although its value did not differ significantly from those under RL and PL. Thus, the fluorescence results support, but do not independently prove, the proposed coordination between broad-spectrum irradiation, shoot development, and photochemical performance. Indeed, PIABS has been reported as a sensitive indicator of stress responses, even when Fv/Fm changes only slightly [68,69,70]. Conversely, the BL treatment showed lower Fv/Fm and PIABS values, suggesting that sole blue light may have been relatively unfavorable for the development or maintenance of the photosynthetic apparatus and photochemical performance in sorrel. However, since the Fv/Fm value under BL was 0.805, it is challenging to interpret this response as indicating severe photoinhibition. Instead, it should be viewed as a relative decline in PSII function or a limitation in photochemical performance under the current experimental conditions.
Although P680 and P700 denote the primary electron-donor chlorophyll pairs in the reaction centers of PSII and photosystem I (PSI), respectively, red and blue photons are not absorbed exclusively by either photosystem. Imbalanced excitation of PSII and PSI may induce STN7-dependent state transitions that redistribute excitation energy between the two photosystems [71]. However, because the O-J-I-P parameters measured in this study primarily reflect PSII photochemistry, the lower Fv/Fm and PIABS under BL indicate comparatively reduced PSII performance but do not demonstrate preferential PSI excitation or STN7 activation.

4.4. Integrated Multivariate Interpretation and Practical Implications

The PCA results indicate that the light-quality responses of sorrel were multivariate, involving morphological traits, biomass components, and physiological responses, rather than being explainable by a single growth parameter. In particular, PC1 showed a consistent directional association with variables such as SDW, RDW, DQI, SD, NDVI, SPAD units, and ground coverage. Therefore, PC1 can be interpreted as an axis that simultaneously reflects the overall growth status and structural quality of sorrel. The clear positioning of the BL treatment on the negative side of PC1 indicates that the adverse response to sole blue light was not limited to a specific trait but was reflected broadly in biomass accumulation, canopy expansion, leaf color, and quality-related indicators.
In contrast, WL was positioned on the positive side of PC1, showing an integrated response profile associated with greater shoot growth, leaf development, and favorable optical characteristics. The PL treatment was also positioned on the positive side of PC1 and showed directional associations with RDW, DQI, and compactness. Together with its relatively low S/R and THI, this pattern was consistent with less shoot-biased structural allocation. This indicates that PL may be more effectively interpreted in terms of structural quality and resource allocation balance than in terms of absolute shoot productivity alone.
PC3–PC5 provided complementary insights into the detailed physiological and optical differences that PC1 and PC2 did not fully explain. Similar multivariate approaches have been used to integrate morphological, physiological, and quality-related traits in lettuce and red pitaya (Hylocereus costaricensis), where PCA helped distinguish treatment-dependent response patterns involving growth, pigment accumulation, productivity, and quality traits [72,73]. PC3 was associated with optical vigor and pigment-related responses, mainly through PRI, NDVI, and SIPI, while PC4 reflected variations in PSII photochemical performance, mainly indicated by Fv/Fm and PIABS. PC5 appeared to represent the relative separation among chlorophyll fluorescence parameters, vegetation indices, and SPAD units. Therefore, the light-quality responses of sorrel in this study could not be adequately interpreted through a single axis of biomass or leaf color; instead, they were more clearly explained when structural quality, leaf color, vegetation indices, and chlorophyll fluorescence parameters were considered together. However, because the multivariate analysis incorporated both original variables and plant quality indices derived from them, the proximity of DQI, compactness, S/R, THI, and RIR to growth parameters and biomass components should be viewed not as entirely independent biological evidence, but as different summaries of related structural information.
The treatment–variable correlation analysis showed that sorrel exhibited distinct association patterns among growth, leaf color, optical traits, and photochemical performance, depending on the LED light-quality treatment. In particular, the BL treatment was negatively correlated with growth and photochemical indicators but positively correlated with L*, a*, and b*, indicating that growth restriction and changes in leaf color occurred simultaneously under sole blue light. This finding is consistent with the low biomass accumulation, low SPAD units, and relatively brighter leaf coloration observed in the BL treatment.
In contrast, the WL treatment showed positive associations with SDW, leaf area, leaf thickness, NDVI, and PIABS, indicating that WL was associated with greater overall growth and relatively favorable photochemical performance in sorrel. The PL treatment was associated with RDW, DQI, and RMC, while exhibiting an opposite directional relationship with S/R. This association pattern suggests that PL was more closely associated with higher mean values of RDW and DQI and a lower S/R, indicating a less shoot-biased biomass-allocation pattern.
The variable–variable correlation analysis further supported these interpretations. The strong positive correlations among SDW, RDW, and DQI indicate that biomass accumulation and structural quality are closely linked in sorrel. In addition, the positive correlations among NDVI, PRI, and SIPI suggest that these vegetation indices reflect plant vigor, pigment status, and optical responses in a complementary manner. Meanwhile, the negative correlations of CIELAB color values, particularly L* and b*, with growth- and plant quality-related variables suggest that leaf-color variation does not merely represent external appearance but may also be inversely associated with physiological and structural quality.
Taken together, the LED light-quality responses of sorrel can be interpreted in three major directions. First, WL was associated with leaf expansion, shoot biomass accumulation, and higher NDVI and PIABS, suggesting that this treatment was favorable for enhancing productivity. Second, although PL did not maximize shoot growth to the same extent as WL, its higher mean DQI, compactness, and RDW, together with lower S/R and THI, were consistent with improved structural balance and a less shoot-biased biomass-allocation pattern. Third, BL generally restricted growth, altered leaf-color characteristics, and reduced photochemical performance under the present experimental conditions. These interpretations were broadly consistent with the PCA and exploratory correlation analyses. In the PCA, the BL treatment was positioned opposite to growth- and quality-related variables, whereas the WL and PL treatments exhibited distinct response patterns on the positive side of PC1. In the treatment–trait correlation analysis, WL was relatively closely associated with variables related to shoot growth and photochemical performance, whereas PL was more closely associated with variables related to structural quality and resource allocation. Therefore, in controlled-environment cultivation of sorrel, light quality should be selected according to the specific production objectives.
In summary, WL may be advantageous when rapid growth and yield are the primary objectives, whereas PL may have greater potential when structural balance is prioritized. In contrast, sole BL may have limited suitability for early growth and quality formation in sorrel and should therefore be used with caution. This study focused on the early growth stage over a six-week cultivation period and did not directly analyze actual chlorophyll and carotenoid contents, photosynthetic rate, stomatal conductance, sugar content, organic acids, or functional metabolites. Therefore, future studies should evaluate postharvest quality, sensory-related traits, antioxidant compounds, and the accumulation of medicinal and functional constituents in response to light quality. In addition, more detailed investigations of WL and PL mixing ratios, far-red proportions, light intensity, and photoperiod conditions may enable more precise light-environment design that simultaneously considers productivity and structural quality in sorrel.

5. Conclusions

This study demonstrated that sorrel responses to LED spectra involved distinct patterns of shoot productivity, structural allocation, and physiological performance. Under the tested conditions, WL showed the strongest overall shoot-growth response and favorable NDVI and PIABS values, whereas PL exhibited a less shoot-biased structural pattern characterized by higher mean RDW and DQI and lower S/R and THI. BL generally restricted early growth and was associated with lower SPAD units and reduced photochemical performance. Accordingly, WL appears more suitable for yield-oriented production, whereas PL may be considered when shoot–root structural balance is prioritized. Further studies should directly evaluate gas exchange, pigment composition, bioactive compounds, and postharvest quality under different spectral ratios and photon flux densities.

Author Contributions

Conceptualization, H.Y., S.L. (Samuel Lee), S.Y.N. and J.H.L.; methodology, H.Y., S.L. (Samuel Lee), S.Y.N. and J.H.L.; software, J.H.L.; validation, J.H.L.; formal analysis, H.Y., S.L. (Samuel Lee), Y.J.C., Y.S., J.G.L., S.Y., J.M.S., S.L. (Sunyoung Lee), G.K., E.B.C., S.Y.N. and J.H.L.; investigation, Y.J.C., Y.S., J.G.L., S.Y., J.M.S., S.L. (Sunyoung Lee), G.K. and J.H.L.; resources, S.Y.N. and J.H.L.; data curation, H.Y., S.L. (Samuel Lee), S.Y.N. and J.H.L.; writing—original draft preparation, H.Y., S.L. (Samuel Lee), Y.J.C., Y.S., J.G.L., S.Y., J.M.S., S.L. (Sunyoung Lee), G.K., E.B.C., S.Y.N. and J.H.L.; writing—review and editing, H.Y., S.L. (Samuel Lee), S.Y.N. and J.H.L.; visualization, J.H.L.; supervision, S.Y.N. and J.H.L.; project administration, S.Y.N. and J.H.L. All authors have read and agreed to the published version of the manuscript.

Funding

This research received no external funding.

Data Availability Statement

The original contributions of this study are included in this article. Further inquiries can be directed to the corresponding author.

Acknowledgments

This study was conducted in part through the laboratory internship program and undergraduate research training activities of the Department of Environmental Design & Horticulture, Sahmyook University.

Conflicts of Interest

The authors declare no conflicts of interest.

Abbreviations

The following abbreviations are used in this manuscript:
ANOVAAnalysis of variance
ARI1Anthocyanin reflectance index 1
BLBlue light (treatment)
CEHControlled environment horticulture
CIELABCommission Internationale de l’Éclairage Lab
CRDCompletely randomized design
CRI1Carotenoid reflectance index 1
DMRTDuncan’s multiple range test
DQIDickson quality index
GCGround coverage
GLGreen light (treatment)
LALeaf area
LEDLight-emitting diode
LLLeaf length
LTLeaf thickness
LWLeaf width
MCARIModified chlorophyll absorption ratio index
NDVINormalized difference vegetation index
PCAPrincipal component analysis
PFALPlant factory with artificial lighting
PIABSPerformance index on an absorption basis
PLPurple-phyto light (treatment)
PRIPhotochemical reflectance index
PSIPhotosystem I
PSIIPhotosystem II
QYQuantum yield
RDWRoot dry weight
RIRRoot investment ratio
RLRed light (treatment)
RMCRelative moisture content
RtLRoot length
SARShoot aspect ratio
SCISpecular component included
SDStem diameter
SDWShoot dry weight
SHShoot height
SIPIStructure-insensitive pigment index
SPADSoil plant analysis development
SQSturdiness quotient
SWShoot width
TDWTotal dry weight
TFWTotal fresh weight
THITop-heavy index
WLWhite light (treatment)

References

  1. Korpelainen, H.; Pietiläinen, M. Sorrel (Rumex acetosa L.): Not only a weed but a promising vegetable and medicinal plant. Bot. Rev. 2020, 86, 234–246. [Google Scholar] [CrossRef]
  2. Ceccanti, C.; Landi, M.; Incrocci, L.; Pardossi, A.; Guidi, L. Suitability of hydroponically-grown Rumex acetosa L. as fresh-cut produce. Horticulturae 2020, 6, 4. [Google Scholar] [CrossRef]
  3. Bello, O.M.; Fasinu, P.S.; Bello, O.E.; Ogbesejana, A.B.; Adetunji, C.O.; Dada, A.O.; Ibitoye, O.S.; Aloko, S.; Oguntoye, O.S. Wild vegetable Rumex acetosa Linn.: Its ethnobotany, pharmacology and phytochemistry–A review. S. Afr. J. Bot. 2019, 125, 149–160. [Google Scholar] [CrossRef]
  4. Jeong, D.; Irfan, M.; Lee, D.H.; Hong, S.B.; Oh, J.W.; Rhee, M.H. Rumex acetosa modulates platelet function and inhibits thrombus formation in rats. BMC Complement. Med. Ther. 2020, 20, 98. [Google Scholar] [CrossRef] [PubMed]
  5. Bae, J.Y.; Lee, Y.S.; Han, S.Y.; Jeong, E.J.; Lee, M.K.; Kong, J.Y.; Lee, D.H.; Cho, K.J.; Lee, H.S.; Ahn, M.J. A comparison between water and ethanol extracts of Rumex acetosa for protective effects on gastric ulcers in mice. Biomol. Ther. 2012, 20, 425–430. [Google Scholar] [CrossRef] [PubMed]
  6. Barrett, D.M.; Beaulieu, J.C.; Shewfelt, R. Color, flavor, texture, and nutritional quality of fresh-cut fruits and vegetables: Desirable levels, instrumental and sensory measurement, and the effects of processing. Crit. Rev. Food Sci. Nutr. 2010, 50, 369–389. [Google Scholar] [CrossRef] [PubMed]
  7. Paakki, M.; Sandell, M.; Hopia, A. Visual attractiveness depends on colorfulness and color contrasts in mixed salads. Food Qual. Prefer. 2019, 76, 81–90. [Google Scholar] [CrossRef]
  8. Massa, G.D.; Kim, H.H.; Wheeler, R.M.; Mitchell, C.A. Plant productivity in response to LED lighting. HortScience 2008, 43, 1951–1956. [Google Scholar] [CrossRef]
  9. Ouzounis, T.; Rosenqvist, E.; Ottosen, C.O. Spectral effects of artificial light on plant physiology and secondary metabolism: A review. HortScience 2015, 50, 1128–1135. [Google Scholar] [CrossRef]
  10. Ryu, K.O.; Shin, E.J.; Lee, S.; Lee, J.G.; Cha, E.B.; Sunwoo, Y.; Hong, J.; Yoon, J.E.; Lee, J.H.; Nam, S.Y. Spectral modulation of morphophysiological responses and plant quality in Korean white dandelion (Taraxacum coreanum Nakai) under controlled environmental conditions. Agriculture 2026, 16, 830. [Google Scholar] [CrossRef]
  11. Kami, C.; Lorrain, S.; Hornitschek, P.; Fankhauser, C. Light-regulated plant growth and development. Curr. Top. Dev. Biol. 2010, 91, 29–66. [Google Scholar] [CrossRef] [PubMed]
  12. Paradiso, R.; Proietti, S. Light-quality manipulation to control plant growth and photomorphogenesis in greenhouse horticulture: The state of the art and the opportunities of modern LED systems. J. Plant Growth Regul. 2022, 41, 742–780. [Google Scholar] [CrossRef]
  13. Casal, J.J. Photoreceptor signaling networks in plant responses to shade. Annu. Rev. Plant Biol. 2013, 64, 403–427. [Google Scholar] [CrossRef] [PubMed]
  14. Bae, G.; Choi, G. Decoding of light signals by plant phytochromes and their interacting proteins. Annu. Rev. Plant Biol. 2008, 59, 281–311. [Google Scholar] [CrossRef] [PubMed]
  15. Christie, J.M.; Blackwood, L.; Petersen, J.; Sullivan, S. Plant flavoprotein photoreceptors. Plant Cell Physiol. 2015, 56, 401–413. [Google Scholar] [CrossRef] [PubMed]
  16. Terashima, I.; Fujita, T.; Inoue, T.; Chow, W.S.; Oguchi, R. Green light drives leaf photosynthesis more efficiently than red light in strong white light: Revisiting the enigmatic question of why leaves are green. Plant Cell Physiol. 2009, 50, 684–697. [Google Scholar] [CrossRef] [PubMed]
  17. Snowden, M.C.; Cope, K.R.; Bugbee, B. Sensitivity of seven diverse species to blue and green light: Interactions with photon flux. PLoS ONE 2016, 11, e0163121. [Google Scholar] [CrossRef] [PubMed]
  18. Lee, J.H.; Sunwoo, Y.; Shin, E.J.; Nam, S.Y. Integrated assessment of growth performance, biomass accumulation, and physiological responses in kale (Brassica oleracea L.) during early growth under different LED spectral conditions in a PFAL. Horticulturae 2026, 12, 498. [Google Scholar] [CrossRef]
  19. Simkin, A.J.; Kapoor, L.; Doss, C.G.P.; Hofmann, T.A.; Lawson, T.; Ramamoorthy, S. The role of photosynthesis related pigments in light harvesting, photoprotection and enhancement of photosynthetic yield in planta. Photosynth. Res. 2022, 152, 23–42. [Google Scholar] [CrossRef] [PubMed]
  20. Shin, E.J.; Lee, J.H.; Nam, S.Y. Evaluation of growth, vegetation indices, and photosynthesis of Cichorium intybus L. seedlings as affected by LED light qualities in a closed nursery facility. Hortic. Sci. Technol. 2024, 42, 350–364. [Google Scholar] [CrossRef]
  21. Park, B.G.; Lee, J.H.; Shin, E.J.; Kim, E.A.; Nam, S.Y. Light quality influence on growth performance and physiological activity of Coleus cultivars. Int. J. Plant Biol. 2024, 15, 807–826. [Google Scholar] [CrossRef]
  22. Lee, J.H.; Kim, E.A.; Sunwoo, Y.; Cha, E.B.; Joo, S.; Lee, S.; Lee, J.G.; Nam, S.Y. Light spectrum strategies to optimize yield and physiological performance of Korean thistle (Cirsium setidens (Dunn) Nakai) in a closed-type plant production system. J. People Plants Environ. 2025, 28, 799–823. [Google Scholar] [CrossRef]
  23. Lee, J.H.; Lee, S.; Cha, E.B.; Joo, S.; Lee, J.G.; Nam, S.Y. Plant quality indices: Review, development, and conceptual framework. Hortic. Sci. Technol. 2026, 44, 1–31. [Google Scholar] [CrossRef]
  24. He, J.; Qin, L.; Chow, W.S. Impacts of LED spectral quality on leafy vegetables: Productivity closely linked to photosynthetic performance or associated with leaf traits? Int. J. Agric. Biol. Eng. 2019, 12, 16–25. [Google Scholar] [CrossRef]
  25. Jang, I.T.; Lee, J.H.; Shin, E.J.; Nam, S.Y. Evaluation of growth, flowering, and chlorophyll fluorescence responses of Viola cornuta cv. Penny Red Wing according to spectral power distributions. J. People Plants Environ. 2023, 26, 335–349. [Google Scholar] [CrossRef]
  26. Maxwell, K.; Johnson, G.N. Chlorophyll fluorescence—A practical guide. J. Exp. Bot. 2000, 51, 659–668. [Google Scholar] [CrossRef]
  27. Murchie, E.H.; Lawson, T. Chlorophyll fluorescence analysis: A guide to good practice and understanding some new applications. J. Exp. Bot. 2013, 64, 3983–3998. [Google Scholar] [CrossRef] [PubMed]
  28. Peñuelas, J.; Garbulsky, M.F.; Filella, I. Photochemical reflectance index (PRI) and remote sensing of plant CO2 uptake. New Phytol. 2011, 191, 596–599. [Google Scholar] [CrossRef] [PubMed]
  29. Sims, D.A.; Gamon, J.A. Relationships between leaf pigment content and spectral reflectance across a wide range of species, leaf structures and developmental stages. Remote Sens. Environ. 2002, 81, 337–354. [Google Scholar] [CrossRef]
  30. Gitelson, A.A.; Gritz, Y.; Merzlyak, M.N. Relationships between leaf chlorophyll content and spectral reflectance and algorithms for non-destructive chlorophyll assessment in higher plant leaves. J. Plant Physiol. 2003, 160, 271–282. [Google Scholar] [CrossRef] [PubMed]
  31. Morrow, R.C. LED lighting in horticulture. HortScience 2008, 43, 1947–1950. [Google Scholar] [CrossRef]
  32. Ma, Y.; Xu, A.; Cheng, Z.M.M. Effects of light emitting diode lights on plant growth, development and traits a meta-analysis. Hortic. Plant J. 2021, 7, 552–564. [Google Scholar] [CrossRef]
  33. Ouzounis, T.; Fretté, X.; Ottosen, C.O.; Rosenqvist, E. Spectral effects of LEDs on chlorophyll fluorescence and pigmentation in Phalaenopsis ‘Vivien’ and ‘Purple Star’. Physiol. Plant. 2015, 154, 314–327. [Google Scholar] [CrossRef] [PubMed]
  34. Vereshchagin, M.; Pashkovskiy, P.; Tarakanov, I. Adding phyto-LED spectrum to white-LED light increases the productivity of lettuce plants. Horticulturae 2024, 10, 795. [Google Scholar] [CrossRef]
  35. Cope, K.R.; Bugbee, B. Spectral effects of three types of white light-emitting diodes on plant growth and development: Absolute versus relative amounts of blue light. HortScience 2013, 48, 504–509. [Google Scholar] [CrossRef]
  36. Kim, S.R.; Park, K.; Lee, H.; Jang, B.K.; Cho, J.S. Anti-inflammatory activity of sprouts according to hydro-priming and light quality levels in Vigna vexillata (L.) A. Rich. var. tsusimensis Matsum. seeds. Hortic. Sci. Technol. 2026, 44, 132–145. [Google Scholar] [CrossRef]
  37. Lee, J.H.; Nam, S.Y. Growth and photosynthetic responses of Taraxacum coreanum Nakai seedlings according to the shading levels. Hortic. Sci. Technol. 2024, 42, 214–224. [Google Scholar] [CrossRef]
  38. Lee, J.H. Effects of Light Quality, Temperature, Photoperiod, and GA3 Concentration on Growth of Six Phedimus Species. Ph.D. Thesis, Sahmyook University, Seoul, Republic of Korea, December 2023. [Google Scholar]
  39. Photon Systems Instruments (PSI). Instruction Guide. PolyPen RP 410, Photon Systems Instruments Website. Available online: https://handheld.psi.cz/documents/PolyPen_RP410_manual_2023_04.pdf (accessed on 1 April 2026).
  40. Photon Systems Instruments (PSI). FluorPen FP 110. PAR-FluorPen FP 110. Monitoring Pen MP 100. Manual and User Guide, Photon Systems Instruments Website. Available online: https://handheld.psi.cz/documents/FluorPen_Monitoring_Manual_02_2021.pdf (accessed on 7 March 2026).
  41. Lin, C. Plant blue-light receptors. Trends Plant Sci. 2000, 5, 337–342. [Google Scholar] [CrossRef] [PubMed]
  42. Hogewoning, S.W.; Trouwborst, G.; Maljaars, H.; Poorter, H.; van Ieperen, W.; Harbinson, J. Blue light dose–responses of leaf photosynthesis, morphology, and chemical composition of Cucumis sativus grown under different combinations of red and blue light. J. Exp. Bot. 2010, 61, 3107–3117. [Google Scholar] [CrossRef] [PubMed]
  43. Pennisi, G.; Orsini, F.; Blasioli, S.; Cellini, A.; Crepaldi, A.; Braschi, I.; Spinelli, F.; Nicola, S.; Fernandez, J.A.; Stanghellini, C.; et al. Resource use efficiency of indoor lettuce (Lactuca sativa L.) cultivation as affected by red: Blue ratio provided by LED lighting. Sci. Rep. 2019, 9, 14127. [Google Scholar] [CrossRef] [PubMed]
  44. Folta, K.M.; Spalding, E.P. Unexpected roles for cryptochrome 2 and phototropin revealed by high-resolution analysis of blue light-mediated hypocotyl growth inhibition. Plant J. 2001, 26, 471–478. [Google Scholar] [CrossRef] [PubMed]
  45. Chen, X.L.; Li, Y.L.; Wang, L.C.; Guo, W.Z. Red and blue wavelengths affect the morphology, energy use efficiency and nutritional content of lettuce (Lactuca sativa L.). Sci. Rep. 2021, 11, 8374. [Google Scholar] [CrossRef] [PubMed]
  46. Luo, S.; Zou, J.; Shi, M.; Lin, S.; Wang, D.; Liu, W.; Shen, Y.; Ding, X.; Jiang, Y. Effects of red-blue light spectrum on growth, yield, and photo-synthetic efficiency of lettuce in a uniformly illumination environment. Plant Soil Environ. 2024, 70, 305–316. [Google Scholar] [CrossRef]
  47. Izzo, L.G.; Mele, B.H.; Vitale, L.; Vitale, E.; Arena, C. The role of monochromatic red and blue light in tomato early photomorphogenesis and photosynthetic traits. Environ. Exp. Bot. 2020, 179, 104195. [Google Scholar] [CrossRef]
  48. Landi, M.; Zivcak, M.; Sytar, O.; Brestic, M.; Allakhverdiev, S.I. Plasticity of photosynthetic processes and the accumulation of secondary metabolites in plants in response to monochromatic light environments: A review. Biochim. Biophys. Acta Bioenerg. 2020, 1861, 148131. [Google Scholar] [CrossRef] [PubMed]
  49. Meng, Q.; Runkle, E.S. Blue photons from broad-spectrum LEDs control growth, morphology, and coloration of indoor hydroponic red-leaf lettuce. Plants 2023, 12, 1127. [Google Scholar] [CrossRef] [PubMed]
  50. Kim, Y.J.; Yeom, M.S.; Lee, J.Y.; Park, S.Y.; Oh, M.M. Biomass and ginsenosides content of ginseng sprouts upon exposure to several white LED lights with different correlated color temperatures and color rendering indexes. Hortic. Sci. Technol. 2024, 42, 167–179. [Google Scholar] [CrossRef]
  51. Sun, J.; Nishio, J.N.; Vogelmann, T.C. Green light drives CO2 fixation deep within leaves. Plant Cell Physiol. 1998, 39, 1020–1026. [Google Scholar] [CrossRef]
  52. Smith, H.L.; McAusland, L.; Murchie, E.H. Don’t ignore the green light: Exploring diverse roles in plant processes. J. Exp. Bot. 2017, 68, 2099–2110. [Google Scholar] [CrossRef] [PubMed]
  53. Schenkels, L.; Saeys, W.; Lauwers, A.; De Proft, M.P. Green light induces shade avoidance to alter plant morphology and increases biomass production in Ocimum basilicum L. Sci. Hortic. 2020, 261, 109002. [Google Scholar] [CrossRef]
  54. Kume, A. Importance of the green color, absorption gradient, and spectral absorption of chloroplasts for the radiative energy balance of leaves. J. Plant Res. 2017, 130, 501–514. [Google Scholar] [CrossRef] [PubMed]
  55. Liu, J.; van Iersel, M.W. Photosynthetic physiology of blue, green, and red light: Light intensity effects and underlying mechanisms. Front. Plant Sci. 2021, 12, 619987. [Google Scholar] [CrossRef] [PubMed]
  56. Zhang, T.; Maruhnich, S.A.; Folta, K.M. Green light induces shade avoidance symptoms. Plant Physiol. 2011, 157, 1528–1536. [Google Scholar] [CrossRef] [PubMed]
  57. Ling, Q.; Huang, W.; Jarvis, P. Use of a SPAD-502 meter to measure leaf chlorophyll concentration in Arabidopsis thaliana. Photosynth. Res. 2011, 107, 209–214. [Google Scholar] [CrossRef] [PubMed]
  58. Kim, J.; Kang, S.W.; Pak, C.H.; Kim, M.S. Changes in leaf variegation and coloration of English ivy and polka dot plant under various indoor light intensities. HortTechnology 2012, 22, 49–55. [Google Scholar] [CrossRef]
  59. Tucker, C.J. Red and photographic infrared linear combinations for monitoring vegetation. Remote Sens. Environ. 1979, 8, 127–150. [Google Scholar] [CrossRef]
  60. Gamon, J.; Serrano, L.; Surfus, J.S. The photochemical reflectance index: An optical indicator of photosynthetic radiation use efficiency across species, functional types, and nutrient levels. Oecologia 1997, 112, 492–501. [Google Scholar] [CrossRef] [PubMed]
  61. Daughtry, C.S.; Walthall, C.L.; Kim, M.S.; De Colstoun, E.B.; McMurtrey, J.E., III. Estimating corn leaf chlorophyll concentration from leaf and canopy reflectance. Remote Sens. Environ. 2000, 74, 229–239. [Google Scholar] [CrossRef]
  62. Peñuelas, J.; Baret, F.; Filella, I. Semi-empirical indices to assess carotenoids/chlorophyll a ratio from leaf spectral reflectance. Photosynthetica 1995, 31, 221–230. [Google Scholar]
  63. Blackburn, G.A. Relationships between spectral reflectance and pigment concentrations in stacks of deciduous broadleaves. Remote Sens. Environ. 1999, 70, 224–237. [Google Scholar] [CrossRef]
  64. Asadi-Sanam, S.; Pirdashti, H.; Hashempour, A.; Zavareh, M.; Nematzadeh, G.A.; Yaghoubian, Y. The physiological and biochemical responses of eastern purple coneflower to freezing stress. Russ. J. Plant Physiol. 2015, 62, 515–523. [Google Scholar] [CrossRef]
  65. Björkman, O.; Demmig, B. Photon yield of O2 evolution and chlorophyll fluorescence characteristics at 77 K among vascular plants of diverse origins. Planta 1987, 170, 489–504. [Google Scholar] [CrossRef] [PubMed]
  66. Stirbet, A.; Lazár, D.; Kromdijk, J.; Govindjee. Chlorophyll a fluorescence induction: Can just a one-second measurement be used to quantify abiotic stress responses? Photosynthetica 2018, 56, 86–104. [Google Scholar] [CrossRef]
  67. Tsimilli-Michael, M. Revisiting JIP-test: An educative review on concepts, assumptions, approximations, definitions and terminology. Photosynthetica 2020, 58, 275–292. [Google Scholar] [CrossRef]
  68. Oukarroum, A.; El Madidi, S.; Strasser, R.J. Differential heat sensitivity index in barley cultivars (Hordeum vulgare L.) monitored by chlorophyll a fluorescence OKJIP. Plant Physiol. Biochem. 2016, 105, 102–108. [Google Scholar] [CrossRef] [PubMed]
  69. Živčák, M.; Brestič, M.; Olšovská, K.; Slamka, P. Performance index as a sensitive indicator of water stress in Triticum aestivum L. Plant Soil Environ. 2008, 54, 133–139. [Google Scholar] [CrossRef]
  70. Wang, X.Y.; Xu, X.M.; Cui, J. The importance of blue light for leaf area expansion, development of photosynthetic apparatus, and chloroplast ultrastructure of Cucumis sativus grown under weak light. Photosynthetica 2015, 53, 213–222. [Google Scholar] [CrossRef]
  71. Bellafiore, S.; Barneche, F.; Peltier, G.; Rochaix, J.D. State transitions and light adaptation require chloroplast thylakoid protein kinase STN7. Nature 2005, 433, 892–895. [Google Scholar] [CrossRef] [PubMed]
  72. Impallomeni, G.; Lupini, A.; Sorgonà, A.; Gattuso, A.; Barreca, F. The qualitative and quantitative relationship of lettuce grown in soilless systems in a Mediterranean greenhouse. Int. J. Plant Biol. 2025, 16, 94. [Google Scholar] [CrossRef]
  73. Tomaz de Oliveira, M.M.; Tel-Zur, N.; Albano-Machado, F.G.; Melo Penha, D.; Pinho, M.M.; Bezerra, M.; de Miranda, M.R.A.; Moura, C.F.H.; Alves, R.E.; Natale, W.; et al. Shade as an agro-technique to improve gas exchange, productivity, bioactive potential, and antioxidant activity of fruits of Hylocereus costaricensis. Int. J. Plant Biol. 2025, 16, 128. [Google Scholar] [CrossRef]
Figure 1. Spectral power distributions of light-emitting diodes (LEDs) used in this study: (A) red light; (B) green light; (C) blue light; (D) purple-phyto light; and (E) white light (6500 K). B: blue; G: green; R: red; and FR: far-red.
Ijpb 17 00064 g001
Figure 2. Representative plant morphology and plant-size parameters of six-week-old sorrel (Rumex acetosa L.) under different LED light-quality treatments. (A) Representative whole plants grown under red (RL), green (GL), blue (BL), purple-phyto (PL), and 6500 K white light (WL) LED treatments. (B) Shoot height, (C) shoot width, (D) stem diameter, and (E) root length. Boxes indicate the interquartile range, horizontal lines indicate medians, crosses indicate means, whiskers extend to values within 1.5 × interquartile range (IQR), and open circles indicate outliers. Different lowercase letters indicate significant differences among treatments according to Duncan’s multiple range test (DMRT) at p < 0.05 (n = 12). Scale bar = 2 cm.
Ijpb 17 00064 g002
Figure 3. Principal component analysis (PCA) of morphological traits, biomass components, and physiological responses of sorrel (R. acetosa L.) under different LED light-quality treatments. (A) Scree plot showing the explained and cumulative variance of principal components. Blue bars and the blue line with circular markers represent the variance explained by each principal component, whereas the orange line with square markers represents cumulative explained variance. (B) PCA score-loading biplot showing the distribution of LED light-quality treatments and associated trait loadings. Small points represent individual plants, and large symbols represent treatment centroids. The treatment abbreviations identify the treatment centroids, whereas the variable abbreviations identify the trait-loading vectors. Treatment abbreviations: RL: red light; GL: green light; BL: blue light; PL: purple-phyto light; and WL: white light (6500 K). Variable abbreviations: RIR: root investment ratio; DQI: Dickson quality index; RDW: root dry weight; SD: stem diameter; SDW: shoot dry weight; GC: ground coverage; LT: leaf thickness; SIPI: structure-insensitive pigment index; NDVI: normalized difference vegetation index; LA: leaf area; SH: shoot height; PRI: photochemical reflectance index; PL: petiole length; THI: top-heavy index; S/R: shoot-to-root ratio; RMC: relative moisture content; and MCARI: modified chlorophyll absorption ratio index.
Ijpb 17 00064 g003
Figure 4. Treatment–variable correlation heatmap of sorrel (R. acetosa L.) responses to different LED light-quality treatments. The rows (y-axis) represent the LED light-quality treatments, whereas the columns (x-axis) represent the measured variables. Treatment abbreviations: RL: red light; GL: green light; BL: blue light; PL: purple-phyto light; and WL: white light (6500 K). *, **, and *** denote nominal significance at p < 0.05, p < 0.01, and p < 0.001, respectively, and are presented for exploratory screening. Variable abbreviations: SH: shoot height; SD: stem diameter; GC: ground coverage; LA: leaf area; LT: leaf thickness; PL: petiole length; SDW: shoot dry weight; RDW: root dry weight; RMC: relative moisture content; S/R: shoot-to-root ratio; DQI: Dickson quality index; THI: top-heavy index; RIR: root investment ratio; NDVI: normalized difference vegetation index; PRI: photochemical reflectance index; MCARI: modified chlorophyll absorption ratio index; and SIPI: structure-insensitive pigment index.
Ijpb 17 00064 g004
Figure 5. Variable–variable correlation heatmap of morphological traits, biomass components, and physiological responses in sorrel (R. acetosa L.) under different LED light-quality treatments. Both the rows and columns (y- and x-axes, respectively) represent the same set of measured variables. *, **, and *** denote statistically significant correlations at p < 0.05, p < 0.01, and p < 0.001, respectively. Variable abbreviations: SH: shoot height; SD: stem diameter; GC: ground coverage; LA: leaf area; LT: leaf thickness; PL: petiole length; SDW: shoot dry weight; RDW: root dry weight; RMC: relative moisture content; S/R: shoot-to-root ratio; DQI: Dickson quality index; THI: top-heavy index; RIR: root investment ratio; NDVI: normalized difference vegetation index; PRI: photochemical reflectance index; MCARI: modified chlorophyll absorption ratio index; and SIPI: structure-insensitive pigment index.
Ijpb 17 00064 g005
Table 1. Sturdiness quotient (SQ), shoot aspect ratio (SAR), and canopy ground coverage of six-week-old sorrel (R. acetosa L.) under different light-emitting diode (LED) light-quality treatments.
Treatment zSQSARGround Coverage (cm2)
RL31.7 ± 12.6 a y0.358 ± 0.09 a768 ± 351 a
GL38.4 ± 17.0 a0.401 ± 0.18 a738 ± 363 a
BL36.5 ± 15.4 a0.329 ± 0.12 a472 ± 225 b
PL28.8 ± 11.0 a0.370 ± 0.18 a781 ± 335 a
WL40.2 ± 10.0 a0.449 ± 0.15 a843 ± 214 a
F-value1.491.062.68
p-value0.21770.38670.0410
Values are presented as the mean ± standard deviation. z RL, GL, BL, PL, and WL indicate red, green, blue, purple-phyto, and white (6500 K) LED treatments, respectively. y Different lowercase letters within the same column indicate statistically significant differences among treatments based on Duncan’s multiple range test (DMRT) at p < 0.05 (n = 12).
Table 2. Leaf morphological traits of six-week-old sorrel (R. acetosa L.) under different LED light-quality treatments.
Treatment zLeaf Size (cm)Leaf Area
(cm2)
Leaf Thickness
(mm)
Petiole Length
(cm)
Leaf Number
LengthWidth
RL9.9 ± 2.0 ab y5.3 ± 1.3 ab43.2 ± 18.5 ab0.25 ± 0.02 b11.1 ± 3.6 c7.4 ± 1.1 a
GL9.1 ± 1.3 b4.7 ± 1.1 b35.1 ± 13.3 b0.27 ± 0.02 b15.2 ± 2.9 a7.8 ± 1.6 a
BL6.8 ± 1.3 c3.2 ± 0.5 c17.6 ± 5.8 c0.20 ± 0.03 c12.4 ± 1.6 bc6.8 ± 1.2 a
PL8.8 ± 1.7 b4.7 ± 1.2 b34.2 ± 14.9 b0.30 ± 0.03 a15.6 ± 4.1 a8.3 ± 2.5 a
WL10.9 ± 1.8 a5.7 ± 0.9 a50.1 ± 16.1 a0.30 ± 0.03 a14.7 ± 2.3 ab7.5 ± 0.9 a
F-value9.449.858.5316.794.911.37
p-value<0.0001<0.0001<0.0001<0.00010.00190.2551
Values are presented as the mean ± standard deviation. z RL, GL, BL, PL, and WL indicate red, green, blue, purple-phyto, and white (6500 K) LED treatments, respectively. y Different lowercase letters within the same column indicate statistically significant differences among treatments based on DMRT at p < 0.05 (n = 12).
Table 3. Fresh weight, dry weight, and relative moisture content of six-week-old sorrel (R. acetosa L.) under different LED light-quality treatments.
Treatment zFresh Weight (mg)Dry Weight (mg)Relative Moisture Content (%)
ShootRootShootRoot
RL5975 ± 2946 b y175 ± 123 a321 ± 152 b17.1 ± 12.8 abc94.4 ± 0.4 b
GL6551 ± 3105 b137 ± 96 ab353 ± 188 b13.2 ± 11.0 bc94.6 ± 0.6 b
BL2781 ± 1235 c51 ± 36 b141 ± 59 c6.2 ± 3.1 c94.7 ± 0.3 ab
PL8001 ± 3457 ab211 ± 131 a387 ± 199 ab25.5 ± 18.7 a95.0 ± 0.6 a
WL9413 ± 3224 a215 ± 113 a505 ± 180 a23.8 ± 13.5 ab94.4 ± 0.4 b
F-value8.834.897.754.492.82
p-value<0.00010.0019<0.00010.00330.0335
Values are presented as the mean ± standard deviation. z RL, GL, BL, PL, and WL indicate red, green, blue, purple-phyto, and white (6500 K) LED treatments, respectively. y Different lowercase letters within the same column indicate statistically significant differences among treatments based on DMRT at p < 0.05 (n = 12).
Table 4. Chlorophyll content (SPAD units) and Commission Internationale de l’Éclairage Lab (CIELAB) color coordinates of six-week-old sorrel (R. acetosa L.) under different LED light-quality treatments.
Treatment zChlorophyll Content
(SPAD Units)
CIELAB Color Coordinates
L*a*b*
RL26.7 ± 3.9 a y47.9 ± 0.8 bc−10.2 ± 0.4 c25.6 ± 1.3 bc
GL25.4 ± 4.8 a48.8 ± 1.2 ab−10.0 ± 0.2 bc26.8 ± 1.6 b
BL18.9 ± 2.5 b50.1 ± 2.4 a−9.2 ± 1.0 a29.5 ± 2.4 a
PL28.0 ± 3.7 a47.1 ± 1.7 c−9.6 ± 0.4 ab24.4 ± 2.6 c
WL28.3 ± 4.9 a46.4 ± 2.1 c−10.0 ± 0.3 bc23.8 ± 2.4 c
F-value10.358.016.2312.97
p-value<0.0001<0.00010.0003<0.0001
Values are presented as the mean ± standard deviation. z RL, GL, BL, PL, and WL indicate red, green, blue, purple-phyto, and white (6500 K) LED treatments, respectively. y Different lowercase letters within the same column indicate statistically significant differences among treatments based on DMRT at p < 0.05 (n = 12).
Table 5. Plant quality indices, including shoot-to-root ratio (S/R), compactness, Dickson quality index (DQI), top-heavy index (THI), and root investment ratio (RIR), of six-week-old sorrel (R. acetosa L.) under different LED light-quality treatments.
Treatment zConventional Plant Quality IndicesTHIRIR
S/RCompactnessDQI
RL21.4 ± 7.7 bc y30.9 ± 14.1 ab7.0 ± 4.7 ab31.8 ± 15.7 ab0.042 ± 0.03 a
GL30.6 ± 7.2 a35.8 ± 22.9 a5.7 ± 3.5 bc45.2 ± 26.2 a0.037 ± 0.03 a
BL23.9 ± 5.6 b20.0 ± 8.8 b2.6 ± 1.3 c27.2 ± 13.1 ab0.043 ± 0.02 a
PL17.7 ± 5.8 c39.5 ± 19.5 a9.4 ± 5.4 a20.0 ± 9.4 b0.058 ± 0.03 a
WL24.5 ± 8.2 b35.6 ± 8.8 a8.4 ± 3.2 ab44.2 ± 34.3 a0.031 ± 0.02 a
F-value5.472.705.493.001.33
p-value0.00090.03990.00090.02590.2716
Values are presented as the mean ± standard deviation. z RL, GL, BL, PL, and WL indicate red, green, blue, purple-phyto, and white (6500 K) LED treatments, respectively. y Different lowercase letters within the same column indicate statistically significant differences among treatments based on DMRT at p < 0.05 (n = 12).
Table 6. Remote sensing vegetation indices, including normalized difference vegetation index (NDVI), photochemical reflectance index (PRI), modified chlorophyll absorption ratio index (MCARI), structure-insensitive pigment index (SIPI), anthocyanin reflectance index 1 (ARI1), and carotenoid reflectance index 1 (CRI1), of six-week-old sorrel (R. acetosa L.) under different LED light-quality treatments.
Treatment zNDVIPRIMCARISIPIARI1CRI1
RL0.575 ± 0.04 b y0.024 ± 0.003 a0.273 ± 0.01 ab0.650 ± 0.03 ab−0.105 ± 0.03 a3.49 ± 0.7 bc
GL0.571 ± 0.03 b0.024 ± 0.003 a0.288 ± 0.04 a0.645 ± 0.02 ab−0.135 ± 0.07 a3.29 ± 0.3 c
BL0.537 ± 0.04 c0.020 ± 0.003 b0.295 ± 0.05 a0.629 ± 0.03 b−0.131 ± 0.04 a3.34 ± 0.5 c
PL0.610 ± 0.02 a0.025 ± 0.002 a0.253 ± 0.03 bc0.670 ± 0.01 a−0.136 ± 0.05 a3.84 ± 0.3 ab
WL0.612 ± 0.04 a0.024 ± 0.004 a0.235 ± 0.03 c0.667 ± 0.03 a−0.189 ± 0.10 a3.95 ± 0.5 a
F-value7.172.914.843.422.333.77
p-value0.00010.02950.00200.01430.06770.0089
Values are presented as the mean ± standard deviation. z RL, GL, BL, PL, and WL indicate red, green, blue, purple-phyto, and white (6500 K) LED treatments, respectively. y Different lowercase letters within the same column indicate statistically significant differences among treatments based on DMRT at p < 0.05 (n = 12).
Table 7. Chlorophyll a fluorescence parameters, including initial fluorescence (Fo), J-step fluorescence (Fj), I-step fluorescence (Fi), maximum fluorescence (Fm), maximum quantum yield (QY) of photosystem II (Fv/Fm), and performance index on an absorption basis (PIABS), of six-week-old sorrel (R. acetosa L.) under different LED light-quality treatments.
Treatment zBasic Fluorescence Parameters (a.u.)QY
(Fv/Fm)
PIABS
FoFjFiFm
RL9100 ± 755 a y24,581 ± 1468 a41,977 ± 2886 a51,169 ± 2535 a0.822 ± 0.010 a3.73 ± 0.5 ab
GL8932 ± 962 a23,245 ± 1701 ab39,075 ± 3388 ab46,691 ± 3361 bc0.808 ± 0.015 bc3.23 ± 0.8 bc
BL8303 ± 1356 ab21,974 ± 2225 bc36,794 ± 4597 b42,611 ± 4699 d0.805 ± 0.013 c2.94 ± 0.6 c
PL8791 ± 584 ab23,483 ± 1599 ab40,579 ± 3369 a47,872 ± 3254 b0.816 ± 0.009 ab3.45 ± 0.5 abc
WL8033 ± 591 b21,443 ± 1876 c37,157 ± 2824 b44,496 ± 3423 cd0.819 ± 0.006 a4.00 ± 0.7 a
F-value2.985.834.8710.344.474.23
p-value0.02660.00060.0020<0.00010.00340.0047
Values are presented as the mean ± standard deviation. z RL, GL, BL, PL, and WL indicate red, green, blue, purple-phyto, and white (6500 K) LED treatments, respectively. y Different lowercase letters within the same column indicate statistically significant differences among treatments based on DMRT at p < 0.05 (n = 12).
Table 8. Variable loadings of morphological traits, biomass components, and physiological responses on PC1–PC5 in the principal component analysis (PCA).
Variable zPC1 (29.7%)PC2 (12.3%)PC3 (10.3%)PC4 (7.2%)PC5 (6.0%)
Shoot height0.204−0.229−0.268−0.296−0.033
Stem diameter0.3070.040−0.193−0.1050.052
Ground coverage0.208−0.076−0.112−0.1020.103
Leaf area0.163−0.1930.0660.120−0.122
Leaf thickness0.226−0.0620.2380.120−0.243
Petiole length0.074−0.0850.110−0.159−0.191
Shoot dry weight0.3140.027−0.217−0.195−0.034
Root dry weight0.3040.203−0.184−0.1630.007
SPAD units0.214−0.0860.014−0.030−0.287
L*−0.255−0.001−0.117−0.2830.188
a*−0.1190.0960.072−0.2310.207
b*−0.2680.018−0.092−0.3040.222
RMC−0.0800.0580.2800.196−0.156
S/R−0.135−0.3550.0780.005−0.087
Compactness0.1840.2690.0970.029−0.048
DQI0.3110.244−0.119−0.0850.024
THI−0.019−0.469−0.096−0.123−0.143
RIR0.0780.4690.2090.0720.074
NDVI0.238−0.1590.368−0.1780.206
PRI0.141−0.1580.395−0.0280.367
MCARI−0.1500.087−0.149−0.0010.270
SIPI0.201−0.1340.356−0.2090.332
Fv/Fm0.148−0.133−0.2280.4730.292
PIABS0.150−0.184−0.1980.4200.391
z RMC: relative moisture content; S/R: shoot-to-root ratio; DQI: Dickson quality index; THI: top-heavy index; RIR: root investment ratio; NDVI: normalized difference vegetation index; PRI: photochemical reflectance index; MCARI: modified chlorophyll absorption ratio index; and SIPI: structure-insensitive pigment index.
Disclaimer/Publisher’s Note: The statements, opinions and data contained in all publications are solely those of the individual author(s) and contributor(s) and not of MDPI and/or the editor(s). MDPI and/or the editor(s) disclaim responsibility for any injury to people or property resulting from any ideas, methods, instructions or products referred to in the content.