Article

Phenotypic Diversity and Multivariate Characterization of Opuntia ficus-indica from the Inter-Andean Dry Valleys of Northern Ecuador

by
Lucía Vásquez-Hernández
* and
Galo Pabón-Garcés
Faculty of Engineering in Agricultural and Environmental Sciences, Universidad Técnica del Norte, Av. 17 de Julio 5-21 y Gral. José María Córdova, Ibarra 100105, Ecuador
*
Author to whom correspondence should be addressed.
Int. J. Plant Biol. 2026, 17(8), 63; https://doi.org/10.3390/ijpb17080063
Submission received: 29 June 2026 / Revised: 17 July 2026 / Accepted: 24 July 2026 / Published: 27 July 2026
(This article belongs to the Section Plant Ecology and Biodiversity)

Abstract

Opuntia ficus-indica (L.) Mill. is a crassulacean acid metabolism (CAM) xerophyte whose intraspecific morphological diversity remains poorly documented in Andean agroecosystems. This study characterized the phenotypic diversity of 55 accessions collected along an altitudinal gradient in the dry inter-Andean valleys of northern Ecuador. Twenty morphological descriptors were used to analyse the data. Quantitative descriptors showed moderate to high variability, with reproductive and defensive characters exhibiting greater variation than vegetative descriptors. MCA revealed substantial chromatic diversity, with fruit peel and pulp color emerging as the strongest qualitative discriminators among morphotypes. Cluster analysis identified three statistically distinct groups: a small-fruited, highly spinescent morphotype restricted to the most arid sites; an intermediate and phenotypically diverse morphotype distributed across all provinces; and a large-fruited, low-spinescence morphotype with the highest seed numbers, consistent with a more advanced domestication trajectory. The primary differentiation axis reflected a trade-off between spine investment and reproductive output. Five discriminant descriptors—fruit weight, spine length, seed number, peel color, and pulp color—provide a robust baseline for germplasm characterization and support conservation, breeding, and nutraceutical valorization in Andean drylands. The findings of this research contribute to filling a critical knowledge gap regarding Andean cactus pear germplasm, providing a scientific basis for conservation, sustainable management, and future breeding and agro-industrial initiatives.

1. Introduction

The genus Opuntia Mill. (Cactaceae) comprises one of the most ecologically and economically significant groups of succulent plants in the Americas. Members of the family Cactaceae are highly specialized dicotyledonous angiosperms adapted to arid and semiarid environments through remarkable physiological strategies, including nocturnal CO2 fixation via crassulacean acid metabolism (CAM), stem succulence, and efficient water-storage tissues [1,2]. Within this family, Opuntia ficus-indica (L.) Mill., commonly known as prickly pear or cactus pear (“tuna” in Andean Spanish), stands out for its wide geographic distribution, cultural relevance, and its numerous traditional and modern applications as food, fodder, medicine, and raw material for agro-industrial processing [1,3]. The fruit (prickly pear) is commercially exploited in over 30 countries across Latin America, North Africa, the Mediterranean Basin, and South Asia, with its global cultivated area concentrated in Mexico (50,000–70,000 ha), Italy, Tunisia, and Morocco [4,5]. This breadth makes O. ficus-indica one of the most globally important xerophytic crops and a flagship species for climate-resilient agriculture under current and projected climate change scenarios [4,5].
Molecular and biogeographic evidence indicates that O. ficus-indica was domesticated from wild Opuntia populations in central Mexico, where the greatest interspecific and intraspecific genetic diversity has been documented [6,7]. Following European colonization, the species was introduced into the Mediterranean Basin during the late 15th and early 16th centuries, where it naturalized rapidly in Sicily, southern Italy, and North Africa owing to favorable climatic conditions [1,8]. Today, O. ficus-indica is deeply embedded in traditional agroecosystems across four continents, contributing to household economies, erosion control, land rehabilitation, and ecosystem services including wildlife habitat provision and carbon sequestration [4,5,8]. In the Andean highlands of South America—particularly in Peru, Ecuador, and Bolivia—the species occupies a central role in subsistence agriculture and local markets, thriving in the dry inter-Andean valleys at altitudes ranging from 1300 to over 2600 m above sea level [9]. This studies have highlighted that the conservation of phenotypic and genetic diversity in Opuntia ficus-indica has become increasingly important under climate change scenarios. The species is recognized as a strategic crop for dryland agriculture because of its exceptional drought tolerance, ecosystem services, and potential for breeding programs aimed at improving fruit quality and resilience. Consequently, comprehensive characterization of local germplasm has become a research priority worldwide, particularly in regions where native diversity remains poorly documented.
Beyond its economic significance, O. ficus-indica plays a crucial ecological role in dryland ecosystems, underpinned by a suite of morpho-physiological adaptations. Its broad cladodes with thick cuticles, glochid-bearing areoles, and water-storage parenchyma confer adaptive advantages under extreme water limitation [1,2]. As a CAM plant, O. ficus-indica fixes atmospheric CO2 at nighttime while keeping stomata closed during the day, dramatically reducing evapotranspiration and increasing water-use efficiency (WUE) compared to C3 and C4 species [2,10]. This physiological strategy is a key determinant of the species’ capacity to colonize degraded soils, tolerate prolonged drought, and function as a nurse plant facilitating the establishment of other dryland vegetation in the hypervariable precipitation regimes characteristic of Andean dry valleys [4,5,10].
Despite its ecological and agronomic importance, the taxonomy and morphological classification of Opuntia remain challenging. The genus is characterized by extensive phenotypic plasticity, frequent interspecific hybridization, polyploidy (ploidy levels ranging from diploid, 2n = 2x = 22, to octoploid, 2n = 8x = 88), and high sensitivity to environmental conditions, which collectively complicate species delimitation and cultivar identification [11,12]. Molecular phylogenetic studies using plastid (atpB-rbcL, matK) and nuclear markers (ITS, ppc) have revealed evidence of reticulate evolution and incomplete lineage sorting, supporting the notion that morphology alone may be insufficient to resolve species boundaries in certain lineages [11]. Nevertheless, morphological descriptors remain indispensable for germplasm documentation, phenotypic characterization, and cultivar differentiation, particularly in regions where molecular facilities are limited or where traditional production systems rely on the visual recognition of morphotypes [3,13,14]. Moreover, recent studies have emphasized the need to expand the morphological characterization of Opuntia germplasm beyond the traditionally studied Mediterranean and North African regions, as South American populations, particularly those from the Andean region, remain comparatively underrepresented despite their considerable diversity and potential value for conservation and breeding programs [15,16,17,18].
In northern Ecuador, O. ficus-indica is widely distributed across a management continuum ranging from cultivated forms under active agronomic management to semi-wild forms and naturalized populations with no apparent human management, across the dry inter-Andean valleys of the provinces of Imbabura, Carchi, and Pichincha. These landscapes encompass pronounced altitudinal gradients, with high/low annual precipitation, and high solar radiation—conditions representative of Andean xerophytic ecosystems [9]. Systematic morphological characterization of cactus pear germplasm has been undertaken in several Mediterranean and North African collections, including ex situ accessions from Tunisia [15] and Morocco [16]. Such environmental heterogeneity may influence the phenotypic expression of key morphological descriptors including cladode shape, fruit pulp color, and glochid density, as has been reported along altitudinal gradients in other dryland regions [17]. Similar descriptor-based characterization approaches have also been reported in Algeria [18] and Morocco [19], providing structured baselines for conservation and cultivar selection in those regions. Despite the ecological and socioeconomic relevance of the species in the Ecuadorian inter-Andean valleys, comparable systematic studies documenting the morphological diversity of O. ficus-indica in Ecuador remain scarce, geographically fragmented, and largely absent from peer-reviewed literature. This gap limits the development of conservation strategies and genetic improvement programs [4,5,20], as well as the identification of elite accessions with desirable biochemical and functional properties for agricultural or agro-industrial valorization [21].
To address these gaps, comprehensive morphological characterization is necessary to understand how environmental heterogeneity, local management practices, and potential adaptive differentiation shape phenotypic variation in O. ficus-indica accessions from Andean drylands. Standardized morphological descriptors—combining qualitative descriptors with quantitative descriptors—provide a robust framework for evaluating diversity patterns and identifying key discriminant characteristics across germplasm collections [13,14,19]. Such multivariate analyses, when combined with hierarchical clustering approaches, support the detection of unique phenotypes valuable for conservation and the selection of high-performing accessions for breeding programs targeting improved fruit quality, reduced spinescence, or enhanced drought tolerance [4,5,15,22,23]. Opuntia ficus-indica is a multipurpose species widely valued across Latin American drylands, both as a fruit crop specifically adapted to semi-arid production systems [24] and as a source of forage for livestock during periods of scarce pasture availability [25], underscoring the agroecological relevance of the material studied here.
Therefore, the present study aimed to characterize the morphological diversity of Opuntia ficus-indica accessions collected from the dry inter-Andean valleys of northern Ecuador through the application of 20 standardized qualitative and quantitative morphological descriptors [13,14]. The findings of this research contribute to filling a critical knowledge gap regarding Andean cactus pear germplasm, providing a scientific basis for conservation, sustainable management, and future breeding and agro-industrial initiatives.

2. Materials and Methods

2.1. Plant Material

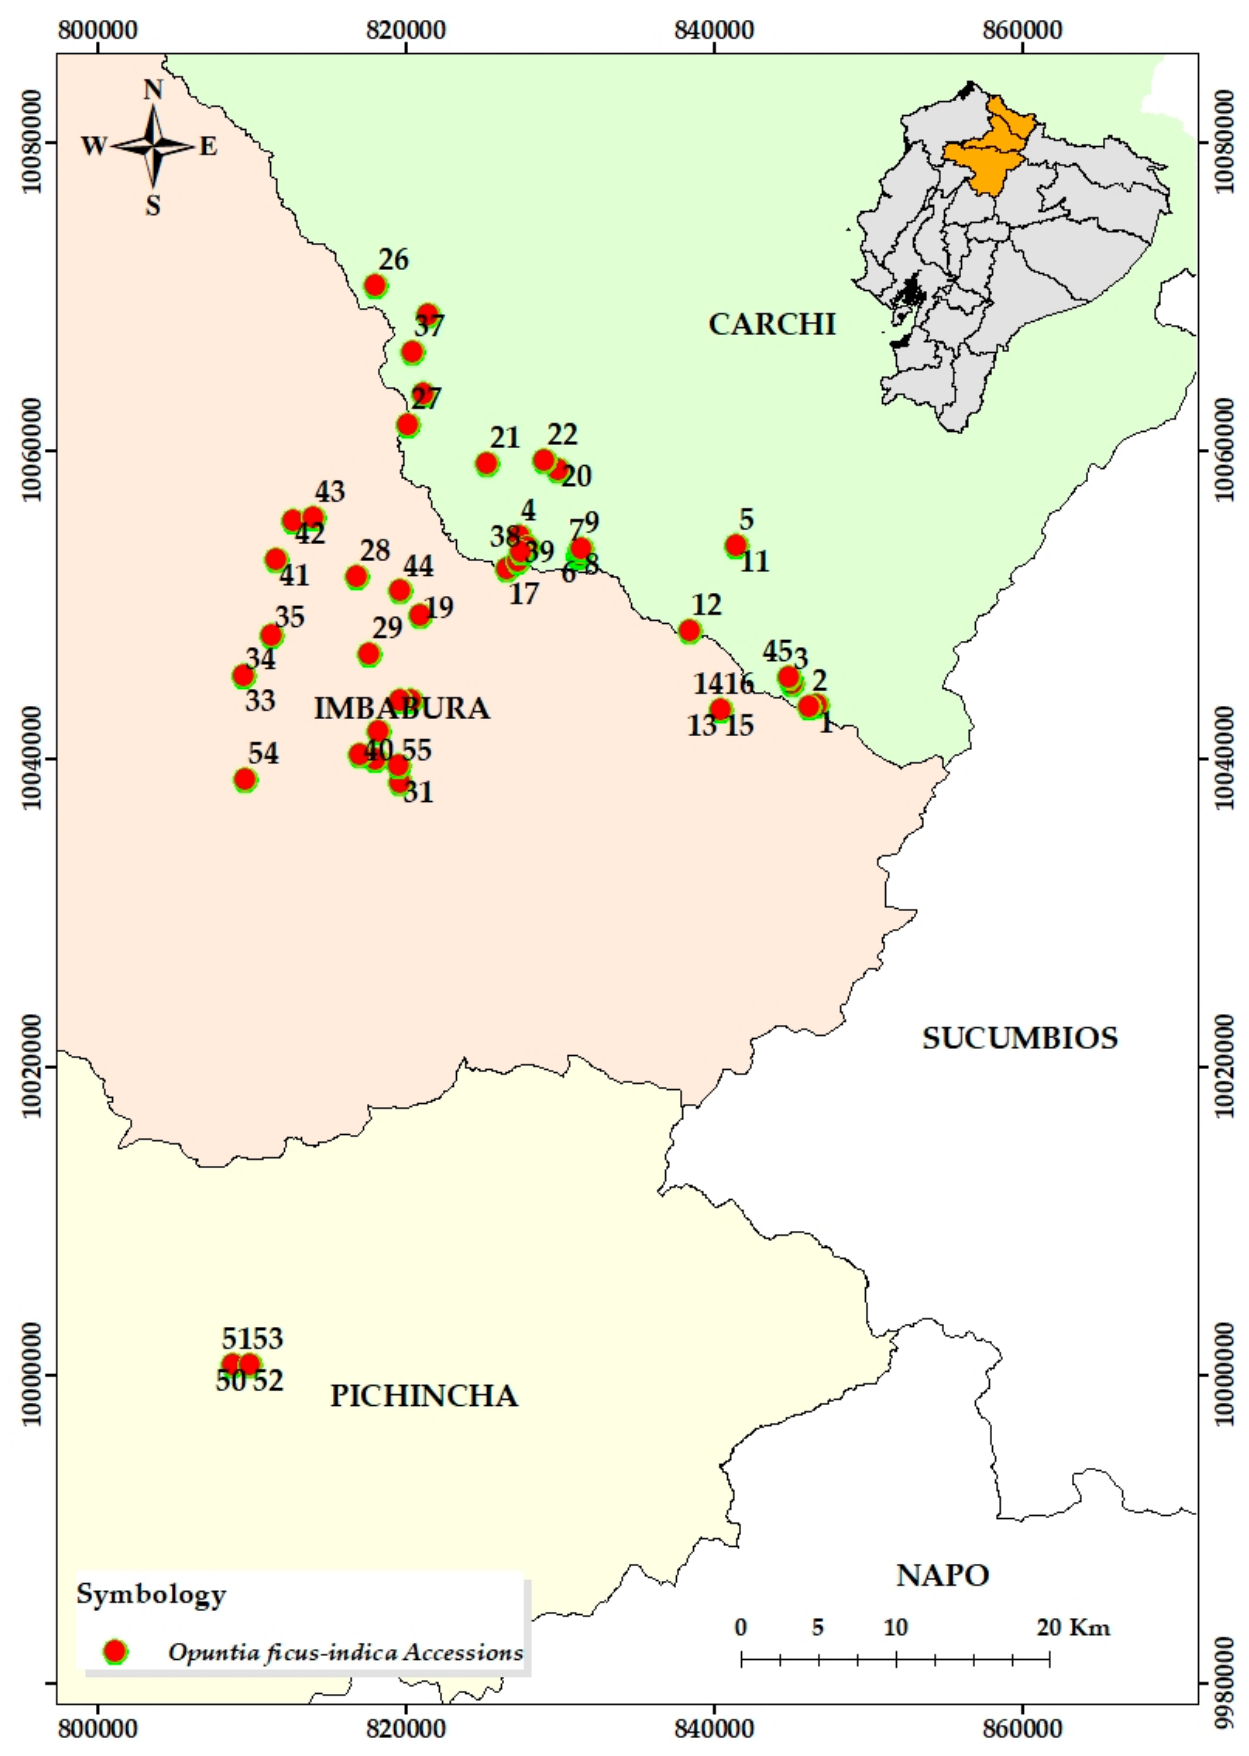
A total of 55 accessions of Opuntia ficus-indica (L.) Mill. were evaluated. These were collected between 2025 and 2026 from three provinces located in the dry inter-Andean valleys of northern Ecuador: Carchi (25 accessions), Imbabura (23 accessions), and Pichincha (7 accessions). Collection sites spanned an altitudinal gradient from 1381 to 2758 m a.s.l., with annual precipitation regimes of 350–800 mm and high solar radiation—characteristics representative of Andean xerophytic ecosystems (Figure 1). All accessions were georeferenced using GPS coordinates. Adult plants were selected in situ, prioritizing healthy individuals with no visible symptoms of pests or diseases and with no recent history of agronomic treatments that could alter phenotypic expression. In populations with more than five individuals, three adult plants per accession were randomly selected. All collection activities were carried out on privately owned farmland and cultivated sites with the explicit consent of the landowners. No collection was performed in protected natural areas or wild populations; therefore, no formal biodiversity access permit was required in accordance with Ecuadorian environmental regulations.

2.2. Sampling Strategy and Morphological Evaluation

Morphological characterization was performed following standardized international protocols adapted to the species, prioritizing descriptors with high discriminatory power. A total of 20 morphological descriptors were evaluated—five qualitative and fifteen quantitative—distributed across four plant structures: cladodes (5 descriptors), fruits (9), seeds (4), and flowers (2) (Table 1). Descriptors were drawn from the UPOV (International Union for the Protection of New Varieties of Plants) guidelines for Opuntia spp. [14] and the FAO/CACTUSNET (Food and Agriculture Organization of the United Nations [FAO]/International Network on Cactus Pear [CactusNet]) Minimum List of Descriptors [13], complemented by standardized quantitative measurements established for this species.
Qualitative characters were recorded using ordinal scales and color codes from the Royal Horticultural Society (RHS) color chart, using direct visual comparison with the RHS color table and its RGB equivalents for greater precision and reproducibility. Fruit shape was classified into five nominal categories: 1 = spherical, 2 = elliptical, 3 = lanceolate, 4 = oval, and 5 = rectangular. Quantitative characters were measured using a vernier caliper (precision 0.01 mm), analytical balance (precision 0.01 g), and stereoscopic magnifier. A minimum of 10 mature cladodes, 10 fruits at commercial maturity, and 10 flowers per accession were evaluated from all available representative plants (10–15 individuals in populations exceeding five plants, or all individuals in smaller populations), following UPOV [14] sampling recommendations for uniformity and representativeness.

2.3. Statistical Analysis

2.3.1. Descriptive Statistics and Variable Selection

Descriptive statistics—mean, standard deviation (SD), coefficient of variation (CV), and range (minimum–maximum)—were calculated for the 15 quantitative variables evaluated. Variable selection for multivariate analysis followed three hierarchical criteria: (i) variability: variables with CV ≥ 15% were prioritized, discarding those with low discriminatory capacity; (ii) non-redundancy: Pearson correlations between pairs of variables were evaluated, and variables involved in the strongest pairwise redundancies were removed; and (iii) sampling adequacy: individual measures of sampling adequacy (MSA) were calculated on the full 15-variable correlation matrix, and variables with MSA below 0.40 and limited discriminant contribution were excluded. Two exclusions met the strict |r| ≥ 0.70 threshold under criterion (ii): seed length was discarded due to its near-collinearity with seed diameter (r = 0.980), and fruit diameter was discarded due to its strong collinearity with fruit weight (r = 0.807). Fruit length, although below this numeric threshold (r = 0.658 with fruit weight), was additionally excluded because it measures the same underlying fruit-size dimension already represented by fruit weight and fruit diameter within this correlated cluster, making its independent retention redundant. Under criterion (iii), flower length and floral scar diameter were excluded due to low individual sampling adequacy (MSA < 0.40) and limited discriminant contribution. The final set comprised 10 representative variables covering vegetative growth, defense structures, fruit characteristics, seed attributes, and floral morphology.

2.3.2. Correction for Multiple Comparisons in Pearson Correlations

Given that 105 pairwise Pearson correlations were simultaneously calculated (15 quantitative variables), p-values were corrected for multiple comparisons using the Bonferroni method (α* = 0.05/105 = 0.000476) and the Benjamini–Hochberg false discovery rate procedure (BH–FDR, α = 0.05). Only associations significant under both methods were considered robust for variable exclusion purposes.

2.3.3. Validation of the Correlation Matrix for PCA

Prior to PCA, correlation matrix adequacy was confirmed via Bartlett’s test of sphericity (χ2(45) = 142.78, p < 0.001) and the Kaiser–Meyer–Olkin (KMO) index [26,27]. The overall KMO value (0.59) was marginally below the conventional threshold of 0.60 but within the acceptable range (≥0.50) for exploratory factor analyses of morphological data [27,28].
Following the exclusion of flower length and floral scar diameter based on their low MSA in the original 15-variable matrix (Section 2.3.1), individual sampling adequacy was recalculated on the final 10-variable matrix used for PCA. This second analysis revealed that seed diameter (MSA = 0.27) and floral scar depth (MSA = 0.42) presented the lowest sampling adequacy within the retained set. Both variables were nonetheless retained in the PCA on the basis of their biological relevance as key reproductive descriptors in Opuntia characterization studies [14,27].

2.3.4. Principal Component Analysis (PCA)

PCA was performed on the correlation matrix of the 10 selected variables, following data standardization (mean = 0, variance = 1), with the objective of identifying the principal axes of phenotypic variation and describing the multivariate structure of the accessions. Interpretation was based on eigenvalues (λ), variance explained per component, and variable loadings on each axis. Components with λ > 1.0 were retained (Kaiser criterion [26]). PCA was performed in InfoStat [29].

2.3.5. Multiple Correspondence Analysis (MCA)

The five qualitative characters (cladode color, fruit shape, peel color, pulp color, and petal color) were analyzed by MCA to explore associations between categories and the multivariate distribution of accessions in qualitative space. MCA was implemented in InfoStat [29]. The significance of each axis was assessed using the χ2 test associated with the corresponding eigenvalue. The low cumulative inertia explained by the first two axes (8.19%) is consistent with expected MCA behavior for variables with a high number of categories, since total inertia scales with category number rather than variable number [30,31]. Inertia values below 15–20% are common in germplasm studies using RHS polychromatic descriptors [13,18], and axis relevance should be assessed by the biological coherence of the resulting groupings rather than inertia percentage alone.

2.3.6. Hierarchical Clustering and Validation of the Optimal Number of Groups

Hierarchical clustering was performed using Ward’s method with Gower distances [32], which integrates quantitative and qualitative variables into a unified dissimilarity measure (range 0–1). The resulting distance matrix presented a mean dissimilarity of 0.412 (SD = 0.071; CV = 17.3%; range: 0.186–0.641), with qualitative variables contributing 54.8% of the total mean distance despite representing only 25% of the descriptors. Dendrogram representation quality was assessed using the cophenetic correlation coefficient (r = 0.63; p < 0.001) [33].
The optimal number of groups was determined using two complementary criteria. As the primary criterion, the sequence of fusion distances in the dendrogram was inspected to identify natural gaps between successive fusions [34]: a large gap indicates a real increase in heterogeneity when moving from k to k + 1 groups. As supplementary criteria, the Silhouette index [35] and Calinski–Harabasz index [36] were calculated for k = 2–7. All supplementary validation calculations were performed in R [37] using the cluster version 2.1.6 [38] and factoextra version 1.0.7 [39] packages. Statistical analyses were performed using R version 4.4.2.

2.3.7. Statistical Validation of Differentiation Between Morphotypes

To statistically confirm morphological differences between the three groups identified by hierarchical clustering, the Kruskal–Wallis test was applied to each quantitative variable, followed by the Dunn post hoc test [40] with Bonferroni correction for pairwise comparisons (α = 0.05). This non-parametric approach was selected due to the non-normal distribution of several morphological variables (Shapiro–Wilk test [41], p < 0.05) and the unequal group sizes (G1 n = 8; G2 n = 26; G3 n = 21). Groups sharing the same superscript letter within a row do not differ significantly.

2.3.8. Independence Tests for Qualitative Characters

Statistical association between qualitative characters and membership in morphotypic groups was evaluated using two complementary approaches. For chromatic characters coded with the RHS scale (cladode color, peel color, pulp color, and petal color), the Kruskal–Wallis test was applied to the ordinal numerical codes, given the high number of categories (15–30) that precludes a valid χ2 test due to contingency table sparsity. For fruit shape (five nominal categories), Pearson’s χ2 independence test was applied. In all cases, association strength was quantified using Cramér’s V [42], calculated on the complete contingency table—a valid metric regardless of expected frequencies [43]. As a confirmatory check, chromatic variables were collapsed into three tonal groups (pale: RHS 1–7; intermediate: RHS 8–15; intense: RHS 16–30) and subjected to χ2 testing. The significance level was α = 0.05.

2.3.9. Phenotypic Diversity Indices

Phenotypic diversity of qualitative characters within each morphotypic group was quantified using the Shannon index [44] (H’ = −Σ p~i~ ln p~i~), where p~i~ is the relative frequency of each category. Pielou’s evenness [45] (J’ = H’/ln S, where S is the observed category richness) was calculated as a complementary measure of distributional uniformity. Both indices were calculated independently for each qualitative descriptor and each group (G1, G2, G3).

2.3.10. Statistical Software

Descriptive, correlation, PCA, and MCA analyses were performed in InfoStat 2020 [29]. Clustering validation calculations (Silhouette index [35], Calinski–Harabasz index [36], dendrogram gap analysis [34]), and Gower distance [32] were performed in R [37] using the cluster version 2.1.6 [38] and factoextra version 1.0.7 [39] packages. Kruskal–Wallis and Dunn–Bonferroni tests [40] were performed in R [37] using the dunn.test version 1.3.6 package [46]. The Shapiro–Wilk test [41] was performed in R [37] using the base function shapiro.test. χ2 tests, Cramér’s V [42,43], Shannon [44] and Pielou [45] indices were calculated in R [37] using the rcompanion version 2.5.2 [47] and vegan version 2.6-4 [48] packages, respectively. Tabular data were read and organized in Microsoft Excel.

3. Results

3.1. Descriptive Statistics and Phenotypic Variability of Quantitative Morphological Descriptors

Descriptive statistics (Table 2) revealed considerable variation among the morphological descriptors evaluated, as indicated by the coefficient of variation (CV), which ranged from 15.88% (fruit diameter) to 59.77% (number of seeds per fruit). Descriptors associated with cladode morphology, such as cladode length (CV = 16.26%) and cladode diameter (CV = 18.65%), showed relatively medium variability. Similarly, fruit diameter (15.88%), floral scar diameter (16.17%), and flower length (17.91%) also exhibited limited dispersion.
In contrast, high variability (CV between 20% and 40%) was observed in fruit-related descriptors, including fruit length (21.63%), exocarp thickness (25.98%), fruit weight (37.98%), and 100-seed weight (35.10%).
Several descriptors displayed high variability (CV > 40%), including the length of the longest spine (47.18%), the length of the shortest spine (47.75%), floral scar depth (59.31%), seed length (48.64%), seed diameter (48.36%), and number of seeds per fruit (59.77%). The high dispersion observed in these descriptors indicates substantial phenotypic variability among the evaluated accessions. In particular, the number of seeds per fruit showed the highest degree of variation, ranging from 43.67 to 678 seeds.
The analysis of minimum–maximum ranges supports these findings, revealing wide amplitudes in variables such as fruit weight (26.33–166 g) and seed-related descriptors. Likewise, spine lengths, despite their low absolute values, exhibited high relative variability (CV = 47.18% and 47.75% for the longest and shortest spine, respectively).
Overall, vegetative descriptors—particularly cladode dimensions—showed greater stability compared to reproductive and defensive descriptors, which displayed markedly higher variability.

3.2. Pearson Correlation Analysis and Variable Selection for PCA

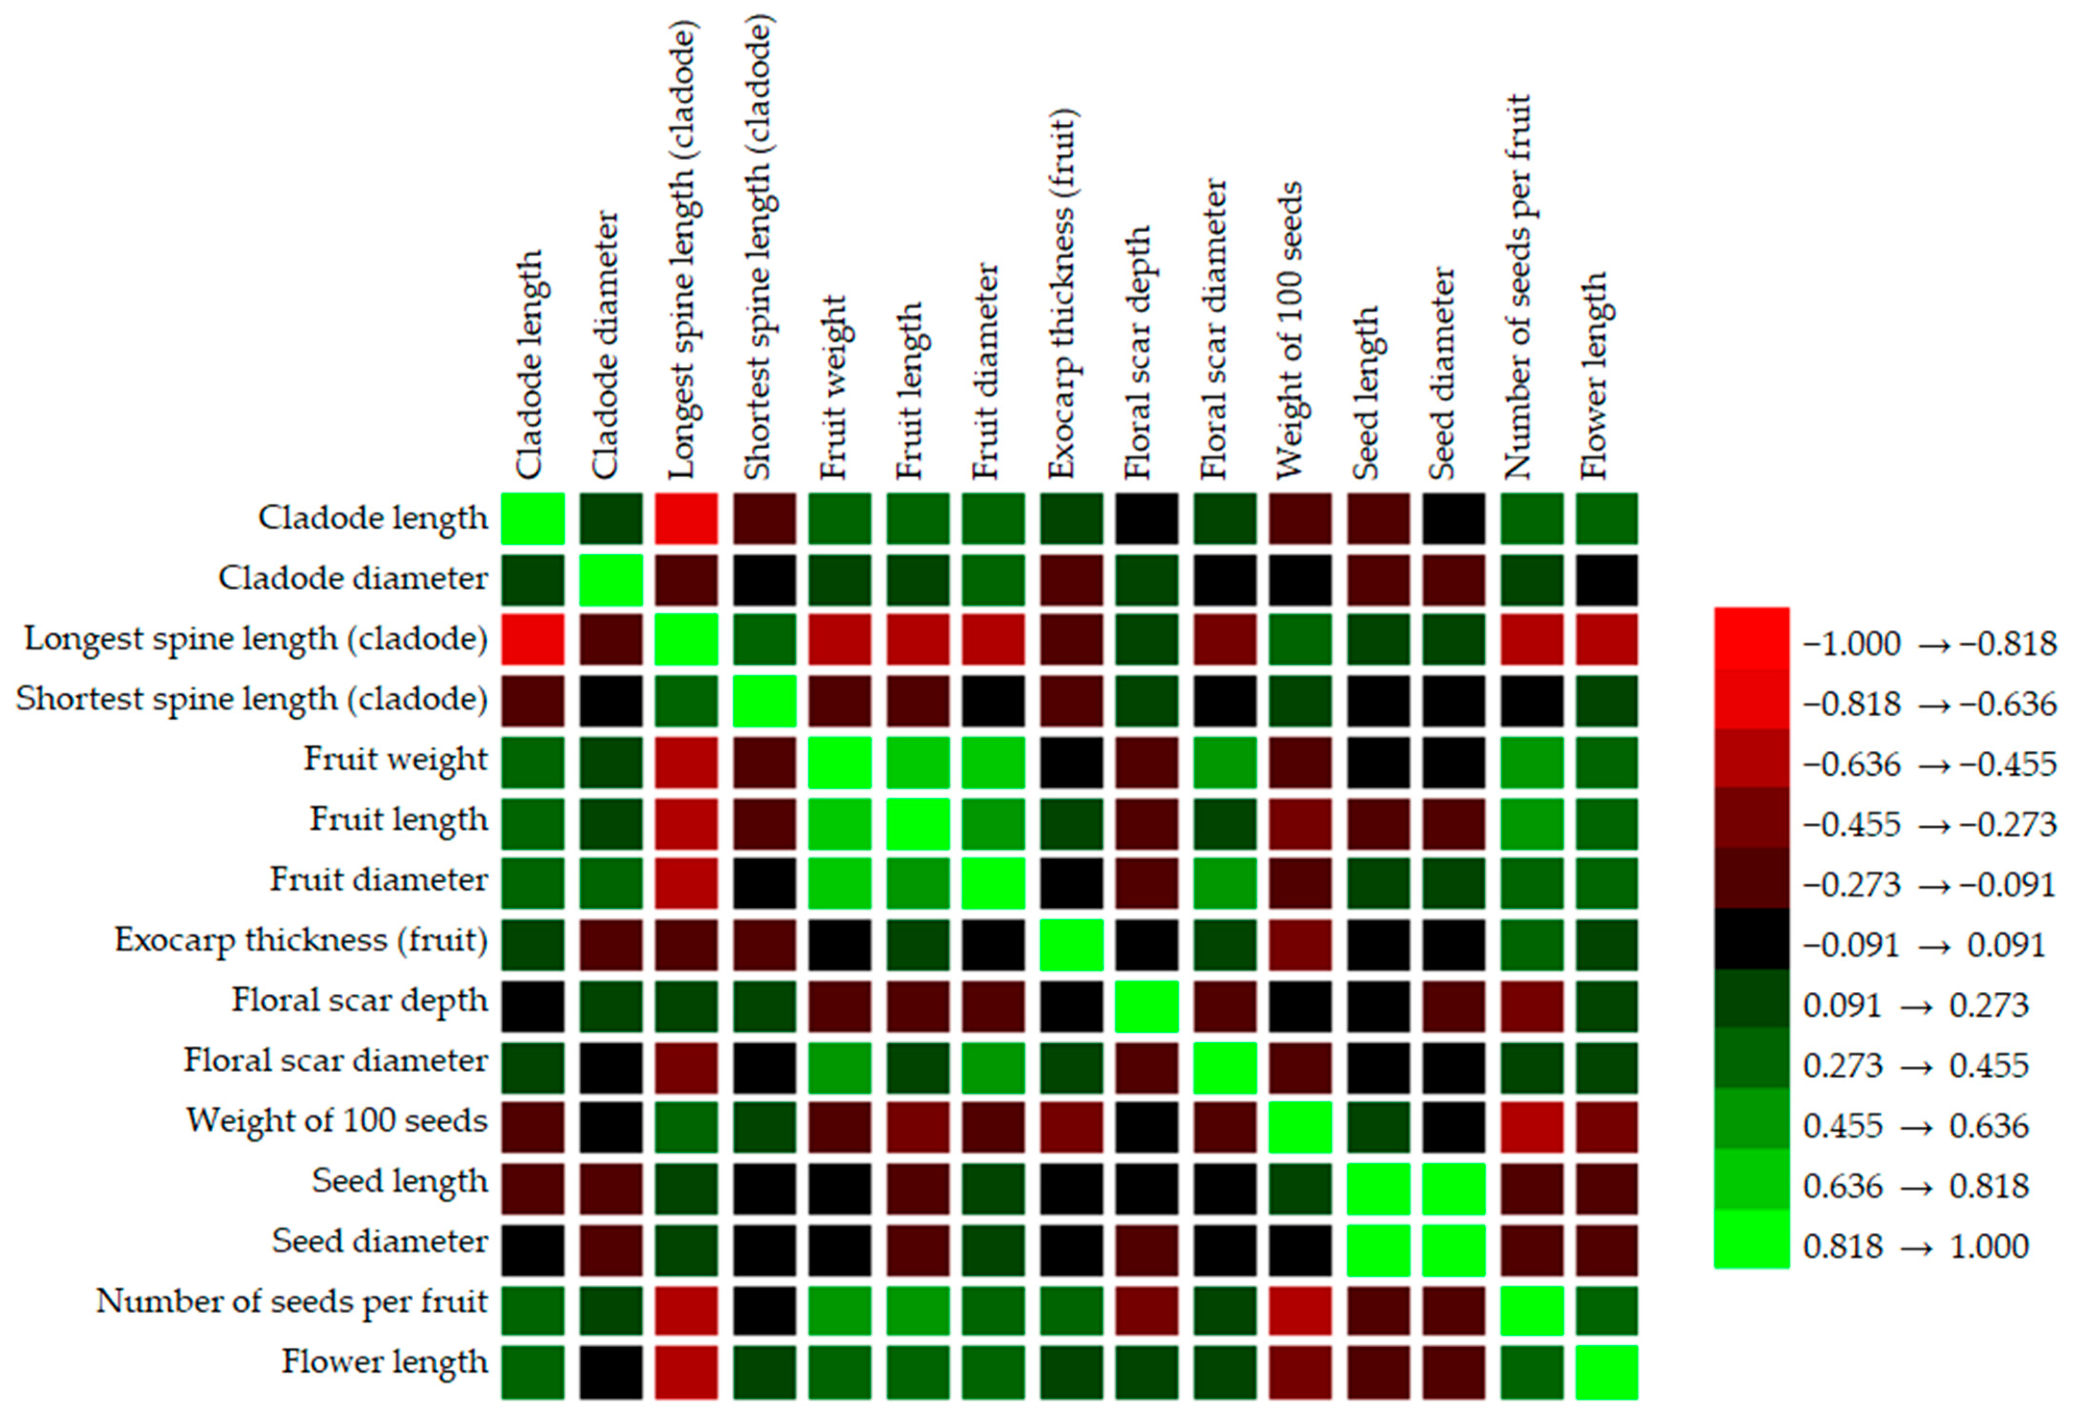
Pearson correlation analysis (Figure 2) revealed numerous significant associations (p < 0.05) among the evaluated variables. Strong positive correlations were observed among fruit size variables, notably between fruit weight and fruit diameter (r = 0.81; p < 0.0001), as well as between fruit weight and fruit length (r = 0.66; p < 0.0001). Additionally, a near-perfect correlation was found between seed length and seed diameter (r = 0.98; p < 0.0001), indicating redundancy between these two variables.
Conversely, the length of the longest cladode spine exhibited significant negative correlations with several reproductive variables, including cladode length (r = −0.64; p < 0.0001), fruit weight (r = −0.56; p < 0.0001), fruit length (r = −0.53; p < 0.0001), and flower length (r = −0.55; p < 0.0001).
The 100-seed weight also showed moderate negative correlations with the number of seeds per fruit (r = −0.49; p < 0.001) and with flower length (r = −0.39; p = 0.0031). Collectively, these results enabled the identification of association and redundancy patterns among variables, which were subsequently considered in the variable selection process for the multivariate analysis.
Following the correction procedure described in Section 2.3.2, 15 of the 34 nominally significant correlations (p < 0.05 uncorrected) remained significant under Bonferroni correction and 27 under BH–FDR. All associations highlighted in the text—including the near-perfect correlation between seed length and seed diameter (r = 0.980; p_Bonf < 0.001), the strong positive correlations among fruit size variables (weight vs. diameter: r = 0.807; p_Bonf < 0.001; weight vs. length: r = 0.658; p_Bonf < 0.001), and the negative correlations between the longest spine length and reproductive descriptors (r = −0.638 to −0.532; all p_Bonf < 0.01)—retained their significance under both correction methods. The sole exception was the association between 100-seed weight and flower length (r = −0.391), which was significant under BH–FDR (p_BH = 0.015) but not under the more conservative Bonferroni correction (p_Bonf = 0.329); this association is therefore interpreted with caution and is not used as a primary criterion for variable exclusion (Table 3).

3.3. Descriptors Selection for Principal Component Analysis (PCA)

Correlation matrix adequacy was confirmed (Bartlett’s test: χ2 = 142.78, df = 45, p < 0.001; KMO = 0.59; see Section 2.3.3). Individual KMO values revealed that floral scar depth (0.42) and seed diameter (0.27) were the descriptors most responsible for reducing the overall index, reflecting their relatively independent variation with respect to the remaining variables. Both descriptors were retained on the basis of their biological relevance, in accordance with standard practice in germplasm characterization.
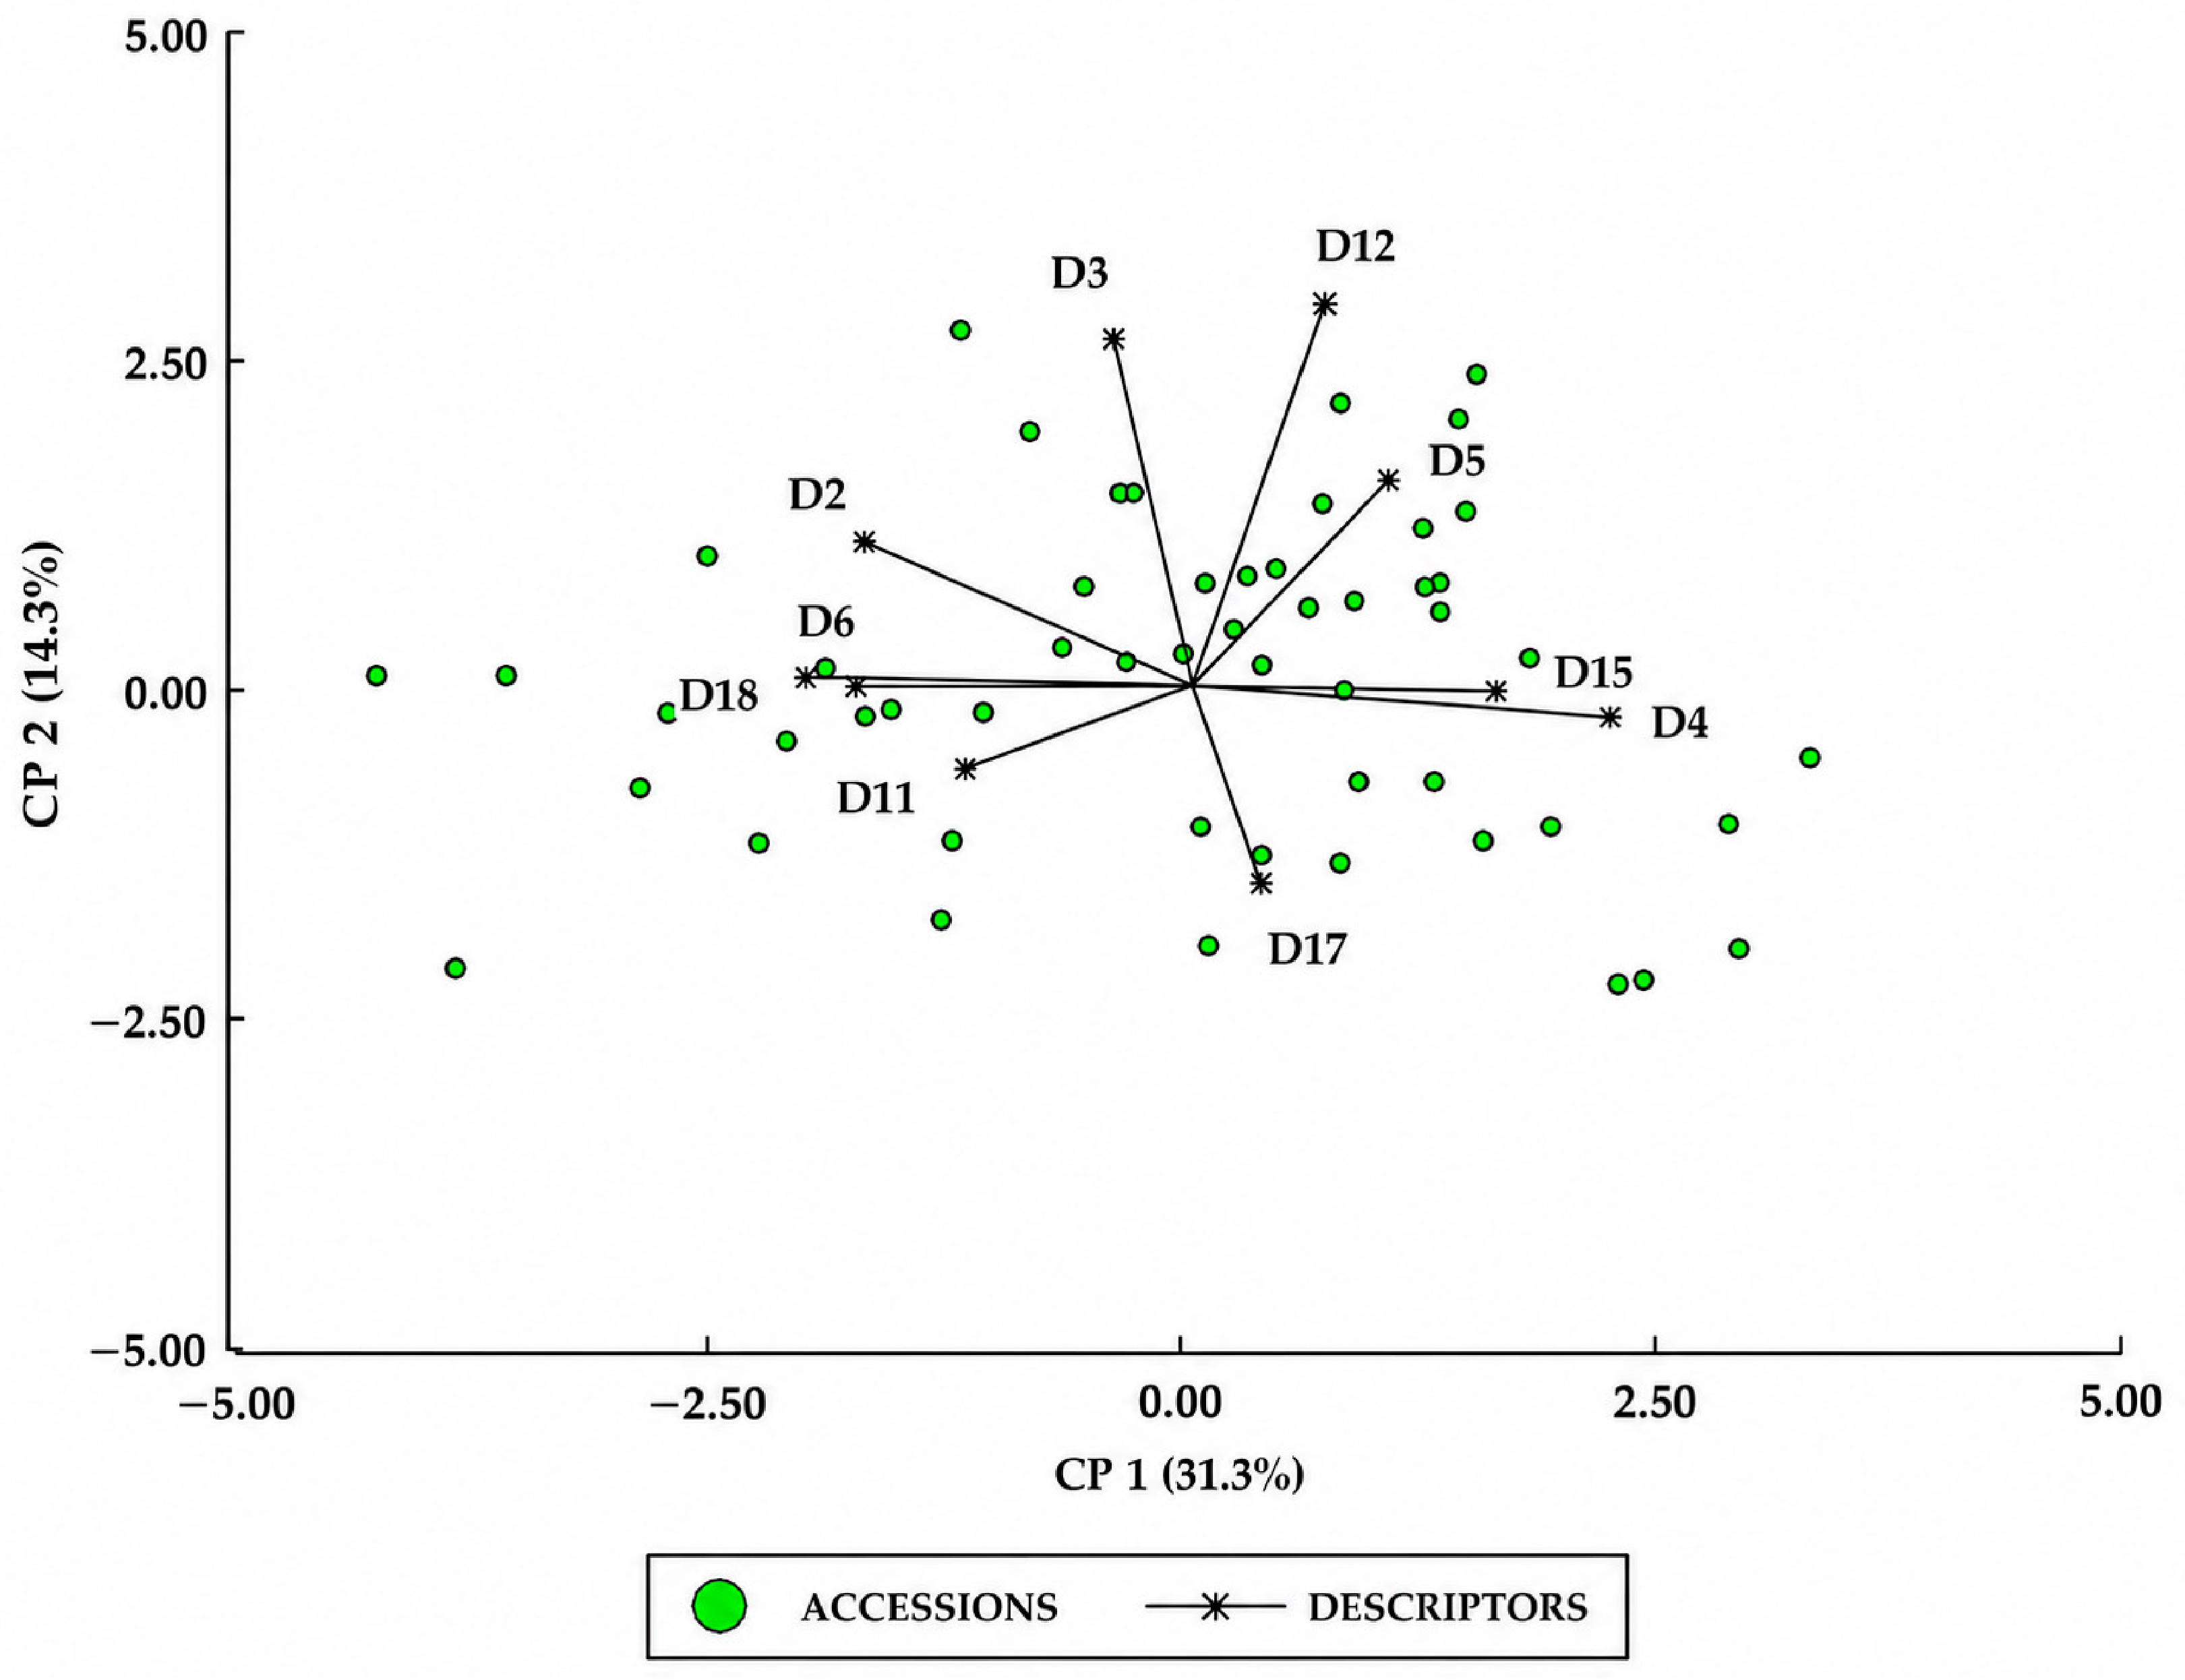
The first four components jointly explained 67.68% of the total variance, with PC1 accounting for 31.31%, PC2 for 14.30%, PC3 for 12.08%, and PC4 for 9.99% (Table 4). Analysis of the first two components (PC1 + PC2 = 45.61%) revealed the main axes of phenotypic differentiation among accessions (Figure 3).
PC1 (31.31%) was primarily determined by variables related to reproductive output and fruit size. Number of seeds per fruit showed the highest negative loading on this axis (−0.4474), followed by fruit weight (−0.3904) and cladode length (−0.3785), all contributing negatively—that is, accessions with high values in these descriptors were positioned toward the negative end of PC1. In contrast, longest spine length presented the highest positive loading (0.4776), followed by weight of 100 seeds (0.3457), indicating that accessions with greater spinescence and heavier individual seeds were located toward the positive end of PC1.
PC2 (14.30%) captured an independent axis of variation associated primarily with structural and floral characters. Floral scar depth showed the highest positive loading on this axis (0.6222), followed by cladode diameter (0.5662), indicating that accessions with deeper floral scars and wider cladodes were positioned toward the positive end of PC2. Seed diameter contributed negatively (−0.3223), reflecting an independent source of variation in seed morphology not captured by PC1.
PC3 (12.08%) was dominated by exocarp thickness (0.6022) and fruit weight (−0.4115) and weight of 100 seeds (−0.4289) in opposition, reflecting variation in fruit structural characteristics independent of overall fruit size.
PC4 (9.99%) was primarily associated with the shortest spine length (0.5959) and seed diameter (0.5394), capturing variation in secondary defensive and reproductive descriptors. Despite its low individual sampling adequacy (MSA = 0.27; Section 2.3.3), seed diameter contributed meaningfully to the multivariate structure, showing its strongest loading on PC4 and a secondary contribution to PC2 (−0.3223; Section 3.3, PC2 paragraph above), indicating that this descriptor captures an axis of seed-morphology variation independent of the dominant defensive–reproductive gradient defined by PC1.
The distribution of accessions in the biplot (PC1 × PC2, Figure 3) showed moderate dispersion without complete separation between groups, though clustering tendencies partially coinciding with the Ward–Gower hierarchical classification were evident. Accessions with the most extreme positive PC1 scores (i.e., high spinescence, heavier seeds, lower fruit production) corresponded predominantly to Group 1 and Group 2 accessions from Carchi, while accessions with the most negative PC1 scores (large fruit, high seed counts, lower spinescence) clustered toward Group 3. Overall, the PCA identified a primary functional gradient structuring the morphological diversity of O. ficus-indica in the inter-Andean dry valleys of northern Ecuador, consistent with the morphological gradient described below (Section 3.6).

3.4. Multiple Correspondence Analysis (MCA)

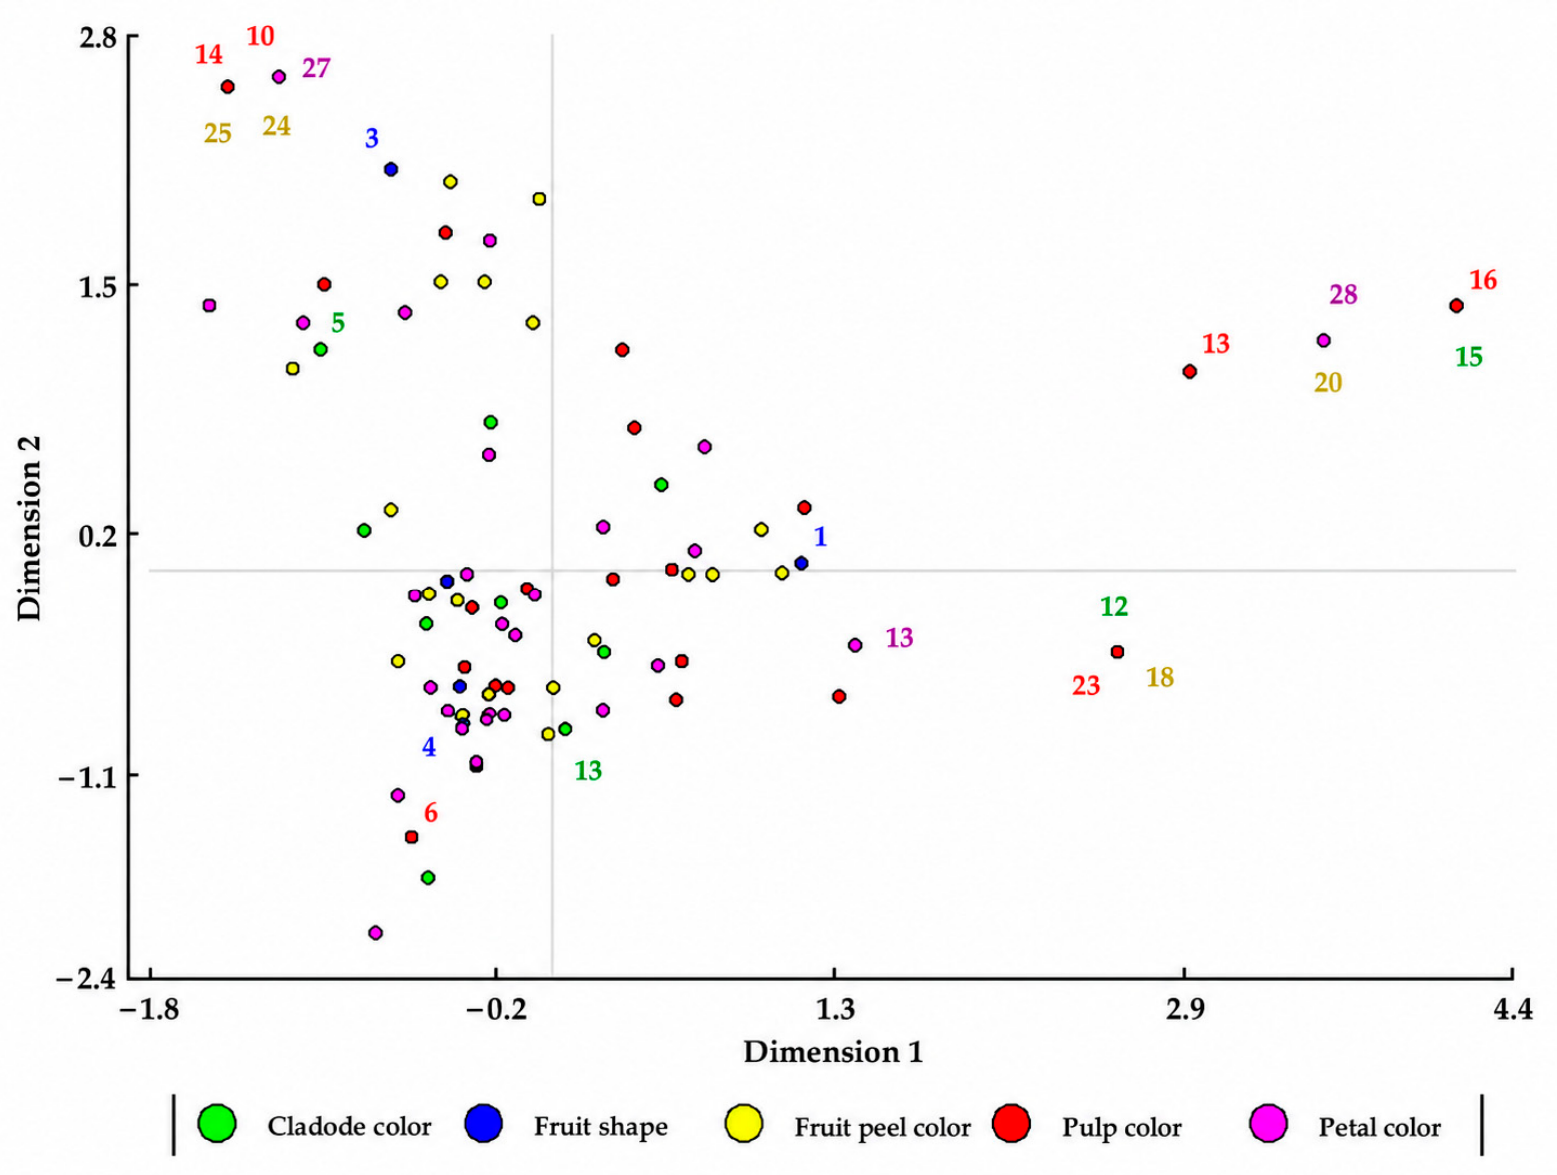
Figure 4 shows the biplot constructed from the qualitative descriptors of prickly pear (Opuntia ficus-indica) accessions: cladode color, fruit shape, peel color, pulp color, and petal color.
Multiple Correspondence Analysis (MCA) explained a relatively low proportion of total inertia, which is common in this type of analysis when variables with a large number of categories are included. The first dimension (Dim 1) yielded an eigenvalue of 0.89 and accounted for 4.19% of the inertia (χ2 = 527.89; p < 0.001), while the second dimension (Dim 2) yielded an eigenvalue of 0.87 and contributed 3.99% (χ2 = 502.92; p < 0.001). Together, the first two axes explained 8.19% of the total variability of the qualitative data.
Despite the moderate percentage of explained inertia, the axes revealed a clear and biologically relevant structuring of the accessions. Dim 1 (horizontal axis) captured the greatest source of variability and was primarily associated with extreme or infrequent combinations of chromatic and morphological descriptors. At the positive end of this axis, the accessions with the highest coordinates were as follows: 15 (4.15), 16 (4.15), 20 (3.54), 28 (3.54), 13 (2.93), 12 (2.59), 18 (2.59), and 23 (2.59). These accessions were characterized by singular qualitative profiles, particularly regarding skin, pulp, and petal colors. Dim 2 (vertical axis) represented a second independent source of variation, with accessions 24 (2.58), 25 (2.54), 3 (2.09), 15 (2.02), and 28 (1.93) standing out at its positive end, and accessions 12 (−2.14) and 24 (−2.14), among others, at its negative end.
The accessions were broadly distributed across the biplot space, with a marked presence in the extreme positive quadrants of both axes, evidencing considerable qualitative diversity within the collection. The accessions furthest from the origin—primarily 15, 16, 20, 24, 25, 28, 13, 12, 18, and 23—contributed most to total inertia and represented the most differentiated qualitative profiles. The majority of accessions, by contrast, were concentrated near the origin (approximate coordinates between −1.5 and 1.5), indicating the presence of common or intermediate qualitative profiles widely shared within the collection.
Although the biplot did not include group-based coding, the spatial distribution suggests multivariate differences among groups G1, G2, and G3. The more homogeneous groups tended to cluster near the center, while the most heterogeneous group exhibited greater dispersion toward the extremes.
Overall, MCA confirmed the existence of significant qualitative variability among Opuntia ficus-indica accessions. Although the first two axes explained only 8.19% of total inertia, they were sufficient to identify the most distinctive trait combinations and the most singular accessions (particularly 15, 16, 20, 24, 25, 28, and 13). These results complement the univariate frequency analyses by revealing the simultaneous associations among chromatic and morphological descriptors.
The low cumulative inertia explained by the first two MCA dimensions (Dim 1 = 4.19%, Dim 2 = 3.99%; total = 8.19%) is consistent with the expected behavior of MCA when applied to datasets with a large number of categories, since total inertia scales with the number of active categories rather than with the number of variables [49]. In the present study, the large number of RHS color categories across five qualitative descriptors (cladode color, fruit shape, peel color, pulp color, and petal color) generates an extensive active category space, which mathematically limits the proportion of inertia that any individual dimension can capture. Despite this, the axes revealed a biologically coherent structure: Dimension 1 separated accessions with rare or extreme chromatic profiles from those with common intermediate profiles, and the most extreme accessions identified by MCA (particularly 15, 16, 20, 24, 25, and 28) coincided with those showing the greatest morphological distinction in the Ward–Gower clustering, thereby confirming the convergent validity of both multivariate approaches.
The non-random association between qualitative descriptors and morphotype groups was formally assessed through independence tests (Table 5). Fruit shape showed a significant chi-square association with group membership (χ2(8) = 24.40, p = 0.002, Cramér’s V = 0.471), confirming that the transition from predominantly rectangular shapes in G1 to spherical shapes in G3 is not attributable to chance. Peel color and pulp color exhibited the strongest group discrimination: both variables yielded highly significant Kruskal–Wallis statistics on ordinal RHS codes (H(2) = 38.55, p < 0.001 and H(2) = 38.91, p < 0.001, respectively) and large effect sizes (V = 0.822 and V = 0.805), corroborated by significant chi-square tests on hue-collapsed categories (skin: χ2(4) = 46.47, p < 0.001; pulp: χ2(4) = 44.15, p < 0.001). In contrast, cladode color and petal color showed no significant differences among groups in either the ordinal analysis (H(2) = 2.88, p = 0.237 and H(2) = 0.32, p = 0.853, respectively) or the collapsed chi-square analysis, despite their high Cramér’s V values (0.547 and 0.764). This apparent paradox reflects high intragroup chromatic heterogeneity rather than intergroup differentiation, and is consistent with the MCA biplot, where these descriptors did not contribute substantially to axis separation. Collectively, three of the five qualitative descriptors—fruit shape, peel color, and pulp color—showed statistically significant and practically large associations with morphotype group membership, reinforcing the discriminant validity of the Ward–Gower classification.

3.5. Hierarchical Cluster Analysis and Morphotypic Grouping

The Gower distance matrix yielded a mean dissimilarity of 0.412 (SD = 0.071; range: 0.186–0.641; CV = 17.34%; see Section 2.3.6 for methodology).
Qualitative variables contributed 54.8% of the total mean distance despite representing only 25% of the descriptors, indicating their disproportionate influence on group differentiation. This mean value indicates that, on average, each pair of accessions differs by approximately 41.2% of the scaled descriptor space. The moderate CV (17.34%) reflects a relatively homogeneous distribution of distances, consistent with a collection encompassing both morphologically similar accessions (low distances, predominantly intragroup comparisons) and pairs with high dissimilarity (large distances, mainly between G1 and G3), which justifies the choice of Gower distance as a metric capable of capturing the full range of phenotypic variation present in the data. The pairwise distance distribution was unimodal and approximately symmetric (skewness = 0.070), with no evidence of bimodal structure or outlying accessions dominating the distance space.
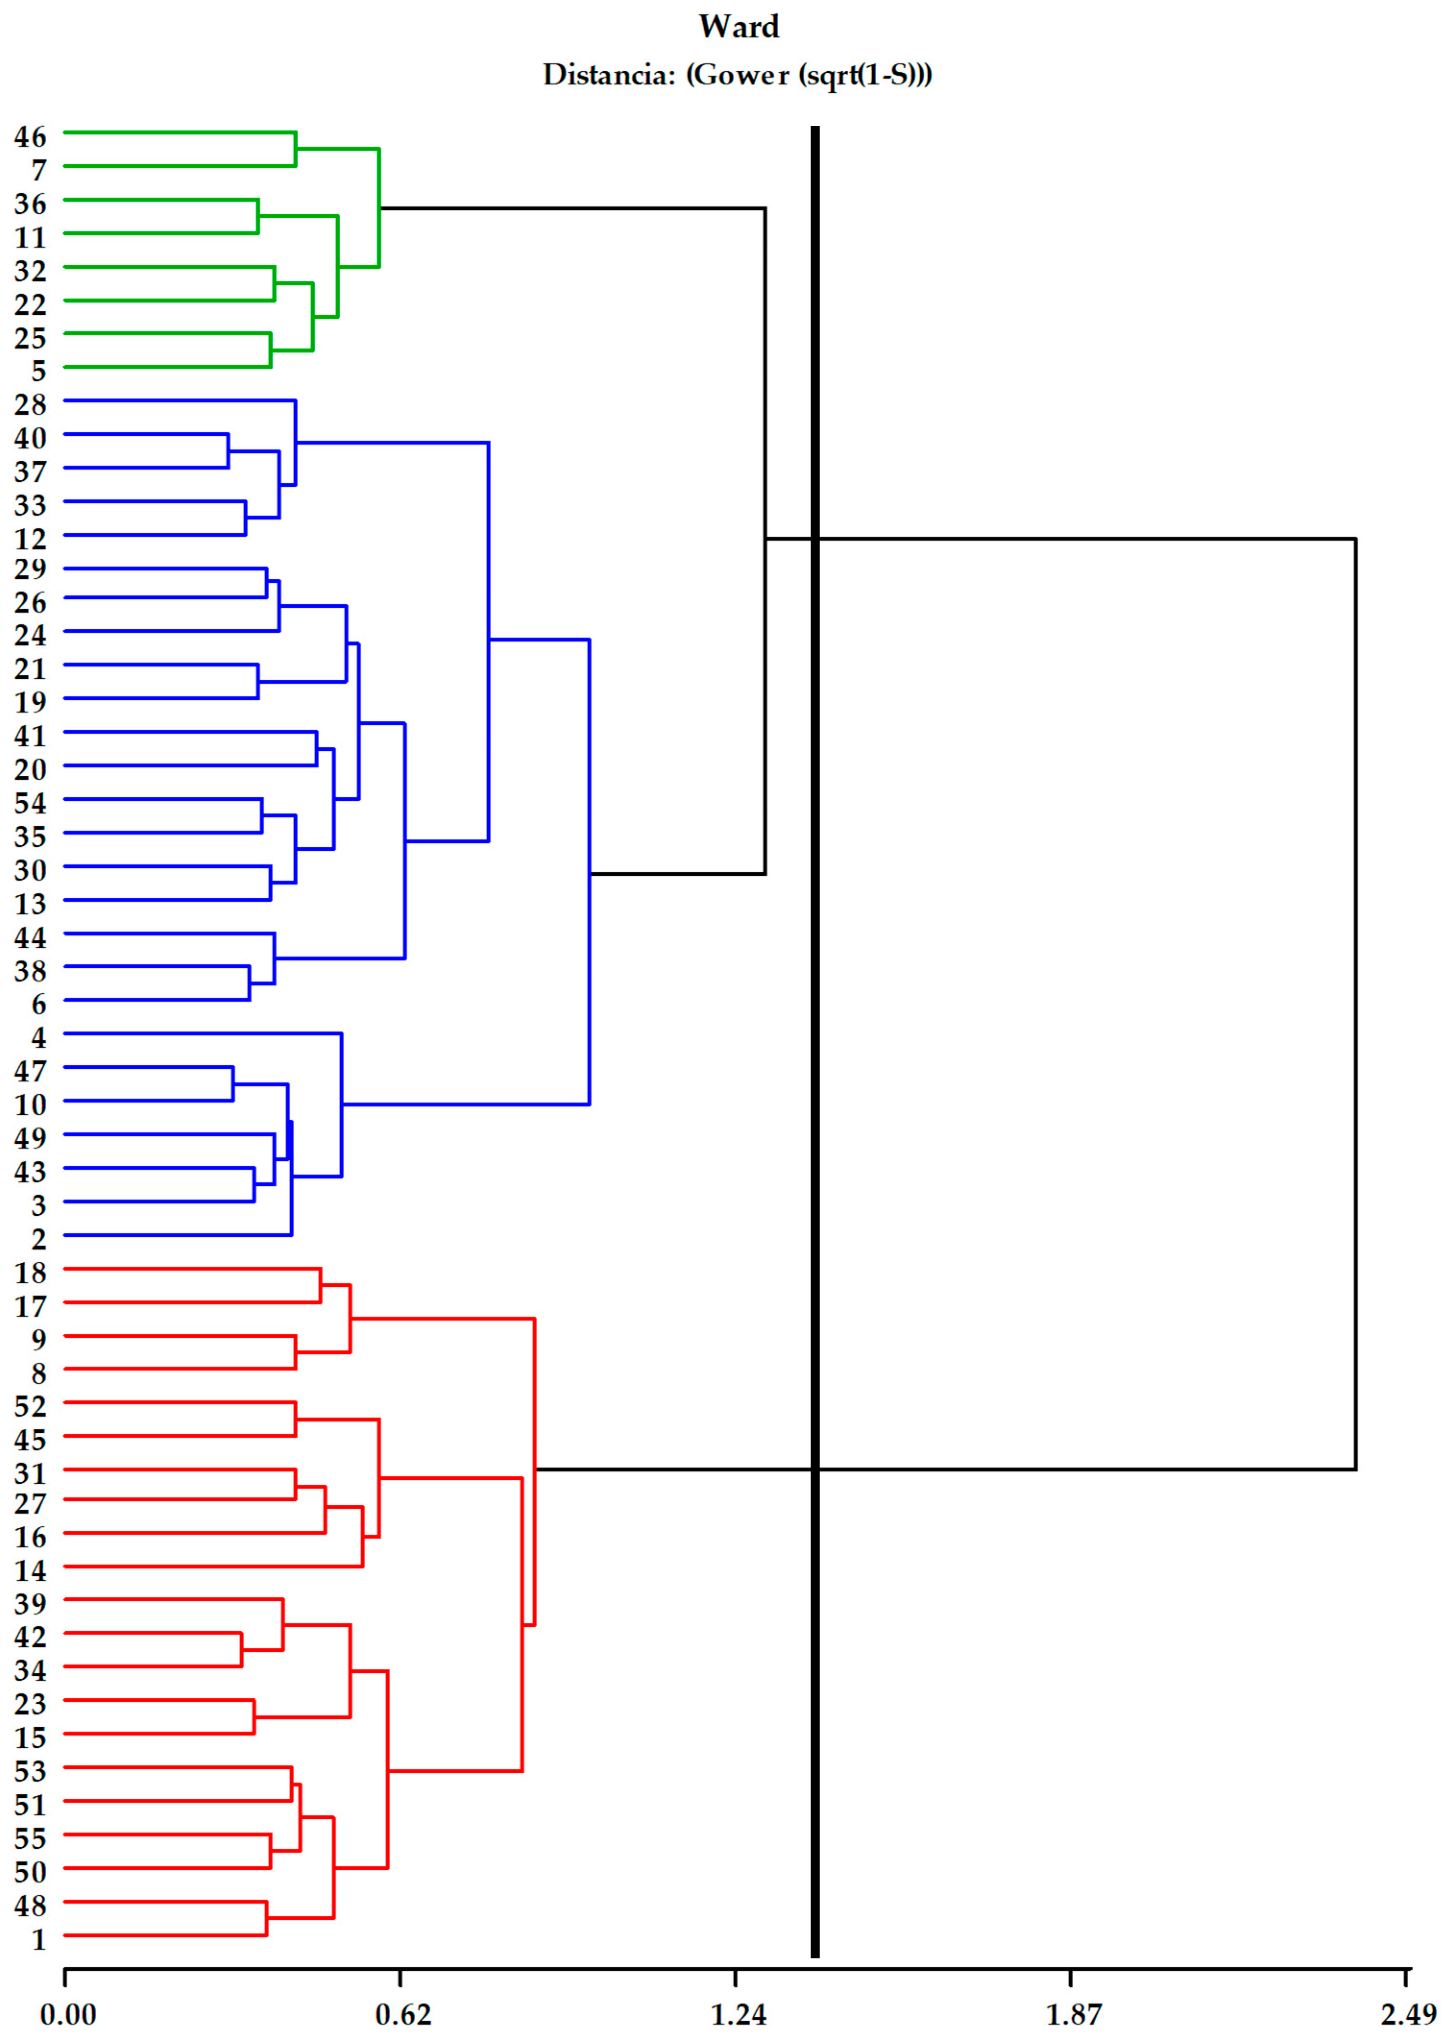
The clustering structure of the 55 Opuntia ficus-indica accessions was determined through hierarchical classification analysis applying Ward’s method with Gower distances (Figure 5). The cophenetic correlation coefficient of the dendrogram was r = 0.63 (p < 0.001), indicating an acceptable fit between the original Gower distance matrix and the dendrogram topology, a value consistent with the application of Ward’s method to non-Euclidean distances [33]. The dendrogram revealed the formation of three morphologically differentiated groups at a cut-off distance of 0.58 Gower units (48.3% of the maximum fusion distance), with internal fusion levels reflecting the degree of phenotypic cohesion among accessions. Group 1 (n = 8), composed exclusively of accessions from Carchi and Ibarra (Imbabura), exhibited the greatest internal homogeneity. Group 2 (n = 26) was the most numerous and displayed a branched internal structure with two distinguishable subclusters, incorporating accessions from all three sampled provinces. Group 3 (n = 21), with notable representation from Pichincha and Imbabura, showed intermediate fusion distances.

3.5.1. Validation of the Optimal Number of Groups

Following the criteria described in Section 2.3.6, the fusion gap at k = 3 (Δ = 0.106) was 6.6-fold larger than at k = 2 (Δ = 0.016), indicating that the partition into three groups introduces substantially more structural information than the two-group solution. From k = 4 onward, fusion gaps declined sharply and monotonically (Δ = 0.033 at k = 4; Table 6), confirming that no partition with k > 3 introduces additional structure. Although the Silhouette and Calinski–Harabász indices were maximized at k = 2 (0.272 and 15.27, respectively), both showed a sharp decline from k = 4 onward with no recovery, confirming that no partition with k > 3 introduces additional structure. For k = 3, the overall Silhouette was 0.169 with positive values across all three groups (G1 = 0.200; G2 = 0.141; G3 = 0.193) and only 2 out of 55 accessions (3.6%) yielding negative coefficients, indicating that k = 3 represents the partition with the greatest structural support and biological coherence, as it distinguishes a geographically restricted morphotype (G1) that k = 2 subsumes without ecological justification.

3.5.2. Group Establishment

Hierarchical cluster analysis enabled the classification of 55 Opuntia ficus-indica accessions into three morphologically differentiated groups, whose composition and geographic distribution are detailed in Table 7. Group 1 (G1) comprised 8 accessions, originating exclusively from the cantons of Bolívar and Mira (Carchi) and Ibarra (Imbabura), reflecting a restricted and relatively homogeneous geographic distribution. Group 2 (G2), the most numerous with 26 accessions, exhibited the broadest geographic range, incorporating materials from all three sampled provinces—Carchi (Bolívar, Mira), Imbabura (Ibarra, Atuntaqui, Urcuquí, Pimampiro), and Pichincha (Quito, Cayambe)—consistent with its greater phenotypic heterogeneity. Group 3 (G3), with 21 accessions, also spanned all three provinces, with notable representation from Pichincha (Quito, Cayambe) and the cantons of Ibarra, Mira, Urcuquí, and Pimampiro. The three morphotypic groups were distributed across the full altitudinal gradient sampled in this study.
The morphological differentiation among the three groups was statistically confirmed through Kruskal–Wallis tests applied independently to each quantitative variable (Table 8). Significant differences among groups were detected for eight of the ten evaluated variables. The strongest discrimination was observed for longest spine length (H(2) = 28.54, p < 0.001), number of seeds per fruit (H(2) = 24.10, p < 0.001), fruit weight (H(2) = 23.06, p < 0.001), and cladode length (H(2) = 17.06, p < 0.001).
Dunn’s post hoc comparisons with Bonferroni correction (Table 9) revealed that G1 and G2 did not differ significantly from each other in any of the 10 evaluated variables (p > 0.05 in all cases). G3 differed significantly from both G1 and G2 in fruit weight (p < 0.001), fruit length (p < 0.05), fruit diameter (p < 0.01), cladode length (p < 0.05), and number of seeds per fruit (p < 0.001). For longest spine length, G3 differed significantly from both G1 (p = 0.013) and G2 (p < 0.001), while G1 and G2 were statistically indistinguishable (p = 1.000). For 100-seed weight, G2 showed the highest values and differed significantly from G3 (p = 0.001), while G1 occupied an intermediate position (ab). Cladode diameter and exocarp thickness showed no significant differences among groups (p = 0.791 and p = 0.623, respectively).

3.6. Morphotypic Characterization of Accession Groups

The hierarchical cluster analysis (Ward’s method, Gower distance) applied to the combined quantitative and qualitative morphological descriptors yielded three morphologically distinct groups (G1, n = 8; G2, n = 26; G3, n = 21), which differed consistently in fruit size, vegetative structure, spinescence, and reproductive output (Table 7).
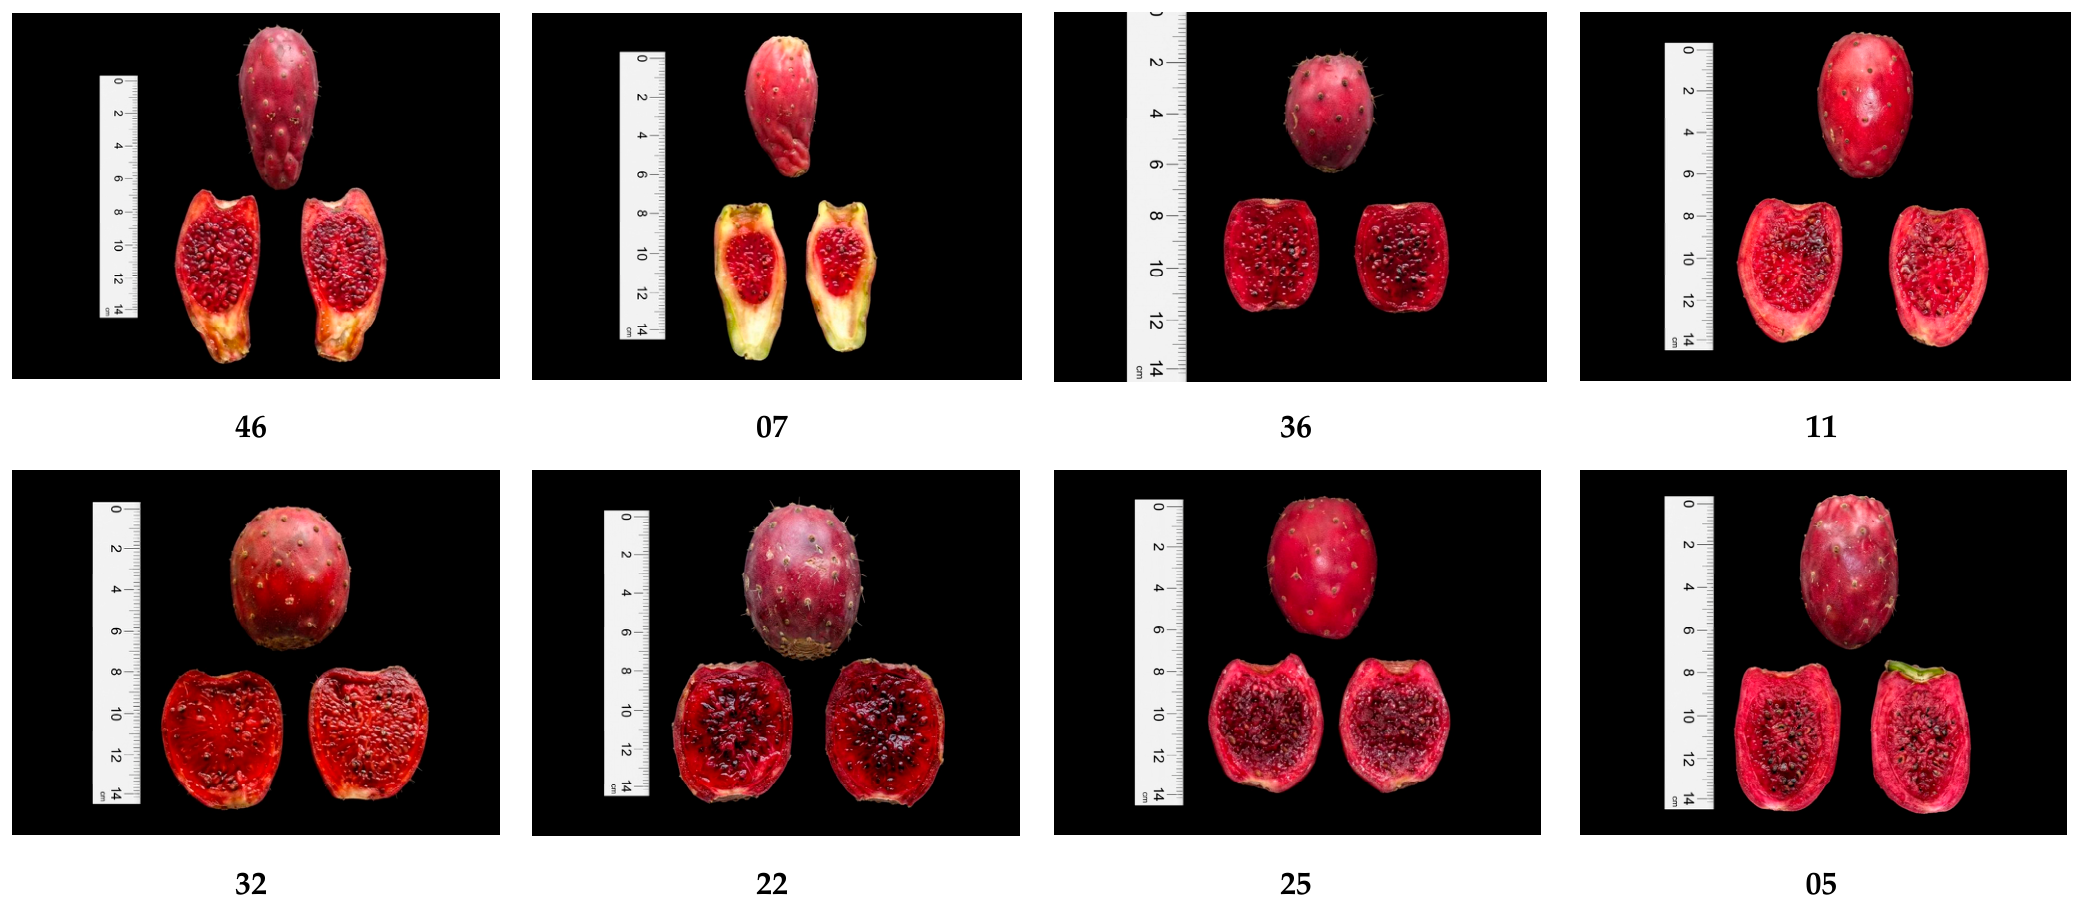
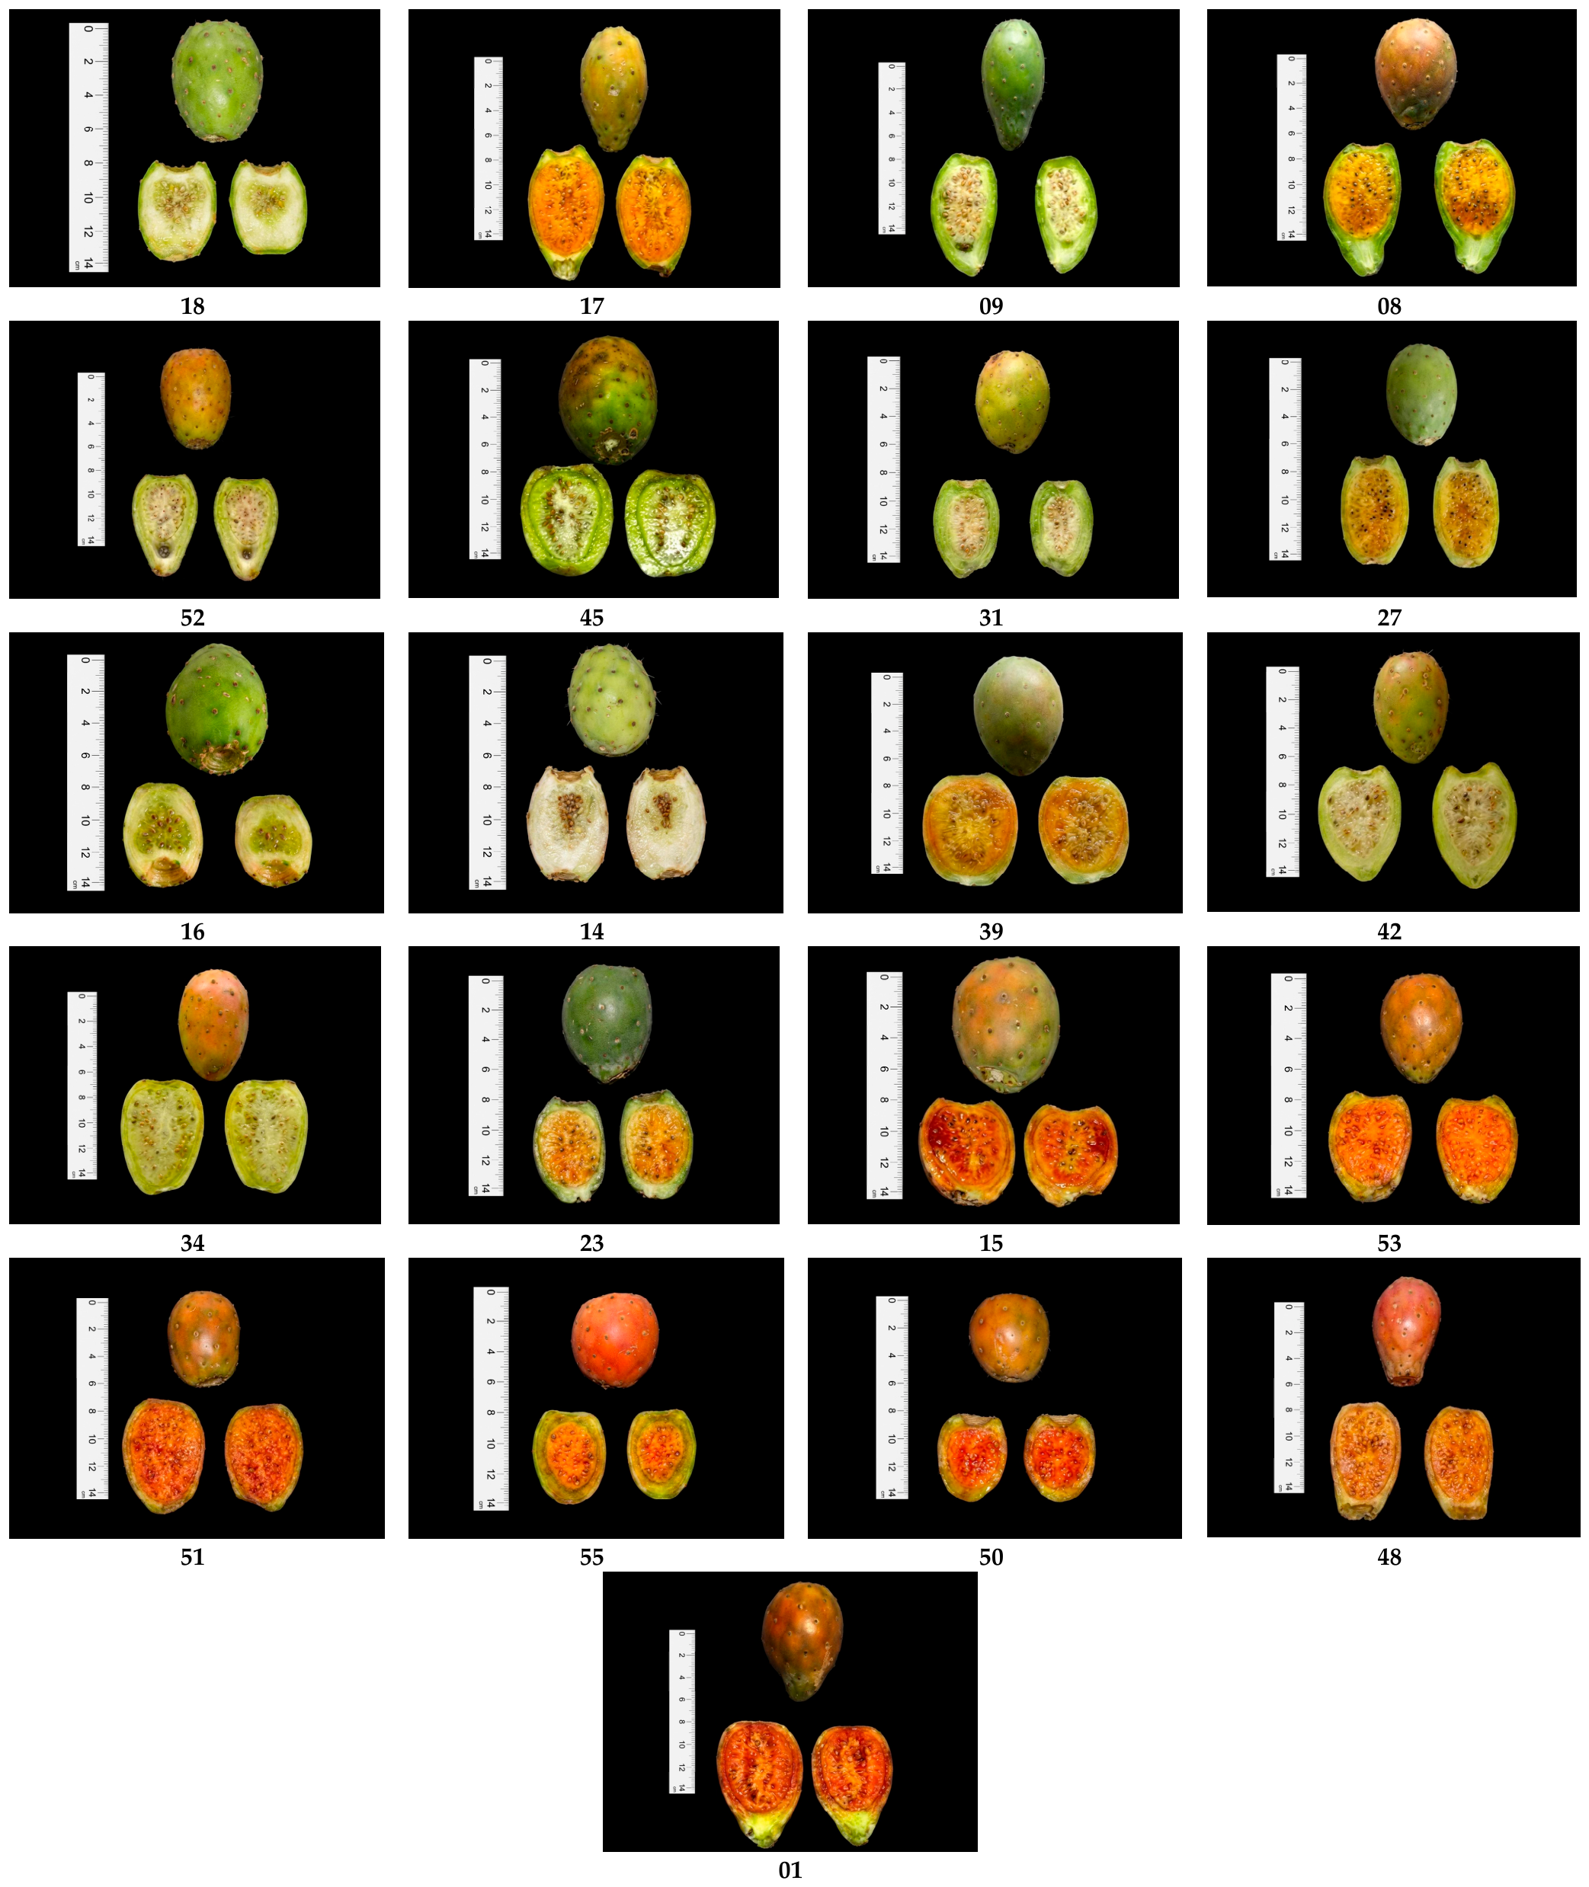
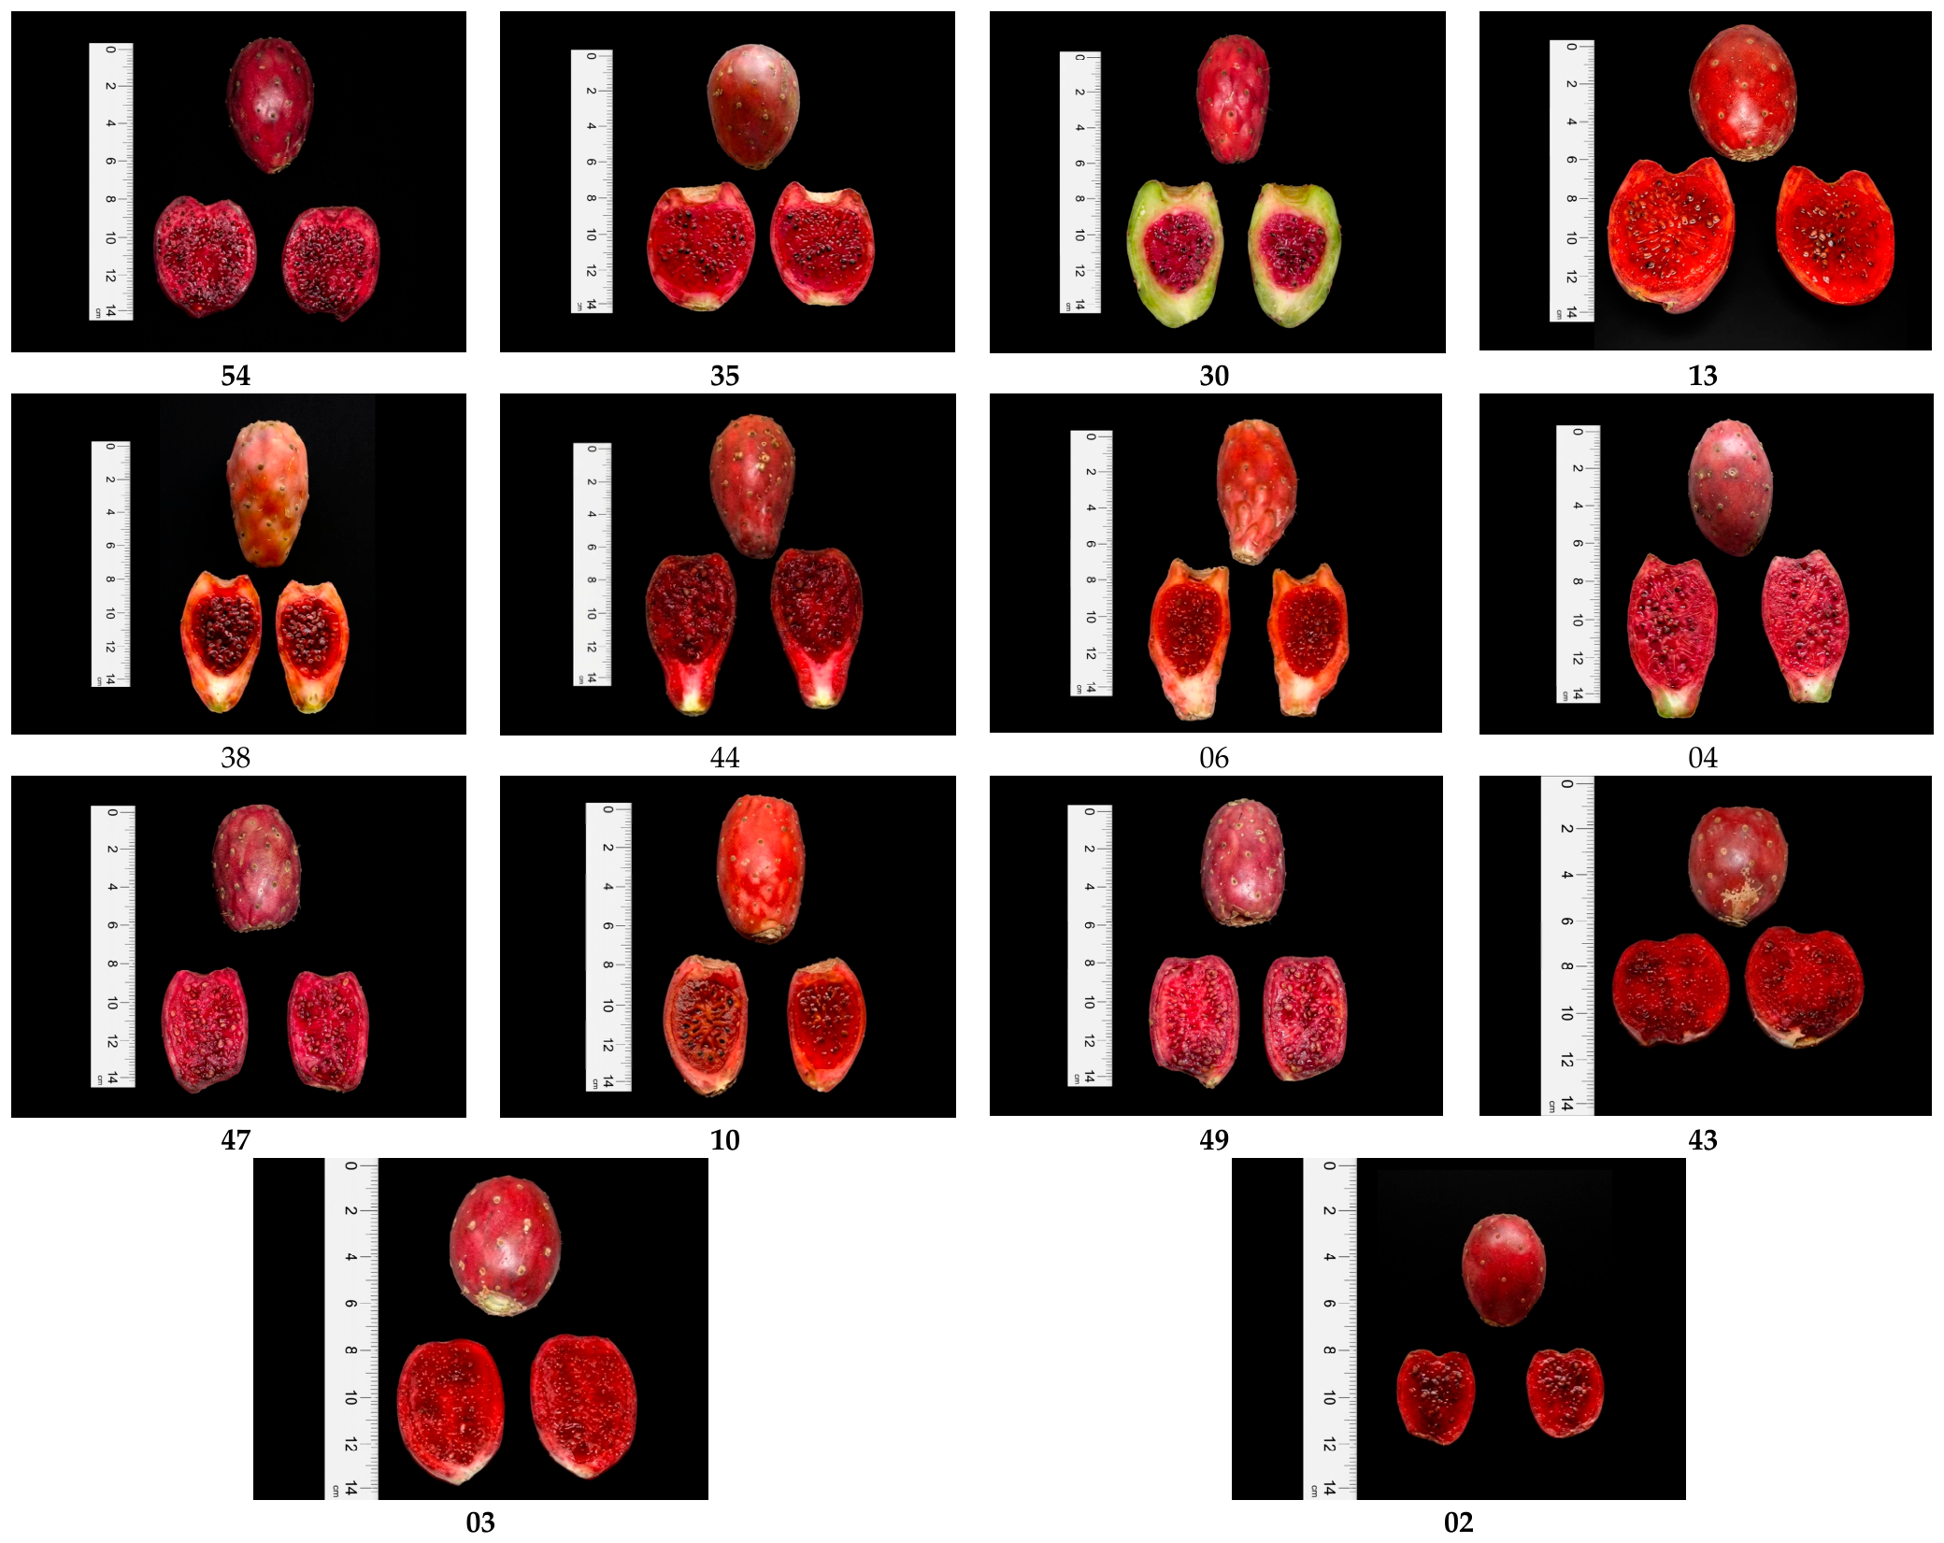
Group 1 (G1)—Small-fruited, spinescent morphotype (Figure 6). This group comprised eight accessions collected predominantly from the dry inter-Andean valleys of Carchi province (Bolívar and Mira cantons) and, to a lesser extent, Ibarra (Imbabura). G1 accessions were characterized by the smallest fruit size among the three groups, with a mean fruit weight of 59.97 ± 28.88 g (range: 28.8–109.0 g), mean fruit length of 6.25 ± 1.8 cm, and fruit diameter of 4.38 ± 0.83 cm. Rectangular fruit shape was the most frequent morphology (50% of accessions). Cladodes were moderate in size (33.9 ± 4.1 cm length; 19.3 ± 3.1 cm diameter) and exhibited comparatively high spinescence, with the longest spine averaging 2.46 ± 1.0 cm. Seed number per fruit was the lowest of the three groups (138 ± 113 seeds/fruit), while the weight of 100 seeds was relatively high (1.44 ± 0.51 g), suggesting fewer but heavier seeds. Pulp coloration was predominantly light, concentrated in categories 1, 3, and 6 of the RHS scale. Petal color was moderately variable across categories 7, 11, 14, 18, 19, and 22.
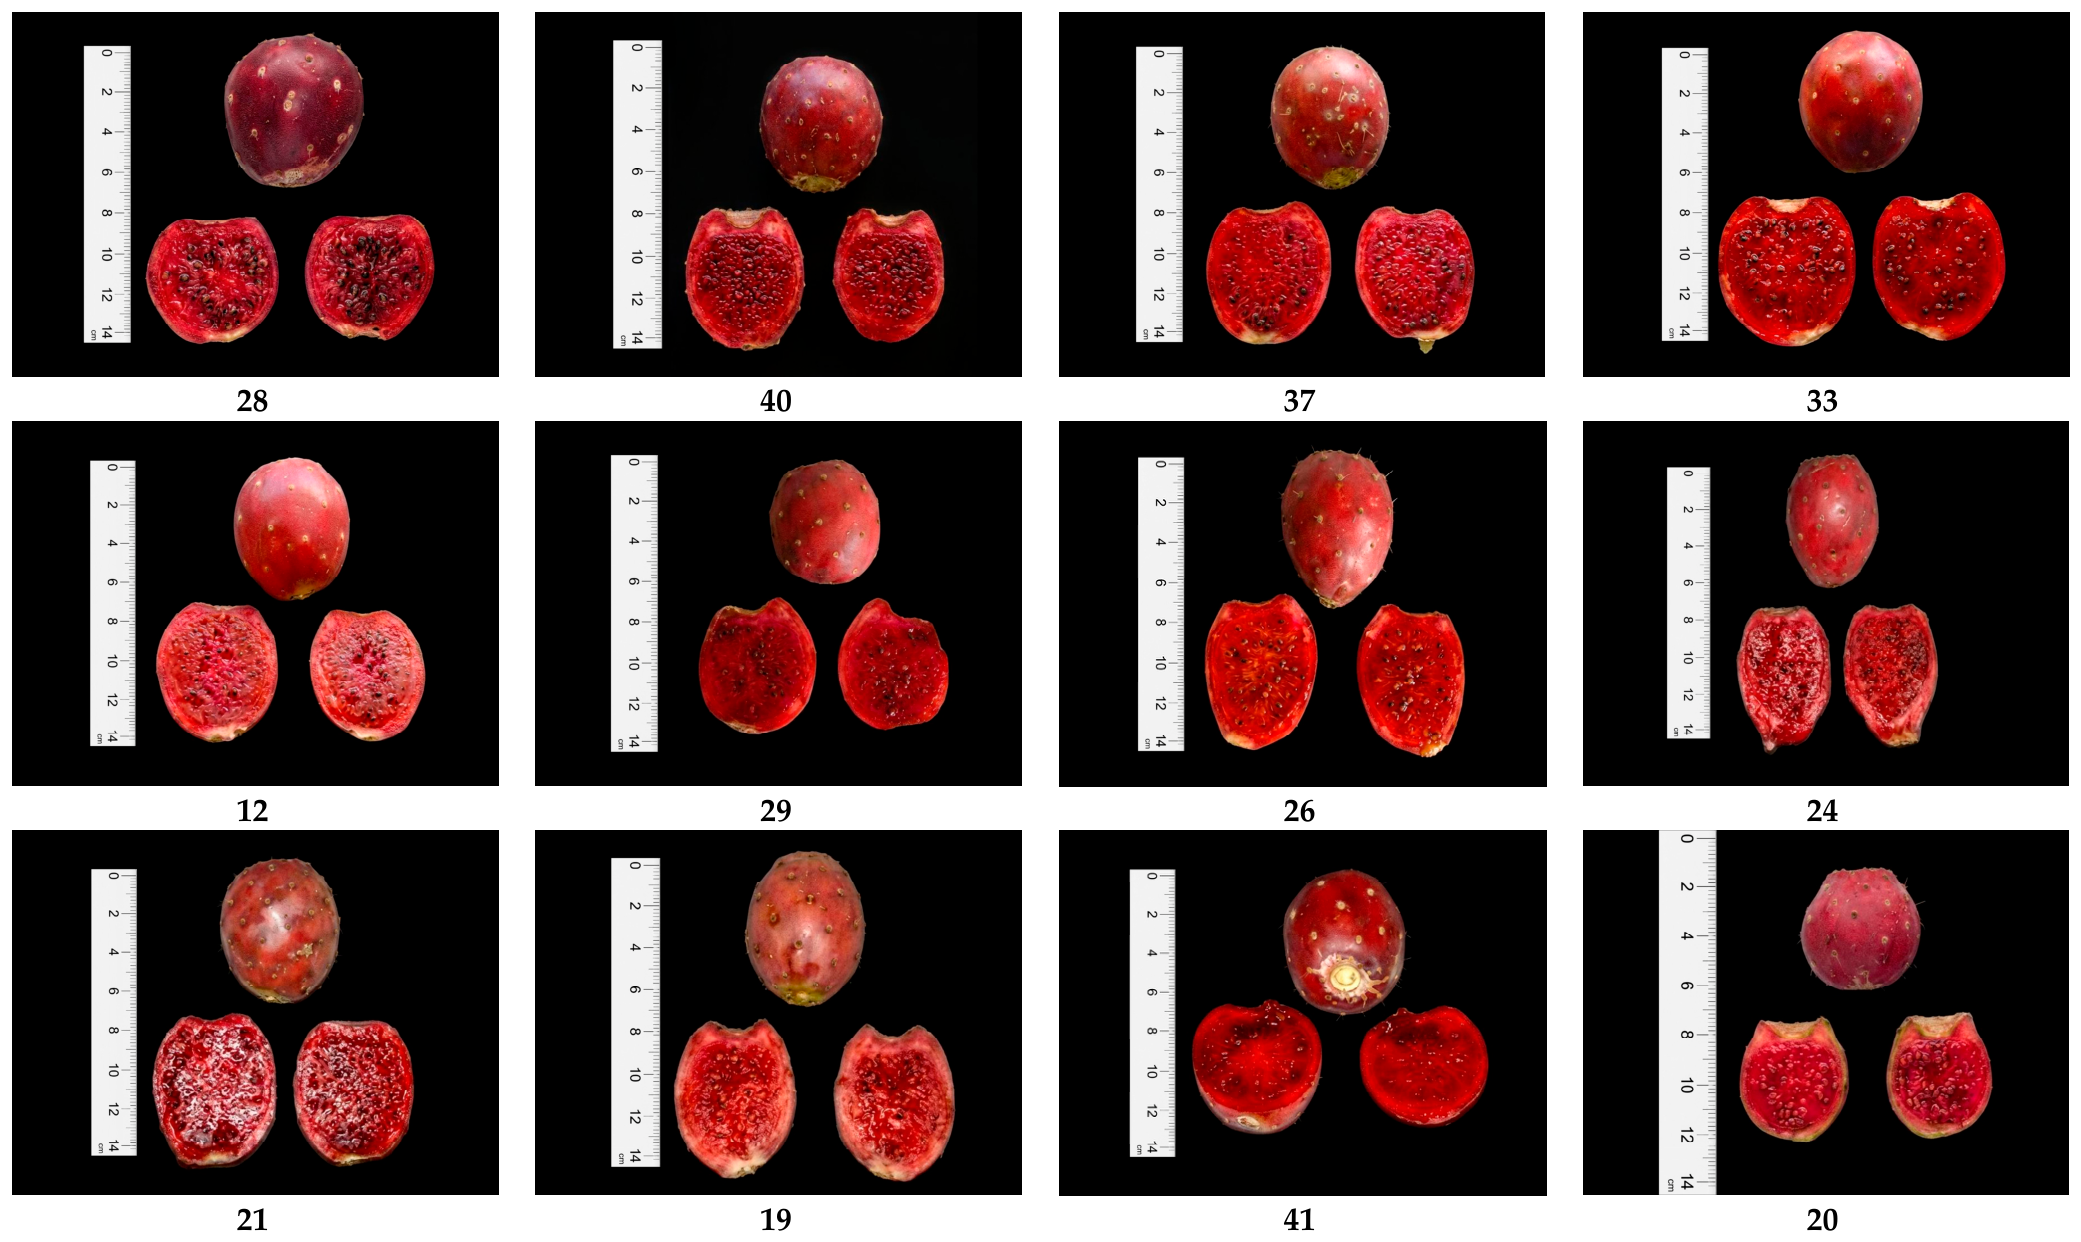
Group 2 (G2)—Intermediate, morphologically diverse morphotype (Figure 7). G2 was the largest group and the most phenotypically variable, including 26 accessions distributed across all three sampled provinces (Carchi, Imbabura, and Pichincha). Fruit weight was intermediate (74.48 ± 20.99 g; range: 26.3–135.0 g), with mean fruit length of 6.25 ± 1.00 cm and diameter of 4.90 ± 0.65 cm. Fruit shape distribution was the most diverse, with approximately equal representation of oval (n = 8), rectangular (n = 8), and spherical (n = 6) forms. Cladodes showed the shortest mean length (32.98 ± 5.30 cm) but the highest spinescence (2.88 ± 0.70 cm longest spine), consistent with the PCA gradient contrasting defensive and productive descriptors. Seed number per fruit averaged 155.94 ± 78.00. The weight of 100 seeds was the highest among groups (1.50 ± 0.44 g). Cladode color was the most broadly distributed across RHS categories (codes 1–18), and pulp color spanned a wide chromatic range, reflecting the high phenotypic diversity of this morphotype. G2 included accession 41 (Urcuquí), which recorded the highest fruit weight within Group 2 (135.0 g).
Group 3 (G3)—Large-fruited, low-spinescence morphotype (Figure 8). Group 3 comprised 21 accessions spanning all three provinces, with notable representation from Pichincha (Quito, Cayambe). This group was defined by the largest fruit dimensions recorded in the study: mean fruit weight of 113.23 ± 29.97 g (range: 68.0–166.0 g), mean fruit length of 7.67 ± 1.46 cm, and fruit diameter of 5.55 ± 0.71 cm. Spherical fruit shape was predominant (9 accessions), followed by lanceolate (6 accessions). Cladodes were the longest of the three groups (39.48 ± 4.84 cm), while spinescence was markedly reduced (mean longest spine: 1.28 ± 0.67 cm), consistent with the negative relationship between spine length and fruit size identified in the Pearson correlation analysis and the PCA. Seed number per fruit was substantially higher in G3 (312.00 ± 122.12 seeds/fruit; range: 98–678), while seed weight was the lowest recorded across the collection (1.08 ± 0.38 g). Pulp coloration was notably diverse, distributed across a broad range of RHS categories (codes 10–23), encompassing tonalities from pale yellow-green to deep red-purple. Accession 14 (Pimampiro, Imbabura) recorded the maximum seed count of the entire collection (678 seeds/fruit), while accession 8 (Bolívar, Carchi) registered the maximum fruit weight of the entire collection (166 g).
Taken together, the three morphotypes described a morphological pattern of two contrasting poles rather than a strictly linear gradient. Regarding spinescence, G1 and G2 did not differ statistically from each other (longest spine: 2.46 ± 1.0 cm and 2.88 ± 0.70 cm, respectively; Dunn’s test, p = 1.000; Table 9), both being significantly spinier than G3 (1.28 ± 0.67 cm; p < 0.001 in both comparisons). Regarding fruit weight, however, the three groups formed a clearer increasing sequence, with G1 showing the lowest values (59.97 ± 28.88 g), G2 intermediate values (74.48 ± 20.99 g), and G3 the highest (113.23 ± 29.97 g; Table 8). This dissociation indicates that spinescence and fruit size, while negatively correlated overall (Section 3.2), do not covary identically across all three morphotypes: G2 combines intermediate fruit size with the highest mean spinescence of the collection, distinguishing it from a simple G1→G2→G3 continuum.

3.7. Qualitative Descriptor Analysis

The morphotypic groups (G1, G2, G3) used throughout this section were defined by Ward–Gower hierarchical clustering (Section 3.5), and their qualitative structure was previously explored through Multiple Correspondence Analysis (MCA; Section 3.4). Building on these results, this section quantifies the internal diversity of each qualitative descriptor within each group using the Shannon–Weaver (H’) and Pielou (J’) indices, complementing the multivariate PCA (Section 3.3, for quantitative traits) and MCA (Section 3.4, for qualitative traits) analyses reported earlier.
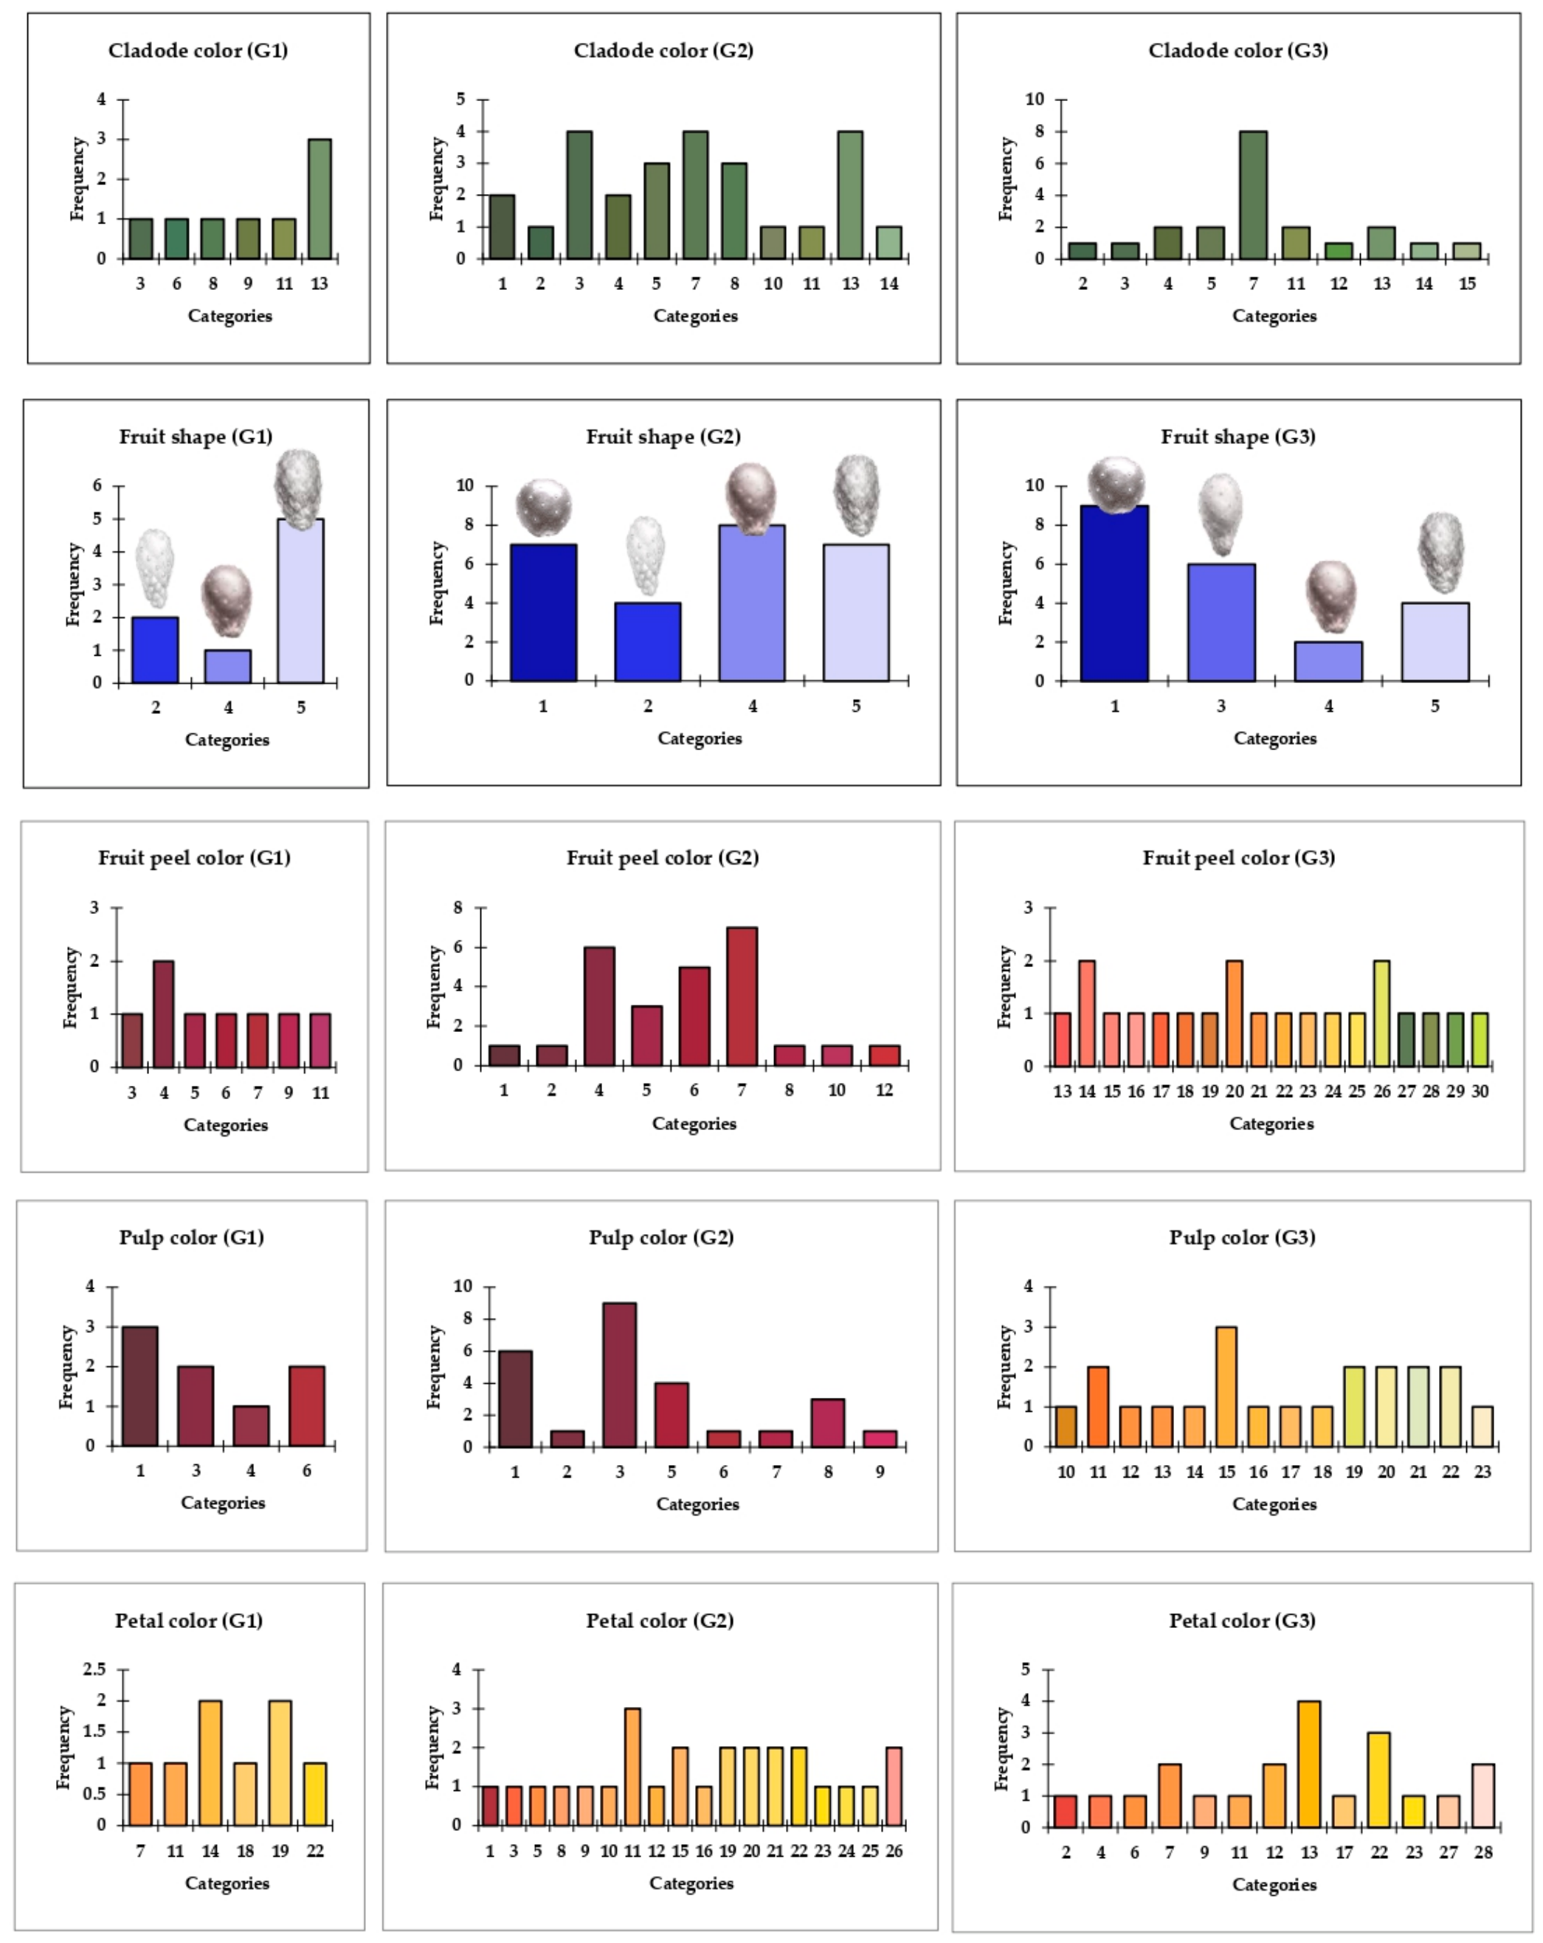
Qualitative descriptors showed consistent distributional differences among the three morphotypes (Figure 9; Table 10). Fruit shape was the most discriminating trait: G1 was dominated by rectangular shapes (63%), G2 exhibited the greatest diversity with nearly equal representation of oval, rectangular, spherical, and elliptical categories, and G3 was characterized by the predominance of spherical shape (43%), constituting a clear qualitative gradient aligned with Dimension 1 of the MCA.
Chromatic diversity of fruit descriptors was greatest in G3, which presented the widest range of peel color (S = 18 RHS categories; H’ = 2.85) and the most heterogeneous pulp coloration (categories 10–23, ranging from pale yellow-green to deep red-purple; H’ = 2.56)—attributes of direct commercial relevance for product diversification. In contrast, G2 showed the greatest diversity in vegetative and ornamental descriptors, with the broadest ranges of cladode color (H’ = 2.26) and petal color (H’ = 2.81), consistent with its wider geographic distribution across all three sampled provinces. G1 exhibited the lowest chromatic diversity in four of the five evaluated descriptors (cladode color, fruit shape, pulp color, and petal color); for peel color, G1 (H’ = 1.91) and G2 (H’ = 1.88) showed comparably low and statistically indistinguishable diversity, both markedly lower than G3 (H’ = 2.85). Pielou’s evenness values were consistently high across all descriptors and groups (J’ = 0.82–0.98; Table 10), indicating that the observed categories were distributed nearly uniformly within each group, with no dominance by one or two frequent categories.
Cladode color and petal color showed no significant differences among groups in either ordinal or chi-square analyses (p > 0.05; Table 5), reflecting high intragroup chromatic heterogeneity rather than intergroup differentiation, consistent with their limited contribution to MCA axis separation. Complete frequency distributions by RHS category and group are presented in Figure 9.
Overall, the diversity analysis reveals a character-specific pattern: G2 represents the most diverse morphotype with respect to vegetative and ornamental characters (cladode color, fruit shape, petal color), whereas G3 exhibits the greatest chromatic diversity in fruit-related characters (peel and pulp color).

4. Discussion

4.1. Breadth and Structure of Phenotypic Variability

The wide range of phenotypic variation observed across the 55 accessions of Opuntia ficus-indica from the inter-Andean valleys of northern Ecuador (CV: 15.88–59.77%) is consistent with the high morphological plasticity that characterizes the species, as documented in germplasm collections from other biogeographic regions. Studies on Tunisian collections reported coefficients of variation exceeding 40% for reproductive and seed characters assessed [50]; similarly, a comparative morphological analysis of Moroccan Opuntia genotypes identified spine number, spine length, and seed-related traits (seed weight and number of fully developed seeds per fruit) as the most discriminant and highly variable quantitative descriptors (p < 0.001) [51], while research on Algerian and Moroccan accessions confirmed that spine- and seed-related descriptors exhibit the greatest relative variability within the species [16,52].
The greater stability recorded for cladode dimensions (CV: 16–19%) relative to reproductive and defensive characters (CV: 35–60%) mirrors the pattern described by Reyes-Agüero et al. (2005) for wild and cultivated collections from Mexico: primary vegetative organs, subject to stricter structural and physiological constraints, display lower phenotypic variance than descriptors directly linked to reproductive success or plant–herbivore interactions [7]. Recent studies on Ethiopian populations likewise confirmed that qualitative characters such as pulp color and cladode shape exhibit altitudinally structured distributions, with orange coloration predominating at lower elevations and red at intermediate altitudes, suggesting a differential environmental effect on these chromatic descriptors [17,53].
The high variability in seed number per fruit (CV = 59.77%; range: 43.67–678 seeds) exceeds that reported by Barbera et al. (1994) for the Italian cultivars ‘Gialla’ and ‘Rossa’ (CV ≈ 35–40%) [54], suggesting that Ecuadorian Andean germplasm retains a level of reproductive diversity greater than that of commercial varieties subjected to prolonged selection. This outcome is expected given that the majority of the evaluated accessions correspond to semi-wild or naturalized forms under limited artificial selection pressure, in contrast to commercial cultivars subjected to systematic breeding aimed at reducing seed content [55]. Similarly, the high variability in spine length (CV ≈ 47–48%) is consistent with the absence of consistent agronomic selection toward spinelessness, a trait found exclusively in the most advanced horticultural cultivars [7,56].

4.2. Defensive–Reproductive Trade-Off and the Primary Axis of Differentiation

The first principal component (PC1 = 31.31%) defined the central axis of morphological differentiation as a functional opposition between investment in defensive structures—longest spine length (loading: +0.4776)—and reproductive output—seed number per fruit (loading: −0.4474) and fruit weight (loading: −0.3904). This inverse relationship was confirmed by the significant negative correlation between longest spine length and fruit weight (r = −0.562; p < 0.001), and is phenotypically expressed most clearly in the contrast between G3 (low spinescence, large fruit) and the combined G1–G2 pool (high, statistically indistinguishable spinescence; Table 9), which together account for the two poles of the trade-off. Notably, G2—not G1—recorded the numerically highest mean spinescence of the collection (2.88 ± 0.70 cm), despite bearing larger fruit than G1 (74.48 ± 20.99 g vs. 59.97 ± 28.88 g); this indicates that the defensive–reproductive trade-off operates most strongly at the extremes of the gradient (G3 vs. G1/G2) rather than as a strictly monotonic progression across all three morphotypes. This pattern is consistent with the resource allocation trade-off hypothesis between physical defense and reproductive investment proposed for perennial plants in water-limited environments [57,58]. López-Palacios et al. (2019) documented for Mexican populations of O. ficus-indica that spinier forms consistently bear smaller fruits, in agreement with the results reported here [59]. This pattern of separation between spiny and spineless forms was also documented by Peña-Valdivia et al. (2008) in a multivariate analysis of 46 Mexican accessions of Opuntia spp., in which cladode length and width and spine presence constituted the descriptors with the greatest discriminant power in the first principal component [60], in line with the PC1 axis structure observed in the present study.
The domestication process in the genus Opuntia has historically followed a trajectory favoring spine reduction and increased fruit size—descriptors that are opposed along the PC1 axis of the present study [7,59]. López-Palacios et al. (2019) characterized 114 samples from 17 Opuntia species from the Mexican highlands and concluded that domestication operates as a continuous gradient of morphological change in fruits and seeds, with spinescence being one of the primary characters under artificial selection pressure [59]. From this perspective, morphotype G3—dominated by accessions from Pichincha and Imbabura bearing larger fruits (113.23 ± 29.97 g) and shorter spines (1.28 ± 0.67 cm)—may represent a more advanced domestication stage than G1 and G2, whose materials—predominantly from Carchi and, for G2, from all three provinces—retain compara-bly high spinescence (2.46–2.88 cm) and smaller fruits (59.97–74.48 g) relative to G3. This interpretation is consistent with the agroecological history of the Ecuadorian inter-Andean valleys, where Imbabura and Pichincha have a more consolidated tradition of prickly pear cultivation for local markets than the Bolívar region (Carchi), where semi-wild forms on degraded hillsides predominate [7].

4.3. Identified Morphotypes and Their Agronomic Interpretation

Morphotype G3 consistently exhibited the highest values for fruit weight (113.23 ± 29.97 g), cladode length (39.48 ± 4.84 cm), and number of seeds per fruit (312.00 ± 122.12), confirming its superior agronomic potential for fresh fruit production. The mean fruit weight of G3 falls within the “large-fruit” category (≥100 g) defined by Mediterranean commercial standards for cactus pear [55] and exceeds the ranges reported for unselected accessions from Morocco [16] and Algeria [52]. In contrast, the lower 100-seed weight recorded for G3 (1.08 ± 0.38 g), compared with G2 (1.50 ± 0.44 g), is consistent with the size–number trade-off previously described for Italian cactus pear cultivars, whereby larger fruits contain a greater number of seeds with lower individual mass [54]. This pattern suggests contrasting reproductive allocation strategies among morphotypes, with G3 allocating resources toward the production of a larger number of lighter seeds, whereas G2 invests in fewer but individually heavier seeds. From a breeding perspective, G2 accessions characterized by high 100-seed weight (accessions 41, 28, and 40) constitute promising parental material for improving seed-related traits while maintaining favorable fruit size [55].
Morphotype G1, geographically restricted to the cantons of Bolívar and Mira (Carchi Province) and Ibarra (Imbabura Province), represented the most phenotypically homogeneous group and exhibited the highest degree of spinescence. Its restricted geographic distribution, together with its marked phenotypic coherence, suggests that these accessions may correspond to semi-wild forms (sensu Section 1) subjected to lower levels of human selection and management and potentially adapted to the drier environments along the altitudinal gradient. This interpretation agrees with studies conducted in northern Algeria, where spiny O. ficus-indica accessions with relatively small fruits were predominantly associated with more arid environments and where spine density and spine length were significantly correlated with precipitation patterns [52]. Similar relationships between spinescence, minimum temperature, and annual precipitation have also been documented in naturalized Opuntia populations from the Algerian steppe [61]. The concentration of G1 in the driest valleys of Carchi (1381–2100 m a.s.l.; 350–500 mm annual precipitation) further supports the hypothesis that environmental gradients contribute to shaping the phenotypic structure of the Ecuadorian germplasm collection. From the standpoint of genetic resource conservation, maintaining these morphotypes in ex situ collections is particularly valuable because accessions with greater spinescence have been reported to exhibit enhanced tolerance to water-limited conditions under field environments [62].
Morphotype G2, the largest and most phenotypically heterogeneous group, included accessions from all three sampled provinces and exhibited the highest mean 100-seed weight (1.50 ± 0.44 g), together with the greatest diversity in cladode color, fruit shape, and petal color. This broad phenotypic variability is consistent with its wide geographic distribution and suggests that G2 comprises germplasm of diverse origins exposed to different selection histories and management practices. Similar patterns have been reported in ex situ germplasm collections from Morocco and Tunisia, where the most diverse morphotypes also included the largest number of accessions originating from multiple localities, reflecting the long-term exchange of vegetative propagules among traditional production systems [16].

4.4. Discriminant Power of Morphological Characters

Among the qualitative descriptors, peel color and pulp color exhibited the highest discriminant capacity among morphotypes (Cramér’s V = 0.822 and 0.805, respectively), whereas cladode color and petal color did not differ significantly among groups (p > 0.05). Similar results have been reported in Opuntia germplasm from Tenerife (Canary Islands), where canonical discriminant analysis classified accessions primarily according to pulp color, while cladode color contributed only marginally to group discrimination [63]. Likewise, evaluation of five Opuntia species from the Algerian steppe demonstrated that only a limited subset of the 49 UPOV morphological descriptors—including flower length and longest spine length—provided substantial discriminatory power in multivariate analyses [18]. Comparable findings have also been reported for Mexican commercial germplasm, where fruit- and seed-related descriptors exhibited the greatest ability to differentiate cultivar groups [64]. Collectively, these studies support the present results and indicate that reproductive traits generally provide greater discriminatory power than vegetative characters for the characterization of Opuntia germplasm.
The high intra-group variability observed for cladode color and petal color, reflected in both the MCA biplot and the elevated Shannon diversity values (H′ = 1.67–2.81), suggests that these traits are more strongly influenced by environmental conditions than by genetic differentiation. In contrast, peel and pulp color are largely determined by betalain biosynthesis, a genetically regulated metabolic pathway, making these characters more reliable indicators of phenotypic differentiation among morphotypes [65,66].
Fruit shape was the qualitative descriptor most strongly associated with morphotype membership (χ2(8) = 24.40; p = 0.002; Cramér’s V = 0.471), revealing a gradual transition from predominantly rectangular fruits in G1 to mainly spherical fruits in G3. This pattern agrees with the FAO/CACTUSNET morphological inventory, in which spherical and elliptical fruits predominate among cultivated horticultural genotypes, whereas rectangular and lanceolate forms are more frequently associated with primitive or naturalized populations [13]. From a functional perspective, the predominance of spherical fruits in G3 may also represent an adaptive advantage because, for a given fruit volume, spherical geometry minimizes the surface-to-volume ratio, thereby reducing transpirational water loss during fruit development and postharvest storage [55]. This geometric advantage may contribute to improved fruit quality under the water-limited conditions characteristic of the inter-Andean dry valleys.

4.5. Chromatic Diversity and Agro-Industrial Potential

The high chromatic diversity of pulp color observed in G3 (S = 14 RHS categories; H′ = 2.56), ranging from pale yellow-green to intense red-purple, has important implications for the value chain of O. ficus-indica. Betalains, the pigments responsible for the red, purple, and orange coloration of cactus pear fruits, are bioactive compounds of increasing interest to the food, pharmaceutical, and cosmetic industries because of their antioxidant, antimicrobial, and natural coloring properties [65,66]. Recent studies have demonstrated that the concentrations of betacyanins and betaxanthins in the pulp and peel are closely associated with fruit coloration, with red- and orange-fleshed cultivars consistently exhibiting higher levels of these bioactive compounds and greater antioxidant activity than lighter-colored cultivars [67,68]. Accordingly, G3 accessions displaying deep red to intense purple pulp coloration (RHS categories 18–23) represent promising genetic resources for breeding programs aimed at developing cultivars with enhanced functional and nutraceutical value [66,68].
The relationship between pulp coloration and agro-industrial value has been quantitatively demonstrated in Mexican germplasm, where red- and purple-fleshed cultivars contained up to four times higher betacyanin concentrations than white- and yellow-fleshed cultivars, establishing a clear association between chromatic category and phytochemical composition [69]. Although the present study did not quantify betalain concentrations, the broad chromatic variation observed among the Ecuadorian accessions suggests considerable potential for future biochemical screening and the identification of genotypes with high-value nutraceutical attributes.
Chromatic diversity was also evident for petal color (H’ = 1.73–2.81, depending on the morphotype) and cladode color (H’ = 1.67–2.26). These traits may represent valuable attributes for ornamental and landscape applications, where cactus species are increasingly appreciated because of their low water requirements, drought tolerance, and adaptability to degraded environments. Nevertheless, neither trait differed significantly among morphotypes, indicating that their variation is largely independent of the phenotypic differentiation associated with productive traits. Consequently, these ornamental characteristics could be exploited through selection or intra-morphotype breeding without compromising agronomically important attributes.

4.6. Implications for Conservation and Genetic Improvement

The identification of three morphotypes with differentiated phenotypic profiles across the dry valleys of Imbabura, Carchi, and Pichincha provides a robust basis for designing ex situ conservation strategies. G1, whose distribution is restricted to the most arid valleys of Carchi and which exhibits high internal phenotypic homogeneity, constitutes a genetic pool of high conservation priority because geographically restricted morphotypes are generally more vulnerable to local disturbances, including land-use change and extreme climatic events [70]. In contrast, G2 represents the largest proportion of the overall phenotypic diversity detected in the collection and should therefore constitute the core component of any conservation collection.
The extreme accessions identified by PCA and MCA—particularly accessions 15, 16, 20, 24, 25, and 28—deserve special attention as valuable genetic resources for breeding programs because phenotypically divergent accessions have recently been recognized as promising parental material for broadening the genetic and phenotypic base of cactus pear improvement programs [71]. Among these, accession 41 (Urcuquí, Imbabura; G2), which exhibited the highest fruit weight within G2 (135 g), and accession 14 (Pimampiro, Imbabura; G3), which presented the highest number of seeds per fruit (678), represent extreme phenotypes with potential value for direct selection or as parental lines in breeding programs. Because fruit size and seed-related traits strongly influence commercial performance and postharvest quality, these accessions constitute valuable material for future breeding aimed at improving fruit marketability [72]. Although reducing seed number is generally considered a desirable breeding objective, conserving variability for this trait remains essential for future studies on reproductive biology and genetic improvement.
The present study also contributes to reducing the existing knowledge gap regarding the morphological diversity of O. ficus-indica in Ecuador and provides a valuable baseline for future molecular and ecophysiological research. Such studies will help disentangle the relative contributions of genetic differentiation and environmental factors to the phenotypic variation observed along the altitudinal and climatic gradients of the northern Ecuadorian inter-Andean valleys, as similar environmental effects have recently been reported among contrasting cactus pear ecotypes [73].
Projected climate change scenarios further reinforce the urgency of conserving these genetic resources. Opuntia ficus-indica is increasingly recognized as a climate-resilient crop because of its exceptional ability to maintain productivity under water-limited conditions and its considerable potential for sustainable agriculture in drylands [74]. Accessions exhibiting morphological characteristics closer to wild forms have been reported to show greater tolerance to water deficit under arid production systems. Moreover, recent studies have demonstrated that wild and semi-wild populations preserve distinctive nutritional and phytochemical profiles associated with environmental adaptation [75]. Collectively, these findings emphasize the importance of conserving morphotypes such as G1, not only because of their taxonomic distinctiveness but also because they may harbor adaptive traits of considerable value for future breeding programs and climate-resilient agriculture, consistent with recent international recommendations for the conservation and sustainable utilization of cactus pear genetic resources [76].
Several important questions remain unresolved. First, the extent to which the observed morphotypic structure reflects true genetic differentiation rather than phenotypic plasticity cannot be determined using morphological descriptors alone. Future studies employing molecular markers, such as SSRs or SNPs, will be necessary to establish whether G1, G2, and G3 represent genetically distinct lineages or a single gene pool exhibiting differential phenotypic plasticity across environmental gradients. Similar discrepancies between molecular and morphological clustering have previously been reported in Opuntia germplasm collections [77,78].
Second, the defensive–reproductive trade-off identified along PC1 (Section 4.2) remains hypothetical. Controlled ecophysiological experiments evaluating resource allocation between spine production and fruit development under different levels of water stress would be required to determine whether this trade-off results directly from drought stress or reflects an evolutionary trajectory associated with domestication. Such interpretations are consistent with the contrasting physiological responses observed between wild and domesticated Opuntia under abiotic stress [79], as well as with recent field evidence demonstrating that water limitation significantly modifies cladode physiology and reproductive performance in O. ficus-indica [80].
Although the chromatic diversity identified in G3 (Section 4.5) suggests potential variation in betalain composition, this hypothesis remains indirect because no biochemical analyses were performed. Quantification of betacyanin, betaxanthin, phenolic compounds, and antioxidant capacity will therefore be necessary to confirm the nutraceutical potential of the Ecuadorian accessions, particularly considering recent evidence demonstrating that betalain- and phenolic-rich extracts of Opuntia exhibit significant antioxidant and immunomodulatory activities [81]. Integrating molecular characterization, controlled physiological experiments, and biochemical profiling will constitute the next essential step toward fully exploiting the conservation and breeding potential of the Ecuadorian germplasm identified in the present study.
Recent advances in Opuntia research further emphasize that morphological characterization should be integrated with complementary conservation and genetic approaches to maximize the utilization of germplasm collections. Integrating phenotypic evaluation with molecular tools improves the identification of unique genetic resources and supports more efficient conservation and breeding strategies [82,83]. Likewise, recent studies have highlighted that the exploitation of genetic diversity is essential for the development of improved Opuntia cultivars with enhanced adaptation to environmental constraints and increased breeding efficiency [83,84]. Furthermore, advances in in vitro propagation techniques provide valuable tools for the large-scale conservation and multiplication of elite germplasm, complementing both ex situ conservation and genetic improvement programs [6]. Together, these advances reinforce the importance of integrating morphological characterization with molecular and biotechnological approaches to ensure the sustainable conservation and efficient utilization of Opuntia ficus-indica genetic resources.

5. Conclusions

This study provides the first systematic multivariate characterization of Opuntia ficus-indica (L.) Mill. accessions from the dry inter-Andean valleys of northern Ecuador, documenting substantial morphological diversity across 55 accessions. The breadth of phenotypic variation recorded (CV: 15.88–59.77%) is comparable to that of long-established germplasm collections from the Mediterranean Basin and sub-Saharan Africa, underscoring the relevance of inter-Andean dry valleys as reservoirs of intraspecific diversity for this globally important xerophytic crop.
Hierarchical clustering resolved three morphologically and statistically distinct groups: a small-fruited, highly spinescent morphotype (G1) restricted to the most arid sites of Carchi, likely representing semi-wild populations that may retain adaptive descriptors for drought-tolerance breeding; a phenotypically diverse intermediate morphotype (G2) distributed across the full altitudinal gradient; and a large-fruited, low-spinescence morphotype (G3; mean fruit weight: 113.23 ± 29.97 g) consistent with a more advanced domestication trajectory and of greatest agronomic interest for fresh-market production. The primary axis of morphological differentiation (PC1 = 31.31%) revealed a significant negative association between spinescence and reproductive output—a morphological gradient consistent with documented domestication patterns in Opuntia, although its mechanistic basis requires ecophysiological confirmation. The strong discriminant power of fruit peel and pulp coloration (Cramér’s V > 0.80) identifies betacyanin-rich accessions as priority materials for nutraceutical applications.
Collectively, these results establish a morphological baseline for O. ficus-indica in Andean agroecosystems and identify priority accessions for ex situ conservation and genetic improvement. Inherent limitations include the absence of molecular markers—which precludes distinguishing genetic differentiation from phenotypic plasticity—the lack of formal environment–morphology modeling, and a sample size (55 accessions, three provinces) that does not fully cover the distribution range. Future work should prioritize: (i) SSR or SNP genotyping of the identified morphotypes to assess genetic structure; (ii) controlled water-stress experiments to quantify phenotypic plasticity; and (iii) multi-site agronomic trials evaluating yield, post-harvest quality, and drought tolerance of G3 accessions under contrasting altitudinal conditions.
These results provide valuable baseline information for future molecular characterization, germplasm conservation, and breeding programs aimed at developing climate-resilient cactus pear cultivars in the tropical Andes.

Author Contributions

Conceptualization, methodology, validation, investigation, resources, writing—review and editing, and project administration, L.V.-H. and G.P.-G.; software, formal analysis, data curation, writing—original draft preparation, and visualization, L.V.-H.; supervision, G.P.-G. All authors have read and agreed to the published version of the manuscript.

Funding

This research was funded by Universidad Técnica del Norte, under the research grant: InvestigaUTN-2025-1473.

Data Availability Statement

The datasets generated and analyzed during the current study are publicly available in the Zenodo repository at https://doi.org/10.5281/zenodo.20835908.

Acknowledgments

The authors express their gratitude to the Universidad Técnica del Norte for providing the facilities that made this study possible. We are grateful to the field collaborators for their dedicated effort, professionalism, and invaluable assistance during the fieldwork activities. Their contribution was fundamental to the successful collection of data under field conditions.

Conflicts of Interest

The authors declare no conflicts of interest.

References

  1. Martins, M.; Ribeiro, M.H.; Almeida, C.M.M. Physicochemical, nutritional, and medicinal properties of Opuntia ficus-indica (L.) Mill. and its main agro-industrial use: A review. Plants 2023, 12, 1512. [Google Scholar] [CrossRef] [Scilit] [PubMed]
  2. Kebede, T.G.; Birhane, E.; Ayimut, K.M.; Egziabher, Y.G. Arbuscular mycorrhizal fungi improve biomass, photosynthesis, and water use efficiency of Opuntia ficus-indica (L.) Miller under different water levels. J. Arid Land 2023, 15, 975–988. [Google Scholar] [CrossRef] [Scilit]
  3. Giraldo-Silva, L.; Ferreira, B.; Rosa, E.; Dias, A.C.P. Opuntia ficus-indica fruit: A systematic review of its phytochemicals and pharmacological activities. Plants 2023, 12, 543. [Google Scholar] [CrossRef] [Scilit] [PubMed]
  4. Naorem, A.; Patel, A.; Hassan, S.; Louhaichi, M.; Jayaraman, S. Global research landscape of cactus pear (Opuntia ficus-indica) in agricultural science. Front. Sustain. Food Syst. 2024, 8, 1354395. [Google Scholar] [CrossRef] [Scilit]
  5. Stavi, I. Ecosystem services related with Opuntia ficus-indica (prickly pear cactus): A review of challenges and opportunities. Agroecol. Sustain. Food Syst. 2022, 46, 815–841. [Google Scholar] [CrossRef] [Scilit]
  6. Touaf, I.; El Finti, A.; Lagram, K.; Serghini, M.A.; El Mousadik, A.; Bouihate, O.; Boudadi, I.; El Merzougui, S.; Bachti, I.; El Boullani, R. Micropropagation in vitro of Opuntia ficus-indica through axillary buds’ proliferation: A review. In Vitro Cell. Dev. Biol.-Plant 2025, 61, 1051–1065. [Google Scholar] [CrossRef] [Scilit]
  7. Reyes-Agüero, J.A.; Aguirre-Rivera, J.R.; Hernández, H.M. Systematic notes and a detailed description of Opuntia ficus-indica (L.) Mill. (Cactaceae). Agrociencia 2005, 39, 395–408. [Google Scholar]
  8. Bueno, R.S.; Badalamenti, E.; Sala, G.; La Mantia, T. A crop for a forest: Opuntia ficus-indica as a tool for the restoration of Mediterranean forests in areas at desertification risk. Front. For. Glob. Change 2024, 7, 1343069. [Google Scholar] [CrossRef] [Scilit]
  9. Plants of the World Online. Opuntia ficus-indica (L.) Mill. Kew Science, Royal Botanic Gardens, Kew. Available online: https://powo.science.kew.org/taxon/urn:lsid:ipni.org:names:1151735-2 (accessed on 24 May 2026).
  10. Niechayev, N.A.; Mayer, J.A.; Cushman, J.C. Developmental dynamics of crassulacean acid metabolism (CAM) in Opuntia ficus-indica. Ann. Bot. 2023, 132, 869–879. [Google Scholar] [CrossRef] [Scilit] [PubMed]
  11. Majure, L.C.; Puente, R.; Griffith, M.P.; Judd, W.S.; Soltis, P.S.; Soltis, D.E. Phylogeny of Opuntia s.s. (Cactaceae): Clade delineation, geographic origins, and reticulate evolution. Am. J. Bot. 2012, 99, 847–864. [Google Scholar] [CrossRef] [Scilit] [PubMed]
  12. Labra, M.; Grassi, F.; Bardini, M.; Imazio, S.; Guiggi, A.; Citterio, S.; Banfi, E.; Sgorbati, S. Genetic relationships in Opuntia Mill. genus (Cactaceae) detected by molecular marker. Plant Sci. 2003, 165, 1129–1136. [Google Scholar] [CrossRef] [Scilit]
  13. Chessa, I.; Nieddu, G. Descriptors for cactus pear (Opuntia spp.). In FAO/CACTUSNET Technical Bulletin No. 6; FAO: Rome, Italy; ICARDA: Rome, Italy, 1997; pp. 1–39. [Google Scholar]
  14. UPOV. Guidelines for the Conduct of Tests for Distinctness, Uniformity and Stability: Cactus Pear and Xoconostles (Opuntia, Groups 1 & 2); International Union for the Protection of New Varieties of Plants: Geneva, Switzerland, 2006. [Google Scholar]
  15. Elhani, A.; Louati, M.; Ben Salem, H.; Salhi-Hannachi, A.; Baraket, G. Morphological variability of prickly pear cultivars (Opuntia spp.) established in ex-situ collection in Tunisia. Sci. Hortic. 2019, 248, 163–175. [Google Scholar] [CrossRef] [Scilit]
  16. Nefzaoui, M.; Lira, M.A.; Boujghagh, M.; Udupa, S.M.; Louhaichi, M. Morphological characterization of cactus pear (Opuntia ficus-indica) accessions from the collection held at Agadir, Morocco. Acta Hortic. 2019, 1247, 163–170. [Google Scholar] [CrossRef] [Scilit]
  17. Teklu, G.W.; Ayimut, K.M.; Abera, F.A.; Egziabher, Y.G.; Fitiwi, I. Phenotypic diversity of cactus pear (O. ficus-indica (L.) Mill.) populations in Tigray, northern Ethiopia, based on qualitative descriptors. Discov. Agric. 2025, 3, 78. [Google Scholar] [CrossRef] [Scilit]
  18. Hadjkouider, B.; Boutekrabt, A.; Lallouche, B.; Lamine, S.; Zoghlami, N. Polymorphism analysis in some Algerian Opuntia species using morphological and phenological UPOV descriptors. Bot. Sci. 2017, 95, 391–400. [Google Scholar] [CrossRef] [Scilit]
  19. Mohamed, E.A.; Sbaghi, M. Morphological and phenological characterization of Moroccan Opuntia cactus varieties (Karama, Ghalia, Belara, Marjana, Cherratia, Angad, and Melk Zhar) resistant to the cactus cochineal Dactylopius opuntiae (Cockerell). J. Prof. Assoc. Cactus Dev. 2023, 25, 115–135. [Google Scholar] [CrossRef] [Scilit]
  20. Inglese, P.; Barbera, G.; La Mantia, T. Research strategies for the improvement of cactus pear (Opuntia ficus-indica) fruit quality and production. J. Arid Environ. 1995, 29, 455–468. [Google Scholar] [CrossRef] [Scilit]
  21. Maiuolo, J.; Nucera, S.; Serra, M.; Caminiti, R.; Opedisano, F.; Macrì, R.; Scarano, F.; Ragusa, S.; Muscoli, C.; Palma, E.; et al. Cladodios de Opuntia ficus-indica (L.) Mill. Poseen importantes propiedades beneficiosas que dependen de sus diferentes etapas de madurez. Plants 2024, 13, 1365. [Google Scholar] [CrossRef] [Scilit] [PubMed]
  22. Nerd, A.; Mizrahi, Y. Reproductive biology of cactus fruit crops. Hortic. Rev. 1996, 18, 321–346. [Google Scholar] [CrossRef] [Scilit]
  23. Inglese, P.; Mondragon, C.; Nefzaoui, A.; Sáenz, C. (Eds.) Crop Ecology, Cultivation and Uses of Cactus Pear; Food and Agriculture Organization of the United Nations and International Center for Agricultural Research in the Dry Areas: Rome, Italy, 2017. [Google Scholar]
  24. Pimienta-Barrios, E. Prickly pear (Opuntia spp.): A valuable fruit crop for the semi-arid lands of Mexico. J. Arid Environ. 1994, 28, 1–11. [Google Scholar] [CrossRef] [Scilit]
  25. Mondragon-Jacobo, C.; Pérez-González, S. (Eds.) Cactus (Opuntia spp.) as Forage; FAO Plant Production and Protection Paper 169; Food and Agriculture Organization: Rome, Italy, 2001; Available online: https://openknowledge.fao.org/server/api/core/bitstreams/6611ef7d-db42-485a-ae81-9058cd7bad25/content (accessed on 4 June 2026).
  26. Kaiser, H.F. An index of factorial simplicity. Psychometrika 1974, 39, 31–36. [Google Scholar] [CrossRef] [Scilit]
  27. Hair, J.F.; Black, W.C.; Babin, B.J.; Anderson, R.E. Multivariate Data Analysis, 8th ed.; Cengage Learning: Hampshire, UK, 2019. [Google Scholar]
  28. Jolliffe, I.T.; Cadima, J. Principal component analysis: A review and recent developments. Philos. Trans. R. Soc. A 2016, 374, 20150202. [Google Scholar] [CrossRef] [Scilit] [PubMed]
  29. Di Rienzo, J.A.; Casanoves, F.; Balzarini, M.G.; Gonzalez, L.; Tablada, M.; Robledo, C.W. InfoStat; Version 2011; Universidad Nacional de Córdoba: Córdoba, Argentina, 2011; Available online: http://www.infostat.com.ar (accessed on 25 May 2026).
  30. Greenacre, M. Correspondence Analysis in Practice, 3rd ed.; CRC Press: Boca Raton, FL, USA; Taylor & Francis Group: Boca Raton, FL, USA, 2017. [Google Scholar]
  31. Le Roux, B.; Rouanet, H. Multiple Correspondence Analysis; Sage Publications: Thousand Oaks, CA, USA, 2010. [Google Scholar]
  32. Gower, J.C. A general coefficient of similarity and some of its properties. Biometrics 1971, 27, 857–871. [Google Scholar] [CrossRef] [Scilit]
  33. Rohlf, F.J. Adaptive hierarchical clustering schemes. Syst. Biol. 1970, 19, 58–82. [Google Scholar] [CrossRef] [Scilit]
  34. Mojena, R. Hierarchical grouping methods and stopping rules: An evaluation. Comput. J. 1977, 20, 359–363. [Google Scholar] [CrossRef] [Scilit]
  35. Rousseeuw, P.J. Silhouettes: A graphical aid to the interpretation and validation of cluster analysis. J. Comput. Appl. Math. 1987, 20, 53–65. [Google Scholar] [CrossRef] [Scilit]
  36. Caliński, T.; Harabasz, J. A dendrite method for cluster analysis. Commun. Stat. 1974, 3, 1–27. [Google Scholar] [CrossRef] [Scilit]
  37. R Core Team. R: A Language and Environment for Statistical Computing; R Foundation for Statistical Computing: Vienna, Austria, 2024; Available online: https://www.R-project.org/ (accessed on 27 May 2026).
  38. Maechler, M.; Rousseeuw, P.; Struyf, A.; Hubert, M.; Hornik, K. Cluster: Cluster Analysis Basics and Extensions, R Package Version 2.1.6; R Foundation for Statistical Computing: Vienna, Austria, 2022; Available online: https://cran.r-project.org/web/packages/cluster/index.html (accessed on 27 May 2026).
  39. Kassambara, A.; Mundt, F. R Package, Version 1.0.7; Factoextra: Extract and Visualize the Results of Multivariate Data Analyses; 2020. Available online: https://CRAN.R-project.org/package=factoextra (accessed on 27 May 2026).
  40. Dunn, O.J. Multiple comparisons using rank sums. Technometrics 1964, 6, 241–252. [Google Scholar] [CrossRef]
  41. Shapiro, S.S.; Wilk, M.B. An analysis of variance test for normality (complete samples). Biometrika 1965, 52, 591–611. [Google Scholar] [CrossRef] [Scilit]
  42. Cramér, H. Mathematical Methods of Statistics; Princeton University Press: Princeton, NJ, USA, 1946. [Google Scholar]
  43. Cohen, J. Statistical Power Analysis for the Behavioral Sciences, 2nd ed.; Lawrence Erlbaum Associates: Hillsdale, NJ, USA, 1988. [Google Scholar]
  44. Shannon, C.E. A mathematical theory of communication. Bell Syst. Tech. J. 1948, 27, 379–423. [Google Scholar] [CrossRef] [Scilit]
  45. Pielou, E.C. Species-diversity and pattern-diversity in the study of ecological succession. J. Theor. Biol. 1966, 10, 370–383. [Google Scholar] [CrossRef] [Scilit] [PubMed]
  46. Dinno, A. R Package, Version 1.3.6; Dunn.Test: Dunn’s Test of Multiple Comparisons Using Rank Sums; 2024. Available online: https://CRAN.R-project.org/package=dunn.test (accessed on 30 May 2026).
  47. Mangiafico, S.S. R Package; Version 2.5.2; Rcompanion: Functions to Support Extension Education Program Evaluation; Rutgers Cooperative Extension: New Brunswick, NJ, USA, 2024; Available online: https://CRAN.R-project.org/package=rcompanion (accessed on 30 May 2026).
  48. Oksanen, J.; Simpson, G.L.; Blanchet, F.G.; Kindt, R.; Legendre, P.; Minchin, P.R.; O’Hara, R.B.; Solymos, P.; Stevens, M.H.H.; Szoecs, E.; et al. R Package, Version 2.6-4; Vegan: Community Ecology Package; 2022. Available online: https://CRAN.R-project.org/package=vegan (accessed on 30 May 2026).
  49. Husson, F.; Josse, J. Multiple Correspondence Analysis. In Visualization and Verbalization of Data; Blasius, J., Greenacre, M., Eds.; Chapman and Hall/CRC: Boca Raton, FL, USA, 2014; pp. 163–183. [Google Scholar]
  50. Bendhifi, M.; Baraket, G.; Zourgui, L.; Souid, S.; Salhi-Hannachi, A. Assessment of genetic diversity of Tunisian Barbary fig (Opuntia ficus-indica) cultivars by RAPD markers and morphological descriptors. Sci. Hortic. 2013, 158, 1–7. [Google Scholar] [CrossRef] [Scilit]
  51. Marhri, A.; Boumediene, M.; Tikent, A.; Melhaoui, R.; Jdaini, K.; Mihamou, A.; Serghini-Caid, H.; Elamrani, A.; Hano, C.; Abid, M.; et al. A Comparative Analysis of Morphological Characteristics between Endangered Local Prickly Pear and the Newly Introduced Dactylopius opuntiae-Resistant Species in Eastern Morocco. Scientifica 2024, 2024, 7939465. [Google Scholar] [CrossRef] [Scilit] [PubMed]
  52. Adli, B.; Boutekrabt, A.; Touati, M.; Bakria, T.; Touati, A.; Bezini, E. Phenotypic Diversity of Opuntia ficus-indica (L.) Mill. in the Algerian Steppe. S. Afr. J. Bot. 2017, 109, 66–74. [Google Scholar] [CrossRef] [Scilit]
  53. Erre, P.; Chessa, I. Discriminant analysis of morphological descriptors to differentiate the Opuntia genotypes. Acta Hortic. 2013, 995, 25–32. [Google Scholar] [CrossRef] [Scilit]
  54. Barbera, G.; Inglese, P.; La Mantia, T. Seed content and fruit characteristics in cactus pear (Opuntia ficus-indica Mill.). Sci. Hortic. 1994, 58, 161–165. [Google Scholar] [CrossRef] [Scilit]
  55. Liguori, G.; Inglese, P. Cactus pear (Opuntia ficus-indica (L.) Mill.) fruit production, postharvest handling and world market. Acta Hortic. 2015, 1067, 247–252. [Google Scholar] [CrossRef] [Scilit]
  56. Colunga-García Marín, P.; Eguiarte, L.E.; Piñero, D. Domestication and the origin of crop diversity. In Plant Evolution Under Domestication; Gepts, P., Ed.; Kluwer: Dordrecht, The Netherlands, 2002; pp. 81–116. [Google Scholar]
  57. Herms, D.A.; Mattson, W.J. The dilemma of plants: To grow or defend. Q. Rev. Biol. 1992, 67, 283–335. [Google Scholar] [CrossRef] [Scilit]
  58. Cipollini, D.; Walters, D.; Voelckel, C. Costs of resistance in plants: From theory to evidence. In Annual Plant Reviews Online; Roberts, J.A., Ed.; Wiley: Hoboken, NJ, USA, 2018; Volume 47, pp. 263–307. [Google Scholar] [CrossRef] [Scilit]
  59. López-Palacios, C.; Peña-Valdivia, C.B.; Reyes-Agüero, J.A.; Aguirre-Rivera, J.R.; Ramírez-Tobías, H. Physical characteristics of fruits and seeds of Opuntia sp. as evidence of changes through domestication in the Southern Mexican Plateau. Genet. Resour. Crop Evol. 2019, 66, 349–362. [Google Scholar] [CrossRef] [Scilit]
  60. Peña-Valdivia, C.B.; Luna-Cavazos, M.; Carranza-Sabas, J.A.; Reyes-Agüero, J.A.; Flores, A. Morphological characterization of Opuntia spp.: A multivariate analysis. J. Prof. Assoc. Cactus Dev. 2008, 10, 1–21. [Google Scholar]
  61. Adli, B.; Touati, M.; Yabrir, B.; Bakria, T.; Bezini, E.; Boutekrabt, A. Morphological characterization of some naturalized accessions of Opuntia ficus-indica (L.) Mill. in the Algerian steppe regions. S. Afr. J. Bot. 2019, 124, 211–217. [Google Scholar] [CrossRef] [Scilit]
  62. Acharya, P.; Biradar, C.; Louhaichi, M.; Ghosh, S.; Hassan, S.; Moyo, H.; Sarker, A. Finding a suitable niche for cultivating cactus pear (Opuntia ficus-indica) as an integrated crop in resilient dryland agroecosystems of India. Sustainability 2019, 11, 5897. [Google Scholar] [CrossRef] [Scilit]
  63. Díaz-Delgado, G.L.; Rodríguez-Rodríguez, E.M.; Ríos, D.; Cano, M.P.; Lobo, M.G. Morphological characterization of Opuntia accessions from Tenerife (Canary Islands, Spain) using UPOV descriptors. Horticulturae 2024, 10, 662. [Google Scholar] [CrossRef] [Scilit]
  64. Gallegos-Vázquez, C.; Barrientos-Priego, A.F.; Reyes-Agüero, J.A.; Núñez-Colín, C.A.; Mondragón-Jacobo, C. Clusters of commercial varieties of cactus pear and xoconostle using UPOV morphological descriptors. J. Prof. Assoc. Cactus Dev. 2011, 13, 10–22. [Google Scholar]
  65. Liu, X.; Xing, Y.; Liu, G.; Bao, D.; Hu, W.; Bi, H.; Wang, M. Extraction, purification, structural features, biological activities, and applications of polysaccharides from Opuntia ficus-indica (L.) Mill. (cactus): A review. Front. Pharmacol. 2025, 16, 1566000. [Google Scholar] [CrossRef] [Scilit] [PubMed]
  66. Sánchez-González, N.; Jaime-Fonseca, M.R.; San Martín-Martínez, E.; Zepeda, L.G. Extraction, stability, and separation of betalains from Opuntia joconostle cv. using response surface methodology. J. Agric. Food Chem. 2013, 61, 11995–12004. [Google Scholar] [CrossRef] [Scilit] [PubMed]
  67. García-Cruz, L.; Valle-Guadarrama, S.; Salinas-Moreno, Y.; Jonapá-Hernández, A. Postharvest quality and quantification of betalains, phenolic compounds and antioxidant activity in fruits of three cultivars of prickly pear (Opuntia ficus-indica L. Mill). J. Hortic. Sci. 2021, 16, 91–102. [Google Scholar]
  68. Moussa-Ayoub, T.E.; Abd El-Hady, E.S.A.; Omran, H.T.; El-Samahy, S.K.; Kroh, L.W.; Rohn, S. Influence of cultivar and origin on the flavonol profile of fruits and cladodes from cactus Opuntia ficus-indica. Food Res. Int. 2014, 64, 864–872. [Google Scholar] [CrossRef] [Scilit] [PubMed]
  69. Castellanos-Santiago, E.; Yahia, E.M. Identification and quantification of betalains from the fruits of 10 Mexican prickly pear cultivars by high-performance liquid chromatography and electrospray ionization mass spectrometry. J. Agric. Food Chem. 2008, 56, 5758–5764. [Google Scholar] [CrossRef] [Scilit] [PubMed]
  70. FAO. The Second Report on the State of the World’s Plant Genetic Resources for Food and Agriculture; FAO: Rome, Italy, 2010; pp. 1–399. [Google Scholar]
  71. Dev, R.; Mangalassery, S.; Dayal, D.; Louhaichi, M.; Hassan, S. Genetic variability, characters association and principal component study for morphological and fodder quality of Opuntia and Nopalea sp. in India. Genet. Resour. Crop Evol. 2024, 71, 2297–2310. [Google Scholar] [CrossRef] [Scilit]
  72. Flores-Hernández, B.K.; Arévalo-Galarza, M.L.; Livera-Muñoz, M.; Peña-Valdivia, C.; Martínez-Hernández, A.; Calderón-Zavala, G.; Valdovinos-Ponce, G. Postharvest quality of parthenocarpic and pollinated cactus pear [Opuntia ficus-indica L. (Mill)] fruits. Foods 2025, 14, 2546. [Google Scholar] [CrossRef] [Scilit] [PubMed]
  73. Issami, W.; Abdellaoui, R.; Mahmoudi, M.; Bakhshandeh, E.; Abdessamad, A.; Zougari, B.; El Aloui, M.; Laamouri, A.; Ammari, Y. Modeling phenological stages and ecotype variability of Opuntia ficus-indica in semi-Arid and Arid Tunisia: Insights from a three-year study. Euro-Mediterr. J. Environ. Integr. 2025, 10, 3927–3944. [Google Scholar] [CrossRef] [Scilit]
  74. Jorge, A.O.S.; Costa, A.S.G.; Oliveira, M.B.P.P. Adapting to climate change with Opuntia. Plants 2023, 12, 2907. [Google Scholar] [CrossRef] [Scilit] [PubMed]
  75. Jorge, A.O.S.; Costa, A.S.G.; Ferreira, D.M.; Oliveira, M.B.P.P. Seasonal variation in nutritional and chemical profiles of wild Opuntia ficus-indica fruits. Plants 2025, 14, 409. [Google Scholar] [CrossRef] [Scilit] [PubMed]
  76. Abdallah, D.; Ben Mustapha, S.; Salhi Hannachi, A.; Baraket, G. Conservation Challenges, Utilization, and Improvement Prospects of Prickly Pear (Opuntia ficus-indica L. Mill). In Breeding and Biotechnology of Grass and Bast Fiber Crops; Salem, K.F.M., Al-Khayri, J.M., Jain, S.M., Eds.; Springer: Cham, Switzerland, 2025; pp. 705–719. [Google Scholar] [CrossRef] [Scilit]
  77. Modise, T.J.; Maleka, M.F.; Fouché, H.; Coetzer, G.M. Genetic diversity and differentiation of South African cactus pear cultivars (Opuntia spp.) based on simple sequence repeat (SSR) markers. Genet. Resour. Crop Evol. 2024, 71, 373–384. [Google Scholar] [CrossRef] [Scilit]
  78. Reis, C.M.G.; Raimundo, J.; Ribeiro, M.M. Assessment of genetic diversity in Opuntia spp. Portuguese populations using SSR molecular markers. Agronomy 2018, 8, 55. [Google Scholar] [CrossRef] [Scilit]
  79. Peña-Valdivia, B.C.; Arroyo-Peña, V.B.; García-Nava, R.; Morales, J.L.S. Wild and domesticated Opuntia as a model for evaluating abiotic stress in the physiology and biochemistry of succulent plants. Horticulturae 2024, 12, 471. [Google Scholar] [CrossRef] [Scilit]
  80. Lahbouki, S.; Ech-chatir, L.; Er-Raki, S.; Outzourhit, A.; Meddich, A. Improving drought tolerance of Opuntia ficus-indica under field using subsurface water retention technology: Changes in physiological and biochemical parameters. Can. J. Soil Sci. 2022, 102, 888–898. [Google Scholar] [CrossRef] [Scilit]
  81. Parralejo-Sanz, S.; Antunes-Ricardo, M.; Lobo, M.G.; Requena, T.; Cano, M.P. Assessment of the immunomodulatory potential of betalain- and phenolic-rich extracts from Opuntia cactus fruits. Food Biosci. 2025, 65, 106093. [Google Scholar] [CrossRef] [Scilit]
  82. Konzen, E.R.; Bajay, M.M.; Berny Mier y Teran, J.C.; Siqueira, M.V.B.M. Editorial: Genetic resources and conservation strategies for neotropical plant biodiversity. Front. Plant Sci. 2025, 16, 1629546. [Google Scholar] [CrossRef] [Scilit] [PubMed]
  83. Pessoa, R.M.S.; Rego, M.M.; Pessoa, A.M.S.; Batista, F.R.C.; Araújo, J.S.; Rego, E.R. Inter- and intraspecific genetic diversity and selection of parents in Opuntia spp. Genet. Resour. Crop Evol. 2025, 72, 7993–8008. [Google Scholar] [CrossRef] [Scilit]
  84. Tahiri, A.; Ait Aabd, N.; Qessaoui, R.; Mimouni, A.; Bouharroud, R. Genetic Diversity and Breeding of Cactus (Opuntia spp.). In Breeding of Ornamental Crops: Potted Plants and Shrubs; Al-Khayri, J.M., Jain, S.M., Johnson, D.V., Eds.; Springer Nature: Cham, Switzerland, 2025; pp. 153–193. [Google Scholar] [CrossRef] [Scilit]
Figure 1. Geographic distribution of the 55 Opuntia ficus-indica accessions collected in the northern inter-Andean valleys of Ecuador. Red circles indicate sampling locations. The background colors distinguish the administrative boundaries of the provinces (Imbabura, Carchi, and Pichincha), while gray areas represent neighboring provinces. The inset map shows the location of the study area within Ecuador.
Ijpb 17 00063 g001
Figure 2. Heatmap of Pearson correlation coefficients among the 15 quantitative morphological variables evaluated in Opuntia ficus-indica accessions. Color scale indicates correlation strength and direction, ranging from −1 (red) to +1 (green).
Ijpb 17 00063 g002
Figure 3. Principal component analysis (PCA) biplot of Opuntia ficus-indica accessions based on quantitative morphological descriptors. Note: PC1 and PC2 explain 31.3% and 14.3% of the total variance, respectively. Descriptor abbreviations (D1–D20) are defined in Table 1.
Ijpb 17 00063 g003
Figure 4. Multiple Correspondence Analysis (MCA) of Opuntia ficus-indica accessions based on qualitative morphological descriptors. Note: The biplot displays the distribution of categories from five qualitative descriptors—cladode color, fruit shape, peel color, pulp color, and petal color—in the space defined by the first two MCA dimensions (Dim 1 = 4.19% and Dim 2 = 3.99% of total explained inertia; cumulative inertia = 8.19%). Each symbol represents a category of the variable indicated in the legend. Proximity between categories in the biplot indicates frequent phenotypic association among them, whereas categories distant from the origin correspond to rare or singular qualitative profiles. Colored numbers correspond to the accession identification code, indicating the specific accessions with the greatest contribution to total inertia and representing the most differentiated morphological profiles within the collection.
Ijpb 17 00063 g004
Figure 5. Ward hierarchical clustering based on Gower distances for morphological data of Opuntia ficus-indica accessions. Note: Colors indicate the three clusters (G1 = green, G2 = blue, G3 = red) obtained at the selected cut-off level of the dendrogram. Branch length on the x-axis represents the degree of dissimilarity, with shorter branches indicating higher morphological similarity among accessions.
Ijpb 17 00063 g005
Figure 6. External and internal morphology of fruits from Opuntia ficus-indica accessions belonging to Group 1. Note: Exterior and interior views (cross-section) of fruits from the eight accessions comprising Group 1 (46, 07, 36, 11, 32, 22, 25, and 05) are presented. A pen included in each image serves as a scale reference.
Ijpb 17 00063 g006
Figure 7. External and internal morphology of fruits from Opuntia ficus-indica accessions belonging to Group 2. Note: Exterior and interior views (cross-section) of fruits from the 26 accessions comprising Group 2 (28, 40, 37, 33, 12, 29, 26, 24, 21, 19, 41, 20, 54, 35, 30, 13, 38, 44, 06, 04, 47, 10, 49, 43, 03, and 02) are presented, characterized by high variability in pulp coloration (ranging from yellowish-green to red-purple hues) and peel color across a broad chromatic spectrum. This group exhibited the highest 100-seed weight (1.50 ± 0.44 g) and intermediate-sized fruits (mean weight: 74.48 ± 20.99 g), with predominantly oval and rectangular shapes. A pen included in each image serves as a scale reference.
Ijpb 17 00063 g007aIjpb 17 00063 g007b
Figure 8. External and internal morphology of fruits from Opuntia ficus-indica accessions belonging to Group 3. Note: Exterior and interior views (cross-section) of fruits from the 21 accessions comprising Group 3 (18, 17, 09, 08, 52, 45, 31, 27, 16, 14, 39, 42, 34, 23, 15, 53, 51, 55, 50, 48, and 01) are presented, characterized by a predominantly green skin with orange patches upon ripening, and pulp ranging from orange to cream tones, contrasting markedly with Groups 1 and 2. This group yielded the largest fruits in the collection (mean weight: 113.23 ± 29.97 g), the highest seed production per fruit (312.00 ± 122.12), and the shortest spine length (1.28 ± 0.67 cm). A pen included in each image serves as a scale reference.
Ijpb 17 00063 g008
Figure 9. Variability of morphological and chromatic qualitative characters across three groups (G1, G2, and G3) of prickly pear (Opuntia ficus-indica) accessions. Note: Frequency distribution of morphological and chromatic qualitative characters across three groups of prickly pear (Opuntia ficus-indica) accessions (G1, G2, and G3). The characters assessed include cladode color, fruit shape, fruit peel color, pulp color, and petal color. Fruit shape was classified into five categories: 1 = spherical, 2 = elliptical, 3 = lanceolate, 4 = oval, and 5 = rectangular. Colors were determined according to the Royal Horticultural Society (RHS) color chart with their corresponding RGB codes.
Ijpb 17 00063 g009
Table 1. Morphological descriptors used for the characterization of Opuntia ficus-indica.
DescriptorsUnitType
D1Cladode colorMulti-state, qualitative (logical sequence)
D2Cladode lengthcmMulti-state, quantitative
D3Cladode diametercmMulti-state, quantitative
D4Longest spine length (cladode)cmMulti-state, quantitative
D5Shortest spine length (cladode)cmMulti-state, quantitative
D6Fruit weightgMulti-state, quantitative
D7Fruit shapeMulti-state, qualitative (no logical sequence)
D8Fruit lengthcmMulti-state, quantitative
D9Fruit diametercmMulti-state, quantitative
D10Peel color (fruit)Multi-state, qualitative (logical sequence)
D11Exocarp thicknessmmMulti-state, quantitative
D12Floral scar depthcmMulti-state, quantitative
D13Floral scar diametercmMulti-state, quantitative
D14Pulp colorMulti-state, qualitative (logical sequence)
D15100-seed weightgMulti-state, quantitative
D16Seed lengthmmMulti-state, quantitative
D17Seed diametermmMulti-state, quantitative
D18Number of seeds per fruitDiscontinuous quantitative
D19Petal colorMulti-state, qualitative (logical sequence)
D20Flower lengthcmMulti-state, quantitative
Note: —: not applicable (qualitative trait). Exocarp thickness and seed dimensions are expressed in mm given the reduced size of these structures.
Table 2. Summary statistics of morphological descriptors evaluated in 55 Opuntia ficus-indica accessions.
Descriptors MeanSDCVMinMax
Cladode length35.595.7916.262047
Cladode diameter19.963.7218.6512.329.4
Longest spine length (cladode)2.21.0447.180.154.6
Shortest spine length (cladode)0.520.2547.750.141.24
Fruit weight87.1733.1137.9826.33166
Fruit length6.791.4721.634.1811.28
Fruit diameter5.070.8115.883.46.67
Exocarp thickness (fruit)5.861.5225.983.411.1
Floral scar depth0.530.3159.310.031.49
Floral scar diameter2.570.4216.171.683.77
Weight of 100 seeds1.330.4735.10.063.23
Seed length2.941.4348.640.35.24
Seed diameter3.631.7548.360.46.28
Number of seeds per fruit212.96127.2959.7743.67678
Flower length8.121.4617.91611.2
Table 3. Pearson correlations among quantitative morphological descriptors of Opuntia ficus-indica with correction for multiple comparisons (n = 55 accessions).
Variable PairrUncorrected pp Bonferronip BH–FDRSig.
Seed length vs. Seed diameter+0.9801.26 × 10−381.32 × 10−361.32 × 10−36***
Fruit weight vs. Fruit diameter+0.8071.00 × 10−131.05 × 10−115.25 × 10⁻¹²***
Fruit weight vs. Fruit length+0.6584.84 × 10−85.08 × 10−61.69 × 10−6***
Cladode length vs. Longest spine length−0.6381.63 × 10−71.72 × 10−54.29 × 10−6***
Longest spine length vs. Fruit weight−0.5627.87 × 10−68.26 × 10−41.18 × 10−4***
Longest spine length vs. Flower length−0.5471.58 × 10−51.66 × 10−32.07 × 10−4***
Longest spine length vs. Fruit length−0.5322.95 × 10−53.09 × 10−33.44 × 10−4***
100-seed weight vs. No. of seeds per fruit−0.4921.35 × 10−41.42 × 10−21.29 × 10−3*
100-seed weight vs. Flower length−0.3913.14 × 10−30.329 (ns)1.50 × 10⁻²
*** p < 0.001; * p < 0.05; ns = not significant; † BH = significant under BH–FDR only. Bonferroni correction: α = 0.05/105 = 0.000476. m = 105 comparisons. Note: r = Pearson correlation coefficient. p_Bonf = p-value adjusted by the Bonferroni method (α* = 0.05/105 = 0.000476); p_BH = p-value adjusted by the Benjamini–Hochberg procedure (false discovery rate, FDR; α = 0.05). A total of 105 pairwise comparisons were computed from 15 quantitative variables. Of the 34 nominally significant correlations (uncorrected p < 0.05), 15 remained significant after Bonferroni correction and 27 after BH–FDR correction.
Table 4. Eigenvalues, explained variance, and variable loadings for the first four principal components of the PCA of quantitative morphological descriptors of Opuntia ficus-indica (n = 55 accessions, 10 selected variables).
Descriptors PC1PC2PC3PC4
Cladode length−0.37850.23730.0211−0.1544
Cladode diameter−0.09300.5662−0.34210.1424
Longest spine length0.4776−0.04920.15180.2531
Shortest spine length0.22250.33570.25780.5959
Fruit weight0.39040.00410.41150.2581
Exocarp thickness−0.2652−0.12920.6022−0.0079
Floral scar depth0.14840.62220.2000−0.1061
100-seed weight0.3457−0.00950.4289−0.1741
Seed diameter0.0775−0.3223−0.18630.5394
Number of seeds/fruit0.44740.01220.04830.3708
Eigenvalue (λ)3.18881.45671.23031.0179
Variance explained (%)31.3114.3012.089.99
Cumulative variance (%)31.3145.6157.6967.68
Note: Bold values indicate variables with the greatest contribution to each component (|loading| ≥ 0.40). Variable selection criteria are described in full in Section 2.3.1. Briefly, five variables were excluded from the original set of 15: fruit length and seed length (collinearity with fruit weight and seed diameter, respectively; |r| ≥ 0.70); fruit diameter (collinearity with fruit weight; r = 0.807); and flower length and floral scar diameter (low individual sampling adequacy, MSA < 0.40, and limited discriminant contribution). For PC1, the explained variance (31.31%) and cumulative variance (31.31%) are identical by definition because cumulative variance represents the cumulative sum of explained variance, and no preceding component exists for the first principal component. PC = principal component; λ = eigenvalue.
Table 5. Independence tests—5 qualitative descriptors vs. groups G1/G2/G3.
VariableRHS Cat.TestStatistic (df)p-ValueSig.Cramér’s VEffect Size
Cladode color15KWH(2) = 2.8770.237ns0.547Large †
Fruit shape5χ2χ2(8) = 24.4010.002**0.471Medium-large
Peel color30KWH(2) = 38.551<0.001***0.822Large
Pulp color23KWH(2) = 38.908<0.001***0.805Large
Petal color27KWH(2) = 0.3190.853ns0.764Large †
KW = Kruskal–Wallis test; χ2 = Pearson’s chi-square test (see Section 2.3.8 for test selection criteria and Cramér’s V interpretation). df = degrees of freedom. Sig.: *** p < 0.001; ** p < 0.01; ns = not significant (α = 0.05). † A large V with a non-significant p-value indicates high intragroup chromatic heterogeneity rather than intergroup differentiation—consistent with the MCA biplot, where these descriptors did not contribute to axial separation. Confirmatory correction with hue-collapsed categories (Light: RHS 1–7; Intermediate: RHS 8–15; Intense: RHS 16–30) corroborated these results: peel color χ2(4) = 46.47, p < 0.001; pulp color χ2(4) = 44.15, p < 0.001; cladode color χ2(2) = 4.36, p = 0.113; petal color χ2(4) = 1.82, p = 0.769.
Table 6. Internal validation indices of Ward–Gower hierarchical clustering for k = 2–7 groups (n = 55 Opuntia ficus-indica accessions).
kSilhouette ↑Calinski–Harabász ↑Fusion Gap (Δ) Toward k + 1Observation
20.27215.270.016Max. Silhouette and CH
3 †0.1699.950.106Largest Δ at k = 3→k + 1
40.1479.320.033Sharp drop from k = 3
50.1337.190.020
60.1476.200.059
70.1455.63
† Silhouette by group (k = 3): G1 = 0.200; G2 = 0.141; G3 = 0.193; accessions with s < 0: 2/55 (3.6%). Dendrogram cophenetic coefficient: r = 0.63 (p < 0.001). The fusion gap (Δ) indicates the difference in Ward distance between the fusion generating k groups and the one that would generate k + 1; larger values indicate stronger structural support for that cut. The upward arrows (↑) next to “Silhouette” and “Calinski–Harabász” indicate that higher values of these indices reflect better cluster quality (i.e., greater internal cohesion and separation between groups). References: Mojena (1977) [34]; Rousseeuw (1987) [35]; Calinski & Harabász (1974) [36]; Rohlf (1970) [33].
Table 7. Accession number and collection site of the 55 Opuntia ficus-indica accessions classified into three morphotypic groups by Ward–Gower hierarchical clustering.
GROUP 1GROUP 2GROUP 3
AccessionCantonProvinceAccessionCantonProvinceAccessionCantonProvince
46BolívarCarchi28IbarraImbabura18IbarraImbabura
7BolívarCarchi40AtuntaquiImbabura17IbarraImbabura
36MiraCarchi37IbarraImbabura9BolívarCarchi
11BolívarCarchi33UrcuquíImbabura8BolívarCarchi
32IbarraImbabura12BolívarCarchi52QuitoPichincha
22MiraCarchi29UrcuquíImbabura45BolívarCarchi
25BolívarCarchi26MiraCarchi31IbarraImbabura
5BolívarCarchi24MiraCarchi27MiraCarchi
21MiraCarchi16PimampiroImbabura
19IbarraImbabura14PimampiroImbabura
41UrcuquíImbabura39MiraCarchi
20MiraCarchi42UrcuquíImbabura
54AtuntaquiImbabura34UrcuquíImbabura
35UrcuquíImbabura23MiraCarchi
30IbarraImbabura15PimampiroImbabura
13PimampiroImbabura53QuitoPichincha
44IbarraImbabura51QuitoPichincha
38BolívarCarchi55IbarraImbabura
6BolívarCarchi50QuitoPichincha
4BolívarCarchi48CayambePichincha
47CayambePichincha1BolívarCarchi
10BolívarCarchi
49QuitoPichincha
43IbarraImbabura
3BolívarCarchi
2BolívarCarchi
Table 8. Kruskal–Wallis test results for quantitative morphological variables among the three morphotypic groups of Opuntia ficus-indica.
VariableG1 (n = 8)
Carchi·Imbabura
G2 (n = 26) Imbabura·
Carchi·Pichincha
G3 (n = 21) Imbabura·
Carchi·Pichincha
H(2)p-ValueSig.
CLADODE
Cladode length (cm)33.89 ± 4.13 b32.98 ± 5.30 b39.48 ± 4.84 a17.060<0.001***
Cladode diameter (cm)19.34 ± 3.09 a19.87 ± 4.07 a20.31 ± 3.62 a0.4690.791ns
Longest spine length (cm)2.46 ± 1.00 a2.88 ± 0.70 a1.28 ± 0.67 b28.543<0.001***
FRUIT
Fruit weight (g)59.97 ± 28.88 b74.48 ± 20.99 b113.23 ± 29.97 a23.063<0.001***
Fruit length (cm)6.25 ± 1.80 b6.25 ± 1.00 b7.67 ± 1.46 a13.3310.0013**
Fruit diameter (cm)4.38 ± 0.83 b4.90 ± 0.65 b5.55 ± 0.71 a13.4300.0012**
Exocarp thickness (mm)5.80 ± 1.21 a5.64 ± 1.38 a6.14 ± 1.79 a0.9470.623ns
SEED
100-seed weight (g)1.44 ± 0.51 ab1.50 ± 0.44 a1.08 ± 0.38 b13.0610.0015**
Number of seeds per fruit138.26 ± 113.02 b155.94 ± 78.00 b312.00 ± 122.12 a24.097<0.001***
FLOWER
Flower length (cm)8.01 ± 0.89 ab7.56 ± 1.32 b8.87 ± 1.50 a9.4060.0091**
Note: Values are expressed as mean ± standard deviation. Different superscript letters within a row indicate significant differences between groups according to Dunn’s post hoc test with Bonferroni correction (α = 0.05), applied after Kruskal–Wallis (H, df = 2). Variables with no significant differences share the letter “a” across all groups. Significance levels: *** p < 0.001; ** p < 0.01; ns = not significant (p ≥ 0.05).
Table 9. Pairwise post hoc comparisons (Dunn’s test with Bonferroni correction) of quantitative morphological descriptors among the three Opuntia ficus-indica morphotypes identified by Ward–Gower hierarchical clustering (n = 55 accessions).
VariableG1 vs. G2G1 vs. G3G2 vs. G3
Cladode length1.000 ns0.027 *0.0002 ***
Cladode diameter1.000 ns1.000 ns1.000 ns
Longest spine length1.000 ns0.013 *<0.001 ***
Fruit weight1.000 ns0.0004 ***0.0001 ***
Fruit length1.000 ns0.031 *0.002 **
Fruit diameter0.525 ns0.003 **0.016 *
Exocarp thickness1.000 ns1.000 ns1.000 ns
Weight of 100 seeds1.000 ns0.083 ns0.001 **
Number of seeds/fruit1.000 ns0.0005 ***<0.001 ***
Flower length1.000 ns0.675 ns0.007 **
p-values adjusted with Bonferroni correction (n = 3 pairwise comparisons, effective α = 0.017 per pair). ns = not significant (p ≥ 0.05); * p < 0.05; ** p < 0.01; *** p < 0.001. p-values adjusted with Bonferroni correction (n = 3 pairwise comparisons, effective α = 0.017 per pair).
Table 10. Shannon-Weaver diversity index (H’) and Pielou’s evenness (J’) of qualitative morphological characters across the three Opuntia ficus-indica morphotypic groups identified by Ward–Gower hierarchical clustering (n = 55 accessions: G1 = 8, G2 = 26, G3 = 21).
VariableG1 (n = 8)G2 (n = 26)G3 (n = 21)
SH’J’SH’J’SH’J’
Cladode color61.670.93112.260.94101.990.86
Fruit shape30.900.8241.360.9841.260.91
Peel color71.910.9891.880.86182.850.98
Pulp color41.320.9581.740.84142.560.97
Petal color61.730.97182.810.97122.360.95
S = number of observed categories per group. H’ = Shannon-Weaver diversity index (H’ = −Σ pi ln pi). J’ = Pielou’s evenness (J’ = H’/ln S). Values in red = most diverse group per character; in blue = least diverse group. J’ values approaching 1.0 indicate uniform distribution across categories.
Disclaimer/Publisher’s Note: The statements, opinions and data contained in all publications are solely those of the individual author(s) and contributor(s) and not of MDPI and/or the editor(s). MDPI and/or the editor(s) disclaim responsibility for any injury to people or property resulting from any ideas, methods, instructions or products referred to in the content.